Zip Codes with the Highest Percentage of Immigrants from Eastern Europe in Crossville, TN
RELATED REPORTS & OPTIONS
Eastern Europe
Crossville
Compare Zip Codes
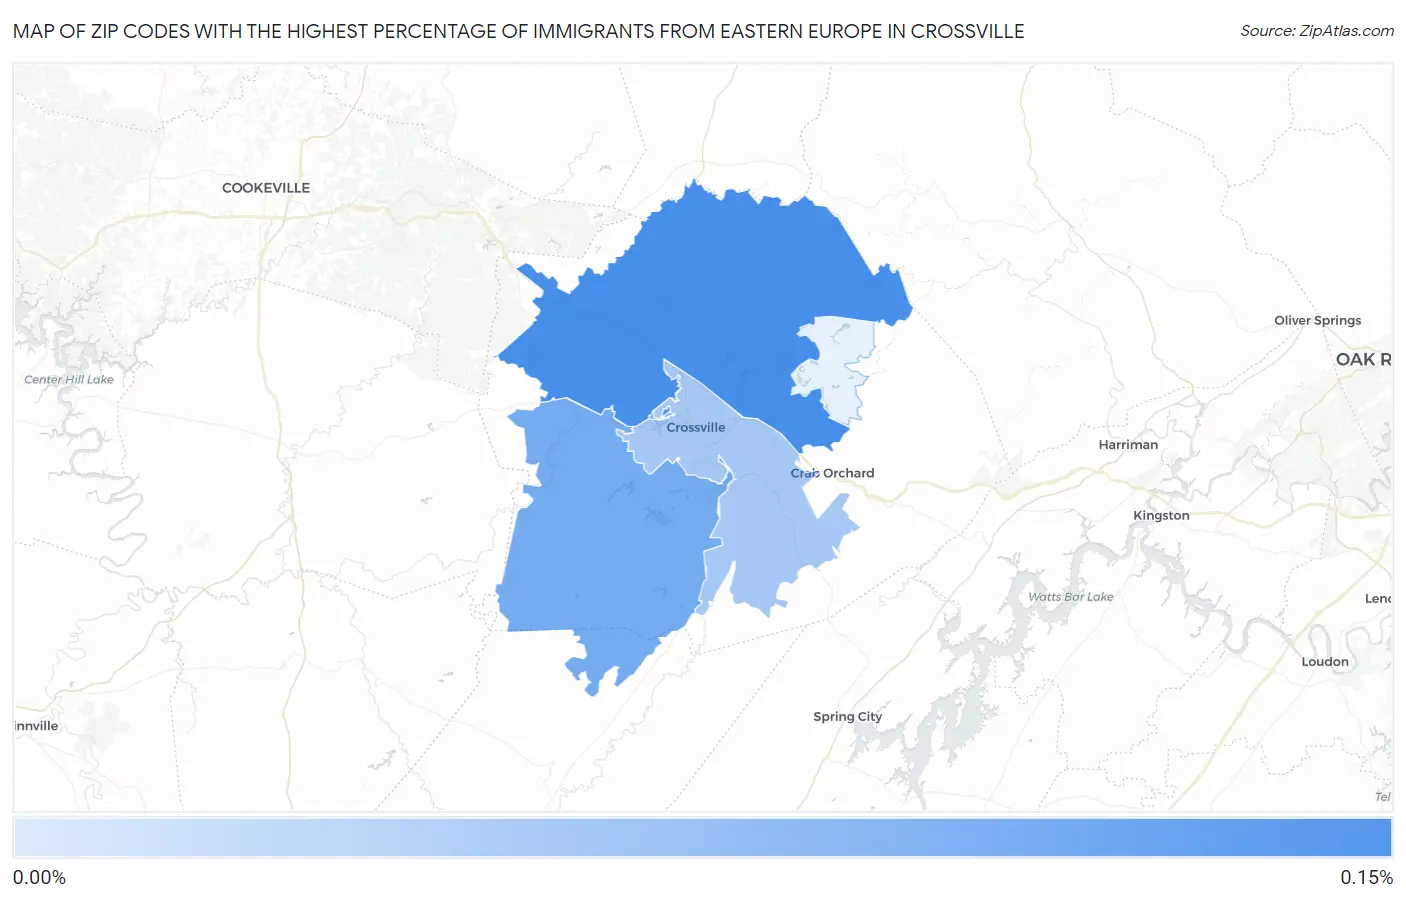
Map of Zip Codes with the Highest Percentage of Immigrants from Eastern Europe in Crossville
0.046%
0.13%
Zip Codes with the Highest Percentage of Immigrants from Eastern Europe in Crossville, TN
| Zip Code | Eastern Europe | vs State | vs National | |
| 1. | 38571 | 0.13% | 0.21%(-0.080)#139 | 0.67%(-0.541)#10,277 |
| 2. | 38572 | 0.087% | 0.21%(-0.120)#167 | 0.67%(-0.580)#11,139 |
| 3. | 38555 | 0.046% | 0.21%(-0.161)#186 | 0.67%(-0.621)#12,076 |
1
Common Questions
What are the Top 3 Zip Codes with the Highest Percentage of Immigrants from Eastern Europe in Crossville, TN?
Top 3 Zip Codes with the Highest Percentage of Immigrants from Eastern Europe in Crossville, TN are:
What zip code has the Highest Percentage of Immigrants from Eastern Europe in Crossville, TN?
38571 has the Highest Percentage of Immigrants from Eastern Europe in Crossville, TN with 0.13%.
What is the Percentage of Immigrants from Eastern Europe in Crossville, TN?
Percentage of Immigrants from Eastern Europe in Crossville is 0.12%.
What is the Percentage of Immigrants from Eastern Europe in Tennessee?
Percentage of Immigrants from Eastern Europe in Tennessee is 0.21%.
What is the Percentage of Immigrants from Eastern Europe in the United States?
Percentage of Immigrants from Eastern Europe in the United States is 0.67%.