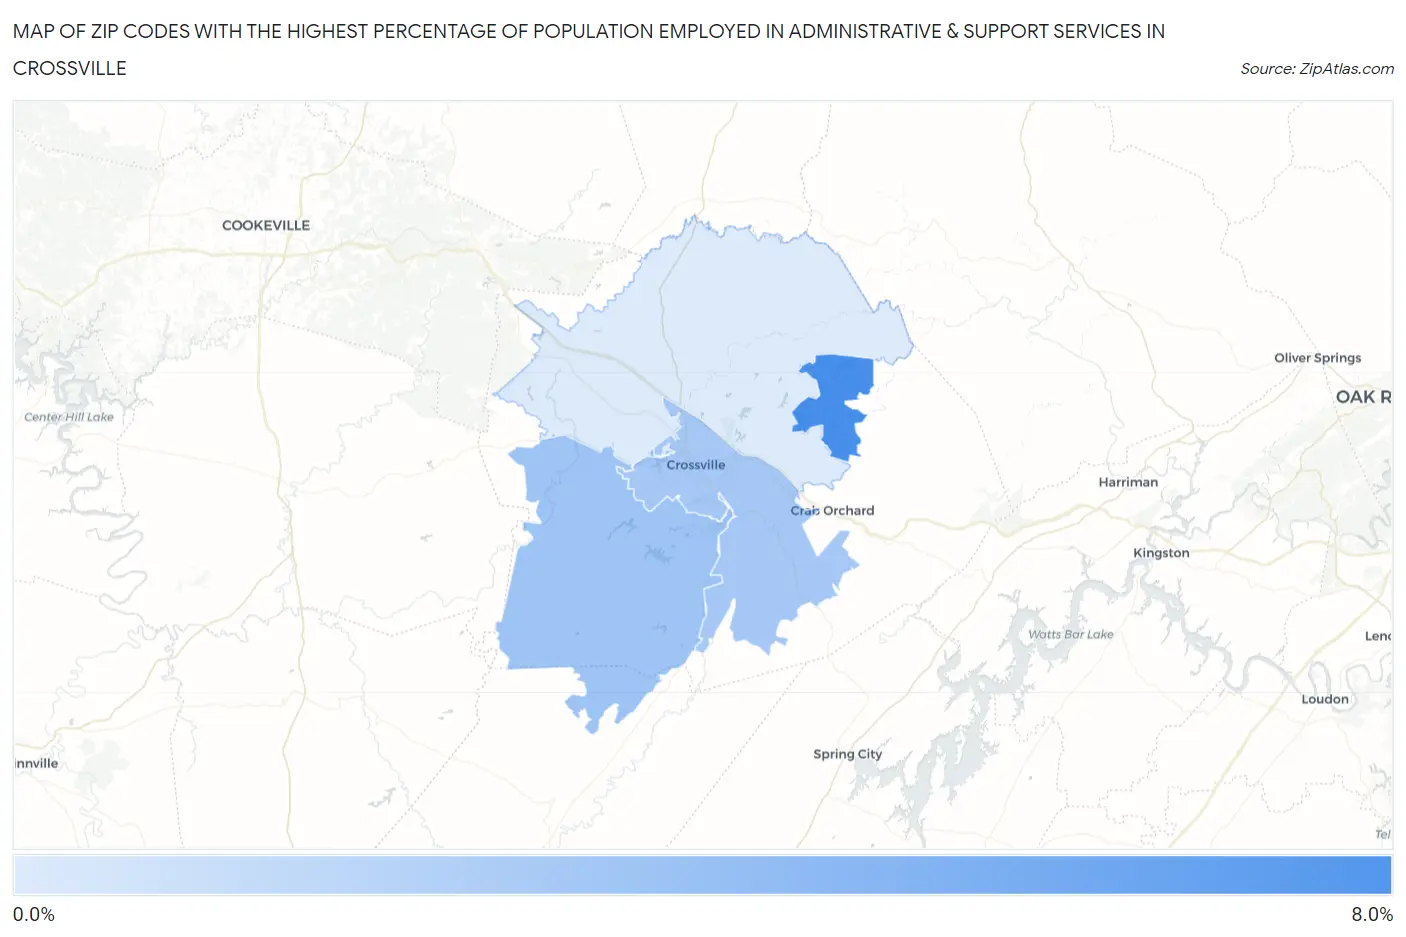
Zip Codes with the Highest Percentage of Population Employed in Administrative & Support Services in Crossville, TN
RELATED REPORTS & OPTIONS
Administrative & Support Services
Crossville
Compare Zip Codes
Map of Zip Codes with the Highest Percentage of Population Employed in Administrative & Support Services in Crossville
1.4%
7.3%
Zip Codes with the Highest Percentage of Population Employed in Administrative & Support Services in Crossville, TN
| Zip Code | % Employed | vs State | vs National | |
| 1. | 38558 | 7.3% | 4.4%(+2.91)#64 | 4.1%(+3.12)#2,915 |
| 2. | 38572 | 3.8% | 4.4%(-0.512)#242 | 4.1%(-0.309)#11,366 |
| 3. | 38555 | 3.5% | 4.4%(-0.837)#286 | 4.1%(-0.634)#12,877 |
| 4. | 38571 | 1.4% | 4.4%(-2.92)#470 | 4.1%(-2.72)#23,004 |
1
Common Questions
What are the Top 3 Zip Codes with the Highest Percentage of Population Employed in Administrative & Support Services in Crossville, TN?
Top 3 Zip Codes with the Highest Percentage of Population Employed in Administrative & Support Services in Crossville, TN are:
What zip code has the Highest Percentage of Population Employed in Administrative & Support Services in Crossville, TN?
38558 has the Highest Percentage of Population Employed in Administrative & Support Services in Crossville, TN with 7.3%.
What is the Percentage of Population Employed in Administrative & Support Services in Crossville, TN?
Percentage of Population Employed in Administrative & Support Services in Crossville is 4.8%.
What is the Percentage of Population Employed in Administrative & Support Services in Tennessee?
Percentage of Population Employed in Administrative & Support Services in Tennessee is 4.4%.
What is the Percentage of Population Employed in Administrative & Support Services in the United States?
Percentage of Population Employed in Administrative & Support Services in the United States is 4.1%.