Zip Codes with the Highest Percentage of Population Employed in Food Preparation & Serving in Cookeville, TN
RELATED REPORTS & OPTIONS
Food Preparation & Serving
Cookeville
Compare Zip Codes
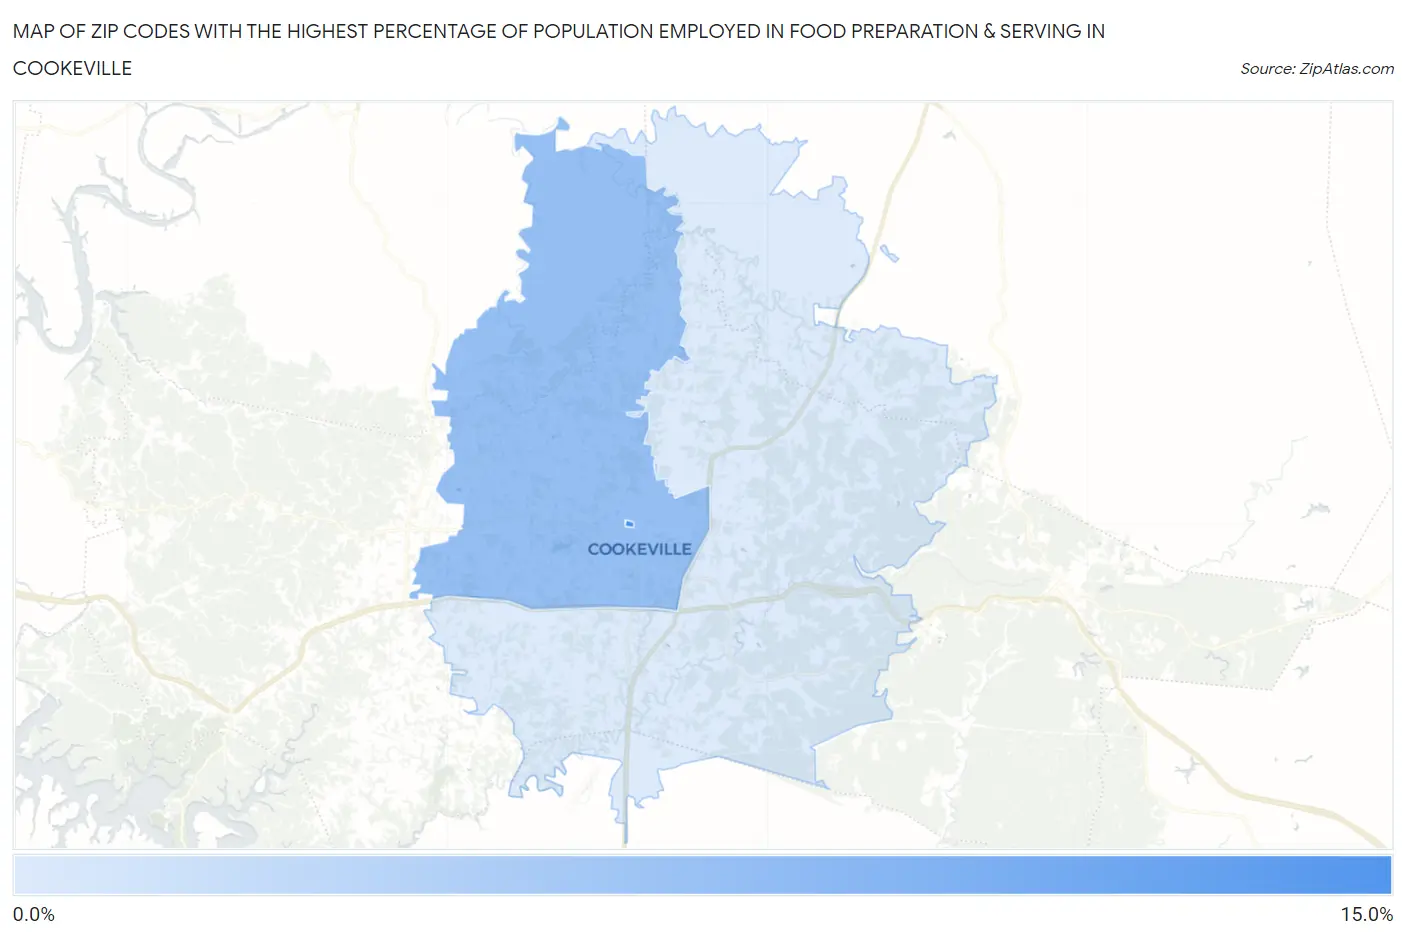
Map of Zip Codes with the Highest Percentage of Population Employed in Food Preparation & Serving in Cookeville
4.2%
14.0%
Zip Codes with the Highest Percentage of Population Employed in Food Preparation & Serving in Cookeville, TN
| Zip Code | % Employed | vs State | vs National | |
| 1. | 38505 | 14.0% | 5.4%(+8.59)#16 | 5.3%(+8.73)#1,157 |
| 2. | 38501 | 8.8% | 5.4%(+3.39)#68 | 5.3%(+3.52)#3,720 |
| 3. | 38506 | 4.2% | 5.4%(-1.23)#327 | 5.3%(-1.09)#16,339 |
1
Common Questions
What are the Top Zip Codes with the Highest Percentage of Population Employed in Food Preparation & Serving in Cookeville, TN?
Top Zip Codes with the Highest Percentage of Population Employed in Food Preparation & Serving in Cookeville, TN are:
What zip code has the Highest Percentage of Population Employed in Food Preparation & Serving in Cookeville, TN?
38505 has the Highest Percentage of Population Employed in Food Preparation & Serving in Cookeville, TN with 14.0%.
What is the Percentage of Population Employed in Food Preparation & Serving in Cookeville, TN?
Percentage of Population Employed in Food Preparation & Serving in Cookeville is 10.4%.
What is the Percentage of Population Employed in Food Preparation & Serving in Tennessee?
Percentage of Population Employed in Food Preparation & Serving in Tennessee is 5.4%.
What is the Percentage of Population Employed in Food Preparation & Serving in the United States?
Percentage of Population Employed in Food Preparation & Serving in the United States is 5.3%.