Zip Codes with the Highest Percentage of Population Employed in Life, Physical & Social Science in Cookeville, TN
RELATED REPORTS & OPTIONS
Life, Physical & Social Science
Cookeville
Compare Zip Codes
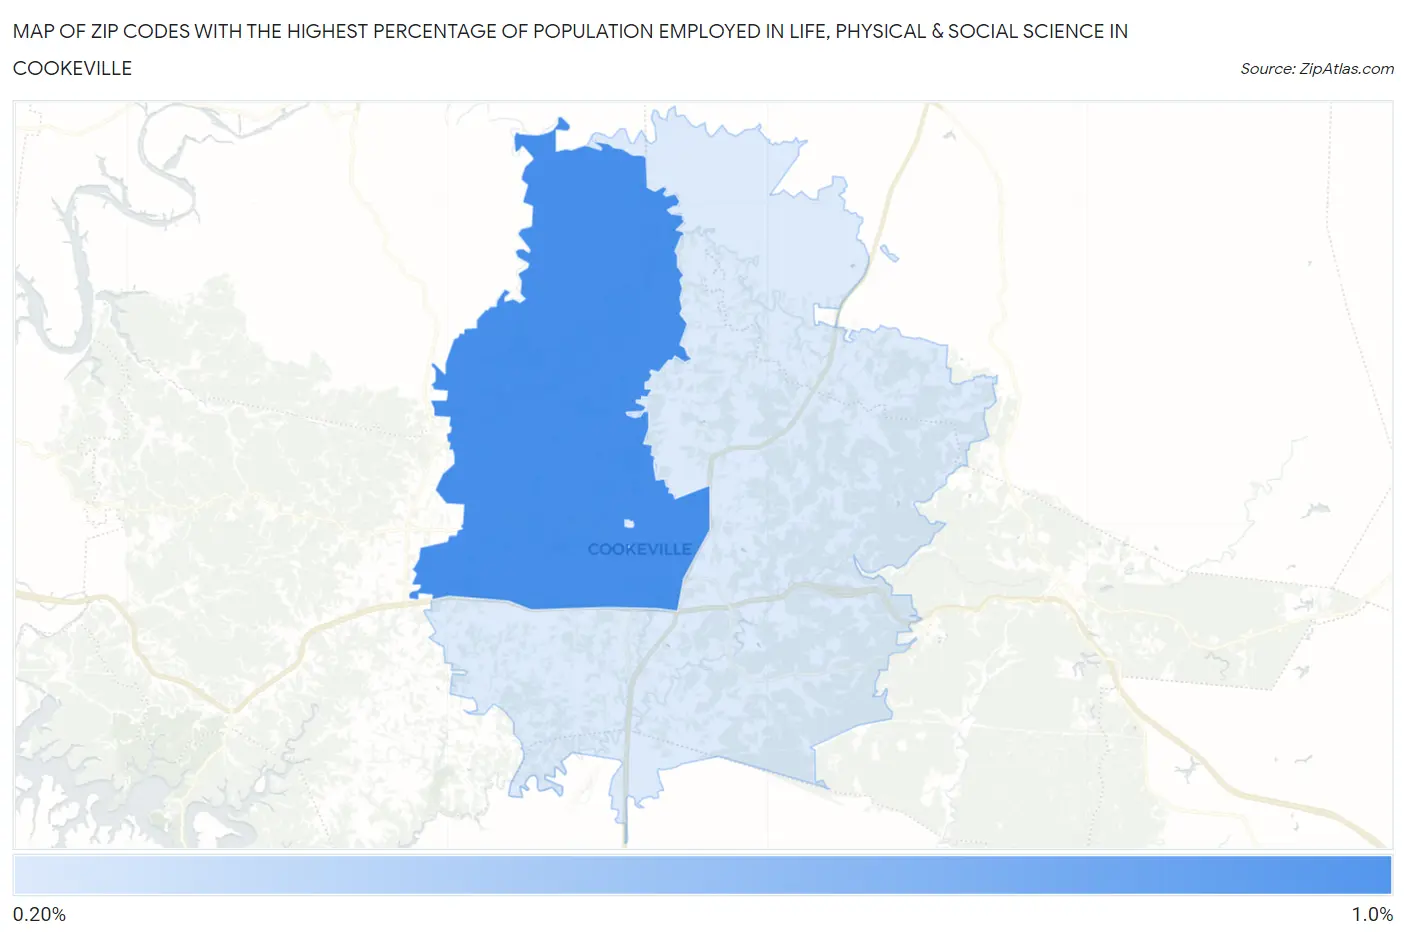
Map of Zip Codes with the Highest Percentage of Population Employed in Life, Physical & Social Science in Cookeville
0.30%
0.85%
Zip Codes with the Highest Percentage of Population Employed in Life, Physical & Social Science in Cookeville, TN
| Zip Code | % Employed | vs State | vs National | |
| 1. | 38501 | 0.85% | 0.83%(+0.017)#179 | 1.1%(-0.243)#10,494 |
| 2. | 38506 | 0.30% | 0.83%(-0.533)#302 | 1.1%(-0.792)#17,077 |
1
Common Questions
What are the Top Zip Codes with the Highest Percentage of Population Employed in Life, Physical & Social Science in Cookeville, TN?
Top Zip Codes with the Highest Percentage of Population Employed in Life, Physical & Social Science in Cookeville, TN are:
What zip code has the Highest Percentage of Population Employed in Life, Physical & Social Science in Cookeville, TN?
38501 has the Highest Percentage of Population Employed in Life, Physical & Social Science in Cookeville, TN with 0.85%.
What is the Percentage of Population Employed in Life, Physical & Social Science in Cookeville, TN?
Percentage of Population Employed in Life, Physical & Social Science in Cookeville is 0.63%.
What is the Percentage of Population Employed in Life, Physical & Social Science in Tennessee?
Percentage of Population Employed in Life, Physical & Social Science in Tennessee is 0.83%.
What is the Percentage of Population Employed in Life, Physical & Social Science in the United States?
Percentage of Population Employed in Life, Physical & Social Science in the United States is 1.1%.