Zip Codes with the Highest Percentage of Population with a Degree in Visual and Performing Arts in Cookeville, TN
RELATED REPORTS & OPTIONS
Visual and Performing Arts
Cookeville
Compare Zip Codes
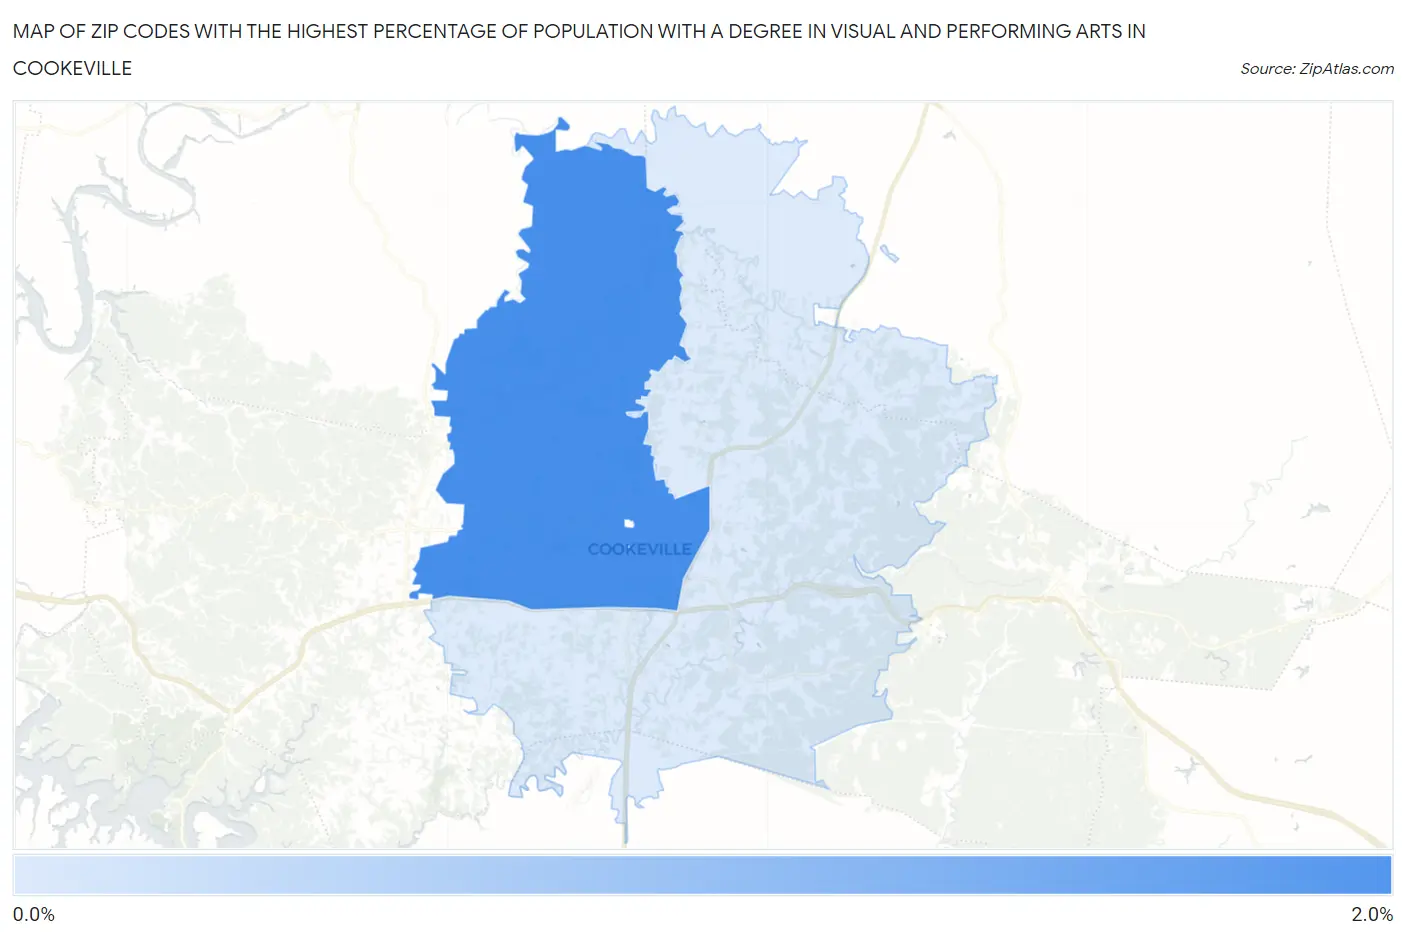
Map of Zip Codes with the Highest Percentage of Population with a Degree in Visual and Performing Arts in Cookeville
0.57%
1.9%
Zip Codes with the Highest Percentage of Population with a Degree in Visual and Performing Arts in Cookeville, TN
| Zip Code | % Graduates | vs State | vs National | |
| 1. | 38501 | 1.9% | 4.1%(-2.17)#305 | 4.3%(-2.36)#16,816 |
| 2. | 38506 | 0.57% | 4.1%(-3.49)#388 | 4.3%(-3.68)#20,621 |
1
Common Questions
What are the Top Zip Codes with the Highest Percentage of Population with a Degree in Visual and Performing Arts in Cookeville, TN?
Top Zip Codes with the Highest Percentage of Population with a Degree in Visual and Performing Arts in Cookeville, TN are:
What zip code has the Highest Percentage of Population with a Degree in Visual and Performing Arts in Cookeville, TN?
38501 has the Highest Percentage of Population with a Degree in Visual and Performing Arts in Cookeville, TN with 1.9%.
What is the Percentage of Population with a Degree in Visual and Performing Arts in Cookeville, TN?
Percentage of Population with a Degree in Visual and Performing Arts in Cookeville is 1.7%.
What is the Percentage of Population with a Degree in Visual and Performing Arts in Tennessee?
Percentage of Population with a Degree in Visual and Performing Arts in Tennessee is 4.1%.
What is the Percentage of Population with a Degree in Visual and Performing Arts in the United States?
Percentage of Population with a Degree in Visual and Performing Arts in the United States is 4.3%.