Zip Codes with the Highest Percentage of Population Employed in Architecture & Engineering in Cookeville, TN
RELATED REPORTS & OPTIONS
Architecture & Engineering
Cookeville
Compare Zip Codes
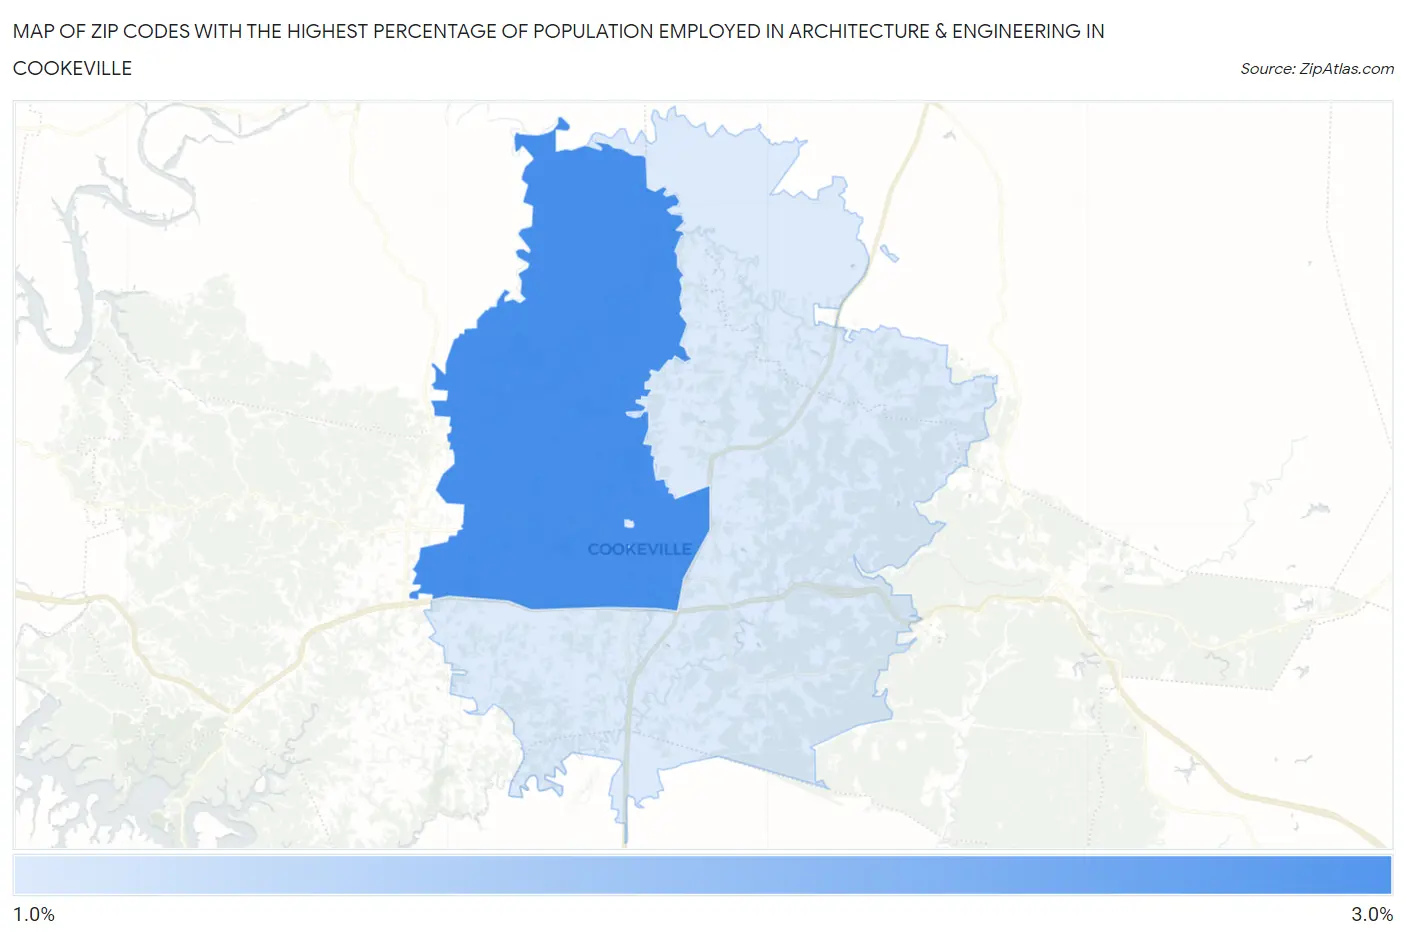
Map of Zip Codes with the Highest Percentage of Population Employed in Architecture & Engineering in Cookeville
1.7%
2.6%
Zip Codes with the Highest Percentage of Population Employed in Architecture & Engineering in Cookeville, TN
| Zip Code | % Employed | vs State | vs National | |
| 1. | 38501 | 2.6% | 1.7%(+0.939)#102 | 2.1%(+0.458)#6,547 |
| 2. | 38506 | 1.7% | 1.7%(+0.033)#214 | 2.1%(-0.448)#11,484 |
1
Common Questions
What are the Top Zip Codes with the Highest Percentage of Population Employed in Architecture & Engineering in Cookeville, TN?
Top Zip Codes with the Highest Percentage of Population Employed in Architecture & Engineering in Cookeville, TN are:
What zip code has the Highest Percentage of Population Employed in Architecture & Engineering in Cookeville, TN?
38501 has the Highest Percentage of Population Employed in Architecture & Engineering in Cookeville, TN with 2.6%.
What is the Percentage of Population Employed in Architecture & Engineering in Cookeville, TN?
Percentage of Population Employed in Architecture & Engineering in Cookeville is 2.1%.
What is the Percentage of Population Employed in Architecture & Engineering in Tennessee?
Percentage of Population Employed in Architecture & Engineering in Tennessee is 1.7%.
What is the Percentage of Population Employed in Architecture & Engineering in the United States?
Percentage of Population Employed in Architecture & Engineering in the United States is 2.1%.