Zip Codes with the Highest Percentage of Population Employed in Health Diagnosing & Treating in Cookeville, TN
RELATED REPORTS & OPTIONS
Health Diagnosing & Treating
Cookeville
Compare Zip Codes
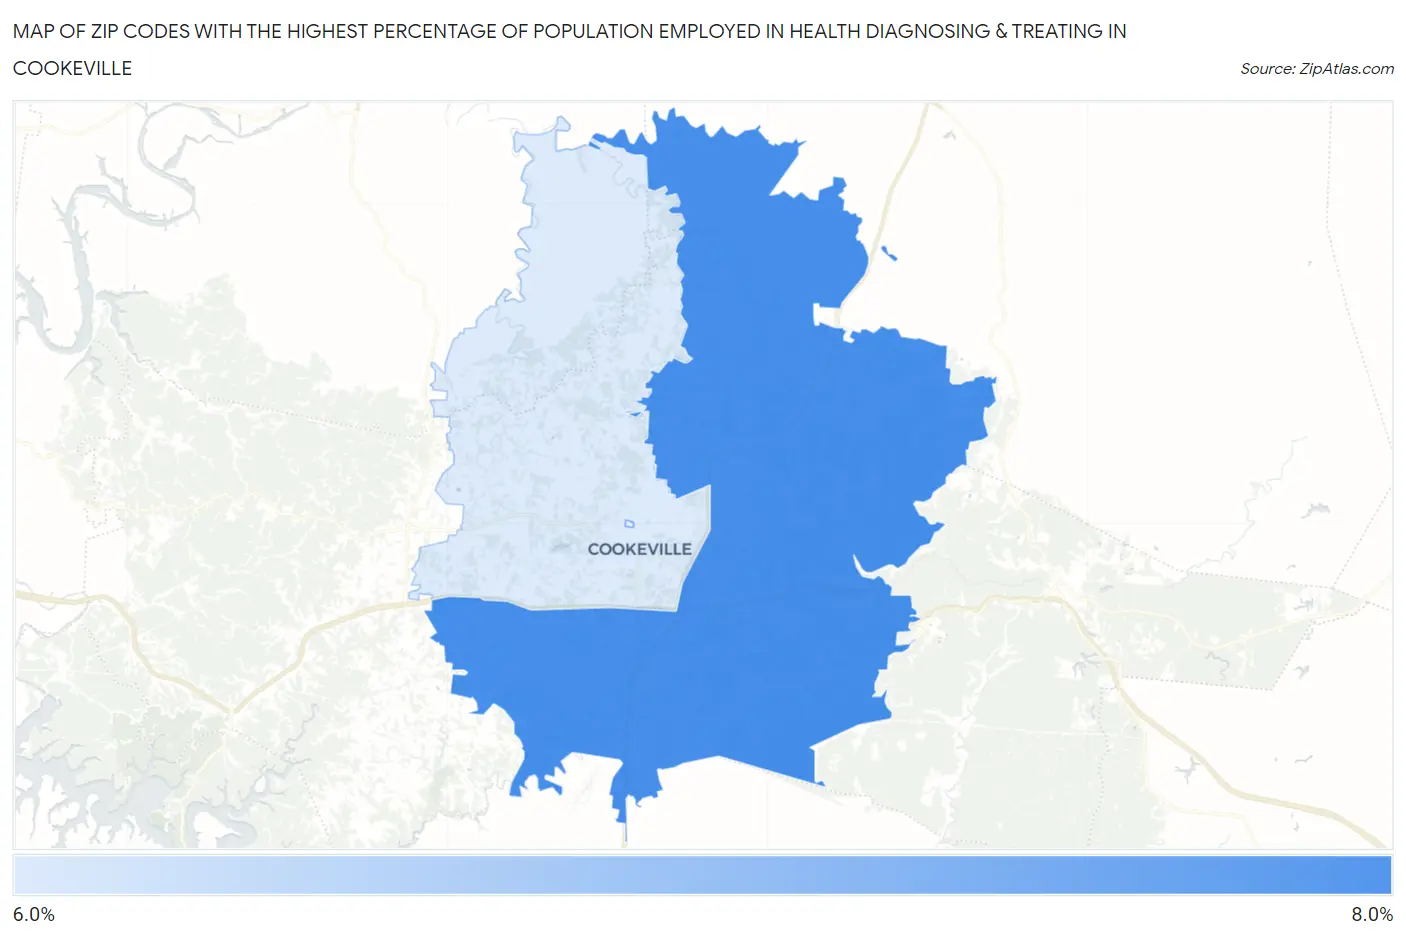
Map of Zip Codes with the Highest Percentage of Population Employed in Health Diagnosing & Treating in Cookeville
6.0%
7.7%
Zip Codes with the Highest Percentage of Population Employed in Health Diagnosing & Treating in Cookeville, TN
| Zip Code | % Employed | vs State | vs National | |
| 1. | 38506 | 7.7% | 6.9%(+0.797)#204 | 6.2%(+1.41)#8,357 |
| 2. | 38501 | 6.0% | 6.9%(-0.857)#329 | 6.2%(-0.240)#13,851 |
1
Common Questions
What are the Top Zip Codes with the Highest Percentage of Population Employed in Health Diagnosing & Treating in Cookeville, TN?
Top Zip Codes with the Highest Percentage of Population Employed in Health Diagnosing & Treating in Cookeville, TN are:
What zip code has the Highest Percentage of Population Employed in Health Diagnosing & Treating in Cookeville, TN?
38506 has the Highest Percentage of Population Employed in Health Diagnosing & Treating in Cookeville, TN with 7.7%.
What is the Percentage of Population Employed in Health Diagnosing & Treating in Cookeville, TN?
Percentage of Population Employed in Health Diagnosing & Treating in Cookeville is 6.5%.
What is the Percentage of Population Employed in Health Diagnosing & Treating in Tennessee?
Percentage of Population Employed in Health Diagnosing & Treating in Tennessee is 6.9%.
What is the Percentage of Population Employed in Health Diagnosing & Treating in the United States?
Percentage of Population Employed in Health Diagnosing & Treating in the United States is 6.2%.