Zip Codes with the Highest Percentage of Population Employed in Security & Protection in Cookeville, TN
RELATED REPORTS & OPTIONS
Security & Protection
Cookeville
Compare Zip Codes
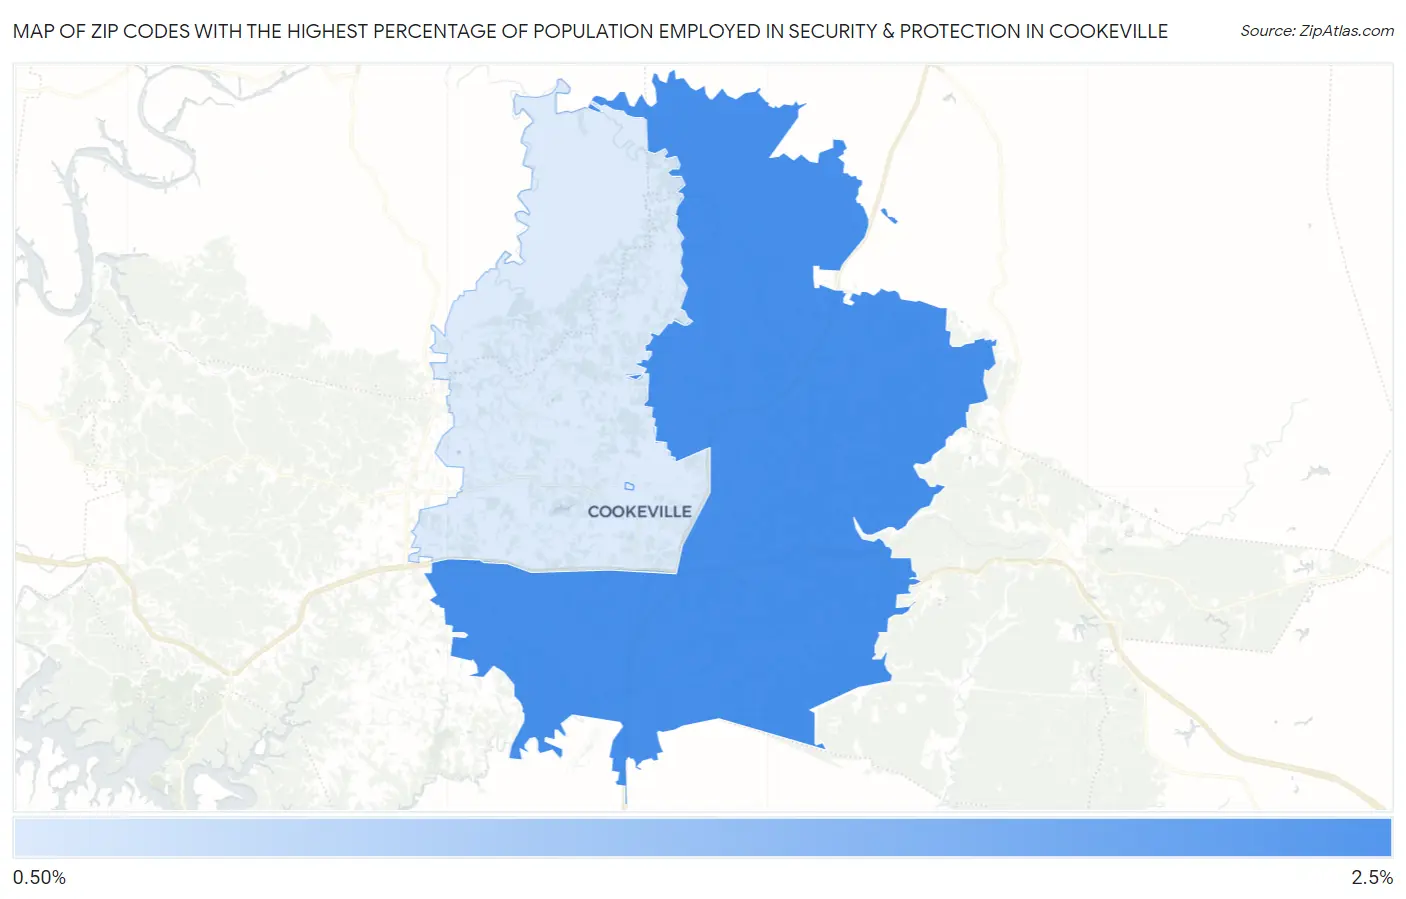
Map of Zip Codes with the Highest Percentage of Population Employed in Security & Protection in Cookeville
1.3%
2.4%
Zip Codes with the Highest Percentage of Population Employed in Security & Protection in Cookeville, TN
| Zip Code | % Employed | vs State | vs National | |
| 1. | 38506 | 2.4% | 2.1%(+0.322)#199 | 2.1%(+0.268)#9,975 |
| 2. | 38501 | 1.3% | 2.1%(-0.807)#361 | 2.1%(-0.862)#17,853 |
1
Common Questions
What are the Top Zip Codes with the Highest Percentage of Population Employed in Security & Protection in Cookeville, TN?
Top Zip Codes with the Highest Percentage of Population Employed in Security & Protection in Cookeville, TN are:
What zip code has the Highest Percentage of Population Employed in Security & Protection in Cookeville, TN?
38506 has the Highest Percentage of Population Employed in Security & Protection in Cookeville, TN with 2.4%.
What is the Percentage of Population Employed in Security & Protection in Cookeville, TN?
Percentage of Population Employed in Security & Protection in Cookeville is 1.1%.
What is the Percentage of Population Employed in Security & Protection in Tennessee?
Percentage of Population Employed in Security & Protection in Tennessee is 2.1%.
What is the Percentage of Population Employed in Security & Protection in the United States?
Percentage of Population Employed in Security & Protection in the United States is 2.1%.