Zip Codes with the Highest Percentage of Population Employed in Installation, Maintenance & Repair in Cookeville, TN
RELATED REPORTS & OPTIONS
Installation, Maintenance & Repair
Cookeville
Compare Zip Codes
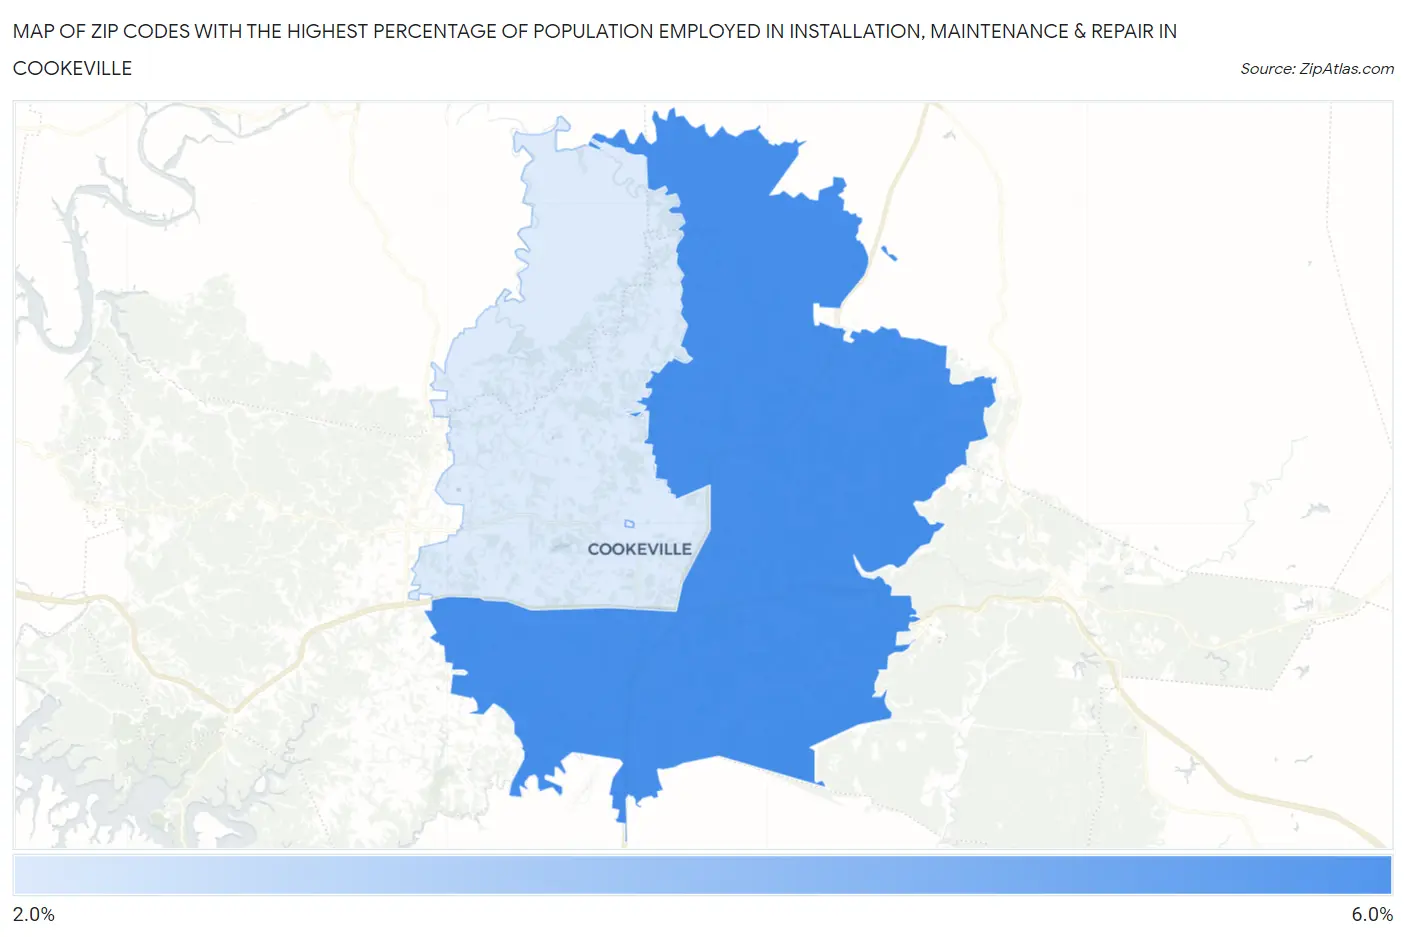
Map of Zip Codes with the Highest Percentage of Population Employed in Installation, Maintenance & Repair in Cookeville
2.6%
5.6%
Zip Codes with the Highest Percentage of Population Employed in Installation, Maintenance & Repair in Cookeville, TN
| Zip Code | % Employed | vs State | vs National | |
| 1. | 38506 | 5.6% | 3.3%(+2.33)#164 | 3.1%(+2.58)#6,910 |
| 2. | 38501 | 2.6% | 3.3%(-0.713)#407 | 3.1%(-0.470)#19,081 |
1
Common Questions
What are the Top Zip Codes with the Highest Percentage of Population Employed in Installation, Maintenance & Repair in Cookeville, TN?
Top Zip Codes with the Highest Percentage of Population Employed in Installation, Maintenance & Repair in Cookeville, TN are:
What zip code has the Highest Percentage of Population Employed in Installation, Maintenance & Repair in Cookeville, TN?
38506 has the Highest Percentage of Population Employed in Installation, Maintenance & Repair in Cookeville, TN with 5.6%.
What is the Percentage of Population Employed in Installation, Maintenance & Repair in Cookeville, TN?
Percentage of Population Employed in Installation, Maintenance & Repair in Cookeville is 1.3%.
What is the Percentage of Population Employed in Installation, Maintenance & Repair in Tennessee?
Percentage of Population Employed in Installation, Maintenance & Repair in Tennessee is 3.3%.
What is the Percentage of Population Employed in Installation, Maintenance & Repair in the United States?
Percentage of Population Employed in Installation, Maintenance & Repair in the United States is 3.1%.