Zip Codes with the Highest Percentage of Population Employed in Legal Services & Support in Cookeville, TN
RELATED REPORTS & OPTIONS
Legal Services & Support
Cookeville
Compare Zip Codes
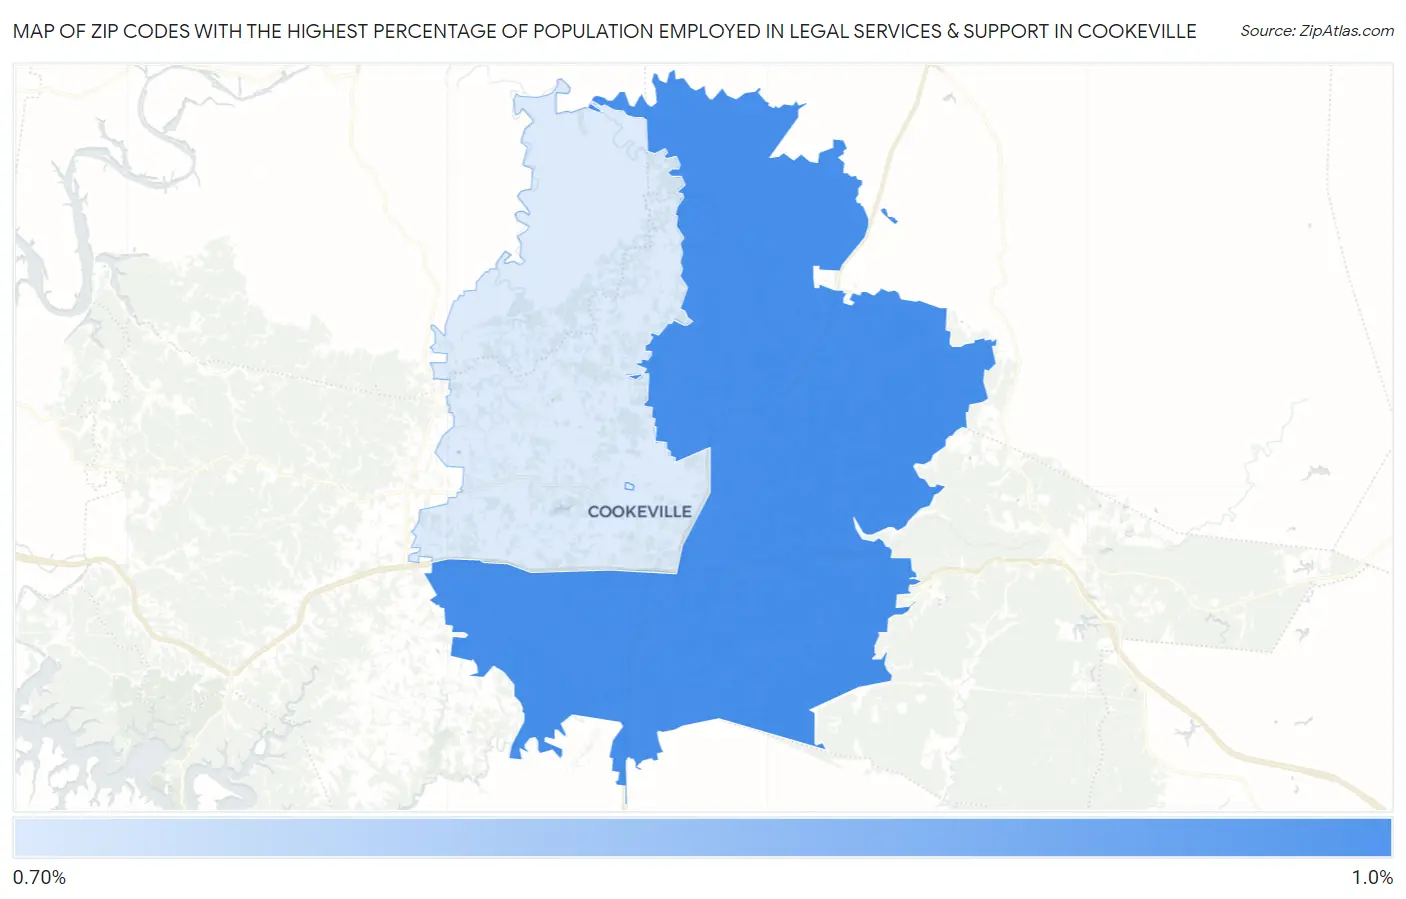
Map of Zip Codes with the Highest Percentage of Population Employed in Legal Services & Support in Cookeville
0.80%
0.83%
Zip Codes with the Highest Percentage of Population Employed in Legal Services & Support in Cookeville, TN
| Zip Code | % Employed | vs State | vs National | |
| 1. | 38506 | 0.83% | 0.90%(-0.072)#149 | 1.2%(-0.358)#9,224 |
| 2. | 38501 | 0.80% | 0.90%(-0.103)#153 | 1.2%(-0.389)#9,489 |
1
Common Questions
What are the Top Zip Codes with the Highest Percentage of Population Employed in Legal Services & Support in Cookeville, TN?
Top Zip Codes with the Highest Percentage of Population Employed in Legal Services & Support in Cookeville, TN are:
What zip code has the Highest Percentage of Population Employed in Legal Services & Support in Cookeville, TN?
38506 has the Highest Percentage of Population Employed in Legal Services & Support in Cookeville, TN with 0.83%.
What is the Percentage of Population Employed in Legal Services & Support in Cookeville, TN?
Percentage of Population Employed in Legal Services & Support in Cookeville is 0.57%.
What is the Percentage of Population Employed in Legal Services & Support in Tennessee?
Percentage of Population Employed in Legal Services & Support in Tennessee is 0.90%.
What is the Percentage of Population Employed in Legal Services & Support in the United States?
Percentage of Population Employed in Legal Services & Support in the United States is 1.2%.