Pacolet, SC Map & Demographics
Pacolet Map
Pacolet Overview
$26,024
PER CAPITA INCOME
$59,145
AVG FAMILY INCOME
$44,894
AVG HOUSEHOLD INCOME
24.8%
WAGE / INCOME GAP [ % ]
75.2¢/ $1
WAGE / INCOME GAP [ $ ]
$6,815
FAMILY INCOME DEFICIT
0.40
INEQUALITY / GINI INDEX
1,970
TOTAL POPULATION
948
MALE POPULATION
1,022
FEMALE POPULATION
92.76
MALES / 100 FEMALES
107.81
FEMALES / 100 MALES
48.1
MEDIAN AGE
2.9
AVG FAMILY SIZE
2.1
AVG HOUSEHOLD SIZE
924
LABOR FORCE [ PEOPLE ]
55.3%
PERCENT IN LABOR FORCE
7.0%
UNEMPLOYMENT RATE
Pacolet Zip Codes
Pacolet Area Codes
Income in Pacolet
Income Overview in Pacolet
Per Capita Income in Pacolet is $26,024, while median incomes of families and households are $59,145 and $44,894 respectively.
| Characteristic | Number | Measure |
| Per Capita Income | 1,970 | $26,024 |
| Median Family Income | 501 | $59,145 |
| Mean Family Income | 501 | $69,400 |
| Median Household Income | 935 | $44,894 |
| Mean Household Income | 935 | $53,384 |
| Income Deficit | 501 | $6,815 |
| Wage / Income Gap (%) | 1,970 | 24.85% |
| Wage / Income Gap ($) | 1,970 | 75.15¢ per $1 |
| Gini / Inequality Index | 1,970 | 0.40 |
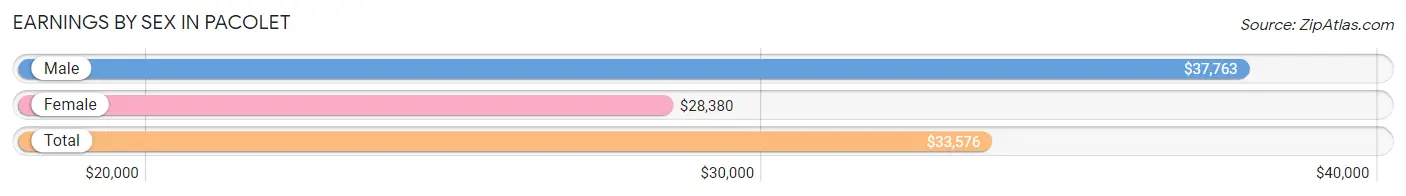
Earnings by Sex in Pacolet
Average Earnings in Pacolet are $33,576, $37,763 for men and $28,380 for women, a difference of 24.8%.
| Sex | Number | Average Earnings |
| Male | 448 (47.8%) | $37,763 |
| Female | 489 (52.2%) | $28,380 |
| Total | 937 (100.0%) | $33,576 |
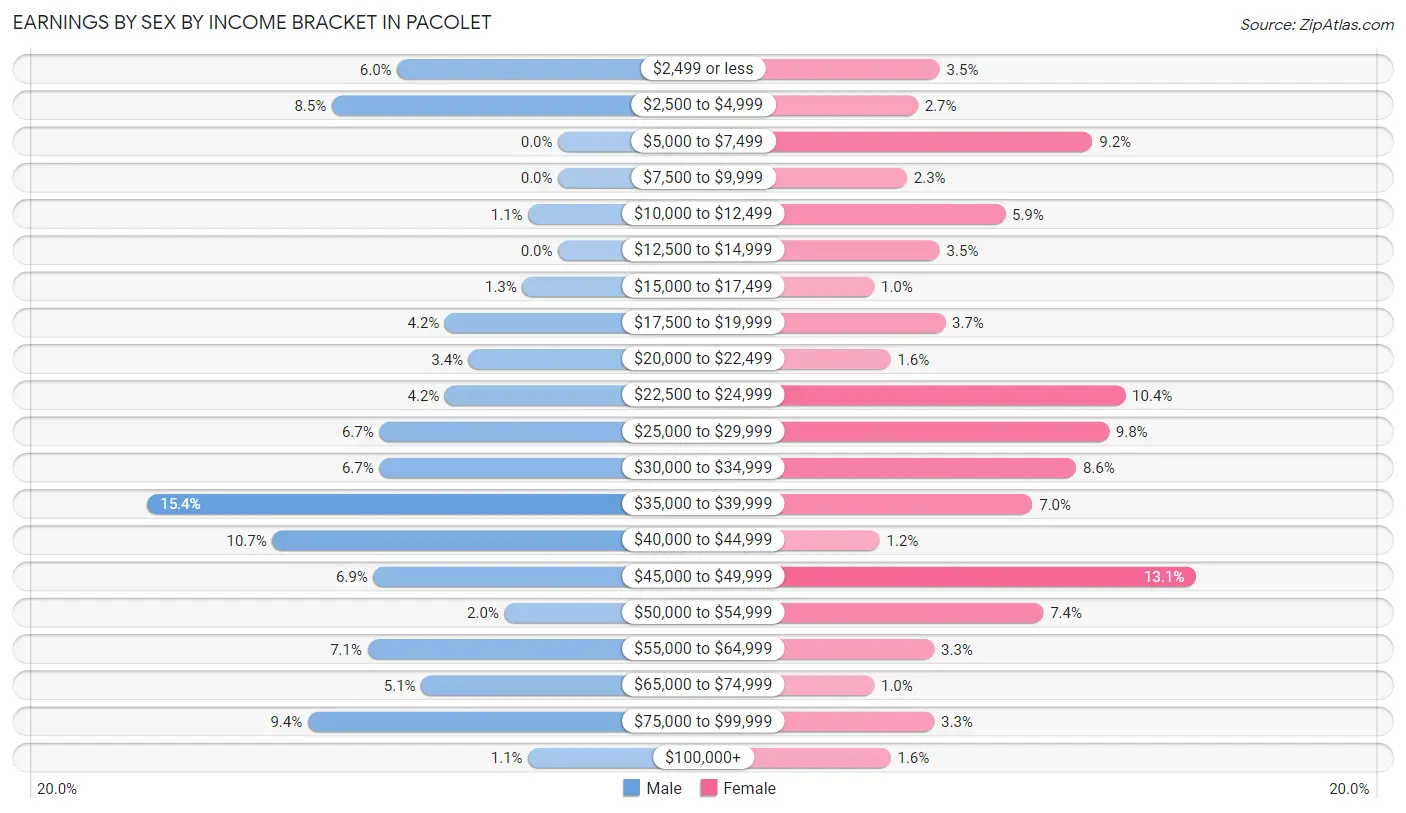
Earnings by Sex by Income Bracket in Pacolet
The most common earnings brackets in Pacolet are $35,000 to $39,999 for men (69 | 15.4%) and $45,000 to $49,999 for women (64 | 13.1%).
| Income | Male | Female |
| $2,499 or less | 27 (6.0%) | 17 (3.5%) |
| $2,500 to $4,999 | 38 (8.5%) | 13 (2.7%) |
| $5,000 to $7,499 | 0 (0.0%) | 45 (9.2%) |
| $7,500 to $9,999 | 0 (0.0%) | 11 (2.2%) |
| $10,000 to $12,499 | 5 (1.1%) | 29 (5.9%) |
| $12,500 to $14,999 | 0 (0.0%) | 17 (3.5%) |
| $15,000 to $17,499 | 6 (1.3%) | 5 (1.0%) |
| $17,500 to $19,999 | 19 (4.2%) | 18 (3.7%) |
| $20,000 to $22,499 | 15 (3.4%) | 8 (1.6%) |
| $22,500 to $24,999 | 19 (4.2%) | 51 (10.4%) |
| $25,000 to $29,999 | 30 (6.7%) | 48 (9.8%) |
| $30,000 to $34,999 | 30 (6.7%) | 42 (8.6%) |
| $35,000 to $39,999 | 69 (15.4%) | 34 (7.0%) |
| $40,000 to $44,999 | 48 (10.7%) | 6 (1.2%) |
| $45,000 to $49,999 | 31 (6.9%) | 64 (13.1%) |
| $50,000 to $54,999 | 9 (2.0%) | 36 (7.4%) |
| $55,000 to $64,999 | 32 (7.1%) | 16 (3.3%) |
| $65,000 to $74,999 | 23 (5.1%) | 5 (1.0%) |
| $75,000 to $99,999 | 42 (9.4%) | 16 (3.3%) |
| $100,000+ | 5 (1.1%) | 8 (1.6%) |
| Total | 448 (100.0%) | 489 (100.0%) |
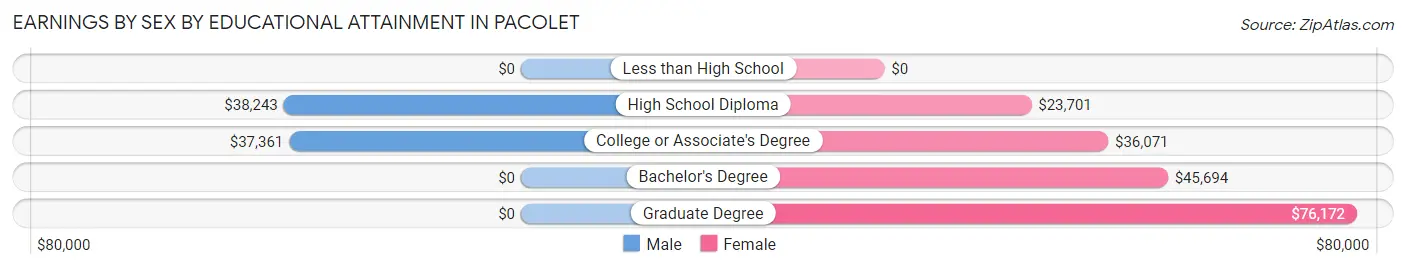
Earnings by Sex by Educational Attainment in Pacolet
Average earnings in Pacolet are $38,618 for men and $33,008 for women, a difference of 14.5%. Men with an educational attainment of high school diploma enjoy the highest average annual earnings of $38,243, while those with college or associate's degree education earn the least with $37,361. Women with an educational attainment of graduate degree earn the most with the average annual earnings of $76,172, while those with high school diploma education have the smallest earnings of $23,701.
| Educational Attainment | Male Income | Female Income |
| Less than High School | - | - |
| High School Diploma | $38,243 | $23,701 |
| College or Associate's Degree | $37,361 | $36,071 |
| Bachelor's Degree | - | - |
| Graduate Degree | - | - |
| Total | $38,618 | $33,008 |
Family Income in Pacolet
Family Income Brackets in Pacolet
According to the Pacolet family income data, there are 130 families falling into the $75,000 to $99,999 income range, which is the most common income bracket and makes up 26.0% of all families. Conversely, the less than $10,000 income bracket is the least frequent group with only 5 families (1.0%) belonging to this category.
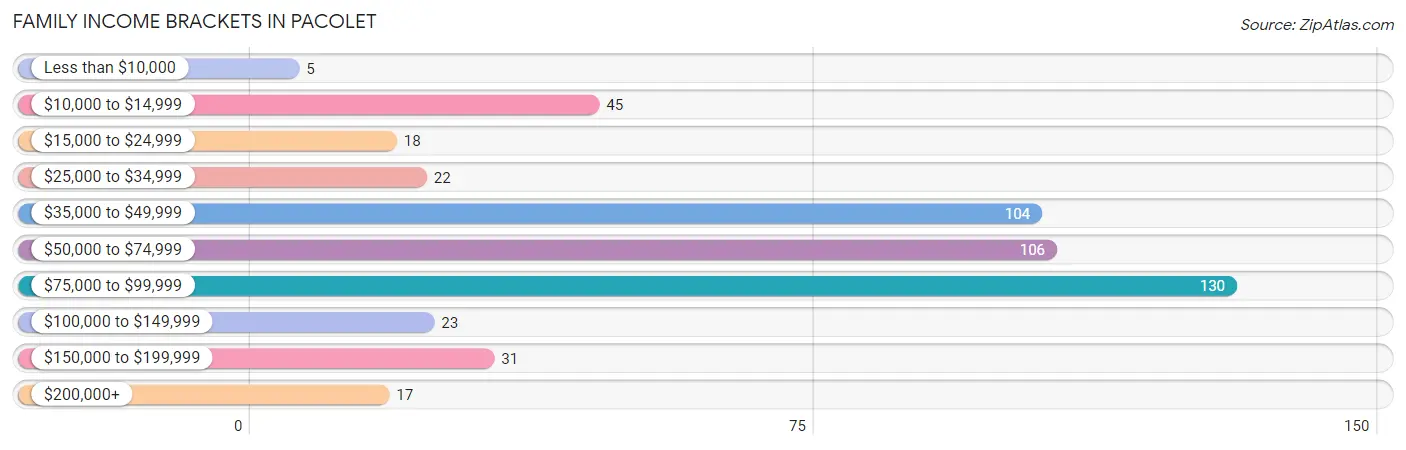
| Income Bracket | # Families | % Families |
| Less than $10,000 | 5 | 1.0% |
| $10,000 to $14,999 | 45 | 9.0% |
| $15,000 to $24,999 | 18 | 3.6% |
| $25,000 to $34,999 | 22 | 4.4% |
| $35,000 to $49,999 | 104 | 20.8% |
| $50,000 to $74,999 | 106 | 21.2% |
| $75,000 to $99,999 | 130 | 25.9% |
| $100,000 to $149,999 | 23 | 4.6% |
| $150,000 to $199,999 | 31 | 6.2% |
| $200,000+ | 17 | 3.4% |
Family Income by Famaliy Size in Pacolet
4-person families (64 | 12.8%) account for the highest median family income in Pacolet with $78,393 per family, while 3-person families (133 | 26.6%) have the highest median income of $25,087 per family member.
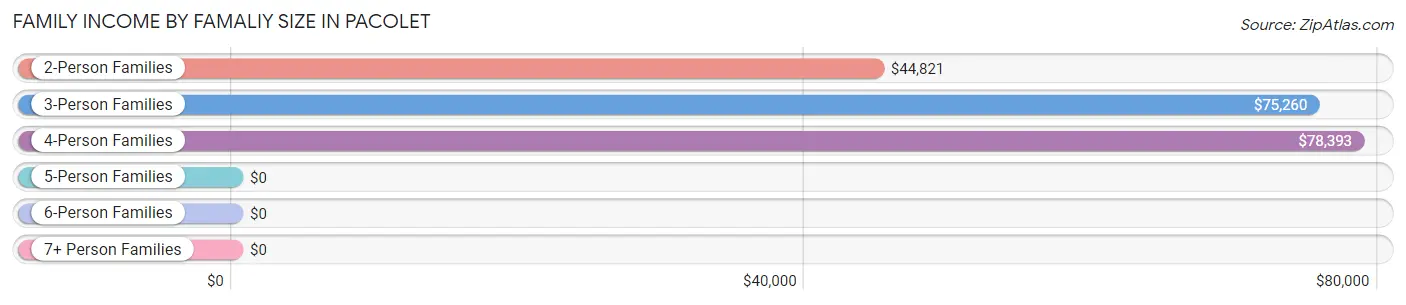
| Income Bracket | # Families | Median Income |
| 2-Person Families | 251 (50.1%) | $44,821 |
| 3-Person Families | 133 (26.6%) | $75,260 |
| 4-Person Families | 64 (12.8%) | $78,393 |
| 5-Person Families | 36 (7.2%) | $0 |
| 6-Person Families | 17 (3.4%) | $0 |
| 7+ Person Families | 0 (0.0%) | $0 |
| Total | 501 (100.0%) | $59,145 |
Family Income by Number of Earners in Pacolet
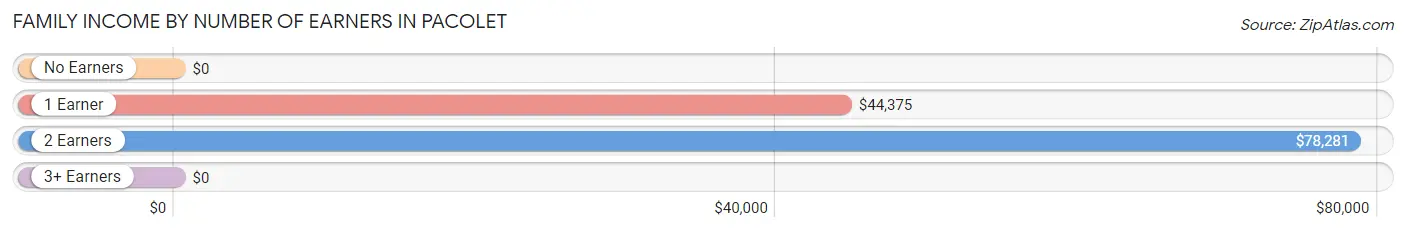
| Number of Earners | # Families | Median Income |
| No Earners | 87 (17.4%) | $0 |
| 1 Earner | 207 (41.3%) | $44,375 |
| 2 Earners | 128 (25.6%) | $78,281 |
| 3+ Earners | 79 (15.8%) | $0 |
| Total | 501 (100.0%) | $59,145 |
Household Income in Pacolet
Household Income Brackets in Pacolet
With 190 households falling in the category, the $35,000 to $49,999 income range is the most frequent in Pacolet, accounting for 20.3% of all households. In contrast, only 17 households (1.8%) fall into the $200,000+ income bracket, making it the least populous group.
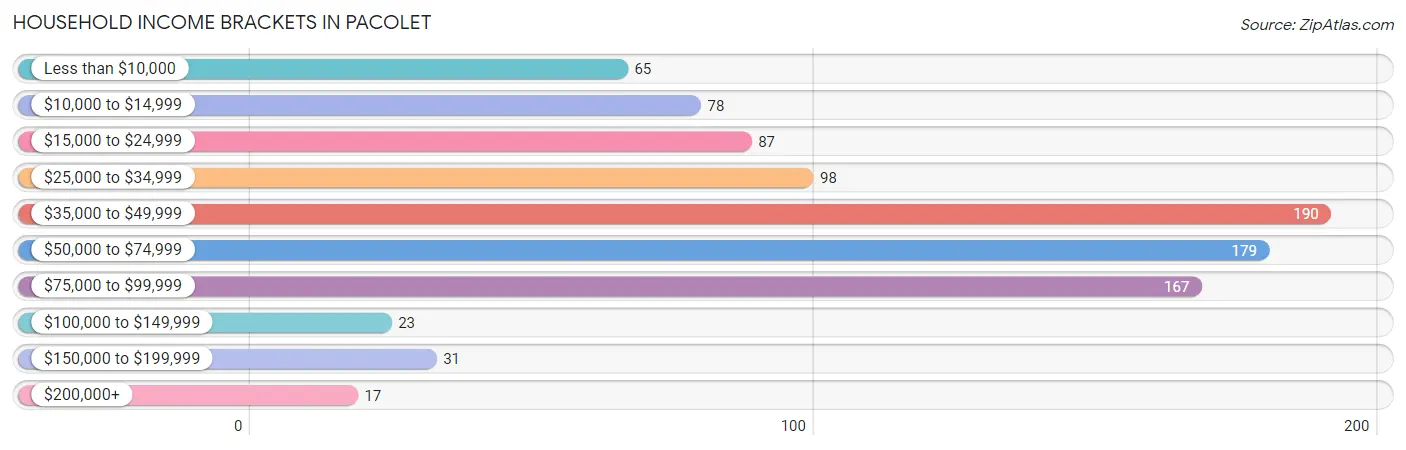
| Income Bracket | # Households | % Households |
| Less than $10,000 | 65 | 7.0% |
| $10,000 to $14,999 | 78 | 8.3% |
| $15,000 to $24,999 | 87 | 9.3% |
| $25,000 to $34,999 | 98 | 10.5% |
| $35,000 to $49,999 | 190 | 20.3% |
| $50,000 to $74,999 | 179 | 19.1% |
| $75,000 to $99,999 | 167 | 17.9% |
| $100,000 to $149,999 | 23 | 2.5% |
| $150,000 to $199,999 | 31 | 3.3% |
| $200,000+ | 17 | 1.8% |
Household Income by Householder Age in Pacolet
The median household income in Pacolet is $44,894, with the highest median household income of $50,806 found in the 25 to 44 years age bracket for the primary householder. A total of 236 households (25.2%) fall into this category. Meanwhile, the 15 to 24 years age bracket for the primary householder has the lowest median household income of $0, with 5 households (0.5%) in this group.
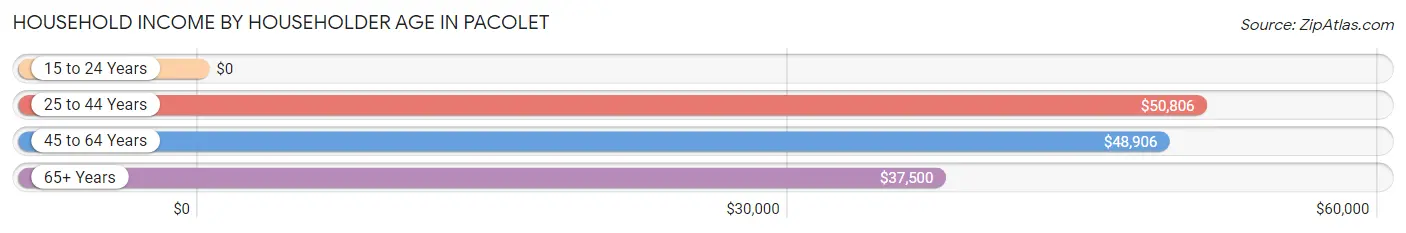
| Income Bracket | # Households | Median Income |
| 15 to 24 Years | 5 (0.5%) | $0 |
| 25 to 44 Years | 236 (25.2%) | $50,806 |
| 45 to 64 Years | 312 (33.4%) | $48,906 |
| 65+ Years | 382 (40.9%) | $37,500 |
| Total | 935 (100.0%) | $44,894 |
Poverty in Pacolet
Income Below Poverty by Sex and Age in Pacolet
With 15.8% poverty level for males and 14.7% for females among the residents of Pacolet, 25 to 34 year old males and 15 year old females are the most vulnerable to poverty, with 39 males (37.5%) and 21 females (100.0%) in their respective age groups living below the poverty level.
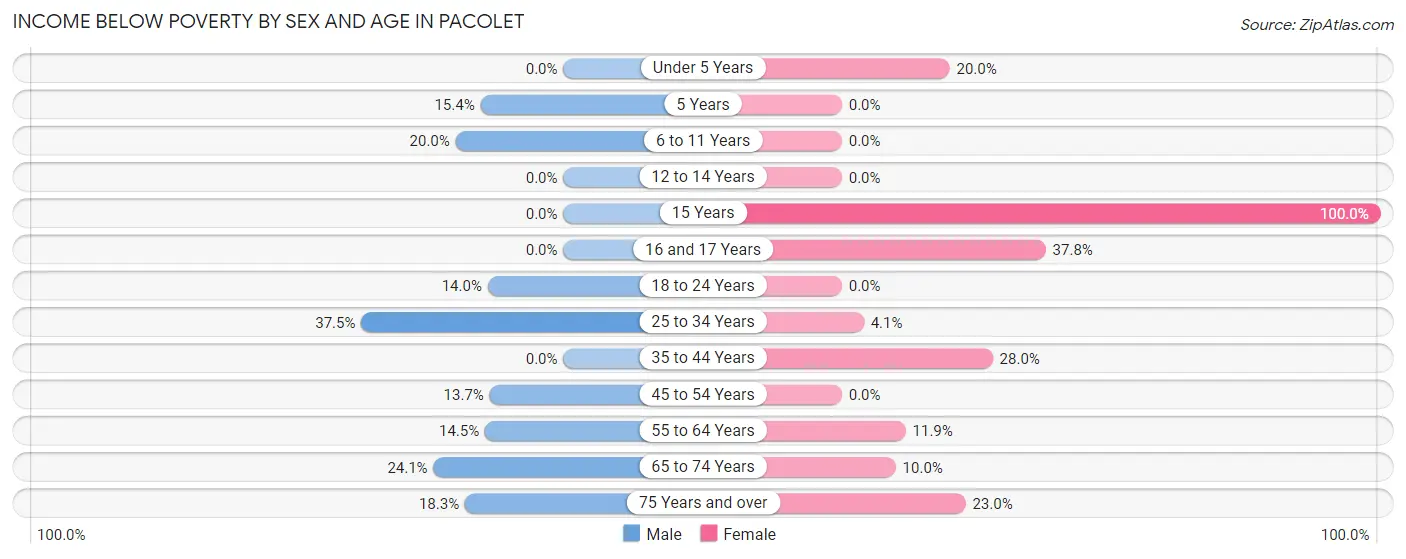
| Age Bracket | Male | Female |
| Under 5 Years | 0 (0.0%) | 5 (20.0%) |
| 5 Years | 4 (15.4%) | 0 (0.0%) |
| 6 to 11 Years | 13 (20.0%) | 0 (0.0%) |
| 12 to 14 Years | 0 (0.0%) | 0 (0.0%) |
| 15 Years | 0 (0.0%) | 21 (100.0%) |
| 16 and 17 Years | 0 (0.0%) | 14 (37.8%) |
| 18 to 24 Years | 8 (14.0%) | 0 (0.0%) |
| 25 to 34 Years | 39 (37.5%) | 5 (4.1%) |
| 35 to 44 Years | 0 (0.0%) | 35 (28.0%) |
| 45 to 54 Years | 16 (13.7%) | 0 (0.0%) |
| 55 to 64 Years | 17 (14.5%) | 25 (11.8%) |
| 65 to 74 Years | 27 (24.1%) | 14 (10.0%) |
| 75 Years and over | 21 (18.3%) | 31 (23.0%) |
| Total | 145 (15.8%) | 150 (14.7%) |
Income Above Poverty by Sex and Age in Pacolet
According to the poverty statistics in Pacolet, males aged under 5 years and females aged 5 years are the age groups that are most secure financially, with 100.0% of males and 100.0% of females in these age groups living above the poverty line.
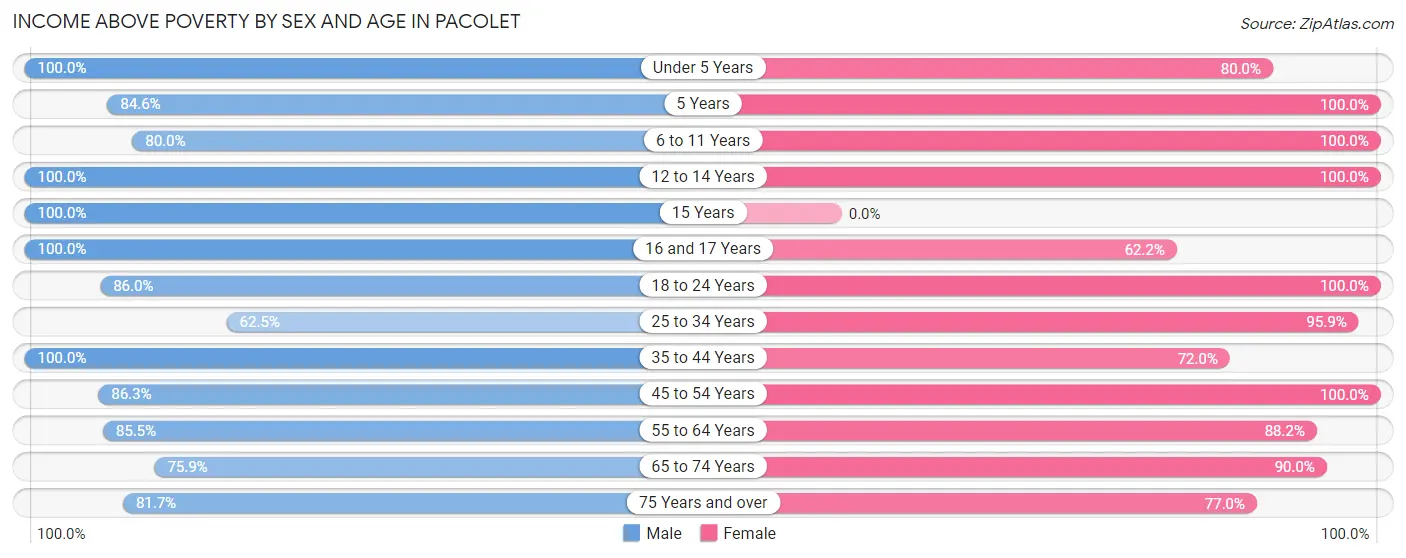
| Age Bracket | Male | Female |
| Under 5 Years | 39 (100.0%) | 20 (80.0%) |
| 5 Years | 22 (84.6%) | 12 (100.0%) |
| 6 to 11 Years | 52 (80.0%) | 17 (100.0%) |
| 12 to 14 Years | 41 (100.0%) | 19 (100.0%) |
| 15 Years | 7 (100.0%) | 0 (0.0%) |
| 16 and 17 Years | 29 (100.0%) | 23 (62.2%) |
| 18 to 24 Years | 49 (86.0%) | 73 (100.0%) |
| 25 to 34 Years | 65 (62.5%) | 118 (95.9%) |
| 35 to 44 Years | 91 (100.0%) | 90 (72.0%) |
| 45 to 54 Years | 101 (86.3%) | 84 (100.0%) |
| 55 to 64 Years | 100 (85.5%) | 186 (88.1%) |
| 65 to 74 Years | 85 (75.9%) | 126 (90.0%) |
| 75 Years and over | 94 (81.7%) | 104 (77.0%) |
| Total | 775 (84.2%) | 872 (85.3%) |
Income Below Poverty Among Married-Couple Families in Pacolet
The poverty statistics for married-couple families in Pacolet show that 10.1% or 28 of the total 278 families live below the poverty line. Families with no children have the highest poverty rate of 12.4%, comprising of 23 families. On the other hand, families with 3 or 4 children have the lowest poverty rate of 0.0%, which includes 0 families.
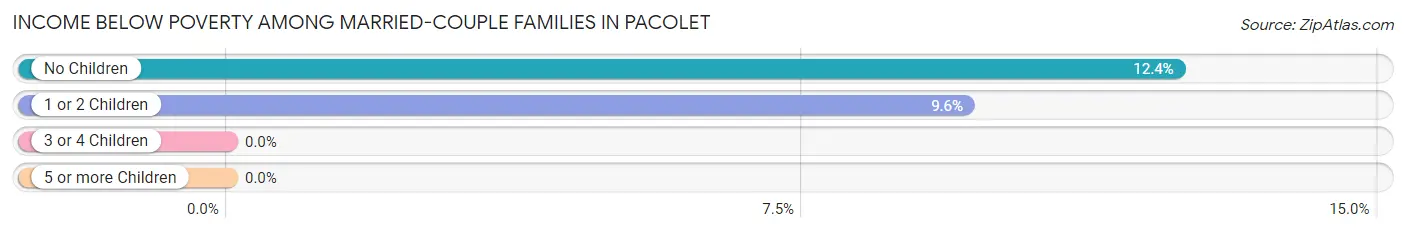
| Children | Above Poverty | Below Poverty |
| No Children | 163 (87.6%) | 23 (12.4%) |
| 1 or 2 Children | 47 (90.4%) | 5 (9.6%) |
| 3 or 4 Children | 40 (100.0%) | 0 (0.0%) |
| 5 or more Children | 0 (0.0%) | 0 (0.0%) |
| Total | 250 (89.9%) | 28 (10.1%) |
Income Below Poverty Among Single-Parent Households in Pacolet
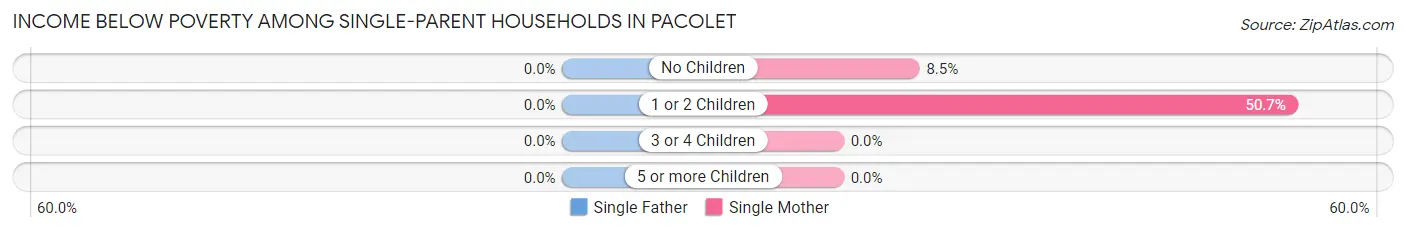
| Children | Single Father | Single Mother |
| No Children | 0 (0.0%) | 5 (8.5%) |
| 1 or 2 Children | 0 (0.0%) | 35 (50.7%) |
| 3 or 4 Children | 0 (0.0%) | 0 (0.0%) |
| 5 or more Children | 0 (0.0%) | 0 (0.0%) |
| Total | 0 (0.0%) | 40 (28.0%) |
Income Below Poverty Among Married-Couple vs Single-Parent Households in Pacolet
The poverty data for Pacolet shows that 28 of the married-couple family households (10.1%) and 40 of the single-parent households (17.9%) are living below the poverty level. Within the married-couple family households, those with no children have the highest poverty rate, with 23 households (12.4%) falling below the poverty line. Among the single-parent households, those with 1 or 2 children have the highest poverty rate, with 35 household (42.2%) living below poverty.
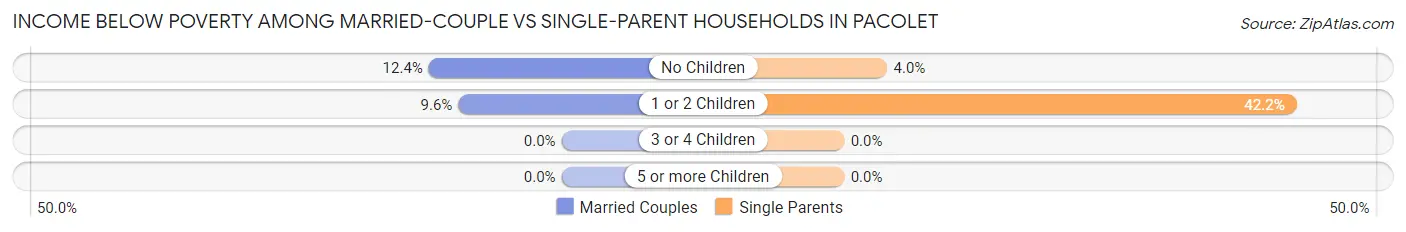
| Children | Married-Couple Families | Single-Parent Households |
| No Children | 23 (12.4%) | 5 (4.0%) |
| 1 or 2 Children | 5 (9.6%) | 35 (42.2%) |
| 3 or 4 Children | 0 (0.0%) | 0 (0.0%) |
| 5 or more Children | 0 (0.0%) | 0 (0.0%) |
| Total | 28 (10.1%) | 40 (17.9%) |
Race in Pacolet
The most populous races in Pacolet are White / Caucasian (1,499 | 76.1%), Black / African American (384 | 19.5%), and Two or more Races (67 | 3.4%).
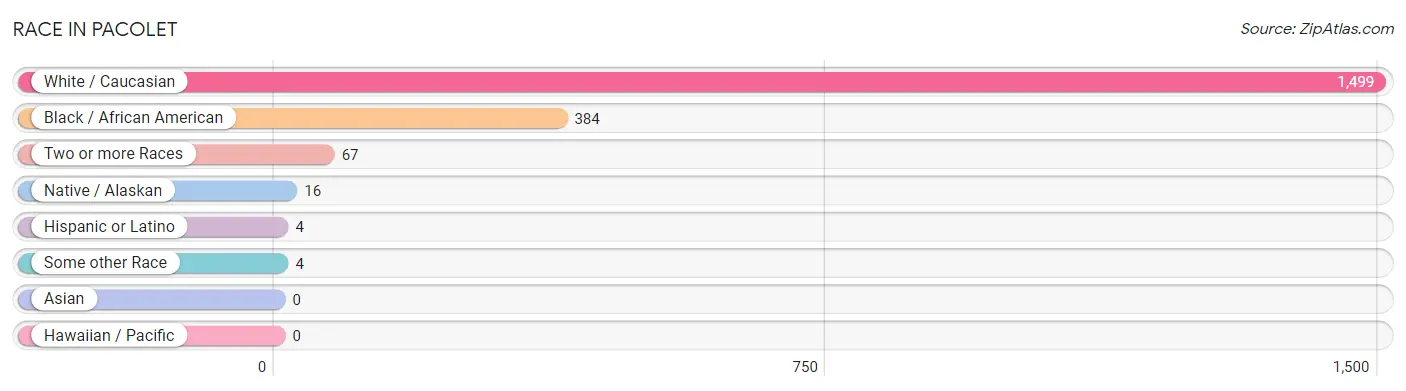
| Race | # Population | % Population |
| Asian | 0 | 0.0% |
| Black / African American | 384 | 19.5% |
| Hawaiian / Pacific | 0 | 0.0% |
| Hispanic or Latino | 4 | 0.2% |
| Native / Alaskan | 16 | 0.8% |
| White / Caucasian | 1,499 | 76.1% |
| Two or more Races | 67 | 3.4% |
| Some other Race | 4 | 0.2% |
| Total | 1,970 | 100.0% |
Ancestry in Pacolet
The most populous ancestries reported in Pacolet are English (203 | 10.3%), Irish (143 | 7.3%), American (126 | 6.4%), German (90 | 4.6%), and Italian (40 | 2.0%), together accounting for 30.6% of all Pacolet residents.
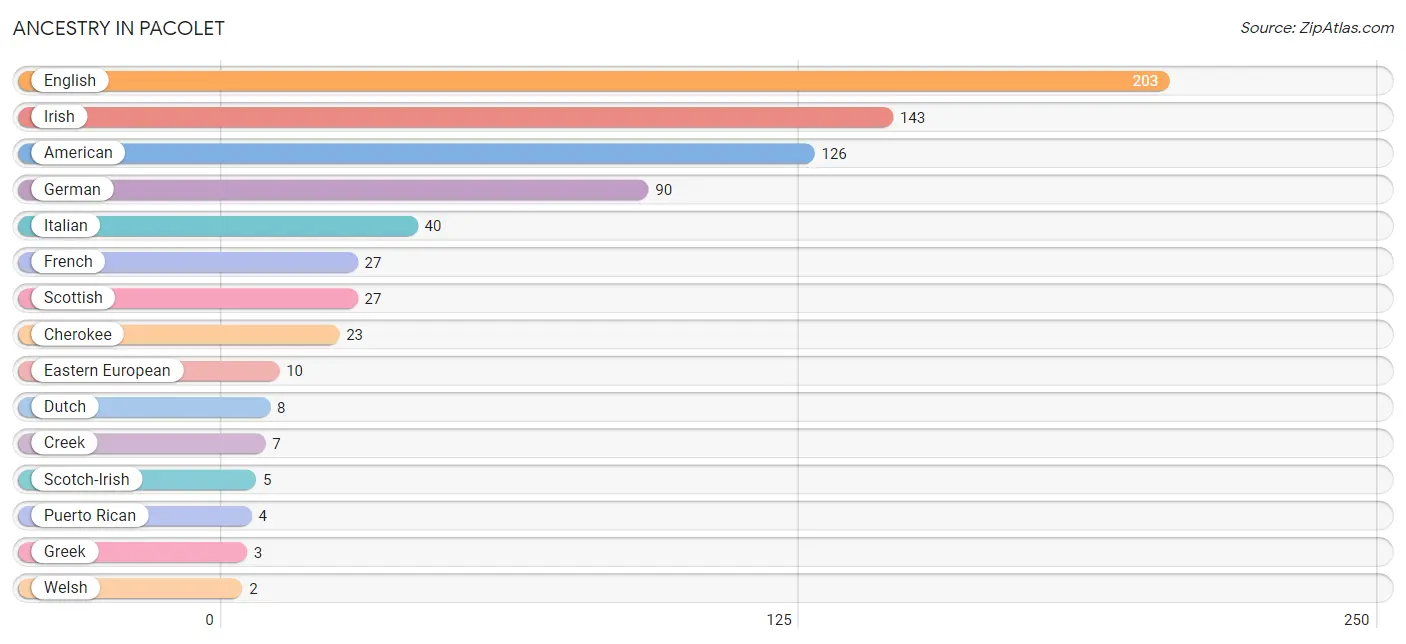
| Ancestry | # Population | % Population |
| American | 126 | 6.4% |
| Cherokee | 23 | 1.2% |
| Creek | 7 | 0.4% |
| Dutch | 8 | 0.4% |
| Eastern European | 10 | 0.5% |
| English | 203 | 10.3% |
| French | 27 | 1.4% |
| German | 90 | 4.6% |
| Greek | 3 | 0.2% |
| Irish | 143 | 7.3% |
| Italian | 40 | 2.0% |
| Puerto Rican | 4 | 0.2% |
| Scotch-Irish | 5 | 0.3% |
| Scottish | 27 | 1.4% |
| Welsh | 2 | 0.1% | View All 15 Rows |
Immigrants in Pacolet

| Immigration Origin | # Population | % Population | View All 0 Rows |
Sex and Age in Pacolet
Sex and Age in Pacolet
The most populous age groups in Pacolet are 5 to 9 Years (91 | 9.6%) for men and 60 to 64 Years (122 | 11.9%) for women.
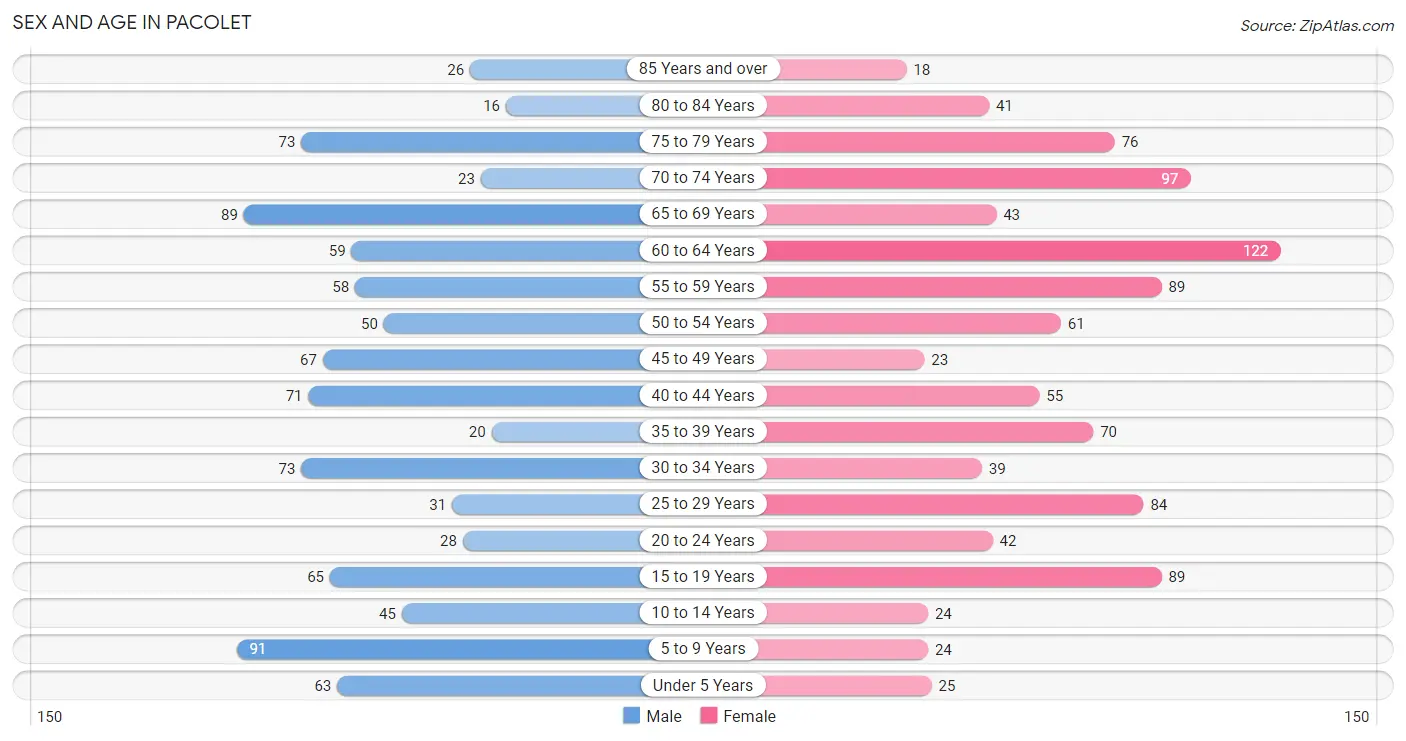
| Age Bracket | Male | Female |
| Under 5 Years | 63 (6.7%) | 25 (2.5%) |
| 5 to 9 Years | 91 (9.6%) | 24 (2.4%) |
| 10 to 14 Years | 45 (4.8%) | 24 (2.4%) |
| 15 to 19 Years | 65 (6.9%) | 89 (8.7%) |
| 20 to 24 Years | 28 (2.9%) | 42 (4.1%) |
| 25 to 29 Years | 31 (3.3%) | 84 (8.2%) |
| 30 to 34 Years | 73 (7.7%) | 39 (3.8%) |
| 35 to 39 Years | 20 (2.1%) | 70 (6.9%) |
| 40 to 44 Years | 71 (7.5%) | 55 (5.4%) |
| 45 to 49 Years | 67 (7.1%) | 23 (2.2%) |
| 50 to 54 Years | 50 (5.3%) | 61 (6.0%) |
| 55 to 59 Years | 58 (6.1%) | 89 (8.7%) |
| 60 to 64 Years | 59 (6.2%) | 122 (11.9%) |
| 65 to 69 Years | 89 (9.4%) | 43 (4.2%) |
| 70 to 74 Years | 23 (2.4%) | 97 (9.5%) |
| 75 to 79 Years | 73 (7.7%) | 76 (7.4%) |
| 80 to 84 Years | 16 (1.7%) | 41 (4.0%) |
| 85 Years and over | 26 (2.7%) | 18 (1.8%) |
| Total | 948 (100.0%) | 1,022 (100.0%) |
Families and Households in Pacolet
Median Family Size in Pacolet
The median family size in Pacolet is 2.91 persons per family, with single male/father families (80 | 16.0%) accounting for the largest median family size of 3.51 persons per family. On the other hand, single female/mother families (143 | 28.5%) represent the smallest median family size with 2.73 persons per family.
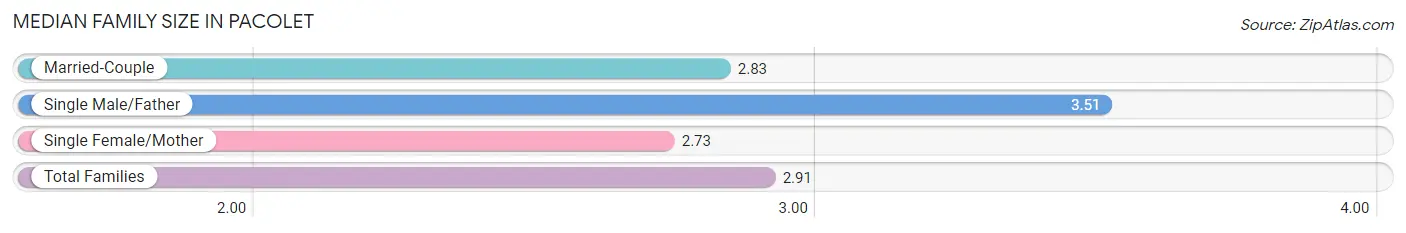
| Family Type | # Families | Family Size |
| Married-Couple | 278 (55.5%) | 2.83 |
| Single Male/Father | 80 (16.0%) | 3.51 |
| Single Female/Mother | 143 (28.5%) | 2.73 |
| Total Families | 501 (100.0%) | 2.91 |
Median Household Size in Pacolet
The median household size in Pacolet is 2.10 persons per household, with single male/father households (80 | 8.6%) accounting for the largest median household size of 3.61 persons per household. non-family households (434 | 46.4%) represent the smallest median household size with 1.09 persons per household.
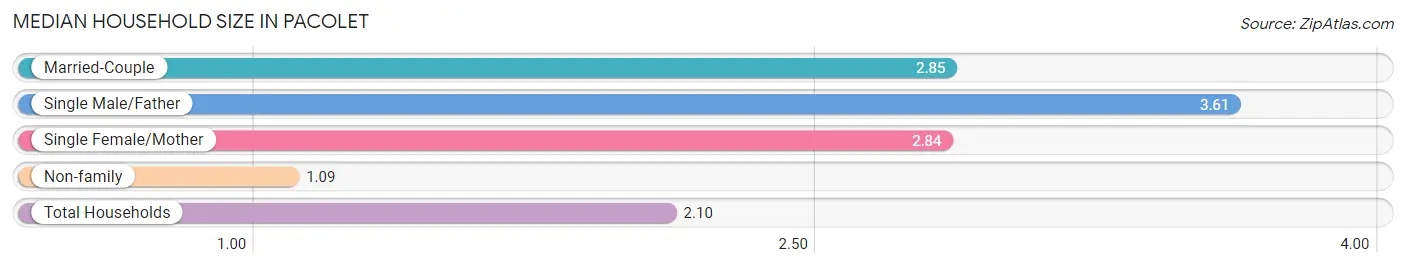
| Household Type | # Households | Household Size |
| Married-Couple | 278 (29.7%) | 2.85 |
| Single Male/Father | 80 (8.6%) | 3.61 |
| Single Female/Mother | 143 (15.3%) | 2.84 |
| Non-family | 434 (46.4%) | 1.09 |
| Total Households | 935 (100.0%) | 2.10 |
Household Size by Marriage Status in Pacolet
Out of a total of 935 households in Pacolet, 501 (53.6%) are family households, while 434 (46.4%) are nonfamily households. The most numerous type of family households are 2-person households, comprising 251, and the most common type of nonfamily households are 1-person households, comprising 418.
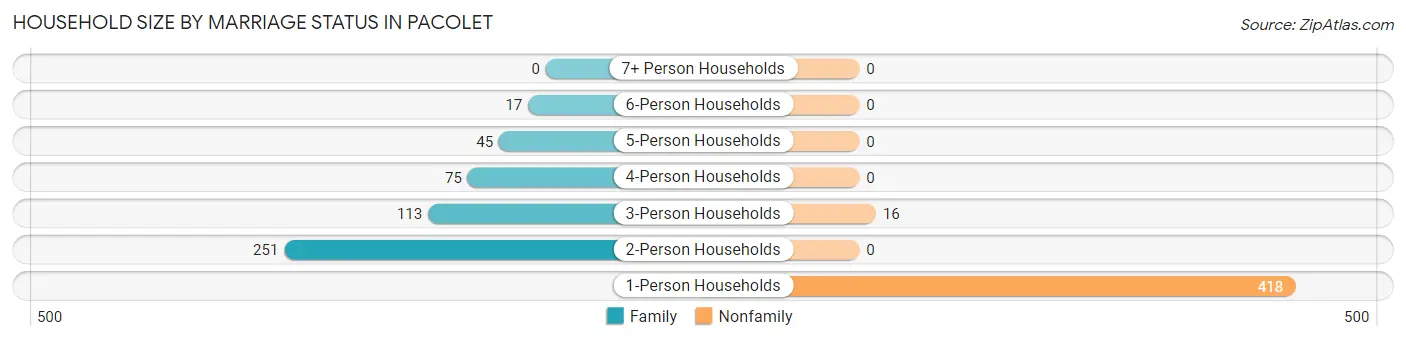
| Household Size | Family Households | Nonfamily Households |
| 1-Person Households | - | 418 (44.7%) |
| 2-Person Households | 251 (26.8%) | 0 (0.0%) |
| 3-Person Households | 113 (12.1%) | 16 (1.7%) |
| 4-Person Households | 75 (8.0%) | 0 (0.0%) |
| 5-Person Households | 45 (4.8%) | 0 (0.0%) |
| 6-Person Households | 17 (1.8%) | 0 (0.0%) |
| 7+ Person Households | 0 (0.0%) | 0 (0.0%) |
| Total | 501 (53.6%) | 434 (46.4%) |
Female Fertility in Pacolet
Fertility by Age in Pacolet
Average fertility rate in Pacolet is 24.0 births per 1,000 women. Women in the age bracket of 20 to 34 years have the highest fertility rate with 61.0 births per 1,000 women. Women in the age bracket of 20 to 34 years acount for 100.0% of all women with births.
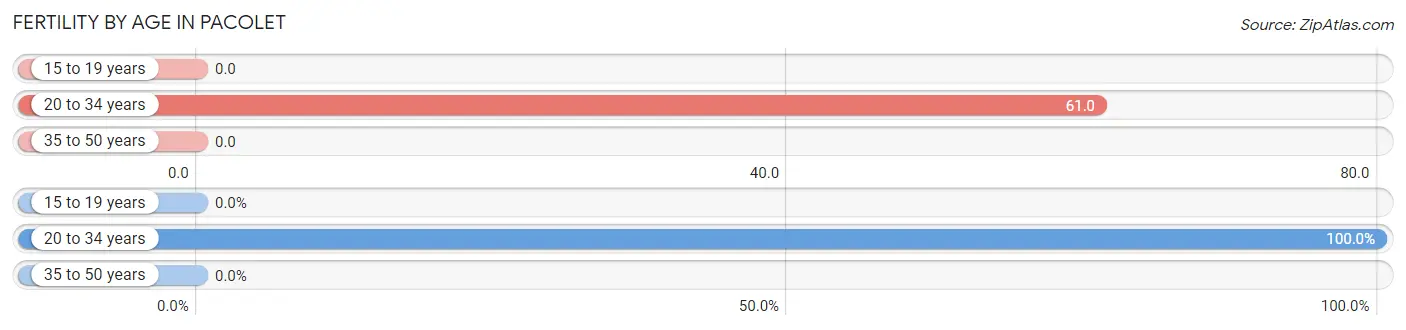
| Age Bracket | Women with Births | Births / 1,000 Women |
| 15 to 19 years | 0 (0.0%) | 0.0 |
| 20 to 34 years | 10 (100.0%) | 61.0 |
| 35 to 50 years | 0 (0.0%) | 0.0 |
| Total | 10 (100.0%) | 24.0 |
Fertility by Age by Marriage Status in Pacolet
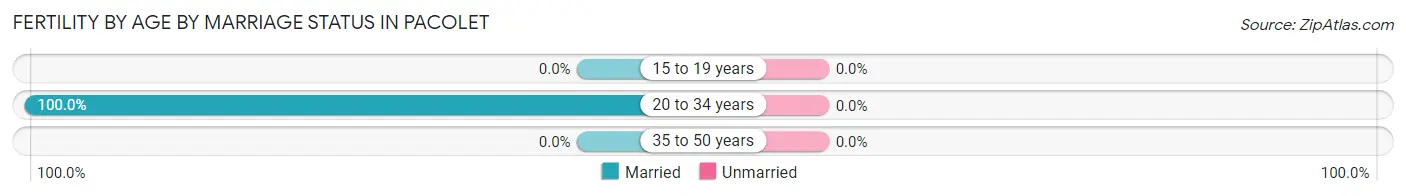
| Age Bracket | Married | Unmarried |
| 15 to 19 years | 0 (0.0%) | 0 (0.0%) |
| 20 to 34 years | 10 (100.0%) | 0 (0.0%) |
| 35 to 50 years | 0 (0.0%) | 0 (0.0%) |
| Total | 10 (100.0%) | 0 (0.0%) |
Fertility by Education in Pacolet
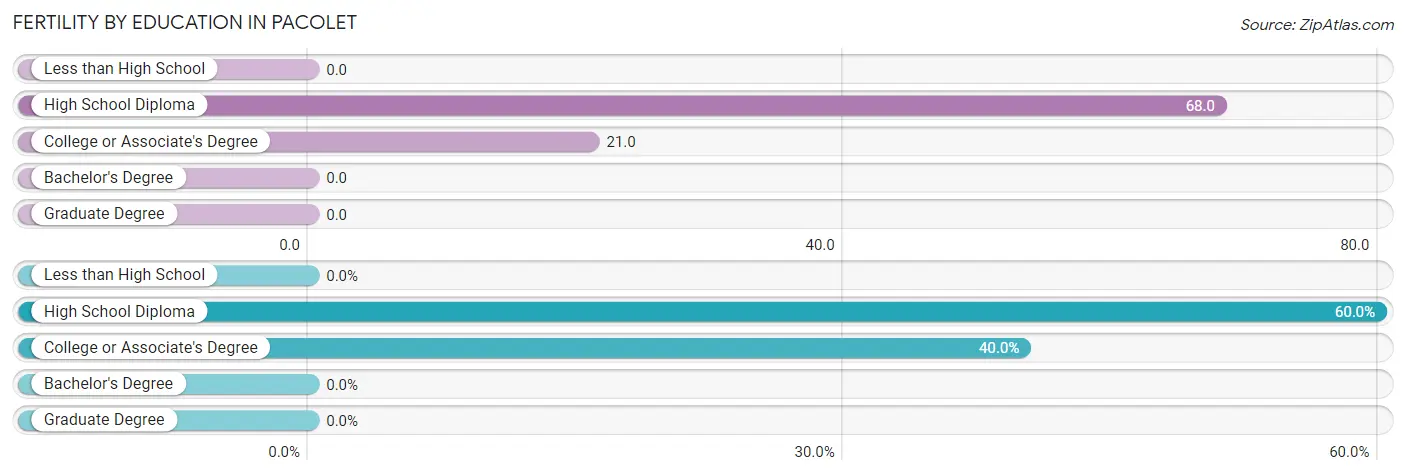
| Educational Attainment | Women with Births | Births / 1,000 Women |
| Less than High School | 0 (0.0%) | 0.0 |
| High School Diploma | 6 (60.0%) | 68.0 |
| College or Associate's Degree | 4 (40.0%) | 21.0 |
| Bachelor's Degree | 0 (0.0%) | 0.0 |
| Graduate Degree | 0 (0.0%) | 0.0 |
| Total | 10 (100.0%) | 24.0 |
Fertility by Education by Marriage Status in Pacolet
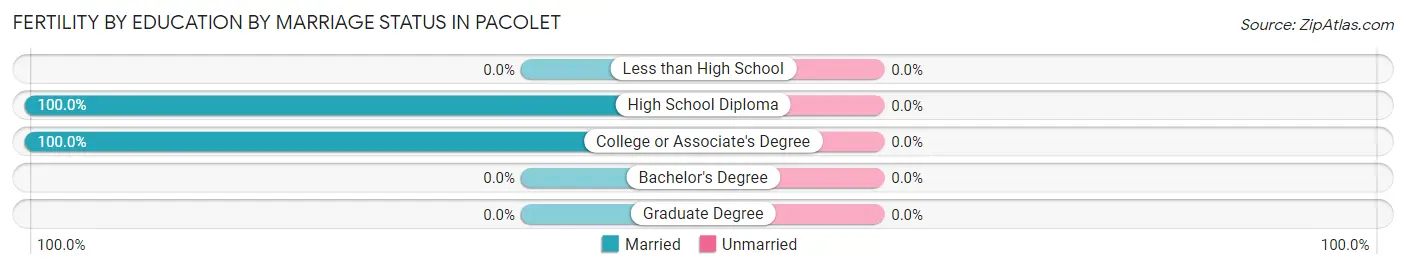
| Educational Attainment | Married | Unmarried |
| Less than High School | 0 (0.0%) | 0 (0.0%) |
| High School Diploma | 6 (100.0%) | 0 (0.0%) |
| College or Associate's Degree | 4 (100.0%) | 0 (0.0%) |
| Bachelor's Degree | 0 (0.0%) | 0 (0.0%) |
| Graduate Degree | 0 (0.0%) | 0 (0.0%) |
| Total | 10 (100.0%) | 0 (0.0%) |
Employment Characteristics in Pacolet
Employment by Class of Employer in Pacolet
Among the 858 employed individuals in Pacolet, private company employees (680 | 79.2%), local government employees (99 | 11.5%), and not-for-profit organizations (39 | 4.5%) make up the most common classes of employment.
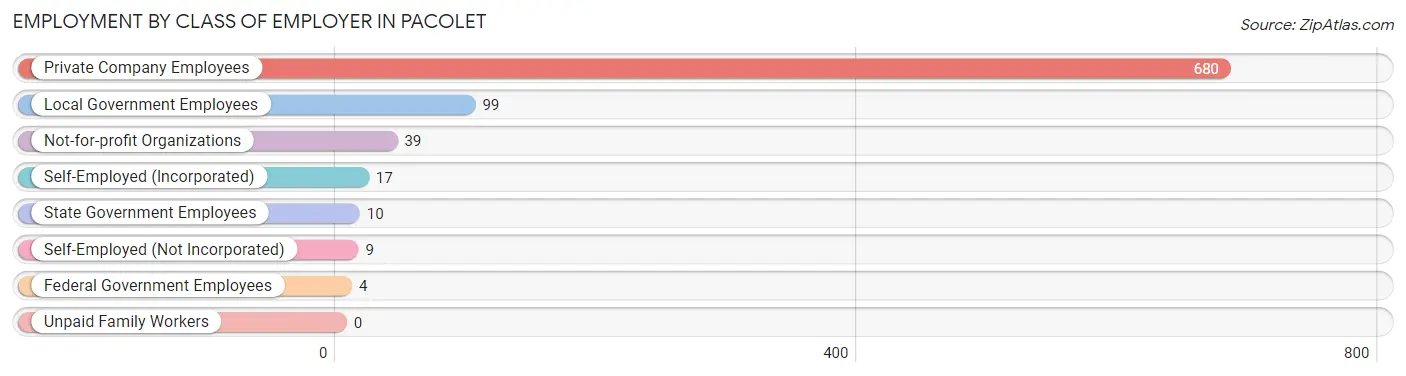
| Employer Class | # Employees | % Employees |
| Private Company Employees | 680 | 79.2% |
| Self-Employed (Incorporated) | 17 | 2.0% |
| Self-Employed (Not Incorporated) | 9 | 1.1% |
| Not-for-profit Organizations | 39 | 4.5% |
| Local Government Employees | 99 | 11.5% |
| State Government Employees | 10 | 1.2% |
| Federal Government Employees | 4 | 0.5% |
| Unpaid Family Workers | 0 | 0.0% |
| Total | 858 | 100.0% |
Employment Status by Age in Pacolet
According to the labor force statistics for Pacolet, out of the total population over 16 years of age (1,670), 55.3% or 924 individuals are in the labor force, with 7.0% or 65 of them unemployed. The age group with the highest labor force participation rate is 20 to 24 years, with 92.9% or 65 individuals in the labor force. Within the labor force, the 16 to 19 years age range has the highest percentage of unemployed individuals, with 29.4% or 15 of them being unemployed.
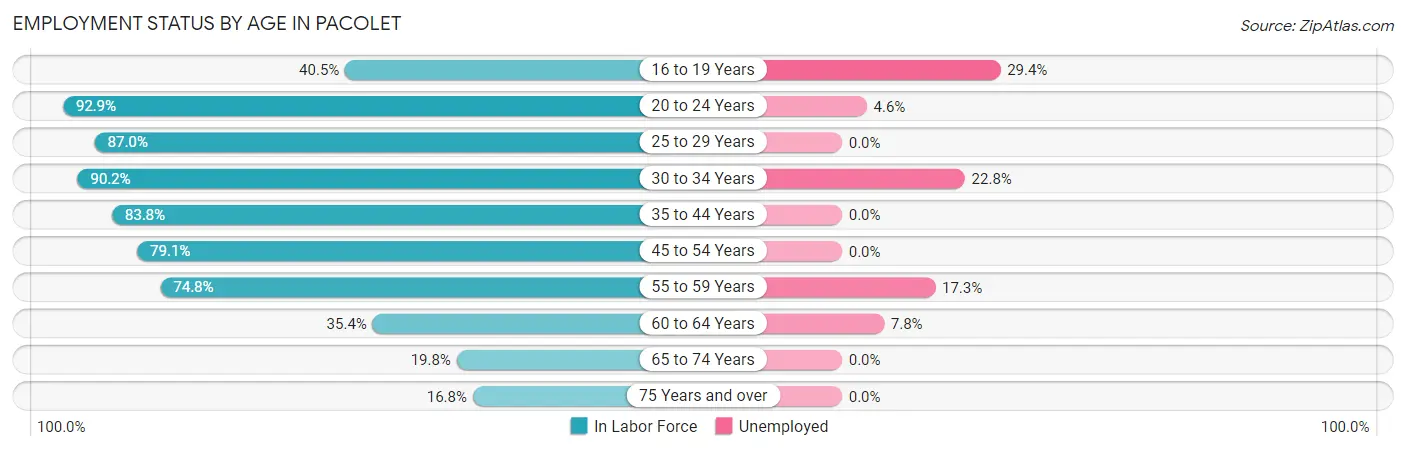
| Age Bracket | In Labor Force | Unemployed |
| 16 to 19 Years | 51 (40.5%) | 15 (29.4%) |
| 20 to 24 Years | 65 (92.9%) | 3 (4.6%) |
| 25 to 29 Years | 100 (87.0%) | 0 (0.0%) |
| 30 to 34 Years | 101 (90.2%) | 23 (22.8%) |
| 35 to 44 Years | 181 (83.8%) | 0 (0.0%) |
| 45 to 54 Years | 159 (79.1%) | 0 (0.0%) |
| 55 to 59 Years | 110 (74.8%) | 19 (17.3%) |
| 60 to 64 Years | 64 (35.4%) | 5 (7.8%) |
| 65 to 74 Years | 50 (19.8%) | 0 (0.0%) |
| 75 Years and over | 42 (16.8%) | 0 (0.0%) |
| Total | 924 (55.3%) | 65 (7.0%) |
Employment Status by Educational Attainment in Pacolet
According to labor force statistics for Pacolet, 73.6% of individuals (715) out of the total population between 25 and 64 years of age (972) are in the labor force, with 6.6% or 47 of them being unemployed. The group with the highest labor force participation rate are those with the educational attainment of college / associate degree, with 89.6% or 285 individuals in the labor force. Within the labor force, individuals with high school diploma education have the highest percentage of unemployment, with 9.1% or 22 of them being unemployed.
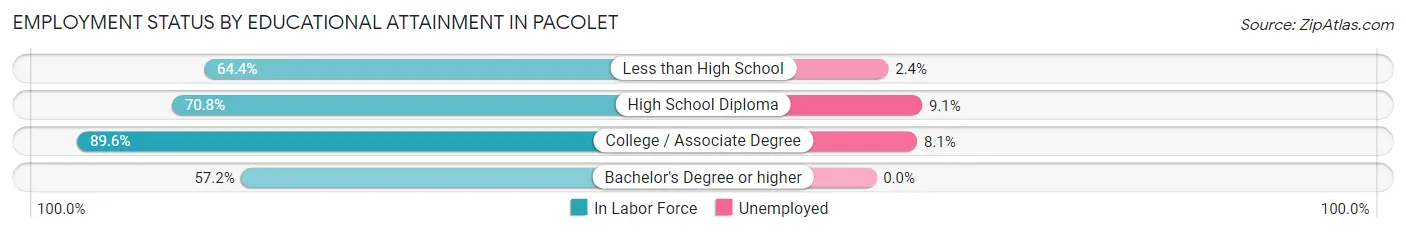
| Educational Attainment | In Labor Force | Unemployed |
| Less than High School | 85 (64.4%) | 3 (2.4%) |
| High School Diploma | 242 (70.8%) | 31 (9.1%) |
| College / Associate Degree | 285 (89.6%) | 26 (8.1%) |
| Bachelor's Degree or higher | 103 (57.2%) | 0 (0.0%) |
| Total | 715 (73.6%) | 64 (6.6%) |
Employment Occupations by Sex in Pacolet
Management, Business, Science and Arts Occupations
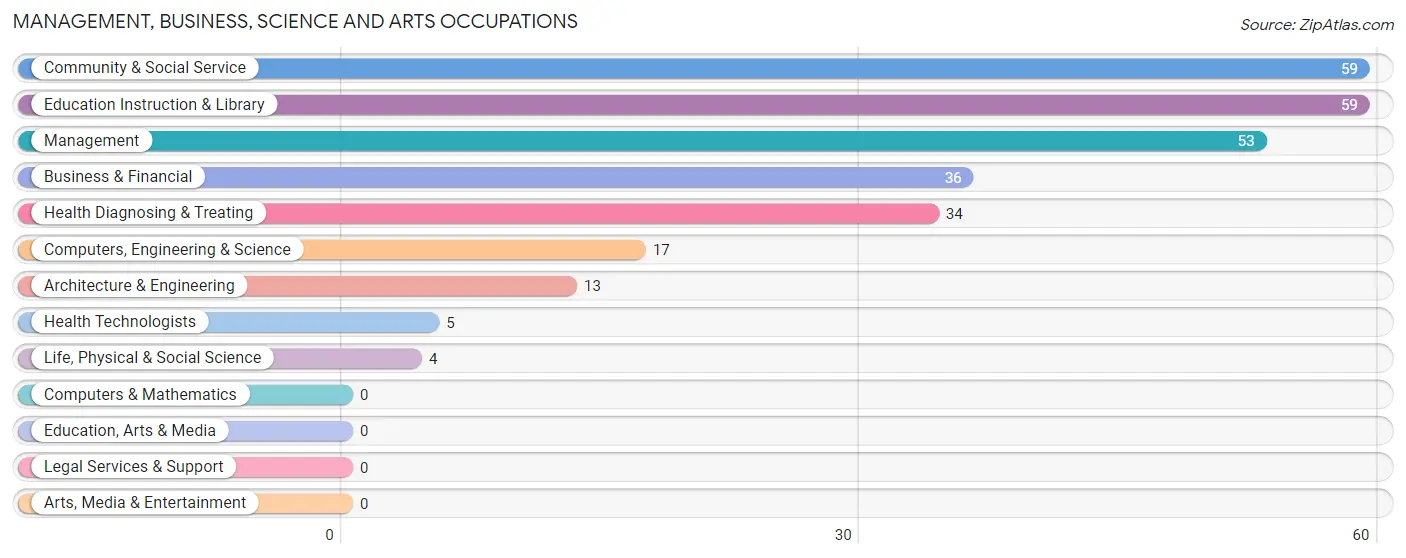
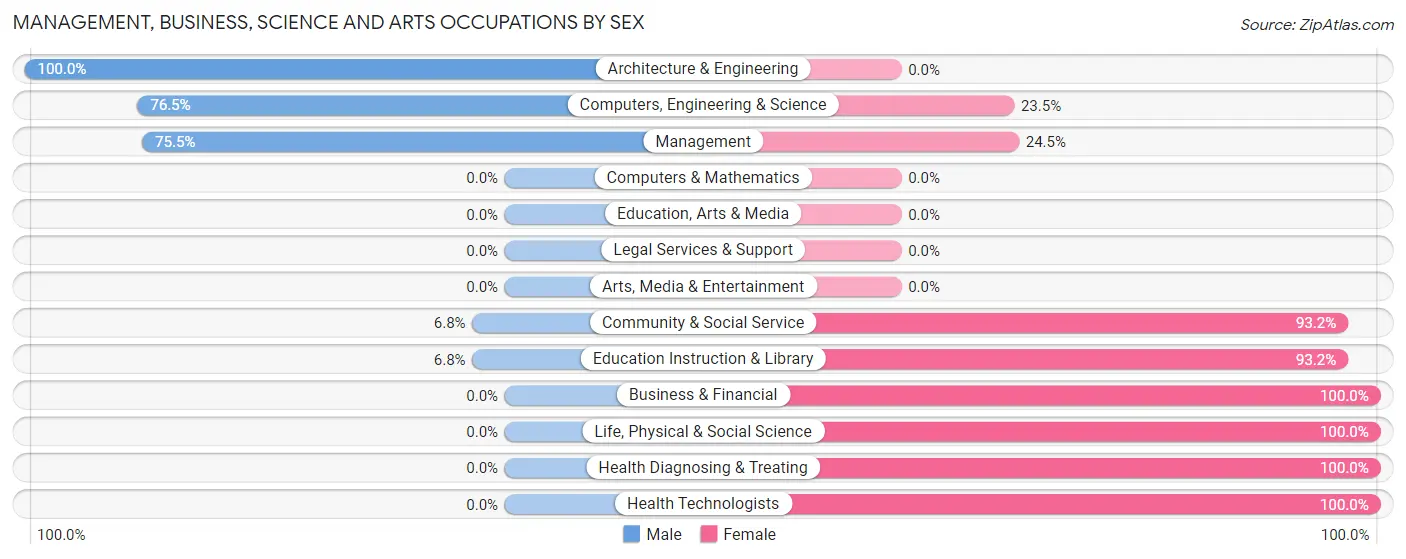
The most common Management, Business, Science and Arts occupations in Pacolet are Community & Social Service (59 | 6.9%), Education Instruction & Library (59 | 6.9%), Management (53 | 6.2%), Business & Financial (36 | 4.2%), and Health Diagnosing & Treating (34 | 4.0%).
Management, Business, Science and Arts Occupations by Sex
Within the Management, Business, Science and Arts occupations in Pacolet, the most male-oriented occupations are Architecture & Engineering (100.0%), Computers, Engineering & Science (76.5%), and Management (75.5%), while the most female-oriented occupations are Business & Financial (100.0%), Life, Physical & Social Science (100.0%), and Health Diagnosing & Treating (100.0%).
| Occupation | Male | Female |
| Management | 40 (75.5%) | 13 (24.5%) |
| Business & Financial | 0 (0.0%) | 36 (100.0%) |
| Computers, Engineering & Science | 13 (76.5%) | 4 (23.5%) |
| Computers & Mathematics | 0 (0.0%) | 0 (0.0%) |
| Architecture & Engineering | 13 (100.0%) | 0 (0.0%) |
| Life, Physical & Social Science | 0 (0.0%) | 4 (100.0%) |
| Community & Social Service | 4 (6.8%) | 55 (93.2%) |
| Education, Arts & Media | 0 (0.0%) | 0 (0.0%) |
| Legal Services & Support | 0 (0.0%) | 0 (0.0%) |
| Education Instruction & Library | 4 (6.8%) | 55 (93.2%) |
| Arts, Media & Entertainment | 0 (0.0%) | 0 (0.0%) |
| Health Diagnosing & Treating | 0 (0.0%) | 34 (100.0%) |
| Health Technologists | 0 (0.0%) | 5 (100.0%) |
| Total (Category) | 57 (28.6%) | 142 (71.4%) |
| Total (Overall) | 394 (45.9%) | 464 (54.1%) |
Services Occupations
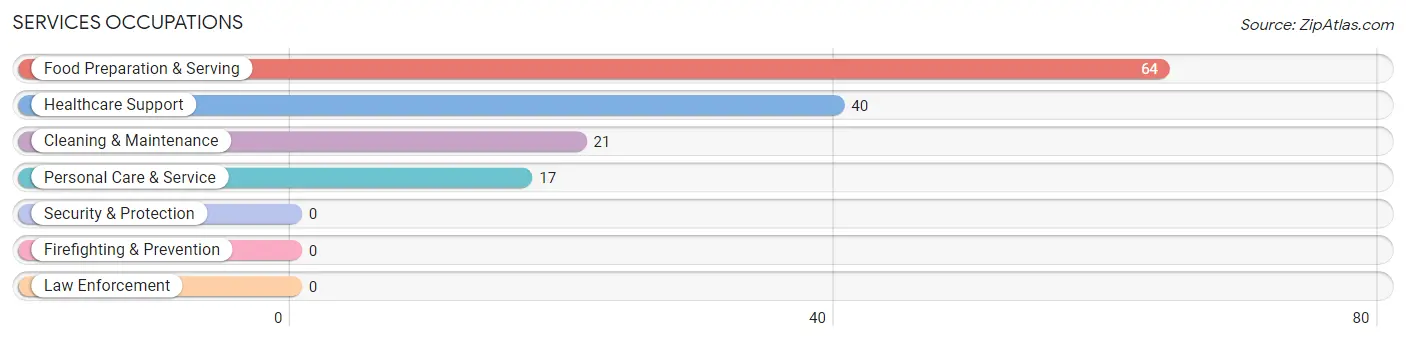
The most common Services occupations in Pacolet are Food Preparation & Serving (64 | 7.5%), Healthcare Support (40 | 4.7%), Cleaning & Maintenance (21 | 2.5%), and Personal Care & Service (17 | 2.0%).
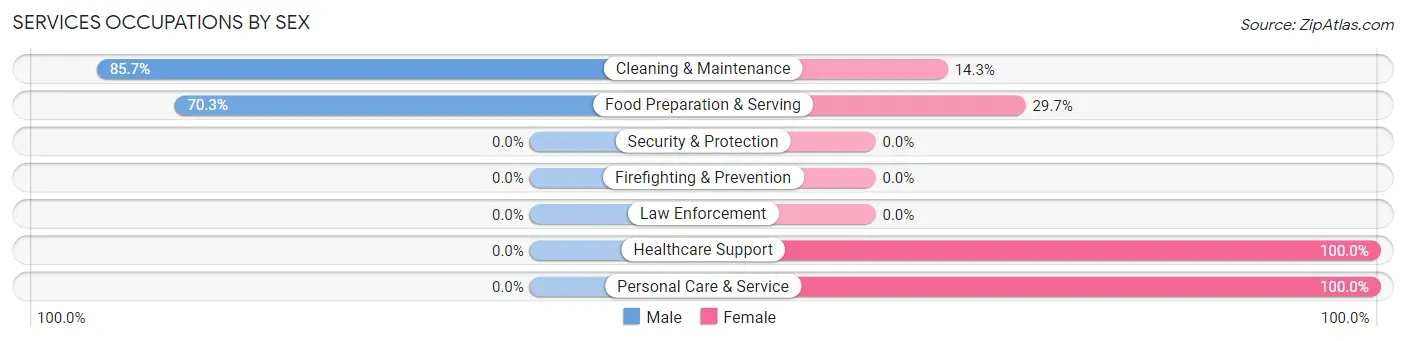
Services Occupations by Sex
Within the Services occupations in Pacolet, the most male-oriented occupations are Cleaning & Maintenance (85.7%), and Food Preparation & Serving (70.3%), while the most female-oriented occupations are Healthcare Support (100.0%), Personal Care & Service (100.0%), and Food Preparation & Serving (29.7%).
| Occupation | Male | Female |
| Healthcare Support | 0 (0.0%) | 40 (100.0%) |
| Security & Protection | 0 (0.0%) | 0 (0.0%) |
| Firefighting & Prevention | 0 (0.0%) | 0 (0.0%) |
| Law Enforcement | 0 (0.0%) | 0 (0.0%) |
| Food Preparation & Serving | 45 (70.3%) | 19 (29.7%) |
| Cleaning & Maintenance | 18 (85.7%) | 3 (14.3%) |
| Personal Care & Service | 0 (0.0%) | 17 (100.0%) |
| Total (Category) | 63 (44.4%) | 79 (55.6%) |
| Total (Overall) | 394 (45.9%) | 464 (54.1%) |
Sales and Office Occupations
The most common Sales and Office occupations in Pacolet are Office & Administration (110 | 12.8%), and Sales & Related (90 | 10.5%).

Sales and Office Occupations by Sex

| Occupation | Male | Female |
| Sales & Related | 42 (46.7%) | 48 (53.3%) |
| Office & Administration | 15 (13.6%) | 95 (86.4%) |
| Total (Category) | 57 (28.5%) | 143 (71.5%) |
| Total (Overall) | 394 (45.9%) | 464 (54.1%) |
Natural Resources, Construction and Maintenance Occupations
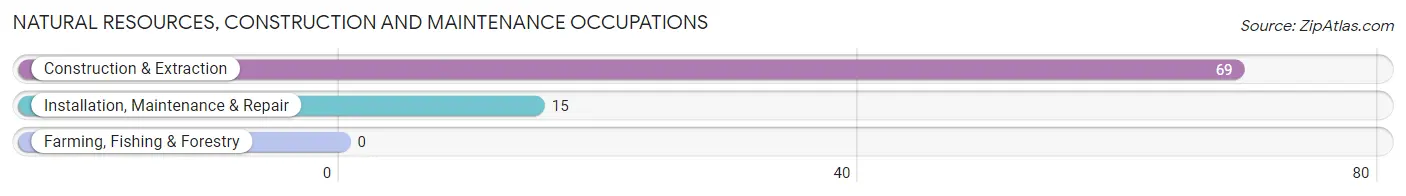
The most common Natural Resources, Construction and Maintenance occupations in Pacolet are Construction & Extraction (69 | 8.0%), and Installation, Maintenance & Repair (15 | 1.8%).
Natural Resources, Construction and Maintenance Occupations by Sex
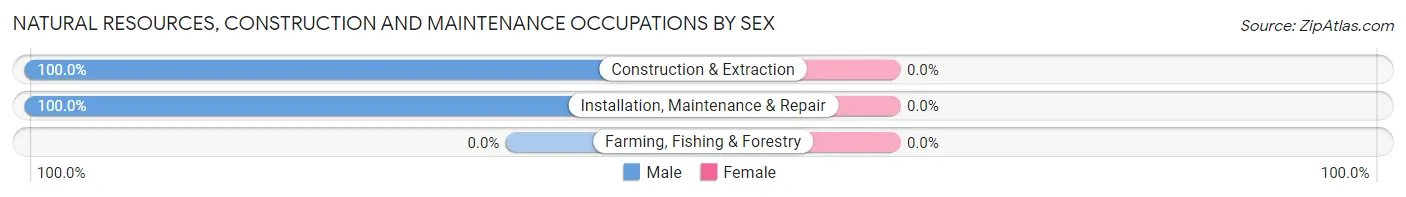
| Occupation | Male | Female |
| Farming, Fishing & Forestry | 0 (0.0%) | 0 (0.0%) |
| Construction & Extraction | 69 (100.0%) | 0 (0.0%) |
| Installation, Maintenance & Repair | 15 (100.0%) | 0 (0.0%) |
| Total (Category) | 84 (100.0%) | 0 (0.0%) |
| Total (Overall) | 394 (45.9%) | 464 (54.1%) |
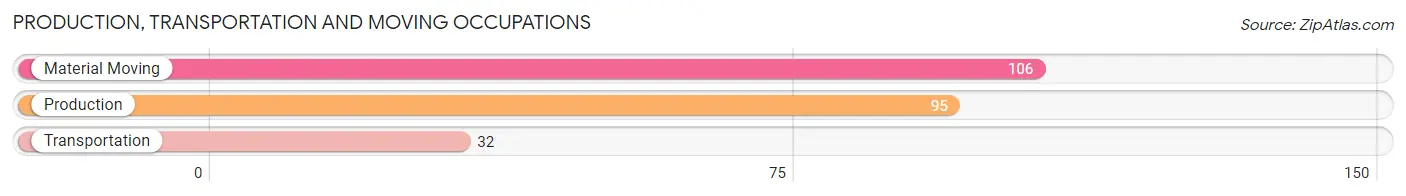
Production, Transportation and Moving Occupations
The most common Production, Transportation and Moving occupations in Pacolet are Material Moving (106 | 12.3%), Production (95 | 11.1%), and Transportation (32 | 3.7%).
Production, Transportation and Moving Occupations by Sex
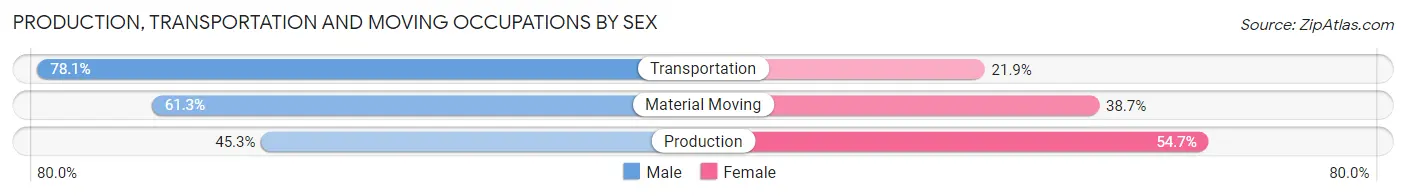
| Occupation | Male | Female |
| Production | 43 (45.3%) | 52 (54.7%) |
| Transportation | 25 (78.1%) | 7 (21.9%) |
| Material Moving | 65 (61.3%) | 41 (38.7%) |
| Total (Category) | 133 (57.1%) | 100 (42.9%) |
| Total (Overall) | 394 (45.9%) | 464 (54.1%) |
Employment Industries by Sex in Pacolet
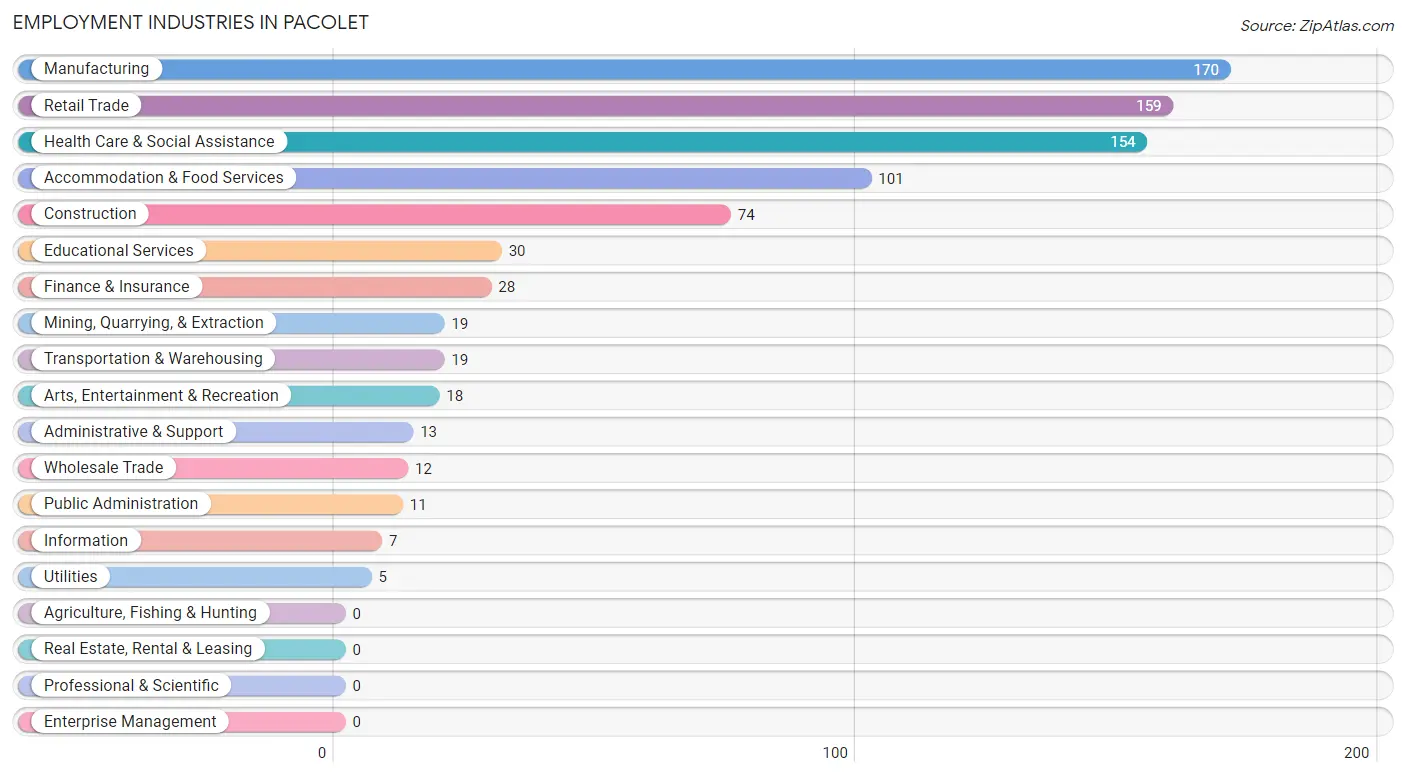
Employment Industries in Pacolet
The major employment industries in Pacolet include Manufacturing (170 | 19.8%), Retail Trade (159 | 18.5%), Health Care & Social Assistance (154 | 17.9%), Accommodation & Food Services (101 | 11.8%), and Construction (74 | 8.6%).
Employment Industries by Sex in Pacolet
The Pacolet industries that see more men than women are Mining, Quarrying, & Extraction (100.0%), Utilities (100.0%), and Administrative & Support (100.0%), whereas the industries that tend to have a higher number of women are Information (100.0%), Finance & Insurance (100.0%), and Health Care & Social Assistance (88.3%).
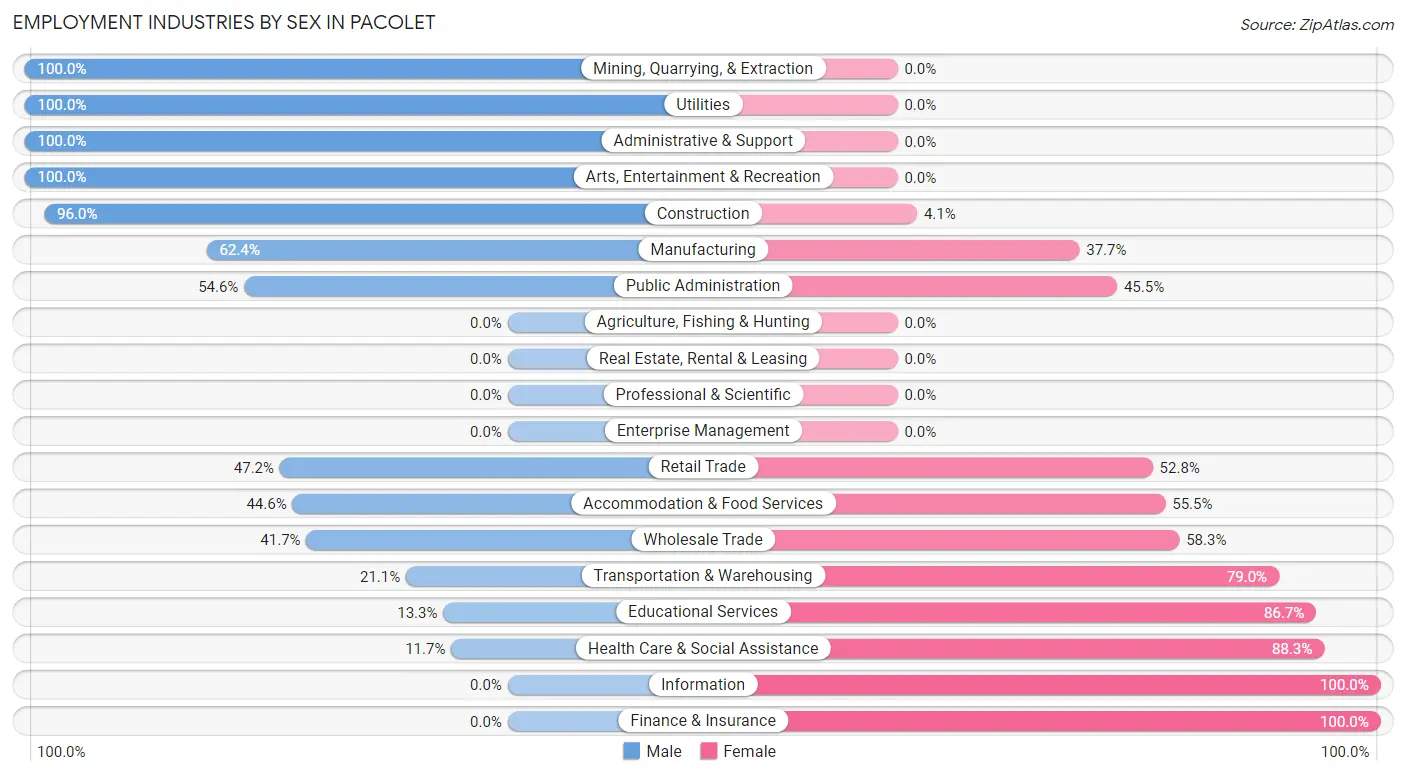
| Industry | Male | Female |
| Agriculture, Fishing & Hunting | 0 (0.0%) | 0 (0.0%) |
| Mining, Quarrying, & Extraction | 19 (100.0%) | 0 (0.0%) |
| Construction | 71 (96.0%) | 3 (4.1%) |
| Manufacturing | 106 (62.4%) | 64 (37.7%) |
| Wholesale Trade | 5 (41.7%) | 7 (58.3%) |
| Retail Trade | 75 (47.2%) | 84 (52.8%) |
| Transportation & Warehousing | 4 (21.0%) | 15 (78.9%) |
| Utilities | 5 (100.0%) | 0 (0.0%) |
| Information | 0 (0.0%) | 7 (100.0%) |
| Finance & Insurance | 0 (0.0%) | 28 (100.0%) |
| Real Estate, Rental & Leasing | 0 (0.0%) | 0 (0.0%) |
| Professional & Scientific | 0 (0.0%) | 0 (0.0%) |
| Enterprise Management | 0 (0.0%) | 0 (0.0%) |
| Administrative & Support | 13 (100.0%) | 0 (0.0%) |
| Educational Services | 4 (13.3%) | 26 (86.7%) |
| Health Care & Social Assistance | 18 (11.7%) | 136 (88.3%) |
| Arts, Entertainment & Recreation | 18 (100.0%) | 0 (0.0%) |
| Accommodation & Food Services | 45 (44.6%) | 56 (55.4%) |
| Public Administration | 6 (54.5%) | 5 (45.5%) |
| Total | 394 (45.9%) | 464 (54.1%) |
Education in Pacolet
School Enrollment in Pacolet
The most common levels of schooling among the 374 students in Pacolet are high school (147 | 39.3%), elementary school (74 | 19.8%), and college / undergraduate (57 | 15.2%).
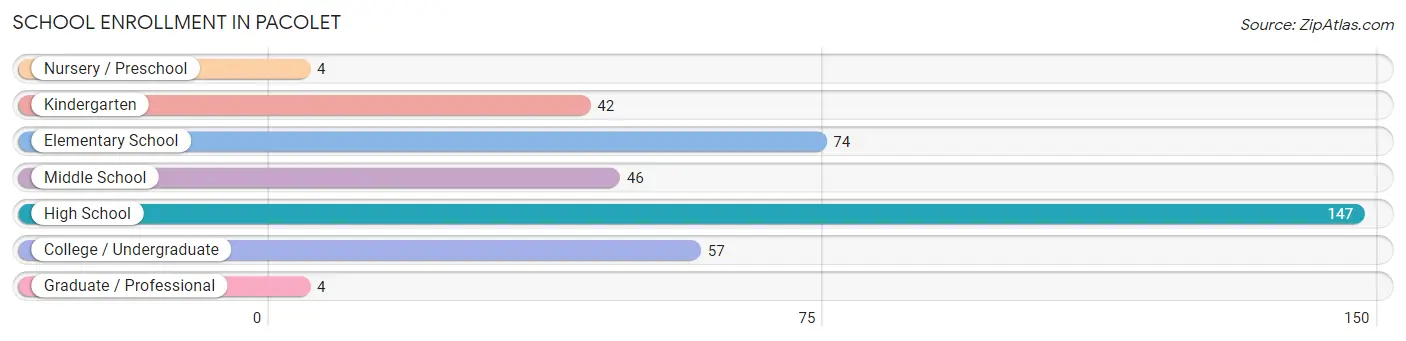
| School Level | # Students | % Students |
| Nursery / Preschool | 4 | 1.1% |
| Kindergarten | 42 | 11.2% |
| Elementary School | 74 | 19.8% |
| Middle School | 46 | 12.3% |
| High School | 147 | 39.3% |
| College / Undergraduate | 57 | 15.2% |
| Graduate / Professional | 4 | 1.1% |
| Total | 374 | 100.0% |
School Enrollment by Age by Funding Source in Pacolet
Out of a total of 374 students who are enrolled in schools in Pacolet, 4 (1.1%) attend a private institution, while the remaining 370 (98.9%) are enrolled in public schools. The age group of 5 to 9 year old has the highest likelihood of being enrolled in private schools, with 4 (3.6% in the age bracket) enrolled. Conversely, the age group of 3 to 4 year olds has the lowest likelihood of being enrolled in a private school, with 4 (100.0% in the age bracket) attending a public institution.
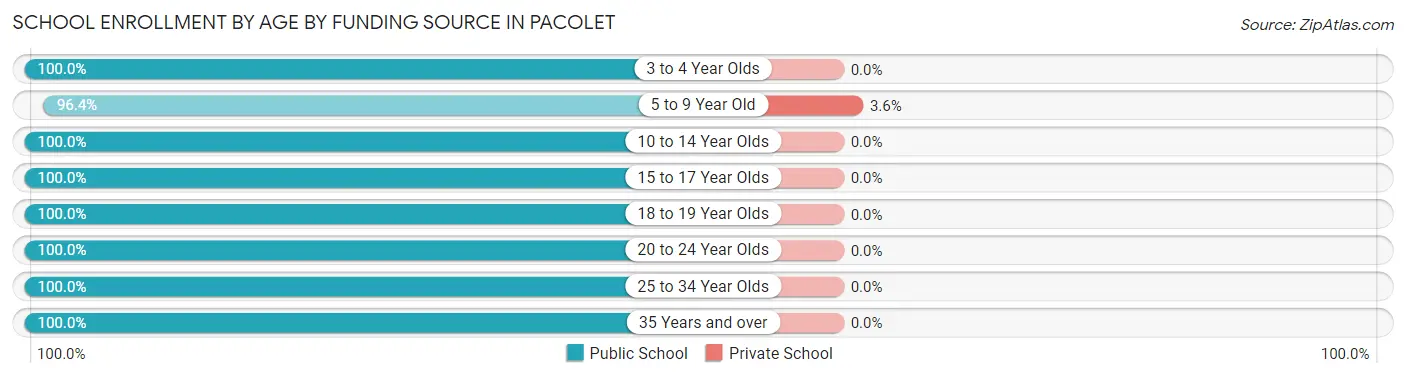
| Age Bracket | Public School | Private School |
| 3 to 4 Year Olds | 4 (100.0%) | 0 (0.0%) |
| 5 to 9 Year Old | 107 (96.4%) | 4 (3.6%) |
| 10 to 14 Year Olds | 69 (100.0%) | 0 (0.0%) |
| 15 to 17 Year Olds | 94 (100.0%) | 0 (0.0%) |
| 18 to 19 Year Olds | 50 (100.0%) | 0 (0.0%) |
| 20 to 24 Year Olds | 21 (100.0%) | 0 (0.0%) |
| 25 to 34 Year Olds | 19 (100.0%) | 0 (0.0%) |
| 35 Years and over | 6 (100.0%) | 0 (0.0%) |
| Total | 370 (98.9%) | 4 (1.1%) |
Educational Attainment by Field of Study in Pacolet
Business (133 | 53.8%), education (59 | 23.9%), science & technology (21 | 8.5%), visual & performing arts (9 | 3.6%), and computers & mathematics (8 | 3.2%) are the most common fields of study among 247 individuals in Pacolet who have obtained a bachelor's degree or higher.
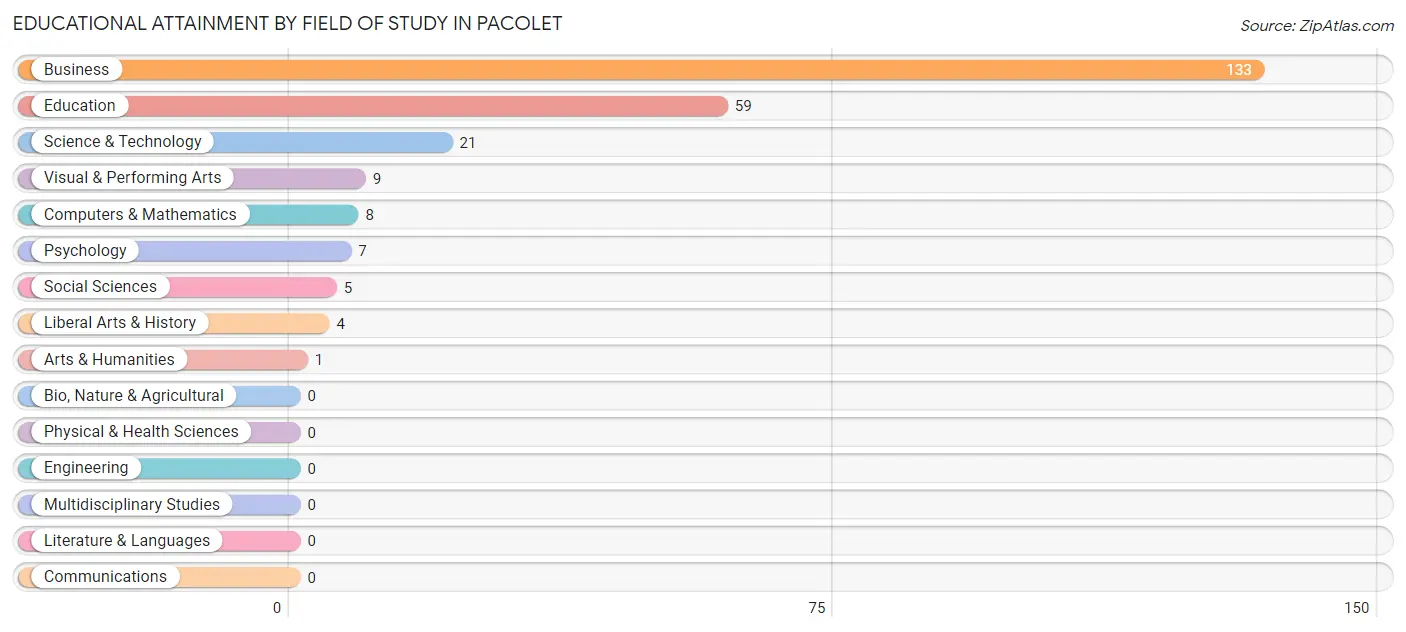
| Field of Study | # Graduates | % Graduates |
| Computers & Mathematics | 8 | 3.2% |
| Bio, Nature & Agricultural | 0 | 0.0% |
| Physical & Health Sciences | 0 | 0.0% |
| Psychology | 7 | 2.8% |
| Social Sciences | 5 | 2.0% |
| Engineering | 0 | 0.0% |
| Multidisciplinary Studies | 0 | 0.0% |
| Science & Technology | 21 | 8.5% |
| Business | 133 | 53.8% |
| Education | 59 | 23.9% |
| Literature & Languages | 0 | 0.0% |
| Liberal Arts & History | 4 | 1.6% |
| Visual & Performing Arts | 9 | 3.6% |
| Communications | 0 | 0.0% |
| Arts & Humanities | 1 | 0.4% |
| Total | 247 | 100.0% |
Transportation & Commute in Pacolet
Vehicle Availability by Sex in Pacolet
The most prevalent vehicle ownership categories in Pacolet are males with 2 vehicles (183, accounting for 46.8%) and females with 2 vehicles (194, making up 39.4%).
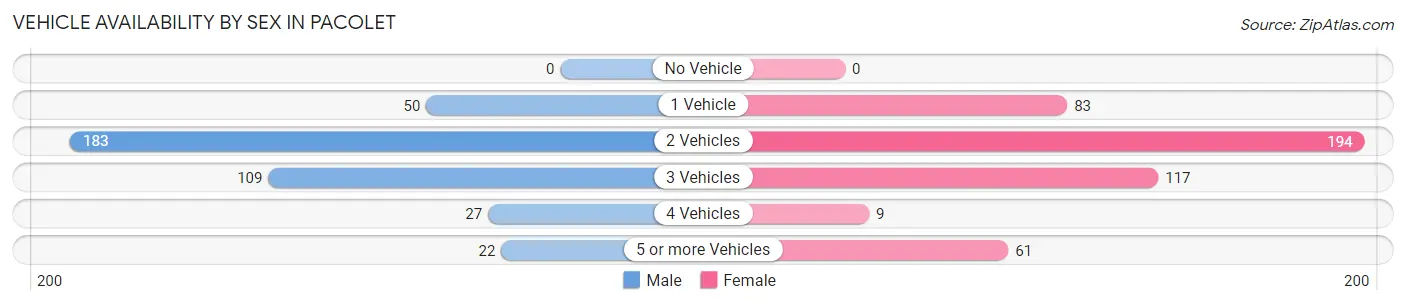
| Vehicles Available | Male | Female |
| No Vehicle | 0 (0.0%) | 0 (0.0%) |
| 1 Vehicle | 50 (12.8%) | 83 (17.9%) |
| 2 Vehicles | 183 (46.8%) | 194 (41.8%) |
| 3 Vehicles | 109 (27.9%) | 117 (25.2%) |
| 4 Vehicles | 27 (6.9%) | 9 (1.9%) |
| 5 or more Vehicles | 22 (5.6%) | 61 (13.2%) |
| Total | 391 (100.0%) | 464 (100.0%) |
Commute Time in Pacolet
The most frequently occuring commute durations in Pacolet are 20 to 24 minutes (236 commuters, 28.2%), 30 to 34 minutes (116 commuters, 13.8%), and 10 to 14 minutes (91 commuters, 10.9%).
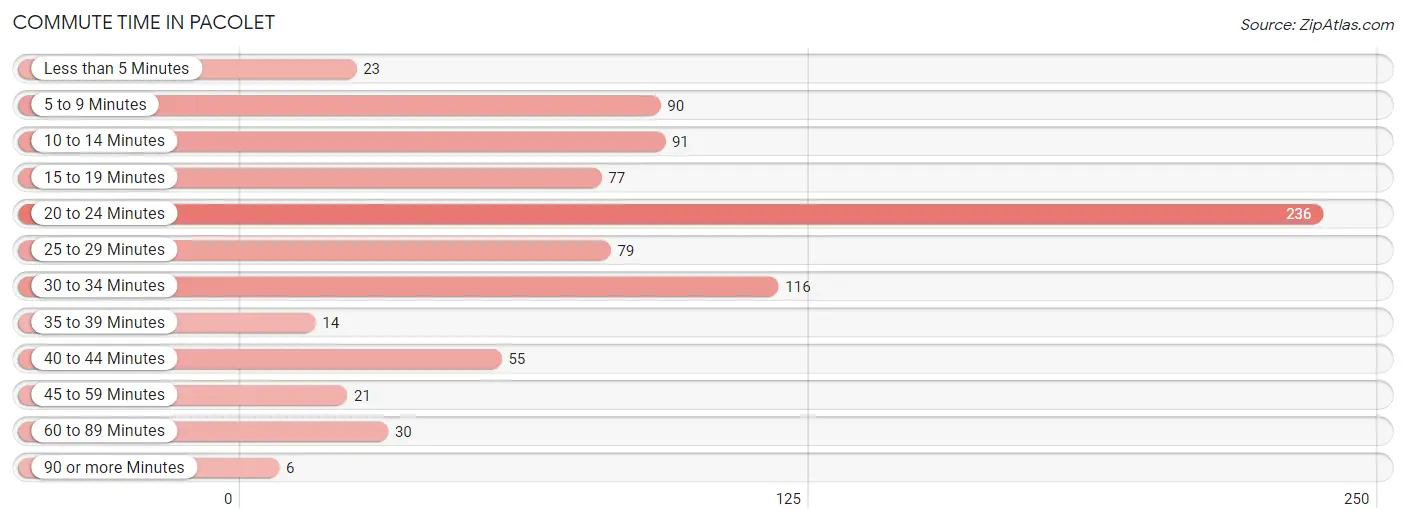
| Commute Time | # Commuters | % Commuters |
| Less than 5 Minutes | 23 | 2.7% |
| 5 to 9 Minutes | 90 | 10.7% |
| 10 to 14 Minutes | 91 | 10.9% |
| 15 to 19 Minutes | 77 | 9.2% |
| 20 to 24 Minutes | 236 | 28.2% |
| 25 to 29 Minutes | 79 | 9.4% |
| 30 to 34 Minutes | 116 | 13.8% |
| 35 to 39 Minutes | 14 | 1.7% |
| 40 to 44 Minutes | 55 | 6.6% |
| 45 to 59 Minutes | 21 | 2.5% |
| 60 to 89 Minutes | 30 | 3.6% |
| 90 or more Minutes | 6 | 0.7% |
Commute Time by Sex in Pacolet
The most common commute times in Pacolet are 20 to 24 minutes (156 commuters, 40.2%) for males and 30 to 34 minutes (99 commuters, 22.0%) for females.
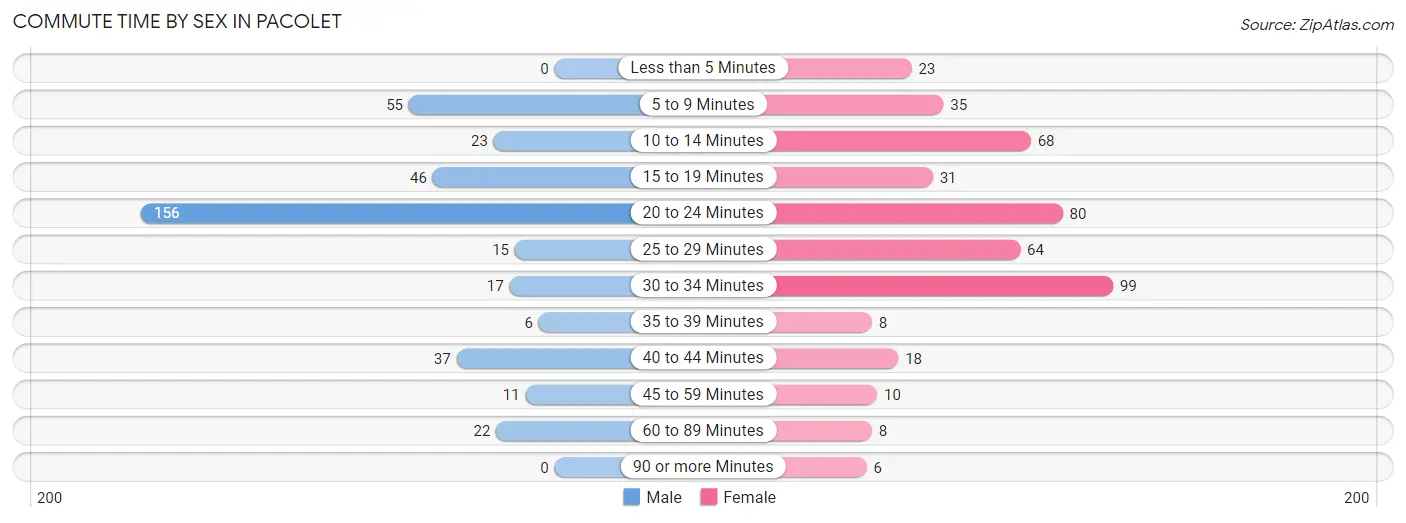
| Commute Time | Male | Female |
| Less than 5 Minutes | 0 (0.0%) | 23 (5.1%) |
| 5 to 9 Minutes | 55 (14.2%) | 35 (7.8%) |
| 10 to 14 Minutes | 23 (5.9%) | 68 (15.1%) |
| 15 to 19 Minutes | 46 (11.9%) | 31 (6.9%) |
| 20 to 24 Minutes | 156 (40.2%) | 80 (17.8%) |
| 25 to 29 Minutes | 15 (3.9%) | 64 (14.2%) |
| 30 to 34 Minutes | 17 (4.4%) | 99 (22.0%) |
| 35 to 39 Minutes | 6 (1.5%) | 8 (1.8%) |
| 40 to 44 Minutes | 37 (9.5%) | 18 (4.0%) |
| 45 to 59 Minutes | 11 (2.8%) | 10 (2.2%) |
| 60 to 89 Minutes | 22 (5.7%) | 8 (1.8%) |
| 90 or more Minutes | 0 (0.0%) | 6 (1.3%) |
Time of Departure to Work by Sex in Pacolet
The most frequent times of departure to work in Pacolet are 4:00 PM to 11:59 PM (70, 18.0%) for males and 7:00 AM to 7:29 AM (91, 20.2%) for females.
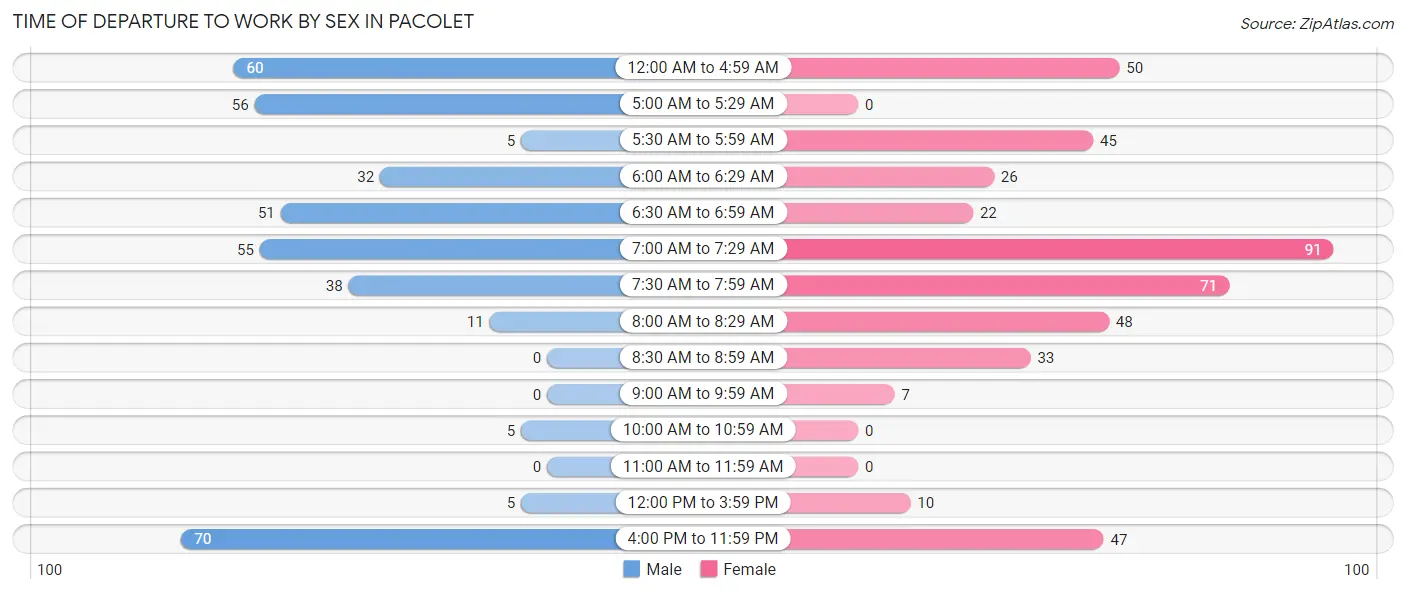
| Time of Departure | Male | Female |
| 12:00 AM to 4:59 AM | 60 (15.5%) | 50 (11.1%) |
| 5:00 AM to 5:29 AM | 56 (14.4%) | 0 (0.0%) |
| 5:30 AM to 5:59 AM | 5 (1.3%) | 45 (10.0%) |
| 6:00 AM to 6:29 AM | 32 (8.3%) | 26 (5.8%) |
| 6:30 AM to 6:59 AM | 51 (13.1%) | 22 (4.9%) |
| 7:00 AM to 7:29 AM | 55 (14.2%) | 91 (20.2%) |
| 7:30 AM to 7:59 AM | 38 (9.8%) | 71 (15.8%) |
| 8:00 AM to 8:29 AM | 11 (2.8%) | 48 (10.7%) |
| 8:30 AM to 8:59 AM | 0 (0.0%) | 33 (7.3%) |
| 9:00 AM to 9:59 AM | 0 (0.0%) | 7 (1.6%) |
| 10:00 AM to 10:59 AM | 5 (1.3%) | 0 (0.0%) |
| 11:00 AM to 11:59 AM | 0 (0.0%) | 0 (0.0%) |
| 12:00 PM to 3:59 PM | 5 (1.3%) | 10 (2.2%) |
| 4:00 PM to 11:59 PM | 70 (18.0%) | 47 (10.4%) |
| Total | 388 (100.0%) | 450 (100.0%) |
Housing Occupancy in Pacolet
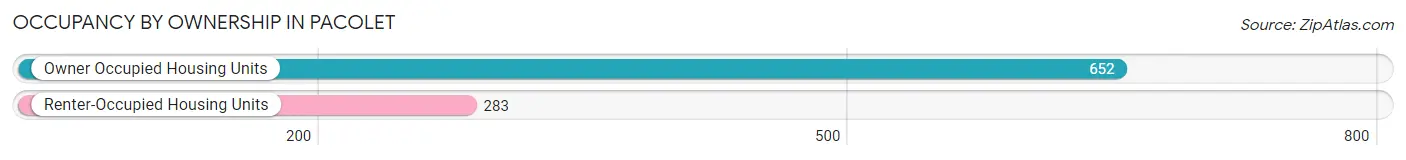
Occupancy by Ownership in Pacolet
Of the total 935 dwellings in Pacolet, owner-occupied units account for 652 (69.7%), while renter-occupied units make up 283 (30.3%).
| Occupancy | # Housing Units | % Housing Units |
| Owner Occupied Housing Units | 652 | 69.7% |
| Renter-Occupied Housing Units | 283 | 30.3% |
| Total Occupied Housing Units | 935 | 100.0% |
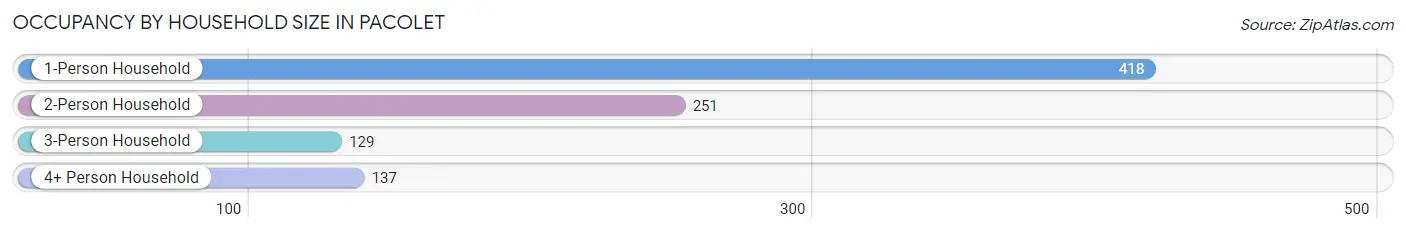
Occupancy by Household Size in Pacolet
| Household Size | # Housing Units | % Housing Units |
| 1-Person Household | 418 | 44.7% |
| 2-Person Household | 251 | 26.8% |
| 3-Person Household | 129 | 13.8% |
| 4+ Person Household | 137 | 14.6% |
| Total Housing Units | 935 | 100.0% |
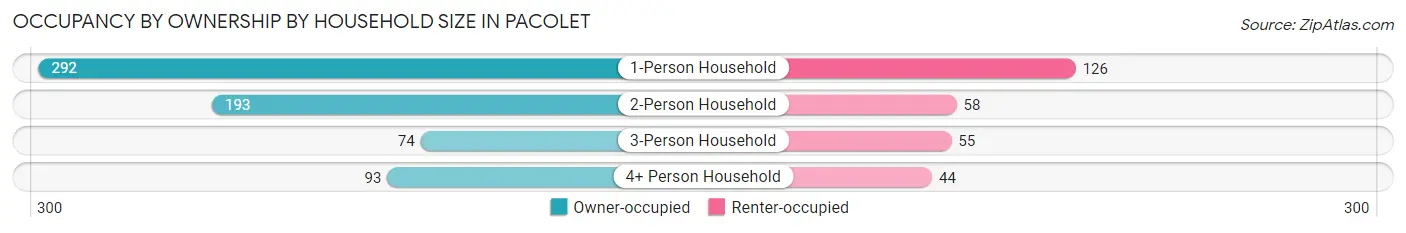
Occupancy by Ownership by Household Size in Pacolet
| Household Size | Owner-occupied | Renter-occupied |
| 1-Person Household | 292 (69.9%) | 126 (30.1%) |
| 2-Person Household | 193 (76.9%) | 58 (23.1%) |
| 3-Person Household | 74 (57.4%) | 55 (42.6%) |
| 4+ Person Household | 93 (67.9%) | 44 (32.1%) |
| Total Housing Units | 652 (69.7%) | 283 (30.3%) |
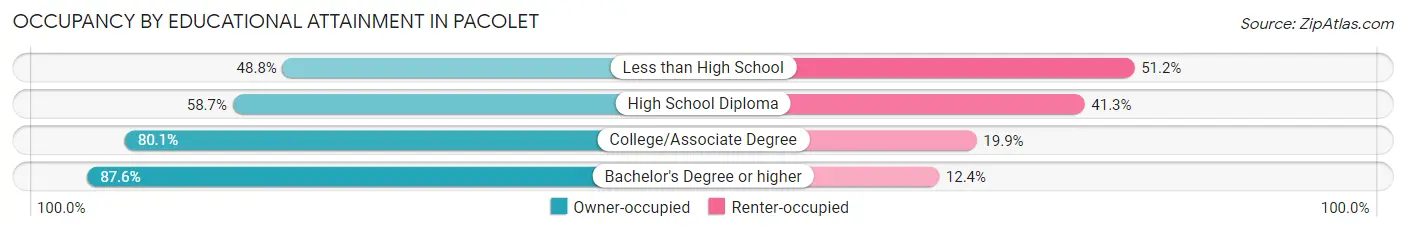
Occupancy by Educational Attainment in Pacolet
| Household Size | Owner-occupied | Renter-occupied |
| Less than High School | 63 (48.8%) | 66 (51.2%) |
| High School Diploma | 192 (58.7%) | 135 (41.3%) |
| College/Associate Degree | 242 (80.1%) | 60 (19.9%) |
| Bachelor's Degree or higher | 155 (87.6%) | 22 (12.4%) |
Occupancy by Age of Householder in Pacolet
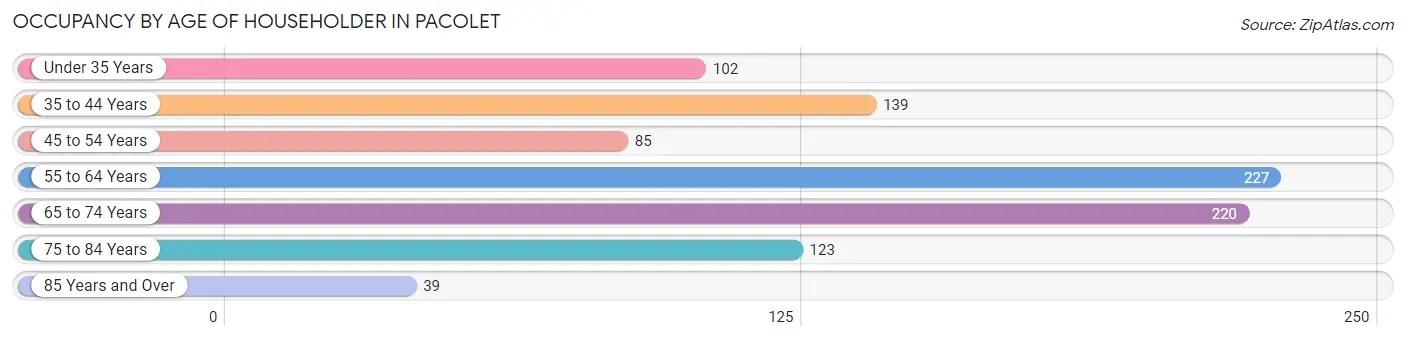
| Age Bracket | # Households | % Households |
| Under 35 Years | 102 | 10.9% |
| 35 to 44 Years | 139 | 14.9% |
| 45 to 54 Years | 85 | 9.1% |
| 55 to 64 Years | 227 | 24.3% |
| 65 to 74 Years | 220 | 23.5% |
| 75 to 84 Years | 123 | 13.2% |
| 85 Years and Over | 39 | 4.2% |
| Total | 935 | 100.0% |
Housing Finances in Pacolet
Median Income by Occupancy in Pacolet
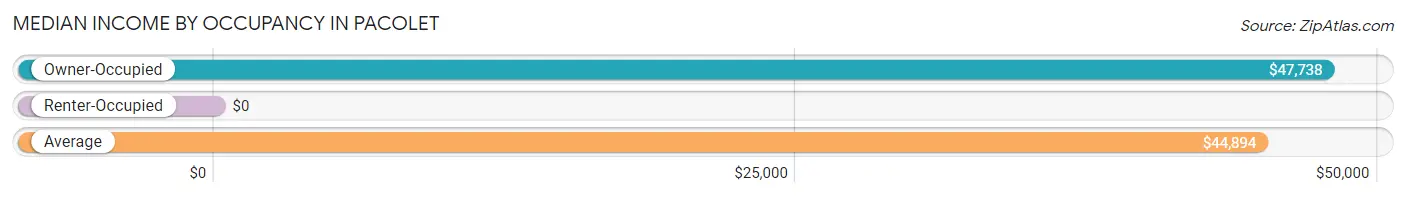
| Occupancy Type | # Households | Median Income |
| Owner-Occupied | 652 (69.7%) | $47,738 |
| Renter-Occupied | 283 (30.3%) | $0 |
| Average | 935 (100.0%) | $44,894 |
Occupancy by Householder Income Bracket in Pacolet
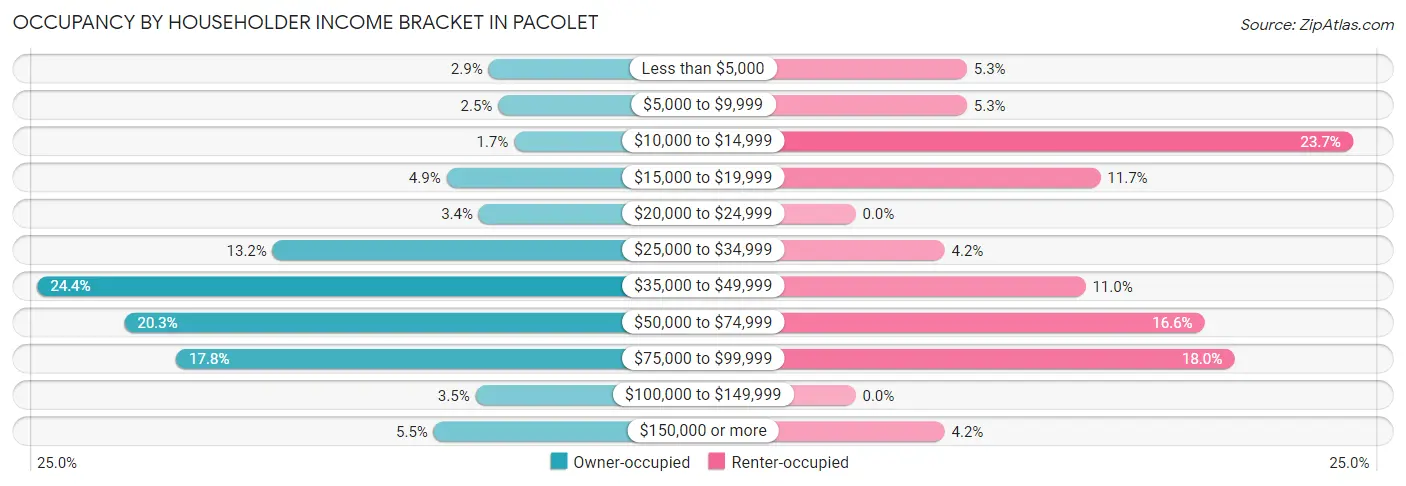
| Income Bracket | Owner-occupied | Renter-occupied |
| Less than $5,000 | 19 (2.9%) | 15 (5.3%) |
| $5,000 to $9,999 | 16 (2.5%) | 15 (5.3%) |
| $10,000 to $14,999 | 11 (1.7%) | 67 (23.7%) |
| $15,000 to $19,999 | 32 (4.9%) | 33 (11.7%) |
| $20,000 to $24,999 | 22 (3.4%) | 0 (0.0%) |
| $25,000 to $34,999 | 86 (13.2%) | 12 (4.2%) |
| $35,000 to $49,999 | 159 (24.4%) | 31 (11.0%) |
| $50,000 to $74,999 | 132 (20.3%) | 47 (16.6%) |
| $75,000 to $99,999 | 116 (17.8%) | 51 (18.0%) |
| $100,000 to $149,999 | 23 (3.5%) | 0 (0.0%) |
| $150,000 or more | 36 (5.5%) | 12 (4.2%) |
| Total | 652 (100.0%) | 283 (100.0%) |
Monthly Housing Cost Tiers in Pacolet

| Monthly Cost | Owner-occupied | Renter-occupied |
| Less than $300 | 115 (17.6%) | 23 (8.1%) |
| $300 to $499 | 301 (46.2%) | 9 (3.2%) |
| $500 to $799 | 95 (14.6%) | 69 (24.4%) |
| $800 to $999 | 56 (8.6%) | 68 (24.0%) |
| $1,000 to $1,499 | 51 (7.8%) | 53 (18.7%) |
| $1,500 to $1,999 | 34 (5.2%) | 0 (0.0%) |
| $2,000 to $2,499 | 0 (0.0%) | 0 (0.0%) |
| $2,500 to $2,999 | 0 (0.0%) | 0 (0.0%) |
| $3,000 or more | 0 (0.0%) | 0 (0.0%) |
| Total | 652 (100.0%) | 283 (100.0%) |
Physical Housing Characteristics in Pacolet
Housing Structures in Pacolet
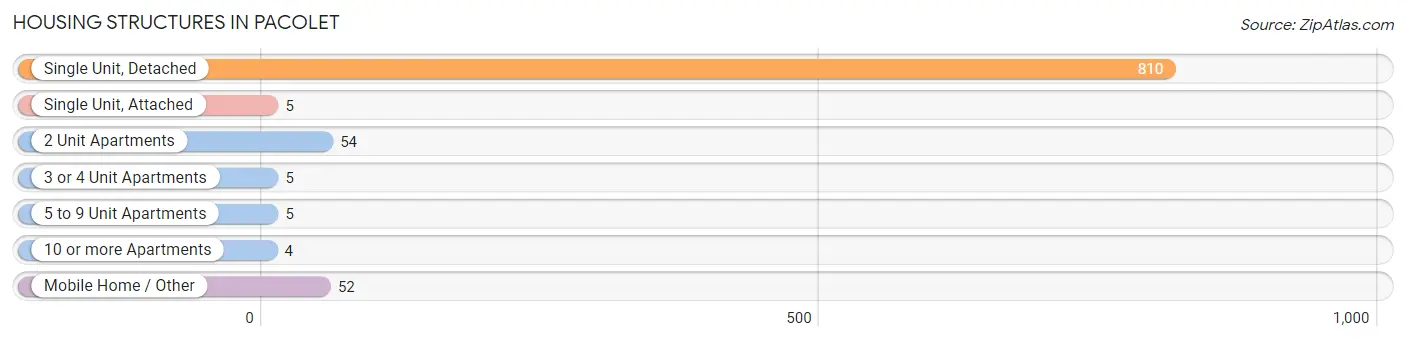
| Structure Type | # Housing Units | % Housing Units |
| Single Unit, Detached | 810 | 86.6% |
| Single Unit, Attached | 5 | 0.5% |
| 2 Unit Apartments | 54 | 5.8% |
| 3 or 4 Unit Apartments | 5 | 0.5% |
| 5 to 9 Unit Apartments | 5 | 0.5% |
| 10 or more Apartments | 4 | 0.4% |
| Mobile Home / Other | 52 | 5.6% |
| Total | 935 | 100.0% |
Housing Structures by Occupancy in Pacolet
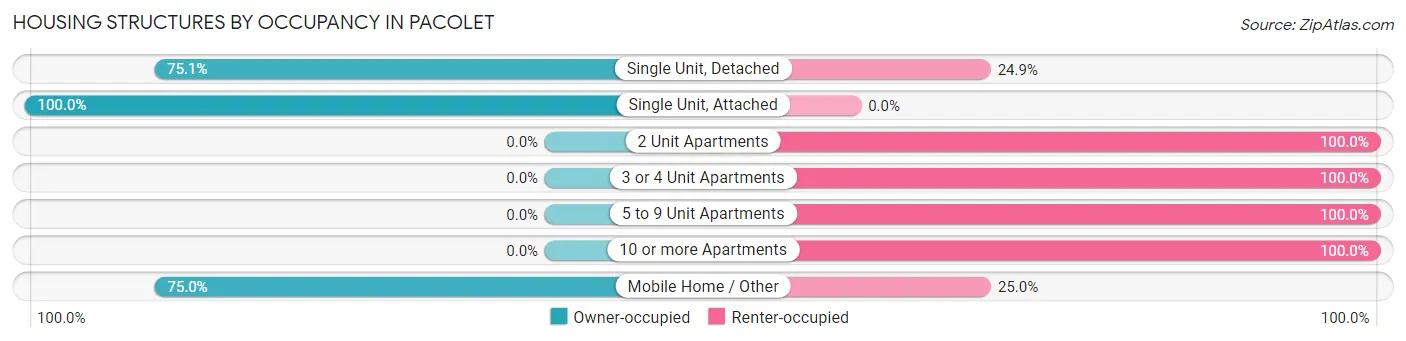
| Structure Type | Owner-occupied | Renter-occupied |
| Single Unit, Detached | 608 (75.1%) | 202 (24.9%) |
| Single Unit, Attached | 5 (100.0%) | 0 (0.0%) |
| 2 Unit Apartments | 0 (0.0%) | 54 (100.0%) |
| 3 or 4 Unit Apartments | 0 (0.0%) | 5 (100.0%) |
| 5 to 9 Unit Apartments | 0 (0.0%) | 5 (100.0%) |
| 10 or more Apartments | 0 (0.0%) | 4 (100.0%) |
| Mobile Home / Other | 39 (75.0%) | 13 (25.0%) |
| Total | 652 (69.7%) | 283 (30.3%) |
Housing Structures by Number of Rooms in Pacolet
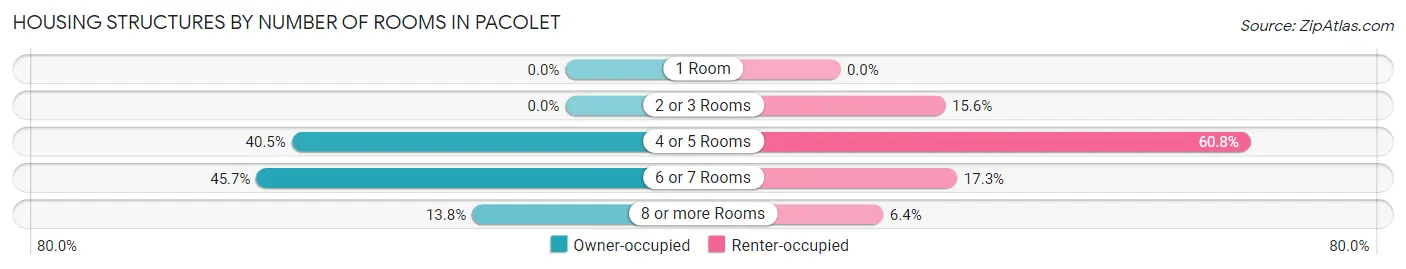
| Number of Rooms | Owner-occupied | Renter-occupied |
| 1 Room | 0 (0.0%) | 0 (0.0%) |
| 2 or 3 Rooms | 0 (0.0%) | 44 (15.5%) |
| 4 or 5 Rooms | 264 (40.5%) | 172 (60.8%) |
| 6 or 7 Rooms | 298 (45.7%) | 49 (17.3%) |
| 8 or more Rooms | 90 (13.8%) | 18 (6.4%) |
| Total | 652 (100.0%) | 283 (100.0%) |
Housing Structure by Heating Type in Pacolet
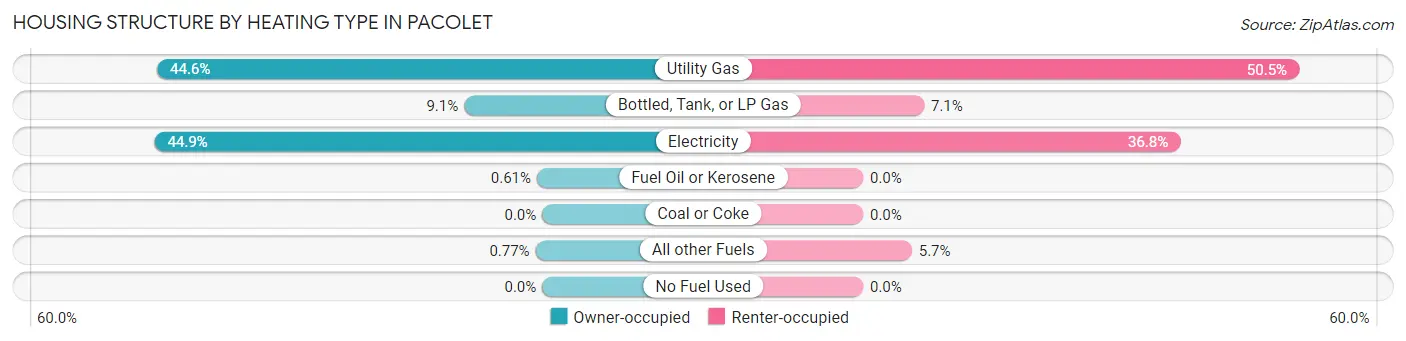
| Heating Type | Owner-occupied | Renter-occupied |
| Utility Gas | 291 (44.6%) | 143 (50.5%) |
| Bottled, Tank, or LP Gas | 59 (9.0%) | 20 (7.1%) |
| Electricity | 293 (44.9%) | 104 (36.7%) |
| Fuel Oil or Kerosene | 4 (0.6%) | 0 (0.0%) |
| Coal or Coke | 0 (0.0%) | 0 (0.0%) |
| All other Fuels | 5 (0.8%) | 16 (5.7%) |
| No Fuel Used | 0 (0.0%) | 0 (0.0%) |
| Total | 652 (100.0%) | 283 (100.0%) |
Household Vehicle Usage in Pacolet
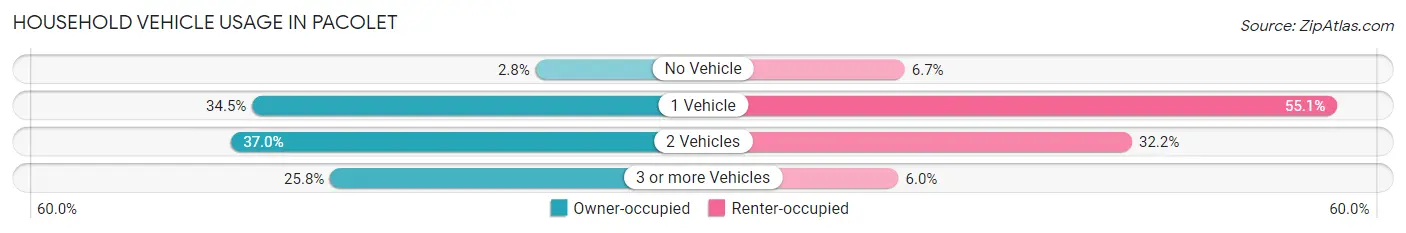
| Vehicles per Household | Owner-occupied | Renter-occupied |
| No Vehicle | 18 (2.8%) | 19 (6.7%) |
| 1 Vehicle | 225 (34.5%) | 156 (55.1%) |
| 2 Vehicles | 241 (37.0%) | 91 (32.2%) |
| 3 or more Vehicles | 168 (25.8%) | 17 (6.0%) |
| Total | 652 (100.0%) | 283 (100.0%) |
Real Estate & Mortgages in Pacolet
Real Estate and Mortgage Overview in Pacolet
| Characteristic | Without Mortgage | With Mortgage |
| Housing Units | 475 | 177 |
| Median Property Value | $89,700 | $103,700 |
| Median Household Income | $40,781 | $31 |
| Monthly Housing Costs | $359 | $0 |
| Real Estate Taxes | $862 | $0 |
Property Value by Mortgage Status in Pacolet
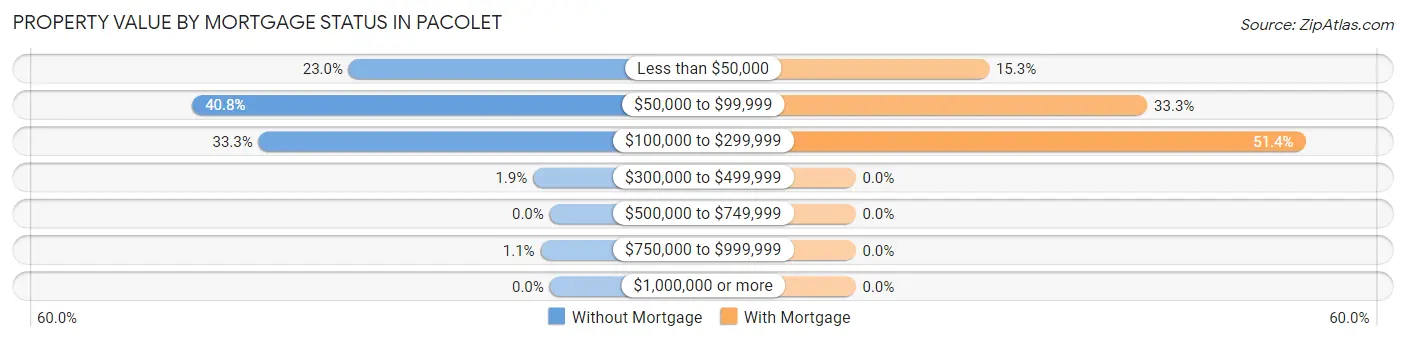
| Property Value | Without Mortgage | With Mortgage |
| Less than $50,000 | 109 (23.0%) | 27 (15.2%) |
| $50,000 to $99,999 | 194 (40.8%) | 59 (33.3%) |
| $100,000 to $299,999 | 158 (33.3%) | 91 (51.4%) |
| $300,000 to $499,999 | 9 (1.9%) | 0 (0.0%) |
| $500,000 to $749,999 | 0 (0.0%) | 0 (0.0%) |
| $750,000 to $999,999 | 5 (1.1%) | 0 (0.0%) |
| $1,000,000 or more | 0 (0.0%) | 0 (0.0%) |
| Total | 475 (100.0%) | 177 (100.0%) |
Household Income by Mortgage Status in Pacolet
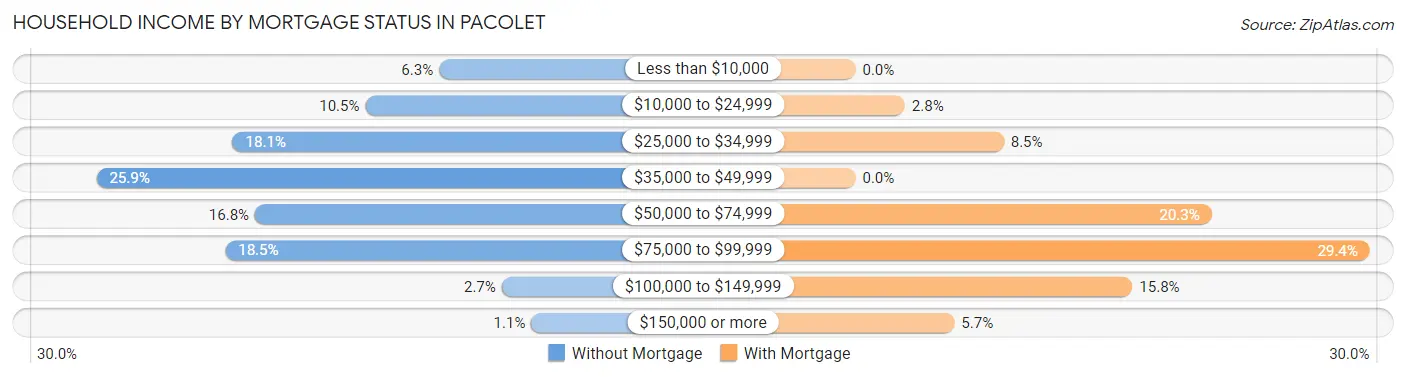
| Household Income | Without Mortgage | With Mortgage |
| Less than $10,000 | 30 (6.3%) | 0 (0.0%) |
| $10,000 to $24,999 | 50 (10.5%) | 5 (2.8%) |
| $25,000 to $34,999 | 86 (18.1%) | 15 (8.5%) |
| $35,000 to $49,999 | 123 (25.9%) | 0 (0.0%) |
| $50,000 to $74,999 | 80 (16.8%) | 36 (20.3%) |
| $75,000 to $99,999 | 88 (18.5%) | 52 (29.4%) |
| $100,000 to $149,999 | 13 (2.7%) | 28 (15.8%) |
| $150,000 or more | 5 (1.1%) | 10 (5.7%) |
| Total | 475 (100.0%) | 177 (100.0%) |
Property Value to Household Income Ratio in Pacolet
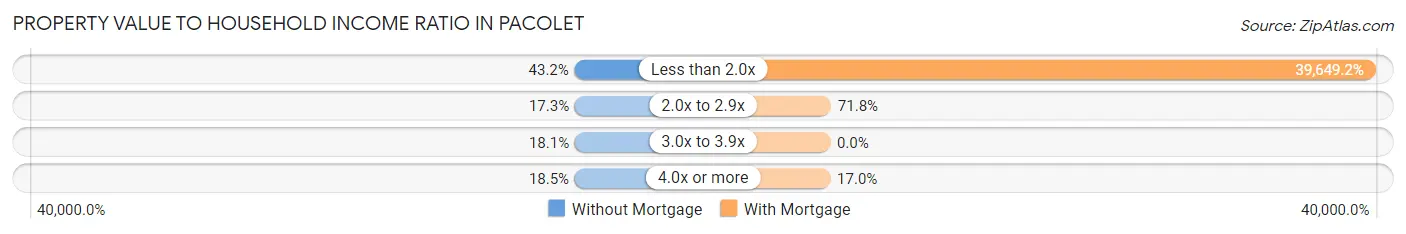
| Value-to-Income Ratio | Without Mortgage | With Mortgage |
| Less than 2.0x | 205 (43.2%) | 70,179 (39,649.1%) |
| 2.0x to 2.9x | 82 (17.3%) | 127 (71.8%) |
| 3.0x to 3.9x | 86 (18.1%) | 0 (0.0%) |
| 4.0x or more | 88 (18.5%) | 30 (17.0%) |
| Total | 475 (100.0%) | 177 (100.0%) |
Real Estate Taxes by Mortgage Status in Pacolet
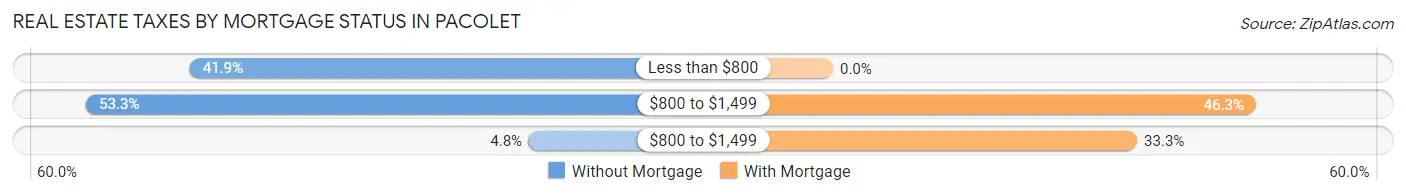
| Property Taxes | Without Mortgage | With Mortgage |
| Less than $800 | 199 (41.9%) | 0 (0.0%) |
| $800 to $1,499 | 253 (53.3%) | 82 (46.3%) |
| $800 to $1,499 | 23 (4.8%) | 59 (33.3%) |
| Total | 475 (100.0%) | 177 (100.0%) |
Health & Disability in Pacolet
Health Insurance Coverage by Age in Pacolet
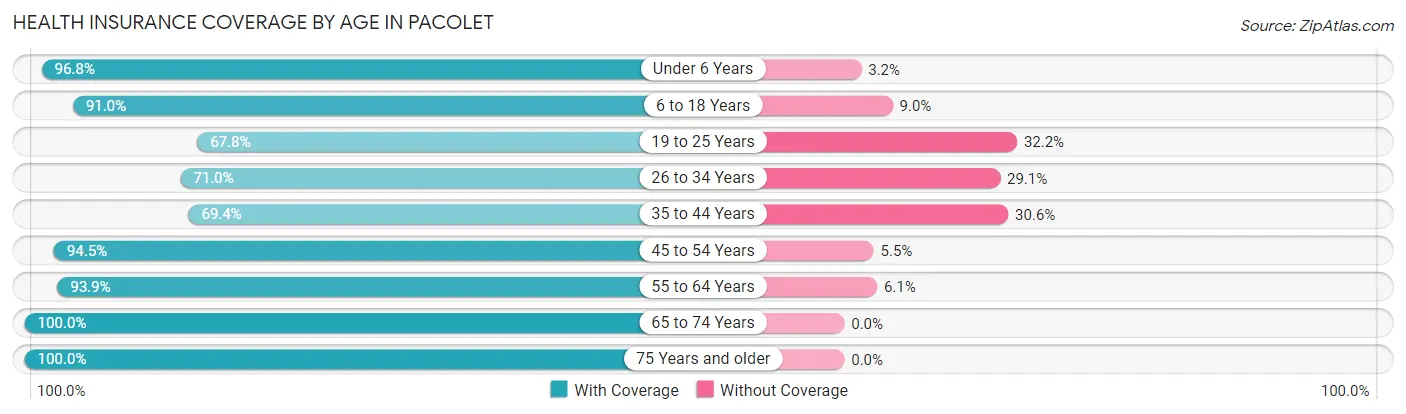
| Age Bracket | With Coverage | Without Coverage |
| Under 6 Years | 122 (96.8%) | 4 (3.2%) |
| 6 to 18 Years | 273 (91.0%) | 27 (9.0%) |
| 19 to 25 Years | 80 (67.8%) | 38 (32.2%) |
| 26 to 34 Years | 127 (71.0%) | 52 (29.0%) |
| 35 to 44 Years | 150 (69.4%) | 66 (30.6%) |
| 45 to 54 Years | 190 (94.5%) | 11 (5.5%) |
| 55 to 64 Years | 308 (93.9%) | 20 (6.1%) |
| 65 to 74 Years | 252 (100.0%) | 0 (0.0%) |
| 75 Years and older | 250 (100.0%) | 0 (0.0%) |
| Total | 1,752 (88.9%) | 218 (11.1%) |
Health Insurance Coverage by Citizenship Status in Pacolet
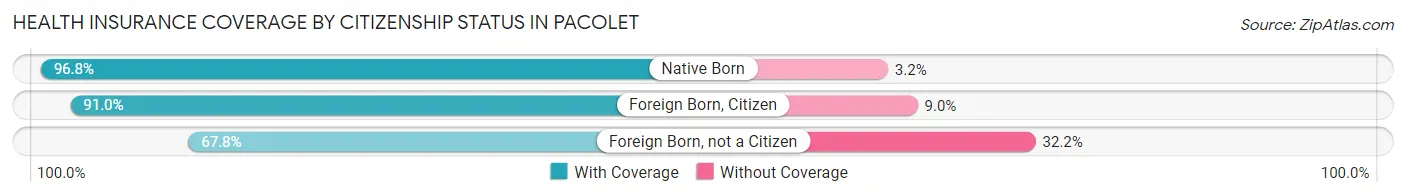
| Citizenship Status | With Coverage | Without Coverage |
| Native Born | 122 (96.8%) | 4 (3.2%) |
| Foreign Born, Citizen | 273 (91.0%) | 27 (9.0%) |
| Foreign Born, not a Citizen | 80 (67.8%) | 38 (32.2%) |
Health Insurance Coverage by Household Income in Pacolet
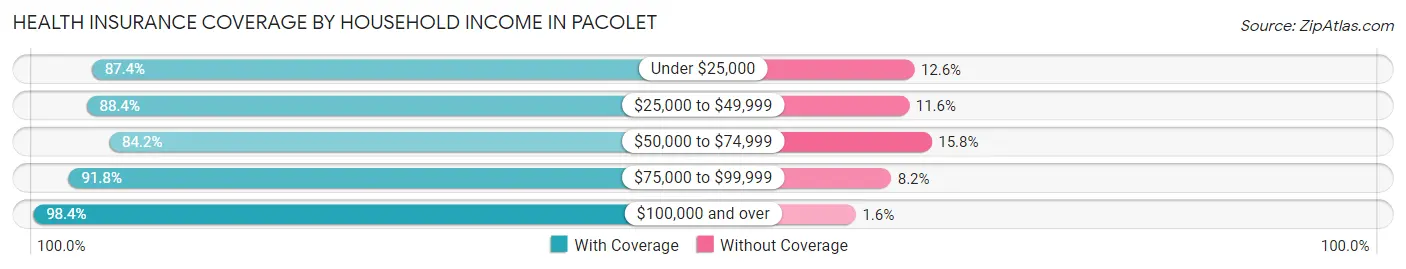
| Household Income | With Coverage | Without Coverage |
| Under $25,000 | 278 (87.4%) | 40 (12.6%) |
| $25,000 to $49,999 | 472 (88.4%) | 62 (11.6%) |
| $50,000 to $74,999 | 367 (84.2%) | 69 (15.8%) |
| $75,000 to $99,999 | 390 (91.8%) | 35 (8.2%) |
| $100,000 and over | 243 (98.4%) | 4 (1.6%) |
Public vs Private Health Insurance Coverage by Age in Pacolet
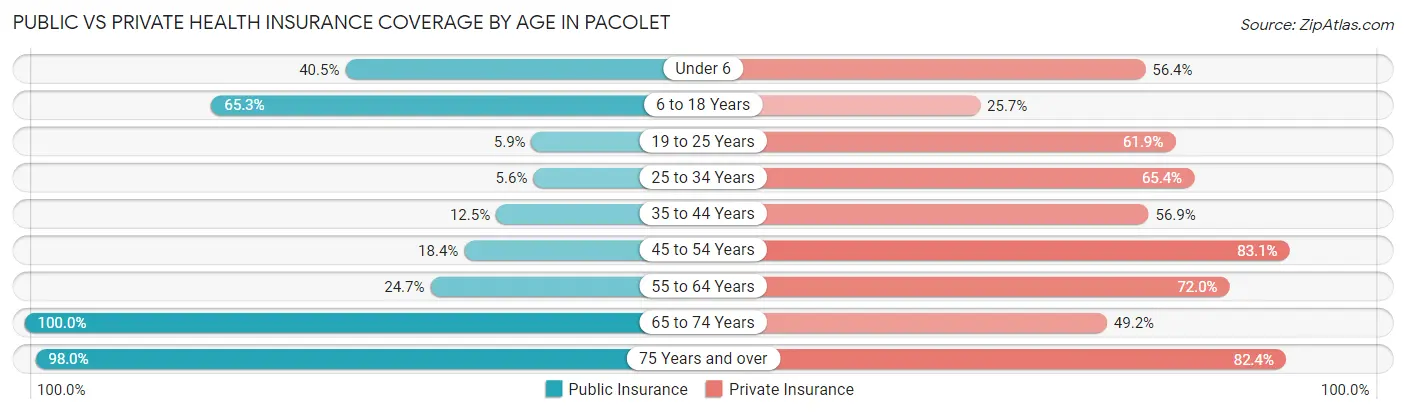
| Age Bracket | Public Insurance | Private Insurance |
| Under 6 | 51 (40.5%) | 71 (56.4%) |
| 6 to 18 Years | 196 (65.3%) | 77 (25.7%) |
| 19 to 25 Years | 7 (5.9%) | 73 (61.9%) |
| 25 to 34 Years | 10 (5.6%) | 117 (65.4%) |
| 35 to 44 Years | 27 (12.5%) | 123 (56.9%) |
| 45 to 54 Years | 37 (18.4%) | 167 (83.1%) |
| 55 to 64 Years | 81 (24.7%) | 236 (72.0%) |
| 65 to 74 Years | 252 (100.0%) | 124 (49.2%) |
| 75 Years and over | 245 (98.0%) | 206 (82.4%) |
| Total | 906 (46.0%) | 1,194 (60.6%) |
Disability Status by Sex by Age in Pacolet
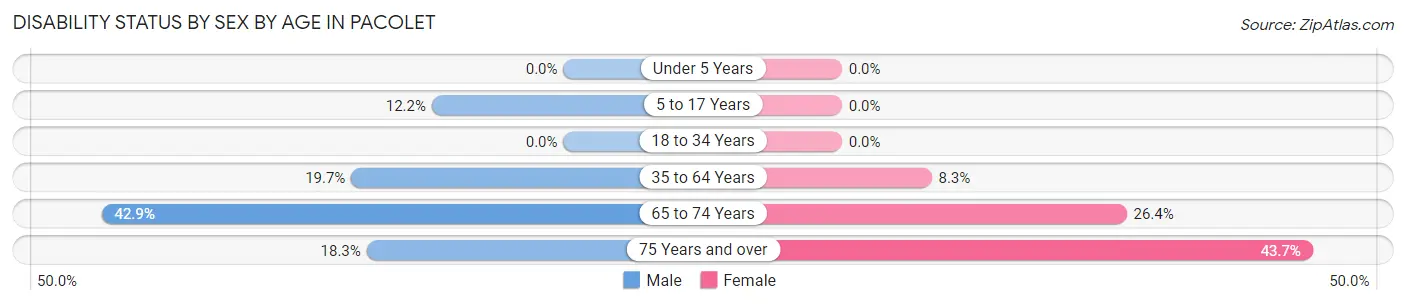
| Age Bracket | Male | Female |
| Under 5 Years | 0 (0.0%) | 0 (0.0%) |
| 5 to 17 Years | 21 (12.2%) | 0 (0.0%) |
| 18 to 34 Years | 0 (0.0%) | 0 (0.0%) |
| 35 to 64 Years | 64 (19.7%) | 35 (8.3%) |
| 65 to 74 Years | 48 (42.9%) | 37 (26.4%) |
| 75 Years and over | 21 (18.3%) | 59 (43.7%) |
Disability Class by Sex by Age in Pacolet
Disability Class: Hearing Difficulty
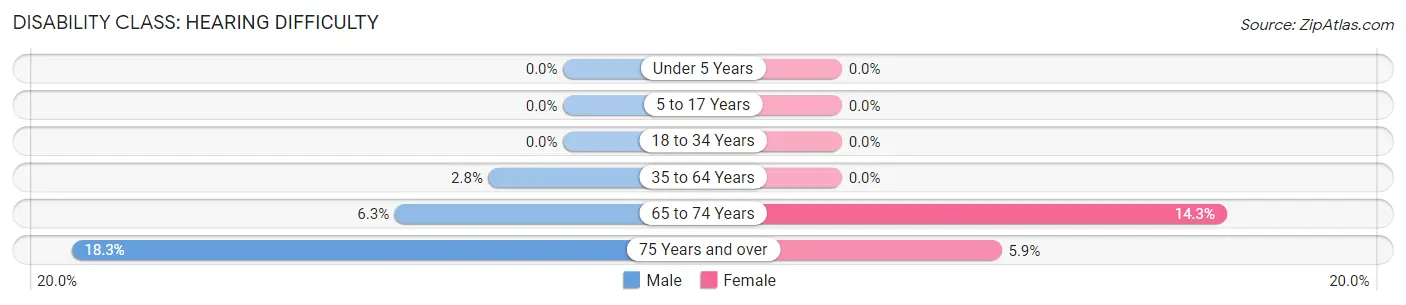
| Age Bracket | Male | Female |
| Under 5 Years | 0 (0.0%) | 0 (0.0%) |
| 5 to 17 Years | 0 (0.0%) | 0 (0.0%) |
| 18 to 34 Years | 0 (0.0%) | 0 (0.0%) |
| 35 to 64 Years | 9 (2.8%) | 0 (0.0%) |
| 65 to 74 Years | 7 (6.2%) | 20 (14.3%) |
| 75 Years and over | 21 (18.3%) | 8 (5.9%) |
Disability Class: Vision Difficulty
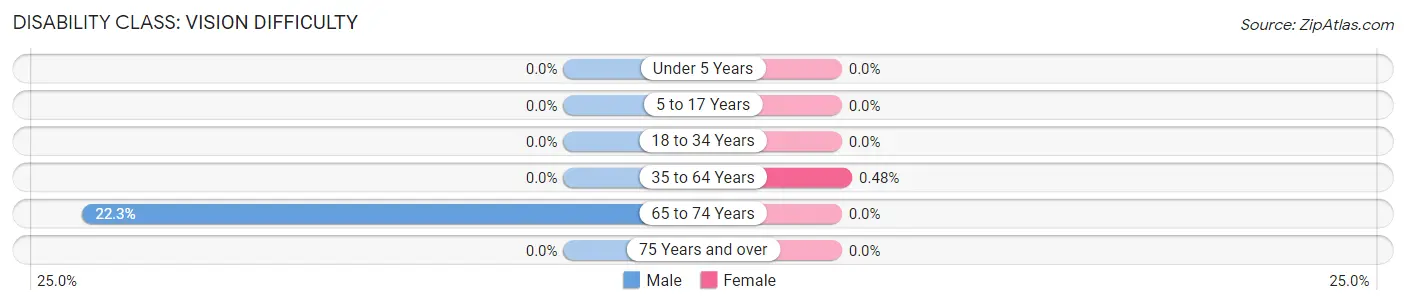
| Age Bracket | Male | Female |
| Under 5 Years | 0 (0.0%) | 0 (0.0%) |
| 5 to 17 Years | 0 (0.0%) | 0 (0.0%) |
| 18 to 34 Years | 0 (0.0%) | 0 (0.0%) |
| 35 to 64 Years | 0 (0.0%) | 2 (0.5%) |
| 65 to 74 Years | 25 (22.3%) | 0 (0.0%) |
| 75 Years and over | 0 (0.0%) | 0 (0.0%) |
Disability Class: Cognitive Difficulty
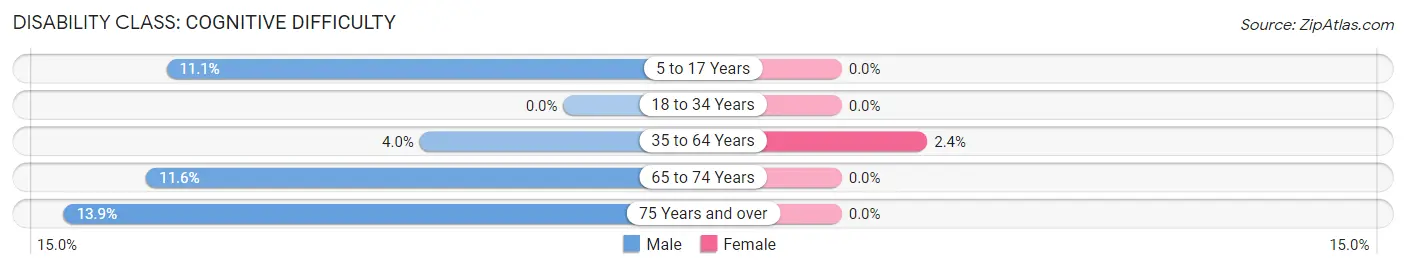
| Age Bracket | Male | Female |
| 5 to 17 Years | 19 (11.1%) | 0 (0.0%) |
| 18 to 34 Years | 0 (0.0%) | 0 (0.0%) |
| 35 to 64 Years | 13 (4.0%) | 10 (2.4%) |
| 65 to 74 Years | 13 (11.6%) | 0 (0.0%) |
| 75 Years and over | 16 (13.9%) | 0 (0.0%) |
Disability Class: Ambulatory Difficulty
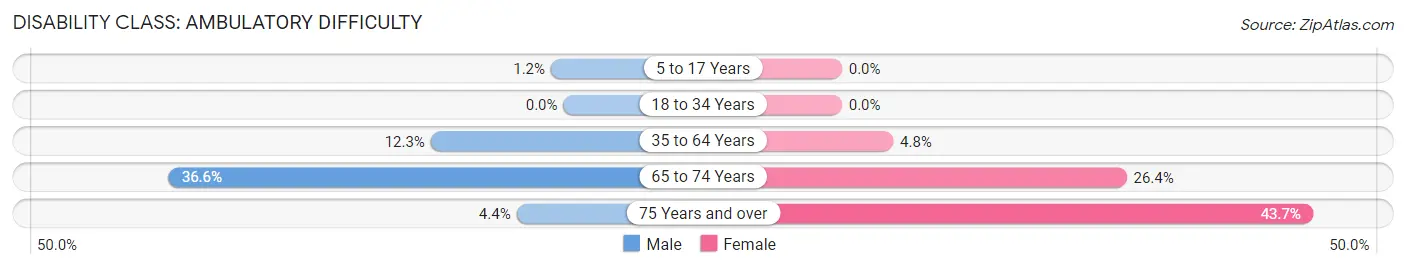
| Age Bracket | Male | Female |
| 5 to 17 Years | 2 (1.2%) | 0 (0.0%) |
| 18 to 34 Years | 0 (0.0%) | 0 (0.0%) |
| 35 to 64 Years | 40 (12.3%) | 20 (4.8%) |
| 65 to 74 Years | 41 (36.6%) | 37 (26.4%) |
| 75 Years and over | 5 (4.3%) | 59 (43.7%) |
Disability Class: Self-Care Difficulty
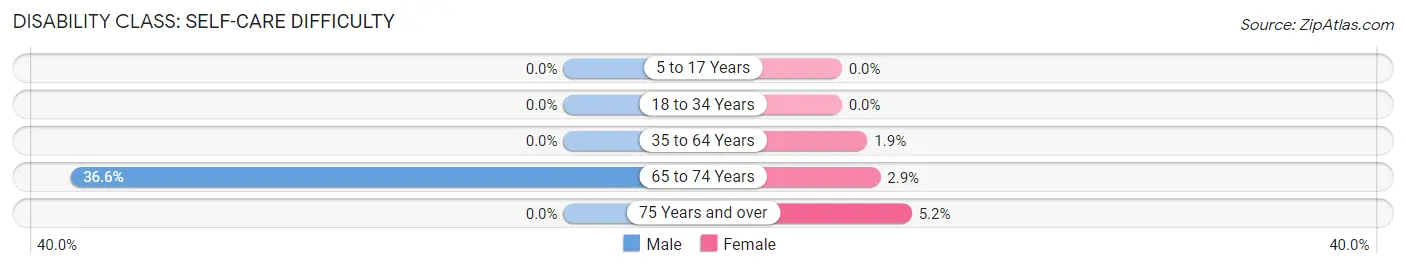
| Age Bracket | Male | Female |
| 5 to 17 Years | 0 (0.0%) | 0 (0.0%) |
| 18 to 34 Years | 0 (0.0%) | 0 (0.0%) |
| 35 to 64 Years | 0 (0.0%) | 8 (1.9%) |
| 65 to 74 Years | 41 (36.6%) | 4 (2.9%) |
| 75 Years and over | 0 (0.0%) | 7 (5.2%) |
Technology Access in Pacolet
Computing Device Access in Pacolet
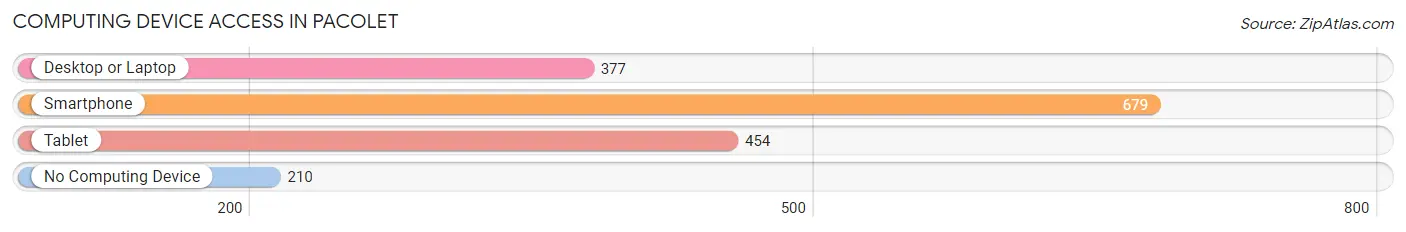
| Device Type | # Households | % Households |
| Desktop or Laptop | 377 | 40.3% |
| Smartphone | 679 | 72.6% |
| Tablet | 454 | 48.6% |
| No Computing Device | 210 | 22.5% |
| Total | 935 | 100.0% |
Internet Access in Pacolet
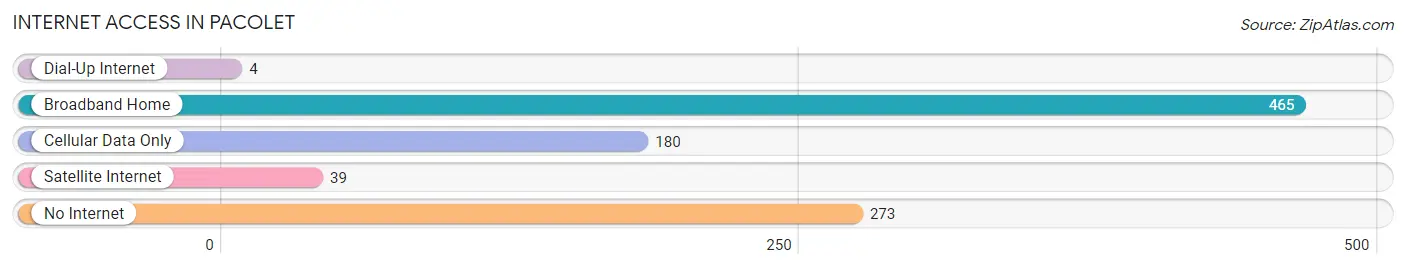
| Internet Type | # Households | % Households |
| Dial-Up Internet | 4 | 0.4% |
| Broadband Home | 465 | 49.7% |
| Cellular Data Only | 180 | 19.3% |
| Satellite Internet | 39 | 4.2% |
| No Internet | 273 | 29.2% |
| Total | 935 | 100.0% |
Pacolet Summary
Pacolet, South Carolina is a small town located in Spartanburg County, South Carolina. It is situated on the banks of the Pacolet River, which is a tributary of the Broad River. The town was founded in 1790 and is one of the oldest towns in the state. The population of Pacolet in 2000 was 1,845.
Geography
Pacolet is located in the foothills of the Blue Ridge Mountains in the Upstate region of South Carolina. The town is situated on the banks of the Pacolet River, which is a tributary of the Broad River. The town is located at an elevation of 830 feet above sea level. The town is surrounded by the towns of Jonesville, Lockhart, and Whitestone. The town is located approximately 20 miles from Spartanburg and 40 miles from Greenville.
The climate in Pacolet is mild and humid. The average temperature in the summer is around 80 degrees Fahrenheit and the average temperature in the winter is around 40 degrees Fahrenheit. The town receives an average of 48 inches of rain per year.
Economy
The economy of Pacolet is largely based on agriculture and manufacturing. The town is home to several small businesses, including a grocery store, a hardware store, and a restaurant. The town is also home to several manufacturing companies, including a textile mill and a paper mill. The town is also home to a number of farms, which produce a variety of crops, including corn, soybeans, and cotton.
Demographics
The population of Pacolet in 2000 was 1,845. The racial makeup of the town was 94.3% White, 3.7% African American, 0.3% Native American, 0.2% Asian, 0.1% Pacific Islander, 0.7% from other races, and 0.9% from two or more races. Hispanic or Latino of any race were 1.3% of the population.
The median income for a household in Pacolet was $30,938, and the median income for a family was $37,917. The per capita income for the town was $15,945. About 11.2% of families and 14.2% of the population were below the poverty line, including 18.2% of those under age 18 and 11.2% of those age 65 or over.
Conclusion
Pacolet, South Carolina is a small town located in Spartanburg County, South Carolina. It is situated on the banks of the Pacolet River, which is a tributary of the Broad River. The town was founded in 1790 and is one of the oldest towns in the state. The population of Pacolet in 2000 was 1,845. The economy of Pacolet is largely based on agriculture and manufacturing. The racial makeup of the town was 94.3% White, 3.7% African American, 0.3% Native American, 0.2% Asian, 0.1% Pacific Islander, 0.7% from other races, and 0.9% from two or more races. The median income for a household in Pacolet was $30,938, and the median income for a family was $37,917. Pacolet is a small town with a rich history and a diverse population.
Common Questions
What is Per Capita Income in Pacolet?
Per Capita income in Pacolet is $26,024.
What is the Median Family Income in Pacolet?
Median Family Income in Pacolet is $59,145.
What is the Median Household income in Pacolet?
Median Household Income in Pacolet is $44,894.
What is Income or Wage Gap in Pacolet?
Income or Wage Gap in Pacolet is 24.8%.
Women in Pacolet earn 75.2 cents for every dollar earned by a man.
What is Family Income Deficit in Pacolet?
Family Income Deficit in Pacolet is $6,815.
Families that are below poverty line in Pacolet earn $6,815 less on average than the poverty threshold level.
What is Inequality or Gini Index in Pacolet?
Inequality or Gini Index in Pacolet is 0.40.
What is the Total Population of Pacolet?
Total Population of Pacolet is 1,970.
What is the Total Male Population of Pacolet?
Total Male Population of Pacolet is 948.
What is the Total Female Population of Pacolet?
Total Female Population of Pacolet is 1,022.
What is the Ratio of Males per 100 Females in Pacolet?
There are 92.76 Males per 100 Females in Pacolet.
What is the Ratio of Females per 100 Males in Pacolet?
There are 107.81 Females per 100 Males in Pacolet.
What is the Median Population Age in Pacolet?
Median Population Age in Pacolet is 48.1 Years.
What is the Average Family Size in Pacolet
Average Family Size in Pacolet is 2.9 People.
What is the Average Household Size in Pacolet
Average Household Size in Pacolet is 2.1 People.
How Large is the Labor Force in Pacolet?
There are 924 People in the Labor Forcein in Pacolet.
What is the Percentage of People in the Labor Force in Pacolet?
55.3% of People are in the Labor Force in Pacolet.
What is the Unemployment Rate in Pacolet?
Unemployment Rate in Pacolet is 7.0%.