Whitmire, SC Map & Demographics
Whitmire Map
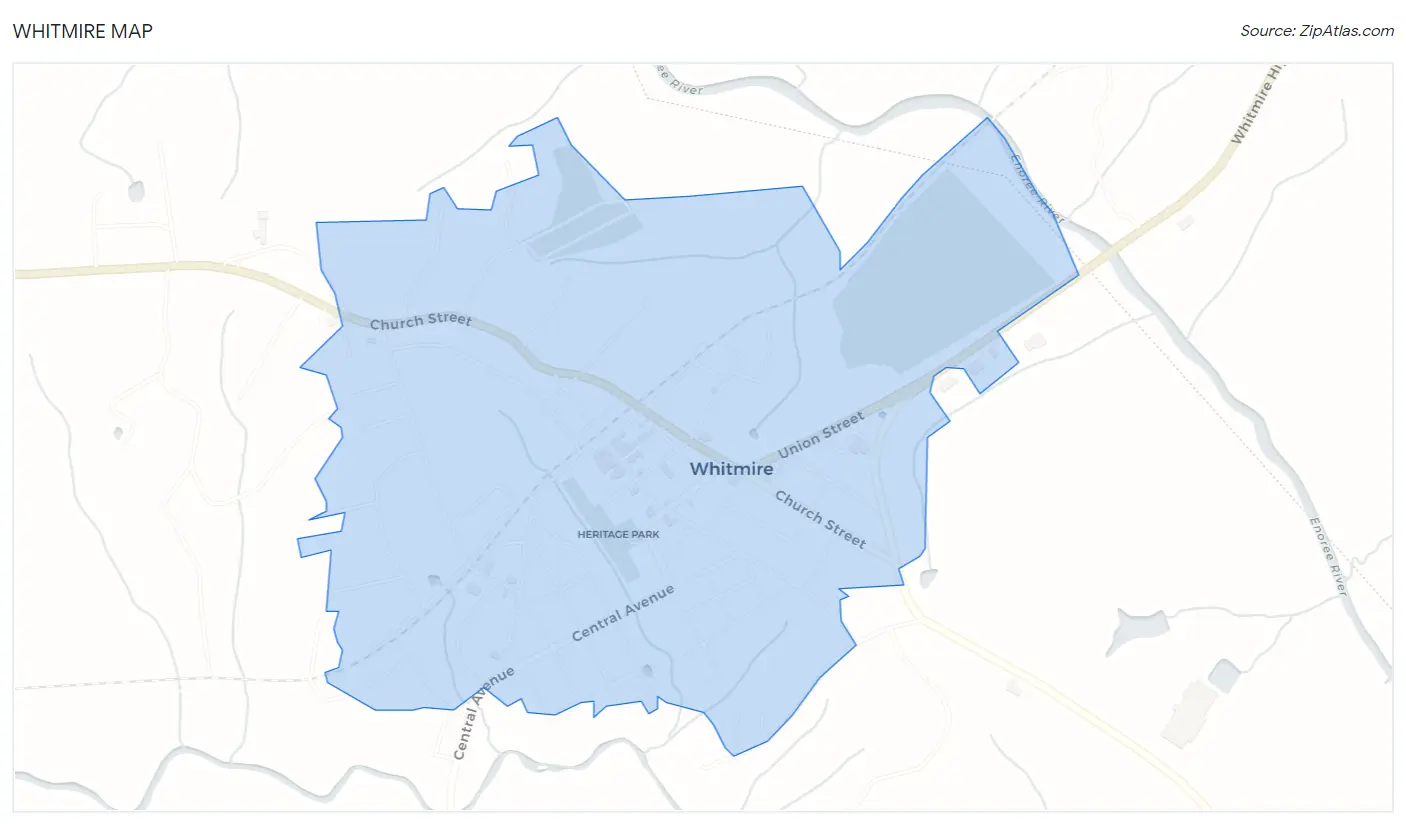
Whitmire Overview
$23,183
PER CAPITA INCOME
$38,977
AVG FAMILY INCOME
$32,813
AVG HOUSEHOLD INCOME
23.8%
WAGE / INCOME GAP [ % ]
76.2¢/ $1
WAGE / INCOME GAP [ $ ]
0.43
INEQUALITY / GINI INDEX
1,255
TOTAL POPULATION
709
MALE POPULATION
546
FEMALE POPULATION
129.85
MALES / 100 FEMALES
77.01
FEMALES / 100 MALES
54.5
MEDIAN AGE
2.5
AVG FAMILY SIZE
1.9
AVG HOUSEHOLD SIZE
540
LABOR FORCE [ PEOPLE ]
49.0%
PERCENT IN LABOR FORCE
5.9%
UNEMPLOYMENT RATE
Whitmire Zip Codes
Whitmire Area Codes
Income in Whitmire
Income Overview in Whitmire
Per Capita Income in Whitmire is $23,183, while median incomes of families and households are $38,977 and $32,813 respectively.
| Characteristic | Number | Measure |
| Per Capita Income | 1,255 | $23,183 |
| Median Family Income | 401 | $38,977 |
| Mean Family Income | 401 | $55,370 |
| Median Household Income | 656 | $32,813 |
| Mean Household Income | 656 | $46,893 |
| Income Deficit | 401 | $0 |
| Wage / Income Gap (%) | 1,255 | 23.77% |
| Wage / Income Gap ($) | 1,255 | 76.23¢ per $1 |
| Gini / Inequality Index | 1,255 | 0.43 |
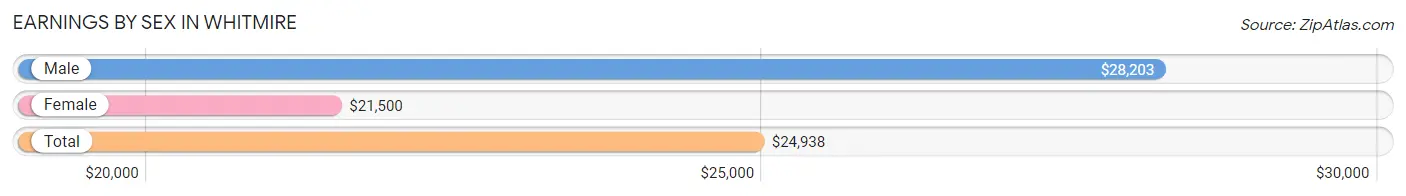
Earnings by Sex in Whitmire
Average Earnings in Whitmire are $24,938, $28,203 for men and $21,500 for women, a difference of 23.8%.
| Sex | Number | Average Earnings |
| Male | 337 (58.6%) | $28,203 |
| Female | 238 (41.4%) | $21,500 |
| Total | 575 (100.0%) | $24,938 |
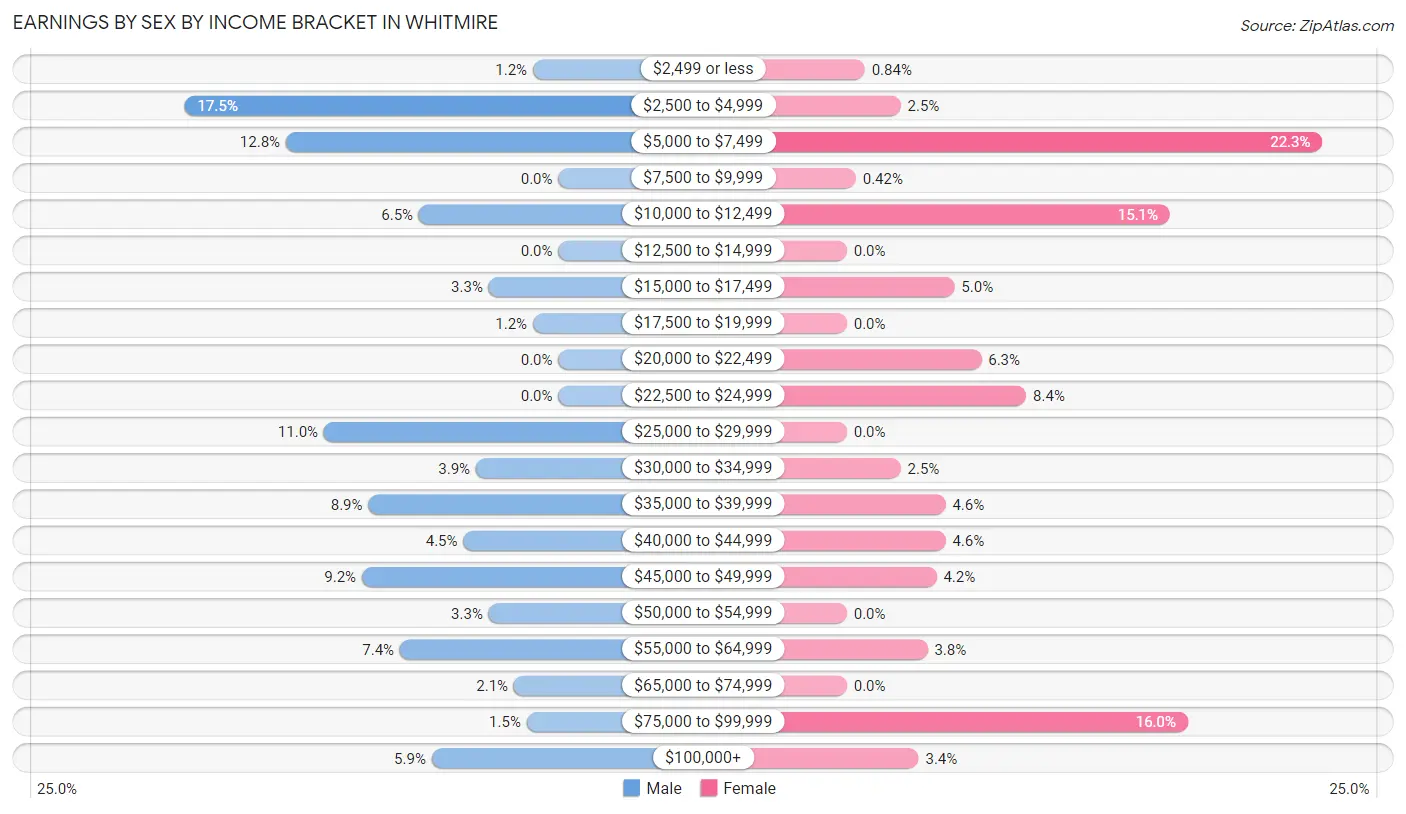
Earnings by Sex by Income Bracket in Whitmire
The most common earnings brackets in Whitmire are $2,500 to $4,999 for men (59 | 17.5%) and $5,000 to $7,499 for women (53 | 22.3%).
| Income | Male | Female |
| $2,499 or less | 4 (1.2%) | 2 (0.8%) |
| $2,500 to $4,999 | 59 (17.5%) | 6 (2.5%) |
| $5,000 to $7,499 | 43 (12.8%) | 53 (22.3%) |
| $7,500 to $9,999 | 0 (0.0%) | 1 (0.4%) |
| $10,000 to $12,499 | 22 (6.5%) | 36 (15.1%) |
| $12,500 to $14,999 | 0 (0.0%) | 0 (0.0%) |
| $15,000 to $17,499 | 11 (3.3%) | 12 (5.0%) |
| $17,500 to $19,999 | 4 (1.2%) | 0 (0.0%) |
| $20,000 to $22,499 | 0 (0.0%) | 15 (6.3%) |
| $22,500 to $24,999 | 0 (0.0%) | 20 (8.4%) |
| $25,000 to $29,999 | 37 (11.0%) | 0 (0.0%) |
| $30,000 to $34,999 | 13 (3.9%) | 6 (2.5%) |
| $35,000 to $39,999 | 30 (8.9%) | 11 (4.6%) |
| $40,000 to $44,999 | 15 (4.4%) | 11 (4.6%) |
| $45,000 to $49,999 | 31 (9.2%) | 10 (4.2%) |
| $50,000 to $54,999 | 11 (3.3%) | 0 (0.0%) |
| $55,000 to $64,999 | 25 (7.4%) | 9 (3.8%) |
| $65,000 to $74,999 | 7 (2.1%) | 0 (0.0%) |
| $75,000 to $99,999 | 5 (1.5%) | 38 (16.0%) |
| $100,000+ | 20 (5.9%) | 8 (3.4%) |
| Total | 337 (100.0%) | 238 (100.0%) |
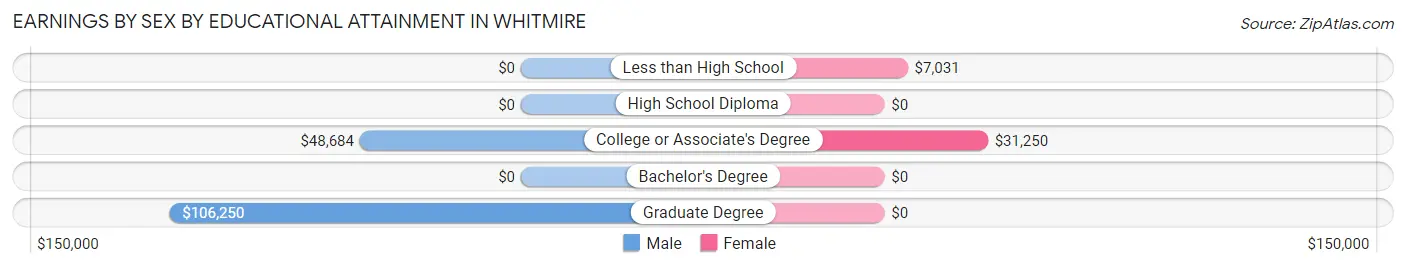
Earnings by Sex by Educational Attainment in Whitmire
Average earnings in Whitmire are $26,905 for men and $21,667 for women, a difference of 19.5%. Men with an educational attainment of graduate degree enjoy the highest average annual earnings of $106,250, while those with college or associate's degree education earn the least with $48,684. Women with an educational attainment of college or associate's degree earn the most with the average annual earnings of $31,250, while those with less than high school education have the smallest earnings of $7,031.
| Educational Attainment | Male Income | Female Income |
| Less than High School | - | - |
| High School Diploma | - | - |
| College or Associate's Degree | $48,684 | $31,250 |
| Bachelor's Degree | - | - |
| Graduate Degree | $106,250 | $0 |
| Total | $26,905 | $21,667 |
Family Income in Whitmire
Family Income Brackets in Whitmire
According to the Whitmire family income data, there are 98 families falling into the $15,000 to $24,999 income range, which is the most common income bracket and makes up 24.4% of all families. Conversely, the $200,000+ income bracket is the least frequent group with only 6 families (1.5%) belonging to this category.
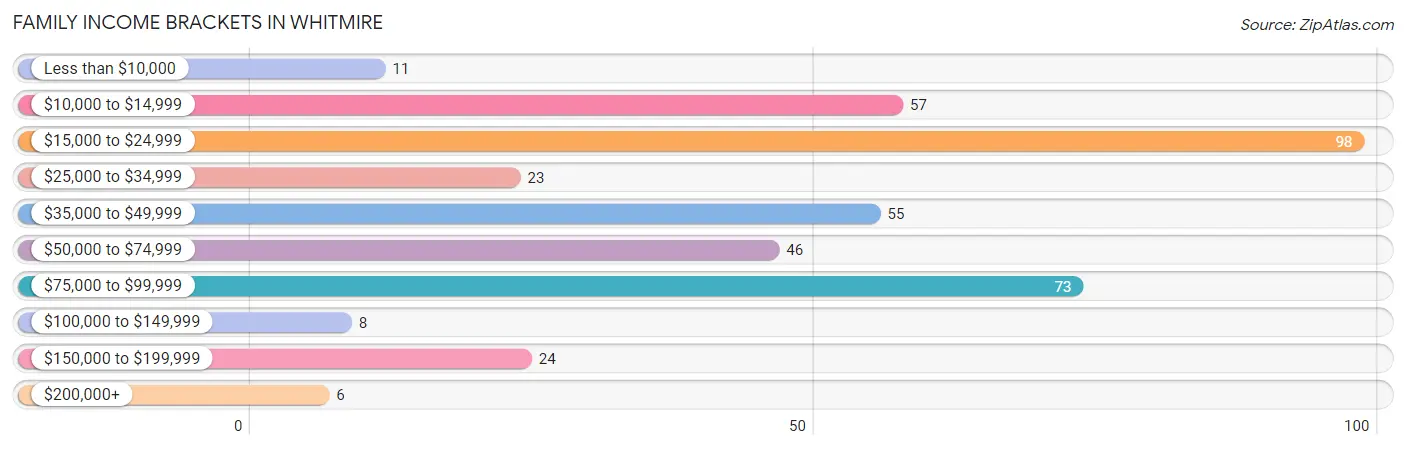
| Income Bracket | # Families | % Families |
| Less than $10,000 | 11 | 2.7% |
| $10,000 to $14,999 | 57 | 14.2% |
| $15,000 to $24,999 | 98 | 24.4% |
| $25,000 to $34,999 | 23 | 5.7% |
| $35,000 to $49,999 | 55 | 13.7% |
| $50,000 to $74,999 | 46 | 11.5% |
| $75,000 to $99,999 | 73 | 18.2% |
| $100,000 to $149,999 | 8 | 2.0% |
| $150,000 to $199,999 | 24 | 6.0% |
| $200,000+ | 6 | 1.5% |
Family Income by Famaliy Size in Whitmire
4-person families (29 | 7.2%) account for the highest median family income in Whitmire with $50,795 per family, while 2-person families (156 | 38.9%) have the highest median income of $16,688 per family member.
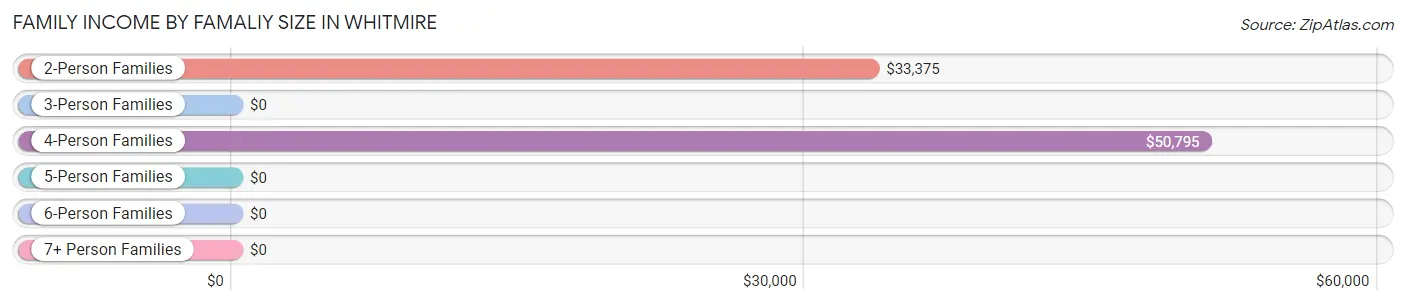
| Income Bracket | # Families | Median Income |
| 2-Person Families | 156 (38.9%) | $33,375 |
| 3-Person Families | 200 (49.9%) | $0 |
| 4-Person Families | 29 (7.2%) | $50,795 |
| 5-Person Families | 4 (1.0%) | $0 |
| 6-Person Families | 12 (3.0%) | $0 |
| 7+ Person Families | 0 (0.0%) | $0 |
| Total | 401 (100.0%) | $38,977 |
Family Income by Number of Earners in Whitmire
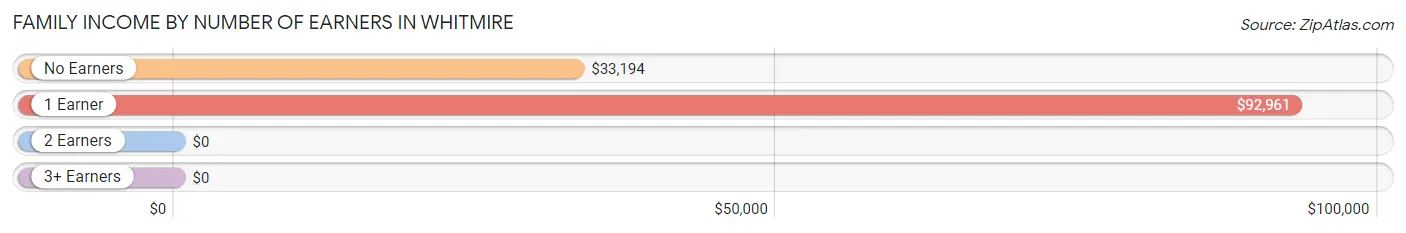
| Number of Earners | # Families | Median Income |
| No Earners | 70 (17.5%) | $33,194 |
| 1 Earner | 106 (26.4%) | $92,961 |
| 2 Earners | 214 (53.4%) | $0 |
| 3+ Earners | 11 (2.7%) | $0 |
| Total | 401 (100.0%) | $38,977 |
Household Income in Whitmire
Household Income Brackets in Whitmire
With 193 households falling in the category, the $15,000 to $24,999 income range is the most frequent in Whitmire, accounting for 29.4% of all households. In contrast, only 6 households (0.9%) fall into the $200,000+ income bracket, making it the least populous group.
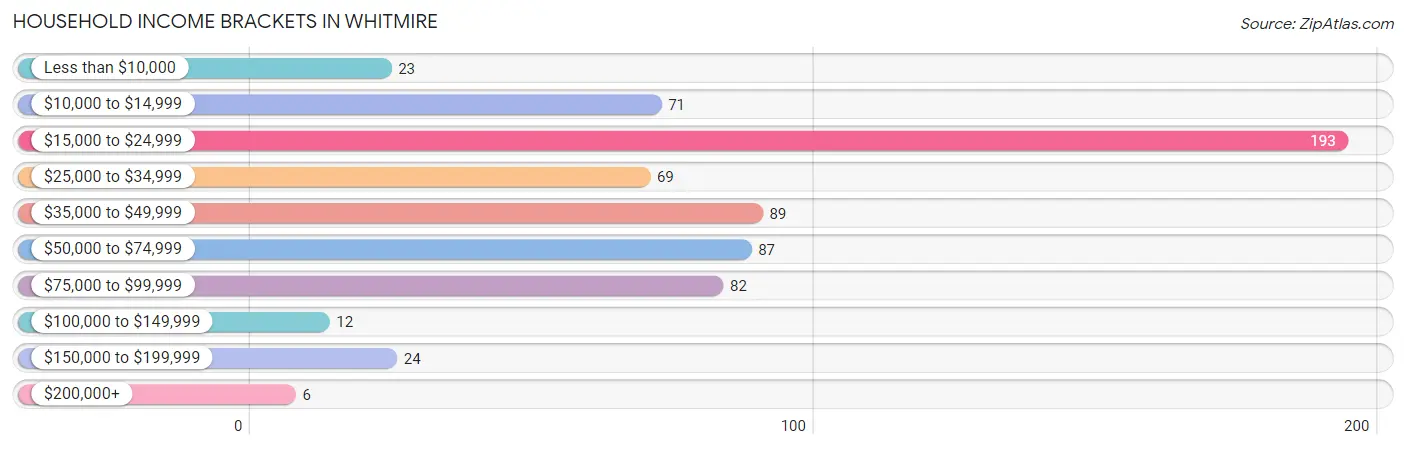
| Income Bracket | # Households | % Households |
| Less than $10,000 | 23 | 3.5% |
| $10,000 to $14,999 | 71 | 10.8% |
| $15,000 to $24,999 | 193 | 29.4% |
| $25,000 to $34,999 | 69 | 10.5% |
| $35,000 to $49,999 | 89 | 13.6% |
| $50,000 to $74,999 | 87 | 13.3% |
| $75,000 to $99,999 | 82 | 12.5% |
| $100,000 to $149,999 | 12 | 1.8% |
| $150,000 to $199,999 | 24 | 3.7% |
| $200,000+ | 6 | 0.9% |
Household Income by Householder Age in Whitmire
The median household income in Whitmire is $32,813, with the highest median household income of $38,750 found in the 25 to 44 years age bracket for the primary householder. A total of 79 households (12.0%) fall into this category. Meanwhile, the 15 to 24 years age bracket for the primary householder has the lowest median household income of $0, with 64 households (9.8%) in this group.
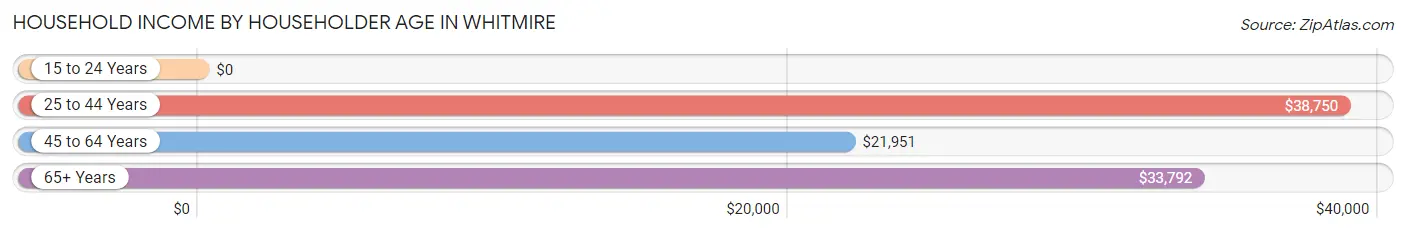
| Income Bracket | # Households | Median Income |
| 15 to 24 Years | 64 (9.8%) | $0 |
| 25 to 44 Years | 79 (12.0%) | $38,750 |
| 45 to 64 Years | 332 (50.6%) | $21,951 |
| 65+ Years | 181 (27.6%) | $33,792 |
| Total | 656 (100.0%) | $32,813 |
Poverty in Whitmire
Income Below Poverty by Sex and Age in Whitmire
With 28.3% poverty level for males and 19.1% for females among the residents of Whitmire, 16 and 17 year old males and 35 to 44 year old females are the most vulnerable to poverty, with 4 males (100.0%) and 26 females (43.3%) in their respective age groups living below the poverty level.
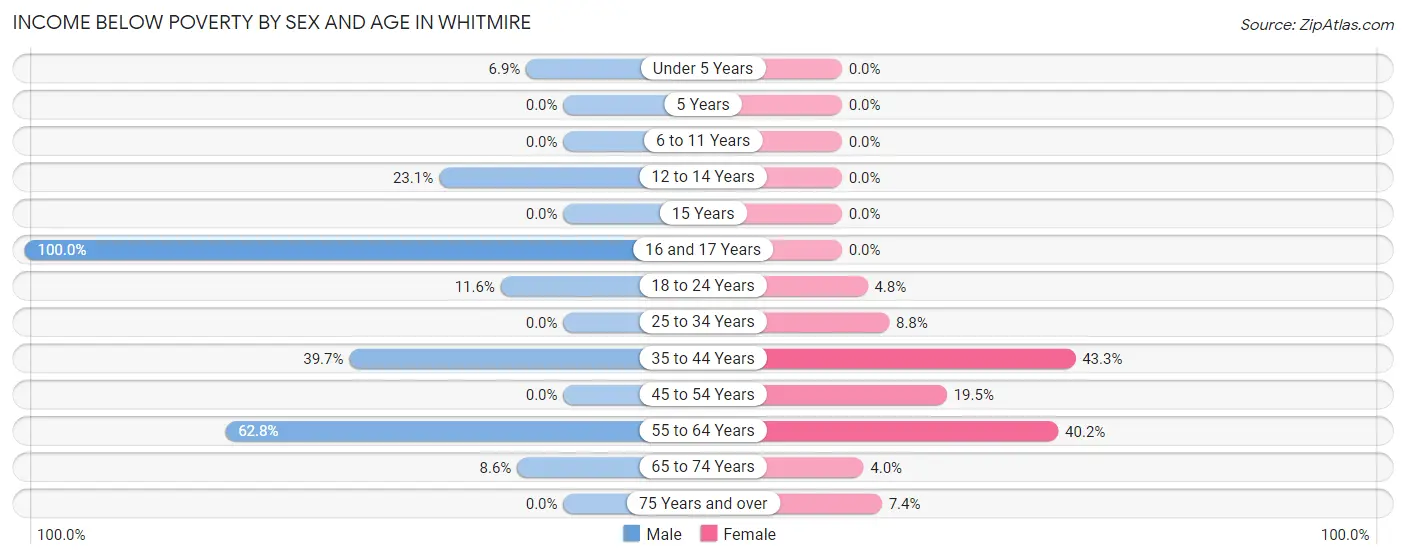
| Age Bracket | Male | Female |
| Under 5 Years | 4 (6.9%) | 0 (0.0%) |
| 5 Years | 0 (0.0%) | 0 (0.0%) |
| 6 to 11 Years | 0 (0.0%) | 0 (0.0%) |
| 12 to 14 Years | 3 (23.1%) | 0 (0.0%) |
| 15 Years | 0 (0.0%) | 0 (0.0%) |
| 16 and 17 Years | 4 (100.0%) | 0 (0.0%) |
| 18 to 24 Years | 5 (11.6%) | 2 (4.8%) |
| 25 to 34 Years | 0 (0.0%) | 5 (8.8%) |
| 35 to 44 Years | 29 (39.7%) | 26 (43.3%) |
| 45 to 54 Years | 0 (0.0%) | 15 (19.5%) |
| 55 to 64 Years | 150 (62.8%) | 49 (40.2%) |
| 65 to 74 Years | 6 (8.6%) | 3 (4.0%) |
| 75 Years and over | 0 (0.0%) | 4 (7.4%) |
| Total | 201 (28.3%) | 104 (19.1%) |
Income Above Poverty by Sex and Age in Whitmire
According to the poverty statistics in Whitmire, males aged 6 to 11 years and females aged under 5 years are the age groups that are most secure financially, with 100.0% of males and 100.0% of females in these age groups living above the poverty line.
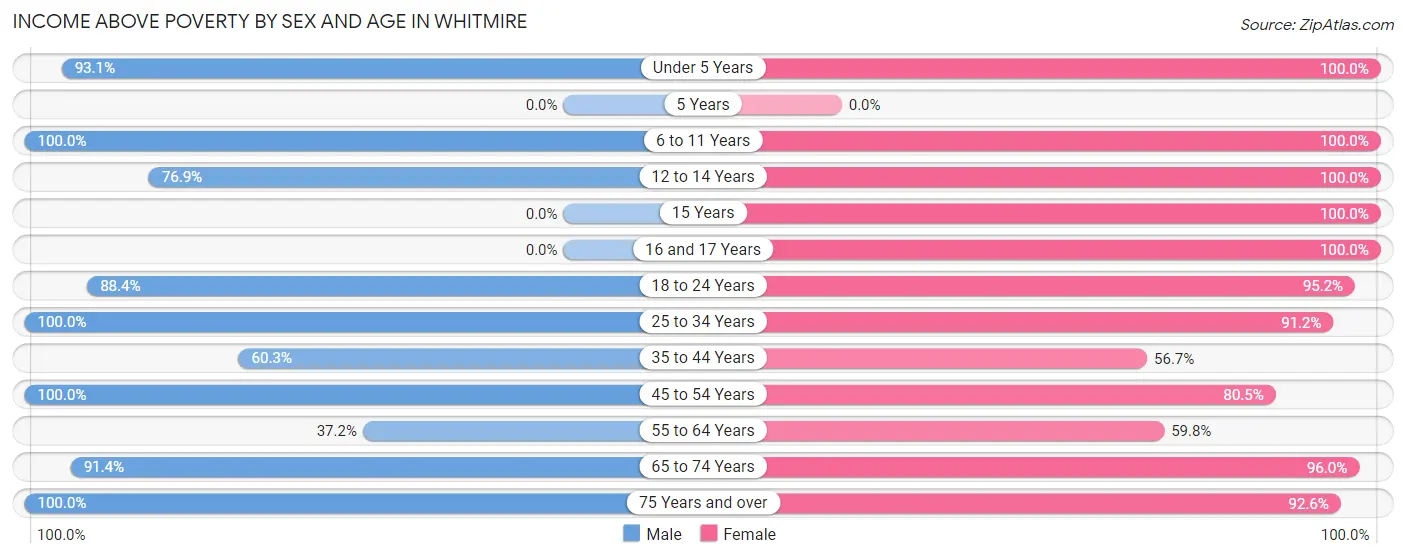
| Age Bracket | Male | Female |
| Under 5 Years | 54 (93.1%) | 14 (100.0%) |
| 5 Years | 0 (0.0%) | 0 (0.0%) |
| 6 to 11 Years | 30 (100.0%) | 6 (100.0%) |
| 12 to 14 Years | 10 (76.9%) | 25 (100.0%) |
| 15 Years | 0 (0.0%) | 7 (100.0%) |
| 16 and 17 Years | 0 (0.0%) | 7 (100.0%) |
| 18 to 24 Years | 38 (88.4%) | 40 (95.2%) |
| 25 to 34 Years | 56 (100.0%) | 52 (91.2%) |
| 35 to 44 Years | 44 (60.3%) | 34 (56.7%) |
| 45 to 54 Years | 59 (100.0%) | 62 (80.5%) |
| 55 to 64 Years | 89 (37.2%) | 73 (59.8%) |
| 65 to 74 Years | 64 (91.4%) | 72 (96.0%) |
| 75 Years and over | 64 (100.0%) | 50 (92.6%) |
| Total | 508 (71.7%) | 442 (80.9%) |
Income Below Poverty Among Married-Couple Families in Whitmire
The poverty statistics for married-couple families in Whitmire show that 23.5% or 55 of the total 234 families live below the poverty line. Families with no children have the highest poverty rate of 34.4%, comprising of 55 families. On the other hand, families with 1 or 2 children have the lowest poverty rate of 0.0%, which includes 0 families.
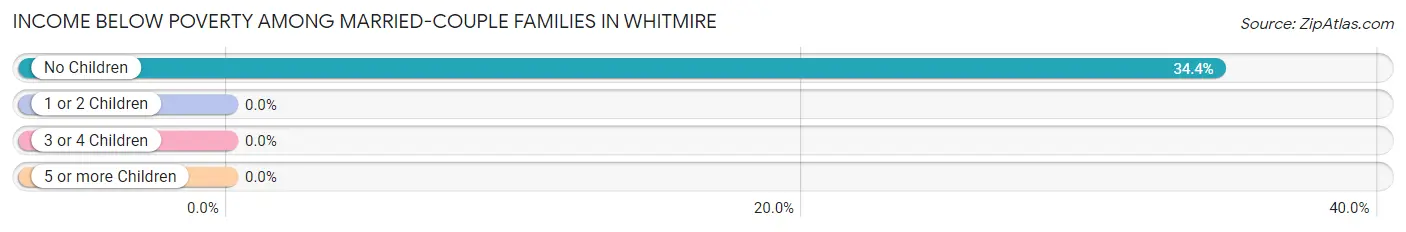
| Children | Above Poverty | Below Poverty |
| No Children | 105 (65.6%) | 55 (34.4%) |
| 1 or 2 Children | 62 (100.0%) | 0 (0.0%) |
| 3 or 4 Children | 12 (100.0%) | 0 (0.0%) |
| 5 or more Children | 0 (0.0%) | 0 (0.0%) |
| Total | 179 (76.5%) | 55 (23.5%) |
Income Below Poverty Among Single-Parent Households in Whitmire
According to the poverty data in Whitmire, 93.2% or 82 single-father households and 16.5% or 13 single-mother households are living below the poverty line. Among single-father households, those with no children have the highest poverty rate, with 82 households (97.6%) experiencing poverty. Likewise, among single-mother households, those with no children have the highest poverty rate, with 5 households (17.2%) falling below the poverty line.
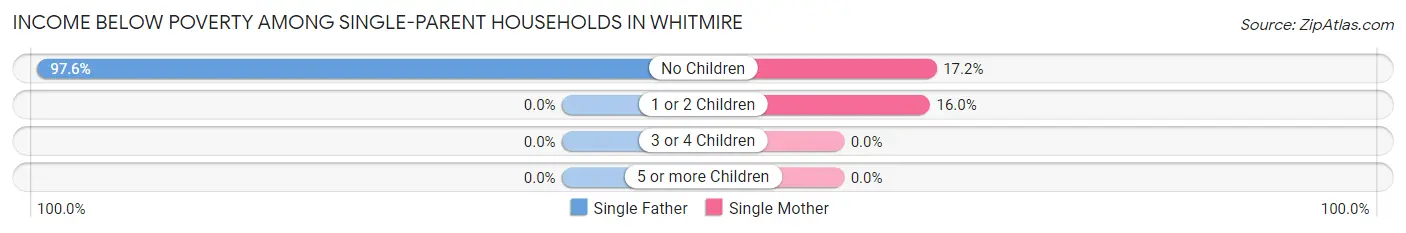
| Children | Single Father | Single Mother |
| No Children | 82 (97.6%) | 5 (17.2%) |
| 1 or 2 Children | 0 (0.0%) | 8 (16.0%) |
| 3 or 4 Children | 0 (0.0%) | 0 (0.0%) |
| 5 or more Children | 0 (0.0%) | 0 (0.0%) |
| Total | 82 (93.2%) | 13 (16.5%) |
Income Below Poverty Among Married-Couple vs Single-Parent Households in Whitmire
The poverty data for Whitmire shows that 55 of the married-couple family households (23.5%) and 95 of the single-parent households (56.9%) are living below the poverty level. Within the married-couple family households, those with no children have the highest poverty rate, with 55 households (34.4%) falling below the poverty line. Among the single-parent households, those with no children have the highest poverty rate, with 87 household (77.0%) living below poverty.
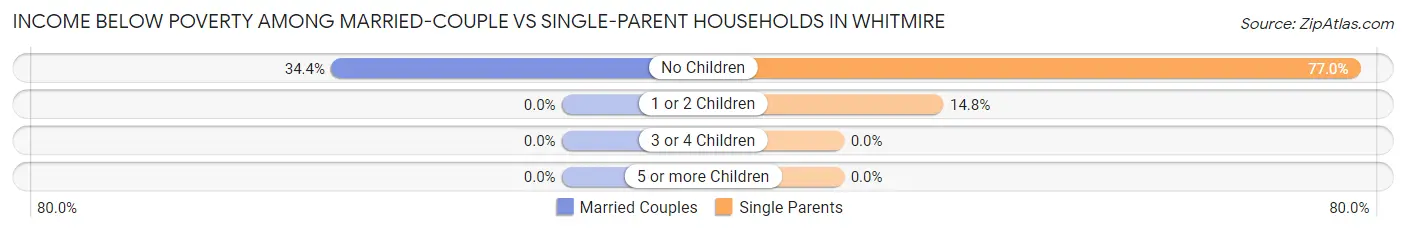
| Children | Married-Couple Families | Single-Parent Households |
| No Children | 55 (34.4%) | 87 (77.0%) |
| 1 or 2 Children | 0 (0.0%) | 8 (14.8%) |
| 3 or 4 Children | 0 (0.0%) | 0 (0.0%) |
| 5 or more Children | 0 (0.0%) | 0 (0.0%) |
| Total | 55 (23.5%) | 95 (56.9%) |
Race in Whitmire
The most populous races in Whitmire are White / Caucasian (877 | 69.9%), Black / African American (295 | 23.5%), and Two or more Races (66 | 5.3%).
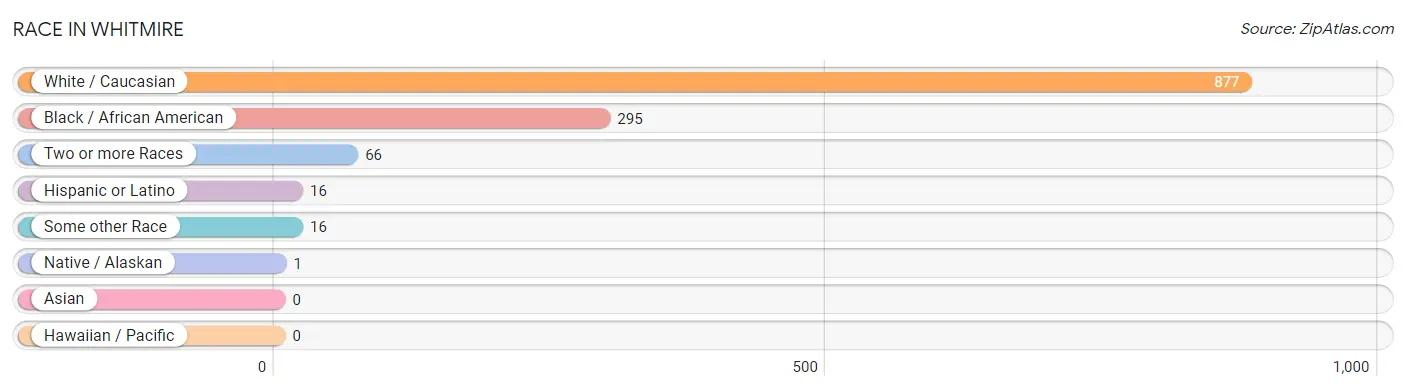
| Race | # Population | % Population |
| Asian | 0 | 0.0% |
| Black / African American | 295 | 23.5% |
| Hawaiian / Pacific | 0 | 0.0% |
| Hispanic or Latino | 16 | 1.3% |
| Native / Alaskan | 1 | 0.1% |
| White / Caucasian | 877 | 69.9% |
| Two or more Races | 66 | 5.3% |
| Some other Race | 16 | 1.3% |
| Total | 1,255 | 100.0% |
Ancestry in Whitmire
The most populous ancestries reported in Whitmire are Irish (214 | 17.1%), German (96 | 7.6%), American (90 | 7.2%), Scotch-Irish (76 | 6.1%), and English (73 | 5.8%), together accounting for 43.8% of all Whitmire residents.
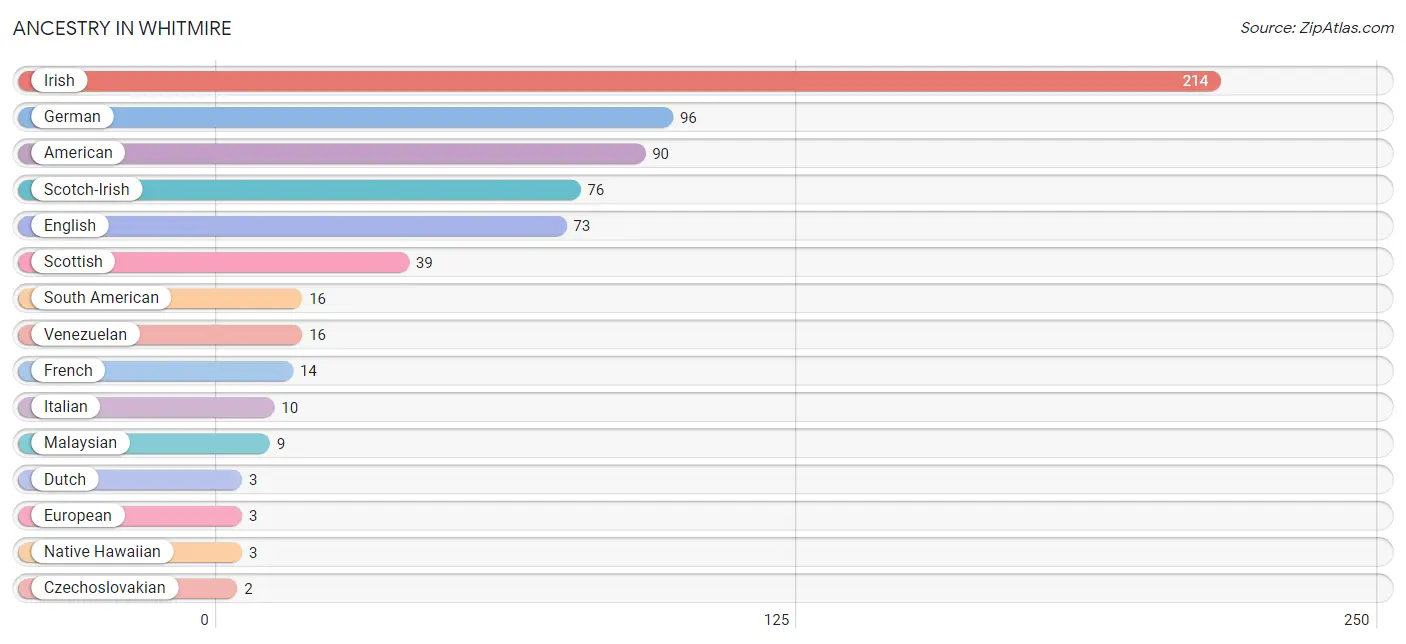
| Ancestry | # Population | % Population |
| American | 90 | 7.2% |
| Cherokee | 1 | 0.1% |
| Czechoslovakian | 2 | 0.2% |
| Dutch | 3 | 0.2% |
| English | 73 | 5.8% |
| European | 3 | 0.2% |
| French | 14 | 1.1% |
| German | 96 | 7.6% |
| Irish | 214 | 17.1% |
| Italian | 10 | 0.8% |
| Jamaican | 1 | 0.1% |
| Malaysian | 9 | 0.7% |
| Native Hawaiian | 3 | 0.2% |
| Scotch-Irish | 76 | 6.1% |
| Scottish | 39 | 3.1% |
| South American | 16 | 1.3% |
| Venezuelan | 16 | 1.3% | View All 17 Rows |
Immigrants in Whitmire
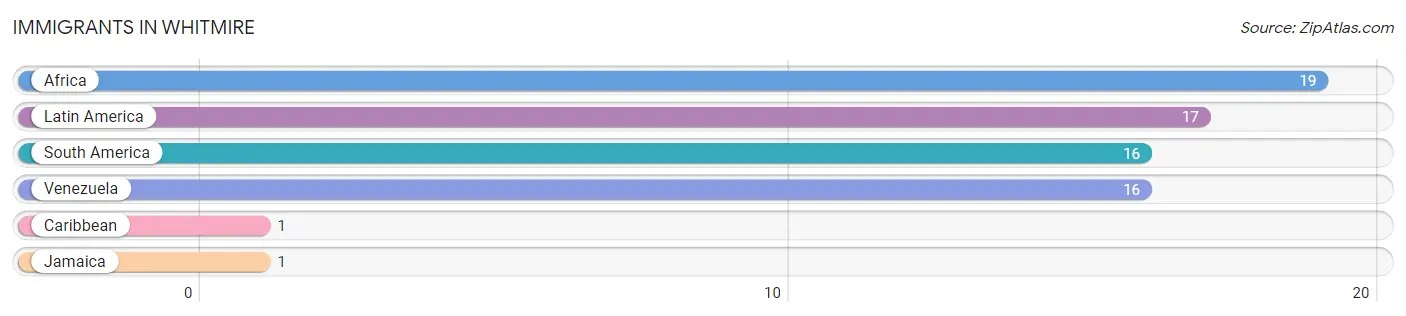
The most numerous immigrant groups reported in Whitmire came from Africa (19 | 1.5%), Latin America (17 | 1.3%), South America (16 | 1.3%), Venezuela (16 | 1.3%), and Caribbean (1 | 0.1%), together accounting for 5.5% of all Whitmire residents.
| Immigration Origin | # Population | % Population |
| Africa | 19 | 1.5% |
| Caribbean | 1 | 0.1% |
| Jamaica | 1 | 0.1% |
| Latin America | 17 | 1.3% |
| South America | 16 | 1.3% |
| Venezuela | 16 | 1.3% | View All 6 Rows |
Sex and Age in Whitmire
Sex and Age in Whitmire
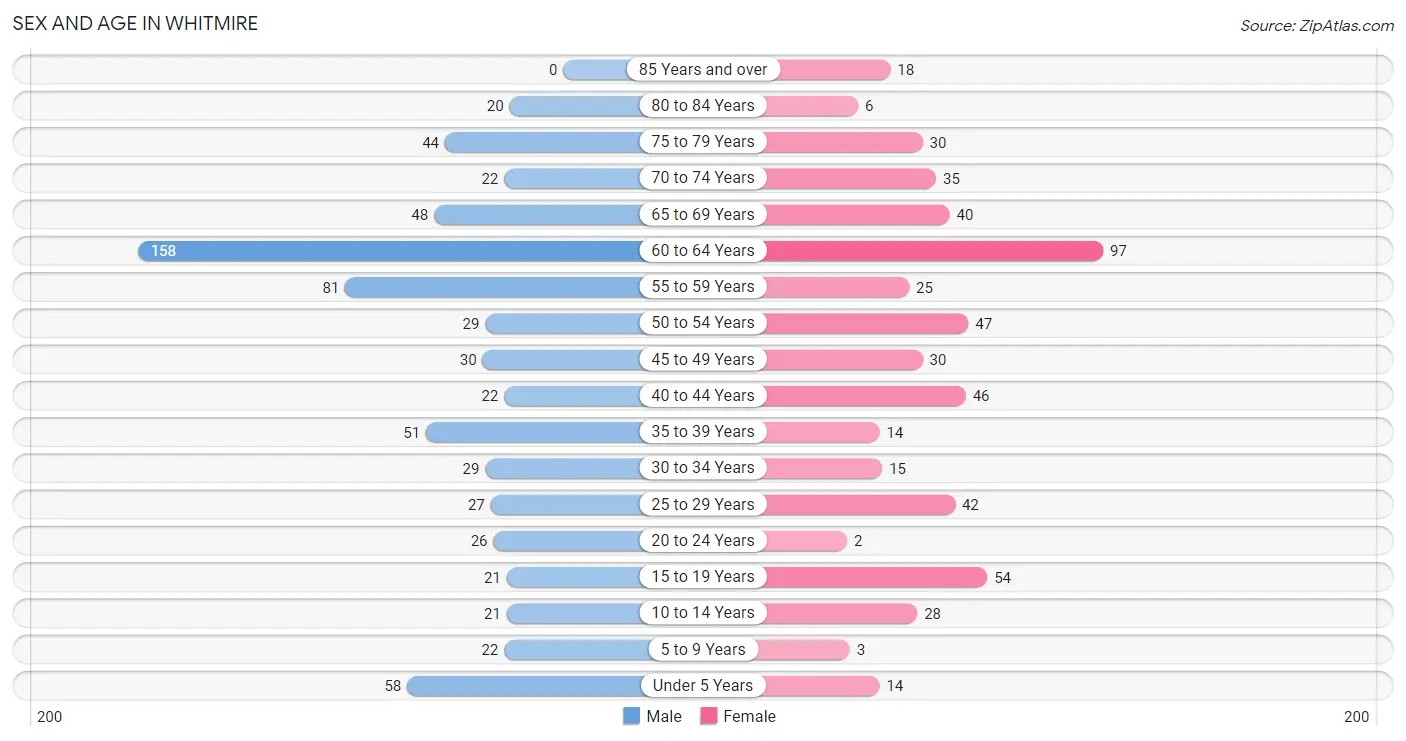
The most populous age groups in Whitmire are 60 to 64 Years (158 | 22.3%) for men and 60 to 64 Years (97 | 17.8%) for women.
| Age Bracket | Male | Female |
| Under 5 Years | 58 (8.2%) | 14 (2.6%) |
| 5 to 9 Years | 22 (3.1%) | 3 (0.5%) |
| 10 to 14 Years | 21 (3.0%) | 28 (5.1%) |
| 15 to 19 Years | 21 (3.0%) | 54 (9.9%) |
| 20 to 24 Years | 26 (3.7%) | 2 (0.4%) |
| 25 to 29 Years | 27 (3.8%) | 42 (7.7%) |
| 30 to 34 Years | 29 (4.1%) | 15 (2.8%) |
| 35 to 39 Years | 51 (7.2%) | 14 (2.6%) |
| 40 to 44 Years | 22 (3.1%) | 46 (8.4%) |
| 45 to 49 Years | 30 (4.2%) | 30 (5.5%) |
| 50 to 54 Years | 29 (4.1%) | 47 (8.6%) |
| 55 to 59 Years | 81 (11.4%) | 25 (4.6%) |
| 60 to 64 Years | 158 (22.3%) | 97 (17.8%) |
| 65 to 69 Years | 48 (6.8%) | 40 (7.3%) |
| 70 to 74 Years | 22 (3.1%) | 35 (6.4%) |
| 75 to 79 Years | 44 (6.2%) | 30 (5.5%) |
| 80 to 84 Years | 20 (2.8%) | 6 (1.1%) |
| 85 Years and over | 0 (0.0%) | 18 (3.3%) |
| Total | 709 (100.0%) | 546 (100.0%) |
Families and Households in Whitmire
Median Family Size in Whitmire
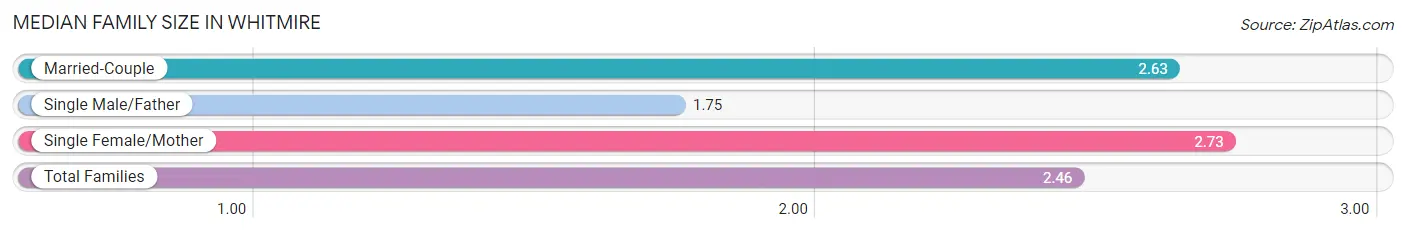
The median family size in Whitmire is 2.46 persons per family, with single female/mother families (79 | 19.7%) accounting for the largest median family size of 2.73 persons per family. On the other hand, single male/father families (88 | 22.0%) represent the smallest median family size with 1.75 persons per family.
| Family Type | # Families | Family Size |
| Married-Couple | 234 (58.4%) | 2.63 |
| Single Male/Father | 88 (22.0%) | 1.75 |
| Single Female/Mother | 79 (19.7%) | 2.73 |
| Total Families | 401 (100.0%) | 2.46 |
Median Household Size in Whitmire
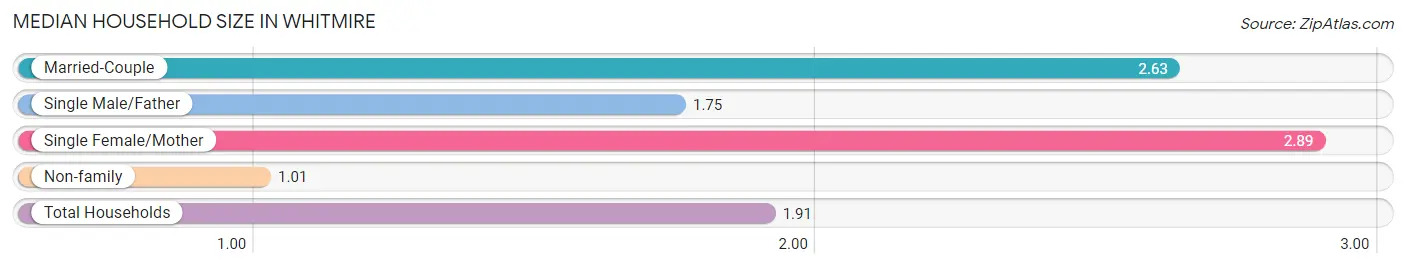
The median household size in Whitmire is 1.91 persons per household, with single female/mother households (79 | 12.0%) accounting for the largest median household size of 2.89 persons per household. non-family households (255 | 38.9%) represent the smallest median household size with 1.01 persons per household.
| Household Type | # Households | Household Size |
| Married-Couple | 234 (35.7%) | 2.63 |
| Single Male/Father | 88 (13.4%) | 1.75 |
| Single Female/Mother | 79 (12.0%) | 2.89 |
| Non-family | 255 (38.9%) | 1.01 |
| Total Households | 656 (100.0%) | 1.91 |
Household Size by Marriage Status in Whitmire
Out of a total of 656 households in Whitmire, 401 (61.1%) are family households, while 255 (38.9%) are nonfamily households. The most numerous type of family households are 3-person households, comprising 203, and the most common type of nonfamily households are 1-person households, comprising 252.
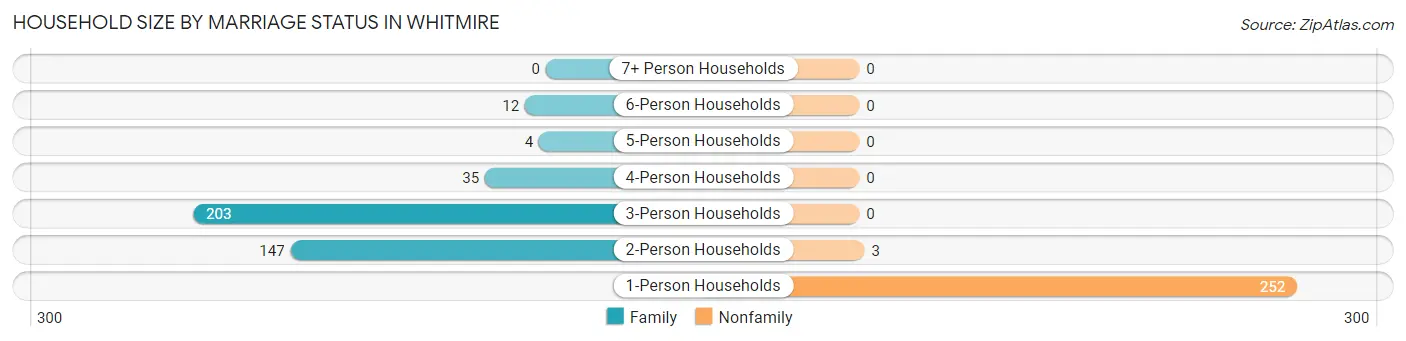
| Household Size | Family Households | Nonfamily Households |
| 1-Person Households | - | 252 (38.4%) |
| 2-Person Households | 147 (22.4%) | 3 (0.5%) |
| 3-Person Households | 203 (30.9%) | 0 (0.0%) |
| 4-Person Households | 35 (5.3%) | 0 (0.0%) |
| 5-Person Households | 4 (0.6%) | 0 (0.0%) |
| 6-Person Households | 12 (1.8%) | 0 (0.0%) |
| 7+ Person Households | 0 (0.0%) | 0 (0.0%) |
| Total | 401 (61.1%) | 255 (38.9%) |
Female Fertility in Whitmire
Fertility by Age in Whitmire
Average fertility rate in Whitmire is 158.0 births per 1,000 women. Women in the age bracket of 20 to 34 years have the highest fertility rate with 288.0 births per 1,000 women. Women in the age bracket of 35 to 50 years acount for 50.0% of all women with births.
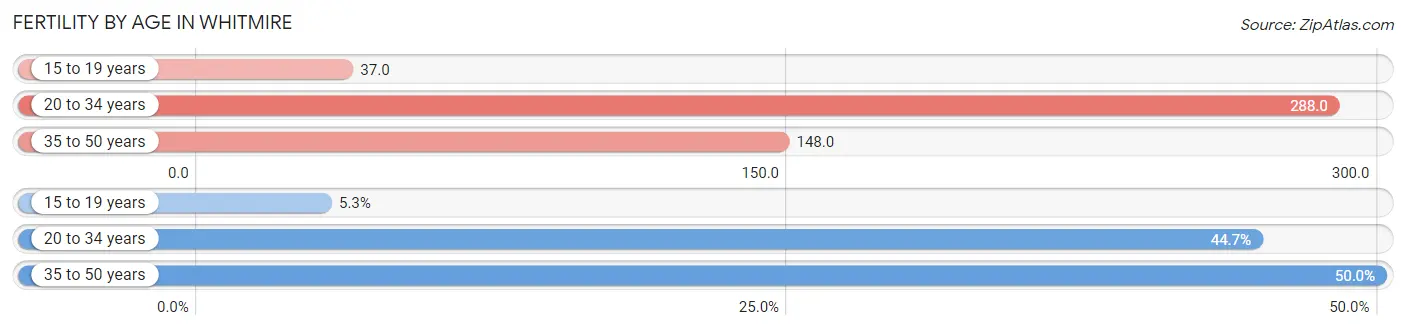
| Age Bracket | Women with Births | Births / 1,000 Women |
| 15 to 19 years | 2 (5.3%) | 37.0 |
| 20 to 34 years | 17 (44.7%) | 288.0 |
| 35 to 50 years | 19 (50.0%) | 148.0 |
| Total | 38 (100.0%) | 158.0 |
Fertility by Age by Marriage Status in Whitmire
94.7% of women with births (38) in Whitmire are married. The highest percentage of unmarried women with births falls into 15 to 19 years age bracket with 100.0% of them unmarried at the time of birth, while the lowest percentage of unmarried women with births belong to 20 to 34 years age bracket with 0.0% of them unmarried.
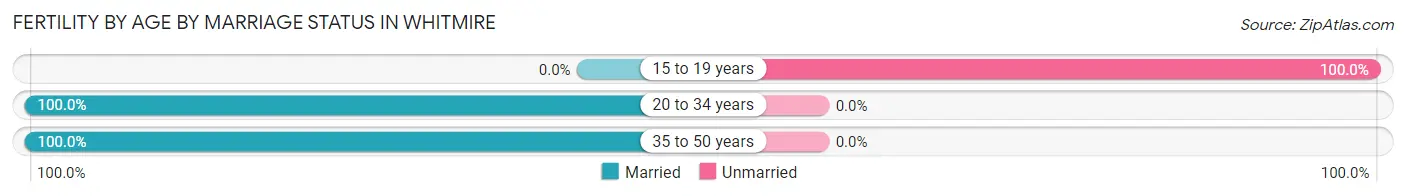
| Age Bracket | Married | Unmarried |
| 15 to 19 years | 0 (0.0%) | 2 (100.0%) |
| 20 to 34 years | 17 (100.0%) | 0 (0.0%) |
| 35 to 50 years | 19 (100.0%) | 0 (0.0%) |
| Total | 36 (94.7%) | 2 (5.3%) |
Fertility by Education in Whitmire
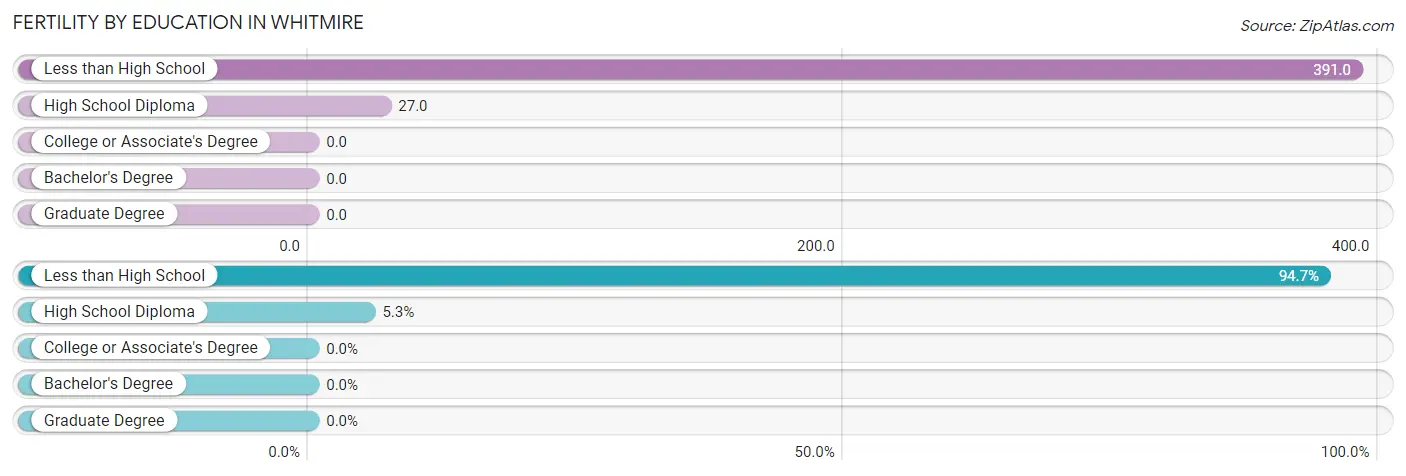
| Educational Attainment | Women with Births | Births / 1,000 Women |
| Less than High School | 36 (94.7%) | 391.0 |
| High School Diploma | 2 (5.3%) | 27.0 |
| College or Associate's Degree | 0 (0.0%) | 0.0 |
| Bachelor's Degree | 0 (0.0%) | 0.0 |
| Graduate Degree | 0 (0.0%) | 0.0 |
| Total | 38 (100.0%) | 158.0 |
Fertility by Education by Marriage Status in Whitmire
5.3% of women with births in Whitmire are unmarried. Women with the educational attainment of less than high school are most likely to be married with 100.0% of them married at childbirth, while women with the educational attainment of high school diploma are least likely to be married with 100.0% of them unmarried at childbirth.
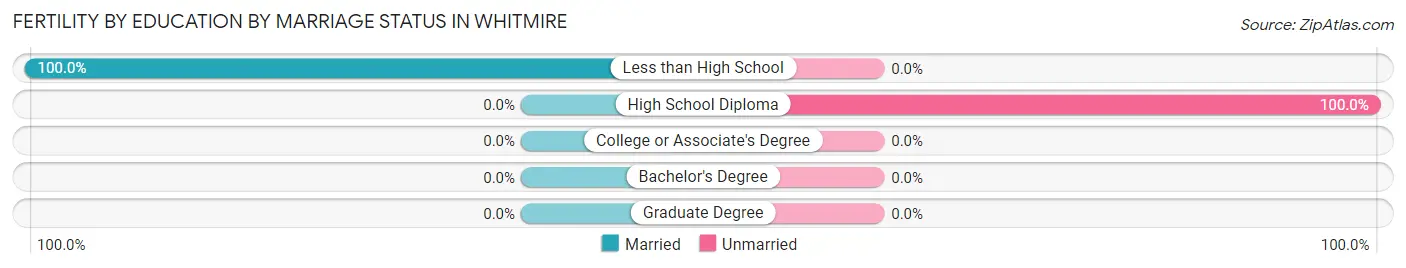
| Educational Attainment | Married | Unmarried |
| Less than High School | 36 (100.0%) | 0 (0.0%) |
| High School Diploma | 0 (0.0%) | 2 (100.0%) |
| College or Associate's Degree | 0 (0.0%) | 0 (0.0%) |
| Bachelor's Degree | 0 (0.0%) | 0 (0.0%) |
| Graduate Degree | 0 (0.0%) | 0 (0.0%) |
| Total | 36 (94.7%) | 2 (5.3%) |
Employment Characteristics in Whitmire
Employment by Class of Employer in Whitmire
Among the 498 employed individuals in Whitmire, private company employees (386 | 77.5%), state government employees (49 | 9.8%), and local government employees (24 | 4.8%) make up the most common classes of employment.
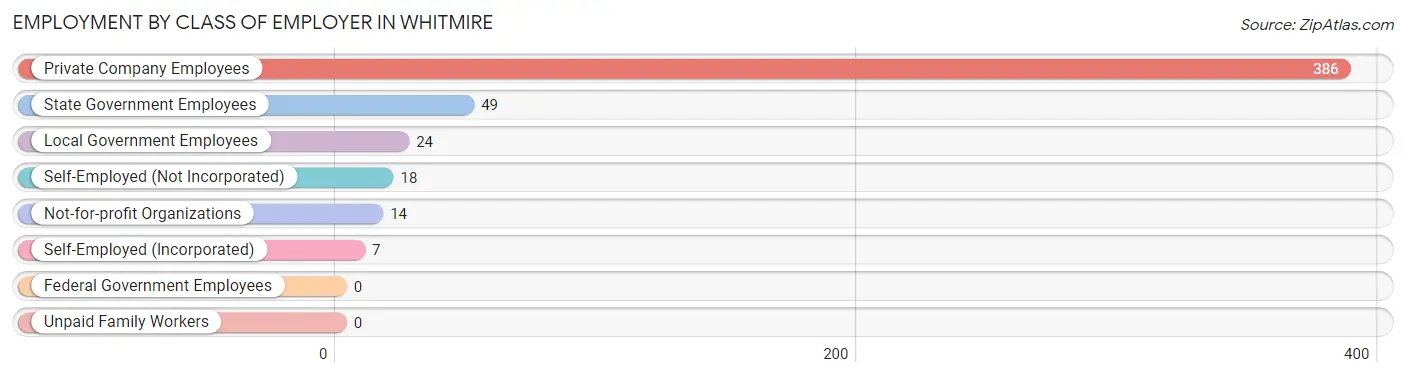
| Employer Class | # Employees | % Employees |
| Private Company Employees | 386 | 77.5% |
| Self-Employed (Incorporated) | 7 | 1.4% |
| Self-Employed (Not Incorporated) | 18 | 3.6% |
| Not-for-profit Organizations | 14 | 2.8% |
| Local Government Employees | 24 | 4.8% |
| State Government Employees | 49 | 9.8% |
| Federal Government Employees | 0 | 0.0% |
| Unpaid Family Workers | 0 | 0.0% |
| Total | 498 | 100.0% |
Employment Status by Age in Whitmire
According to the labor force statistics for Whitmire, out of the total population over 16 years of age (1,102), 49.0% or 540 individuals are in the labor force, with 5.9% or 32 of them unemployed. The age group with the highest labor force participation rate is 30 to 34 years, with 100.0% or 44 individuals in the labor force. Within the labor force, the 30 to 34 years age range has the highest percentage of unemployed individuals, with 25.0% or 11 of them being unemployed.
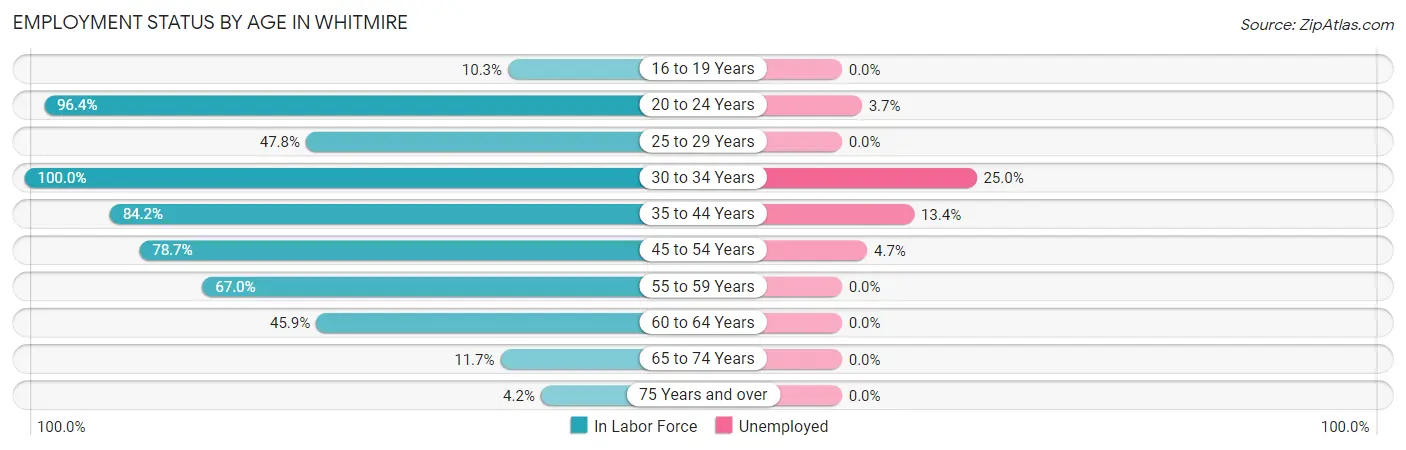
| Age Bracket | In Labor Force | Unemployed |
| 16 to 19 Years | 7 (10.3%) | 0 (0.0%) |
| 20 to 24 Years | 27 (96.4%) | 1 (3.7%) |
| 25 to 29 Years | 33 (47.8%) | 0 (0.0%) |
| 30 to 34 Years | 44 (100.0%) | 11 (25.0%) |
| 35 to 44 Years | 112 (84.2%) | 15 (13.4%) |
| 45 to 54 Years | 107 (78.7%) | 5 (4.7%) |
| 55 to 59 Years | 71 (67.0%) | 0 (0.0%) |
| 60 to 64 Years | 117 (45.9%) | 0 (0.0%) |
| 65 to 74 Years | 17 (11.7%) | 0 (0.0%) |
| 75 Years and over | 5 (4.2%) | 0 (0.0%) |
| Total | 540 (49.0%) | 32 (5.9%) |
Employment Status by Educational Attainment in Whitmire
According to labor force statistics for Whitmire, 65.1% of individuals (484) out of the total population between 25 and 64 years of age (743) are in the labor force, with 6.4% or 31 of them being unemployed. The group with the highest labor force participation rate are those with the educational attainment of bachelor's degree or higher, with 77.1% or 64 individuals in the labor force. Within the labor force, individuals with high school diploma education have the highest percentage of unemployment, with 15.2% or 31 of them being unemployed.
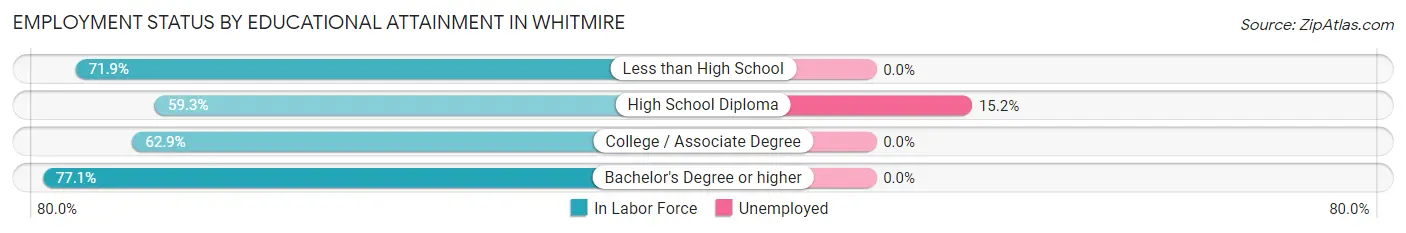
| Educational Attainment | In Labor Force | Unemployed |
| Less than High School | 138 (71.9%) | 0 (0.0%) |
| High School Diploma | 204 (59.3%) | 52 (15.2%) |
| College / Associate Degree | 78 (62.9%) | 0 (0.0%) |
| Bachelor's Degree or higher | 64 (77.1%) | 0 (0.0%) |
| Total | 484 (65.1%) | 48 (6.4%) |
Employment Occupations by Sex in Whitmire
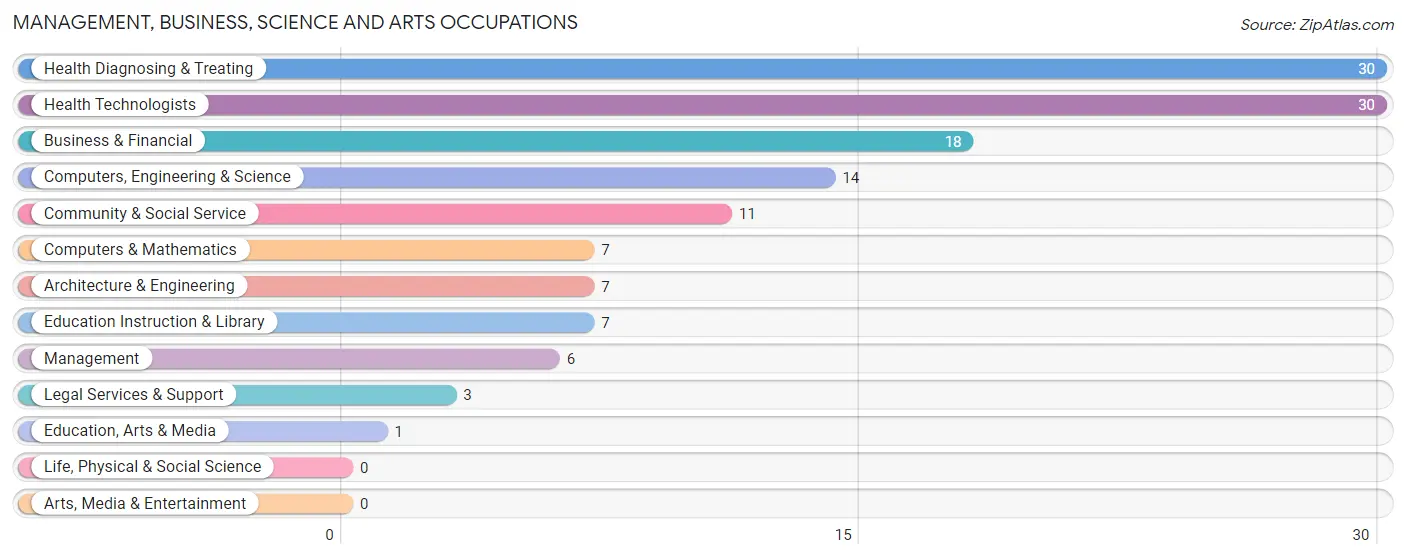
Management, Business, Science and Arts Occupations
The most common Management, Business, Science and Arts occupations in Whitmire are Health Diagnosing & Treating (30 | 5.9%), Health Technologists (30 | 5.9%), Business & Financial (18 | 3.5%), Computers, Engineering & Science (14 | 2.8%), and Community & Social Service (11 | 2.2%).
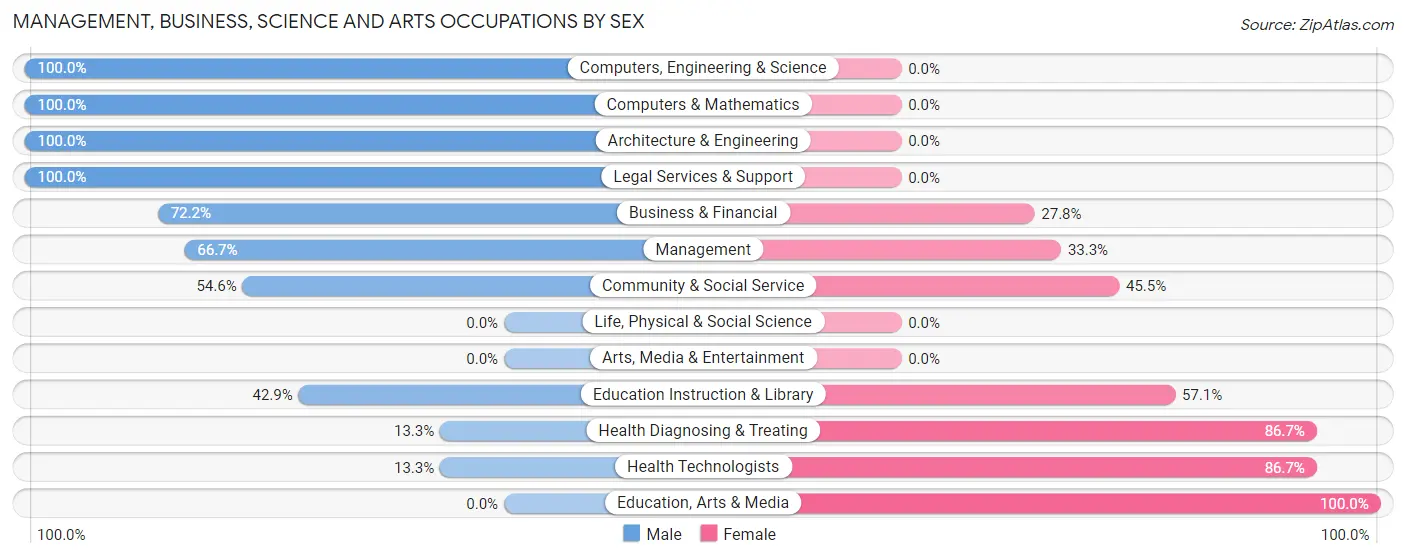
Management, Business, Science and Arts Occupations by Sex
Within the Management, Business, Science and Arts occupations in Whitmire, the most male-oriented occupations are Computers, Engineering & Science (100.0%), Computers & Mathematics (100.0%), and Architecture & Engineering (100.0%), while the most female-oriented occupations are Education, Arts & Media (100.0%), Health Diagnosing & Treating (86.7%), and Health Technologists (86.7%).
| Occupation | Male | Female |
| Management | 4 (66.7%) | 2 (33.3%) |
| Business & Financial | 13 (72.2%) | 5 (27.8%) |
| Computers, Engineering & Science | 14 (100.0%) | 0 (0.0%) |
| Computers & Mathematics | 7 (100.0%) | 0 (0.0%) |
| Architecture & Engineering | 7 (100.0%) | 0 (0.0%) |
| Life, Physical & Social Science | 0 (0.0%) | 0 (0.0%) |
| Community & Social Service | 6 (54.5%) | 5 (45.5%) |
| Education, Arts & Media | 0 (0.0%) | 1 (100.0%) |
| Legal Services & Support | 3 (100.0%) | 0 (0.0%) |
| Education Instruction & Library | 3 (42.9%) | 4 (57.1%) |
| Arts, Media & Entertainment | 0 (0.0%) | 0 (0.0%) |
| Health Diagnosing & Treating | 4 (13.3%) | 26 (86.7%) |
| Health Technologists | 4 (13.3%) | 26 (86.7%) |
| Total (Category) | 41 (51.9%) | 38 (48.1%) |
| Total (Overall) | 310 (61.0%) | 198 (39.0%) |
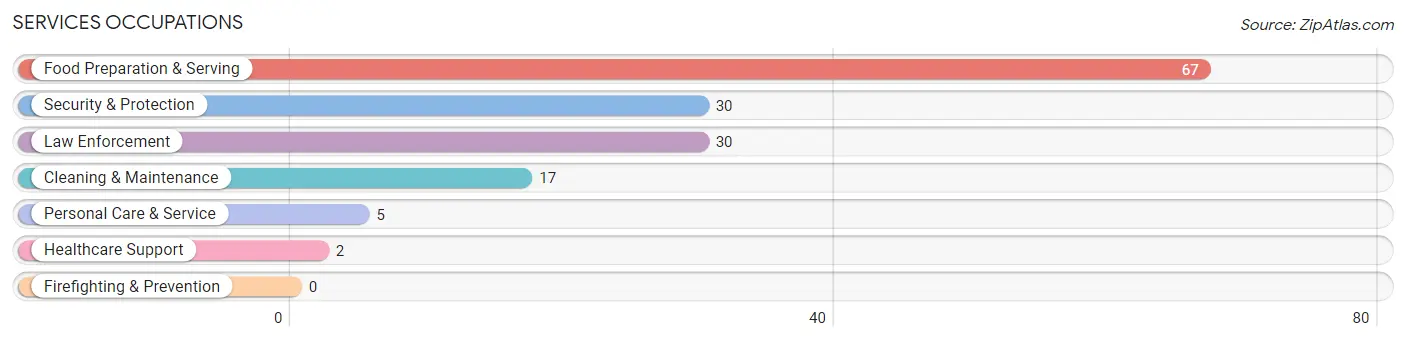
Services Occupations
The most common Services occupations in Whitmire are Food Preparation & Serving (67 | 13.2%), Security & Protection (30 | 5.9%), Law Enforcement (30 | 5.9%), Cleaning & Maintenance (17 | 3.4%), and Personal Care & Service (5 | 1.0%).
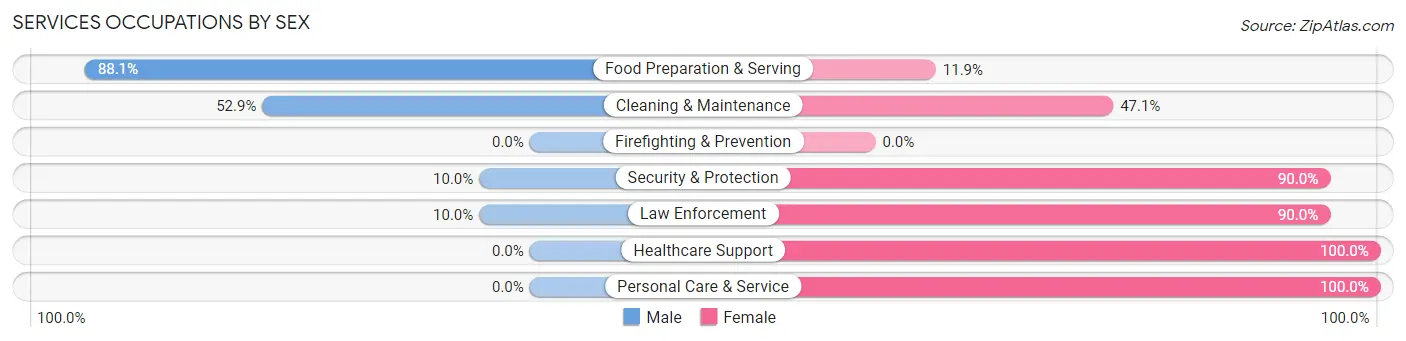
Services Occupations by Sex
Within the Services occupations in Whitmire, the most male-oriented occupations are Food Preparation & Serving (88.1%), Cleaning & Maintenance (52.9%), and Security & Protection (10.0%), while the most female-oriented occupations are Healthcare Support (100.0%), Personal Care & Service (100.0%), and Security & Protection (90.0%).
| Occupation | Male | Female |
| Healthcare Support | 0 (0.0%) | 2 (100.0%) |
| Security & Protection | 3 (10.0%) | 27 (90.0%) |
| Firefighting & Prevention | 0 (0.0%) | 0 (0.0%) |
| Law Enforcement | 3 (10.0%) | 27 (90.0%) |
| Food Preparation & Serving | 59 (88.1%) | 8 (11.9%) |
| Cleaning & Maintenance | 9 (52.9%) | 8 (47.1%) |
| Personal Care & Service | 0 (0.0%) | 5 (100.0%) |
| Total (Category) | 71 (58.7%) | 50 (41.3%) |
| Total (Overall) | 310 (61.0%) | 198 (39.0%) |
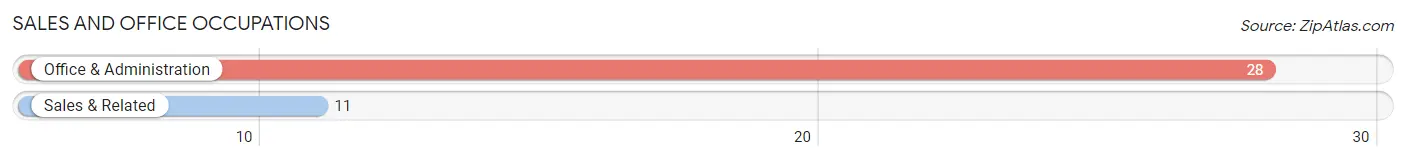
Sales and Office Occupations
The most common Sales and Office occupations in Whitmire are Office & Administration (28 | 5.5%), and Sales & Related (11 | 2.2%).
Sales and Office Occupations by Sex
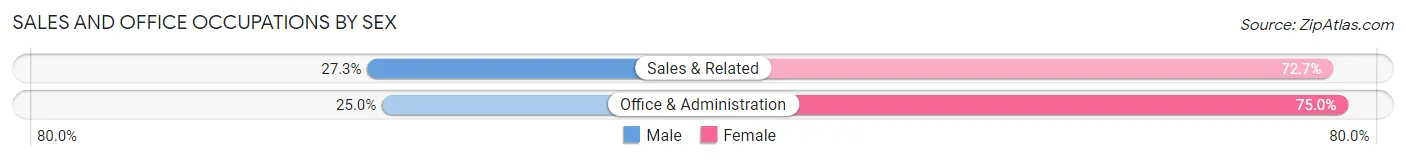
| Occupation | Male | Female |
| Sales & Related | 3 (27.3%) | 8 (72.7%) |
| Office & Administration | 7 (25.0%) | 21 (75.0%) |
| Total (Category) | 10 (25.6%) | 29 (74.4%) |
| Total (Overall) | 310 (61.0%) | 198 (39.0%) |
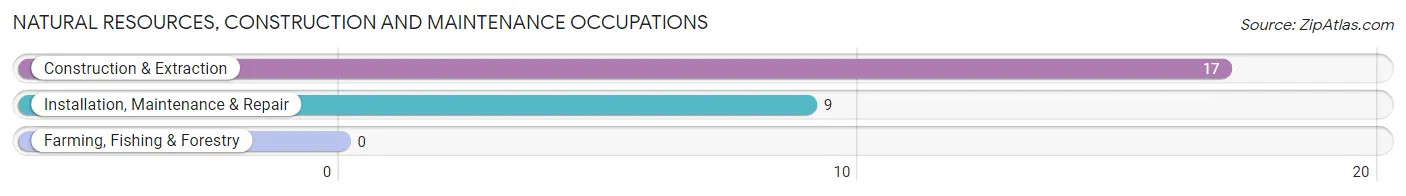
Natural Resources, Construction and Maintenance Occupations
The most common Natural Resources, Construction and Maintenance occupations in Whitmire are Construction & Extraction (17 | 3.4%), and Installation, Maintenance & Repair (9 | 1.8%).
Natural Resources, Construction and Maintenance Occupations by Sex
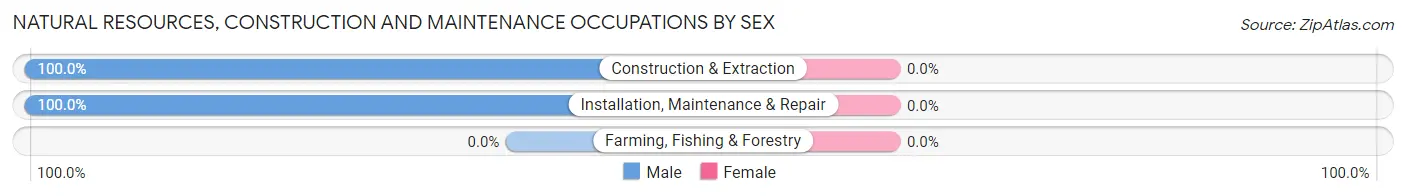
| Occupation | Male | Female |
| Farming, Fishing & Forestry | 0 (0.0%) | 0 (0.0%) |
| Construction & Extraction | 17 (100.0%) | 0 (0.0%) |
| Installation, Maintenance & Repair | 9 (100.0%) | 0 (0.0%) |
| Total (Category) | 26 (100.0%) | 0 (0.0%) |
| Total (Overall) | 310 (61.0%) | 198 (39.0%) |
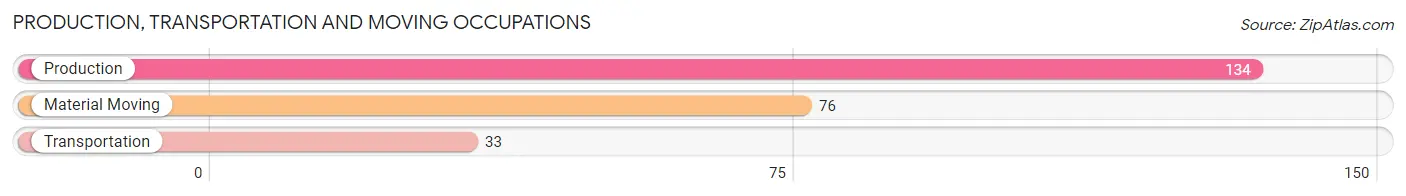
Production, Transportation and Moving Occupations
The most common Production, Transportation and Moving occupations in Whitmire are Production (134 | 26.4%), Material Moving (76 | 15.0%), and Transportation (33 | 6.5%).
Production, Transportation and Moving Occupations by Sex
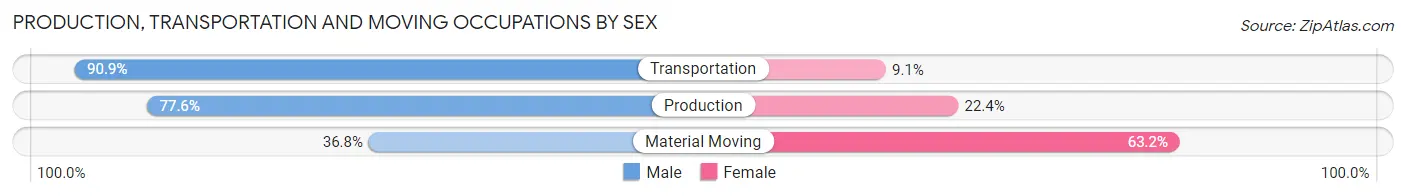
| Occupation | Male | Female |
| Production | 104 (77.6%) | 30 (22.4%) |
| Transportation | 30 (90.9%) | 3 (9.1%) |
| Material Moving | 28 (36.8%) | 48 (63.2%) |
| Total (Category) | 162 (66.7%) | 81 (33.3%) |
| Total (Overall) | 310 (61.0%) | 198 (39.0%) |
Employment Industries by Sex in Whitmire
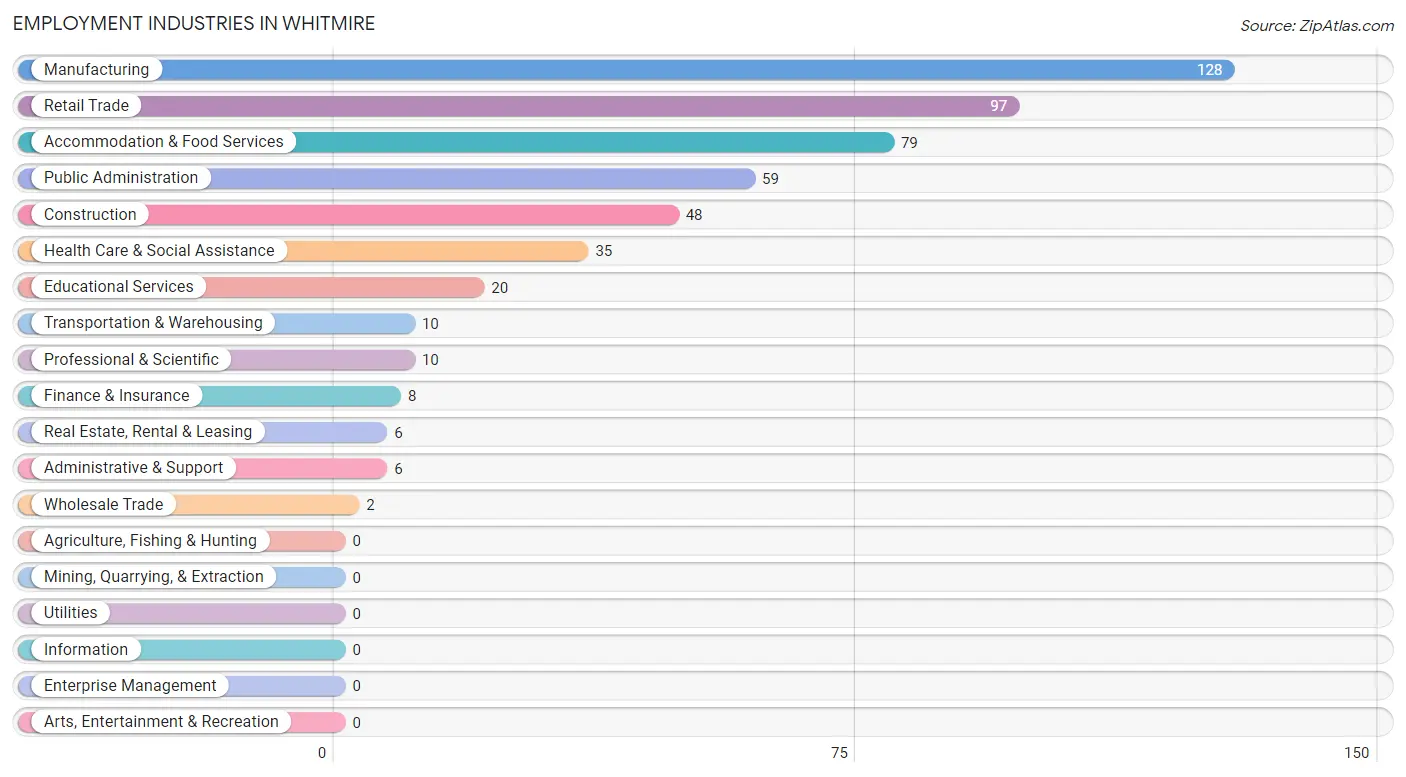
Employment Industries in Whitmire
The major employment industries in Whitmire include Manufacturing (128 | 25.2%), Retail Trade (97 | 19.1%), Accommodation & Food Services (79 | 15.5%), Public Administration (59 | 11.6%), and Construction (48 | 9.5%).
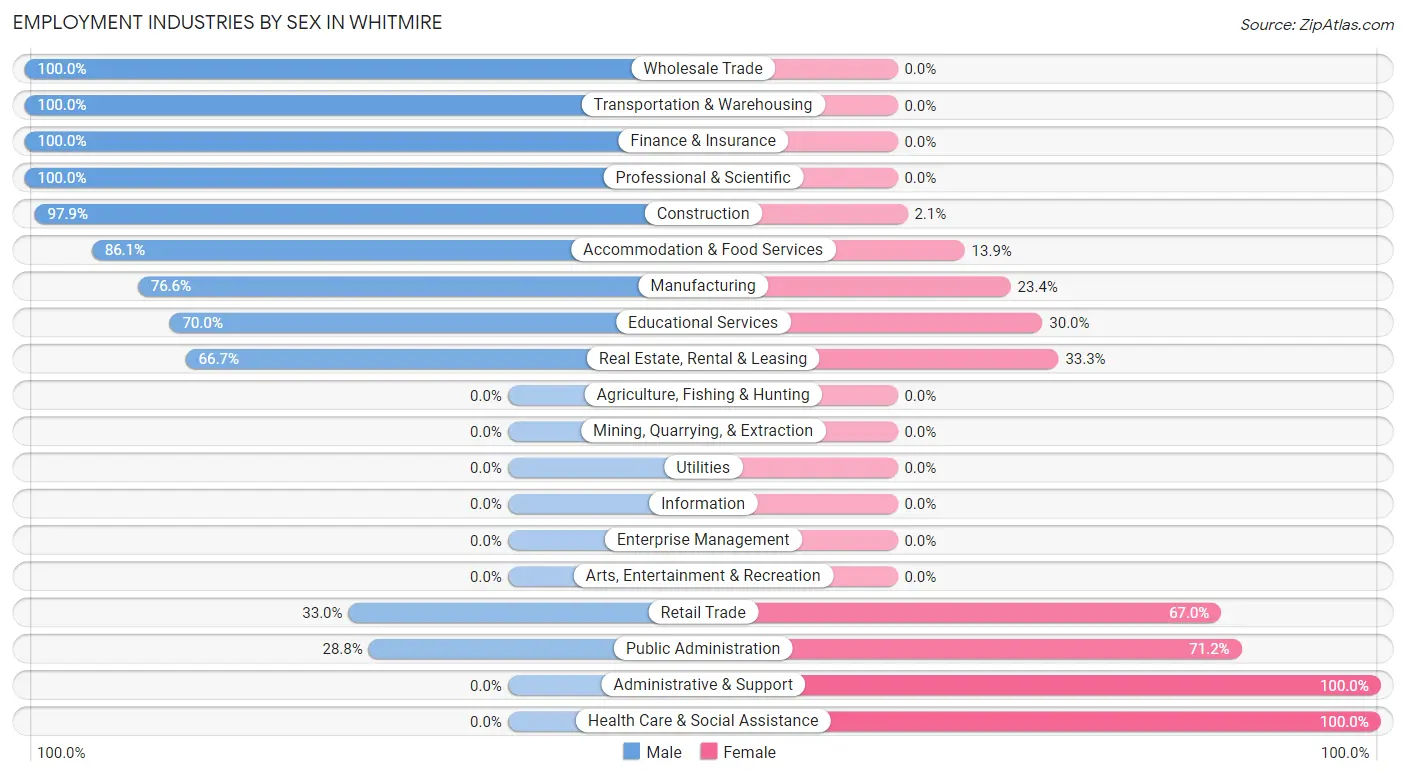
Employment Industries by Sex in Whitmire
The Whitmire industries that see more men than women are Wholesale Trade (100.0%), Transportation & Warehousing (100.0%), and Finance & Insurance (100.0%), whereas the industries that tend to have a higher number of women are Administrative & Support (100.0%), Health Care & Social Assistance (100.0%), and Public Administration (71.2%).
| Industry | Male | Female |
| Agriculture, Fishing & Hunting | 0 (0.0%) | 0 (0.0%) |
| Mining, Quarrying, & Extraction | 0 (0.0%) | 0 (0.0%) |
| Construction | 47 (97.9%) | 1 (2.1%) |
| Manufacturing | 98 (76.6%) | 30 (23.4%) |
| Wholesale Trade | 2 (100.0%) | 0 (0.0%) |
| Retail Trade | 32 (33.0%) | 65 (67.0%) |
| Transportation & Warehousing | 10 (100.0%) | 0 (0.0%) |
| Utilities | 0 (0.0%) | 0 (0.0%) |
| Information | 0 (0.0%) | 0 (0.0%) |
| Finance & Insurance | 8 (100.0%) | 0 (0.0%) |
| Real Estate, Rental & Leasing | 4 (66.7%) | 2 (33.3%) |
| Professional & Scientific | 10 (100.0%) | 0 (0.0%) |
| Enterprise Management | 0 (0.0%) | 0 (0.0%) |
| Administrative & Support | 0 (0.0%) | 6 (100.0%) |
| Educational Services | 14 (70.0%) | 6 (30.0%) |
| Health Care & Social Assistance | 0 (0.0%) | 35 (100.0%) |
| Arts, Entertainment & Recreation | 0 (0.0%) | 0 (0.0%) |
| Accommodation & Food Services | 68 (86.1%) | 11 (13.9%) |
| Public Administration | 17 (28.8%) | 42 (71.2%) |
| Total | 310 (61.0%) | 198 (39.0%) |
Education in Whitmire
School Enrollment in Whitmire
The most common levels of schooling among the 161 students in Whitmire are high school (60 | 37.3%), middle school (49 | 30.4%), and elementary school (25 | 15.5%).
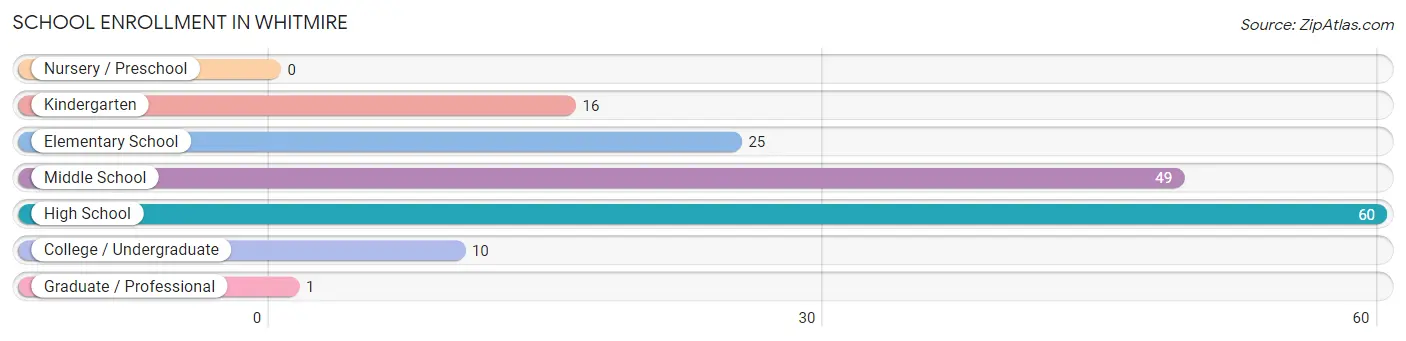
| School Level | # Students | % Students |
| Nursery / Preschool | 0 | 0.0% |
| Kindergarten | 16 | 9.9% |
| Elementary School | 25 | 15.5% |
| Middle School | 49 | 30.4% |
| High School | 60 | 37.3% |
| College / Undergraduate | 10 | 6.2% |
| Graduate / Professional | 1 | 0.6% |
| Total | 161 | 100.0% |
School Enrollment by Age by Funding Source in Whitmire
Out of a total of 161 students who are enrolled in schools in Whitmire, 49 (30.4%) attend a private institution, while the remaining 112 (69.6%) are enrolled in public schools. The age group of 3 to 4 year olds has the highest likelihood of being enrolled in private schools, with 16 (100.0% in the age bracket) enrolled. Conversely, the age group of 35 years and over has the lowest likelihood of being enrolled in a private school, with 4 (100.0% in the age bracket) attending a public institution.
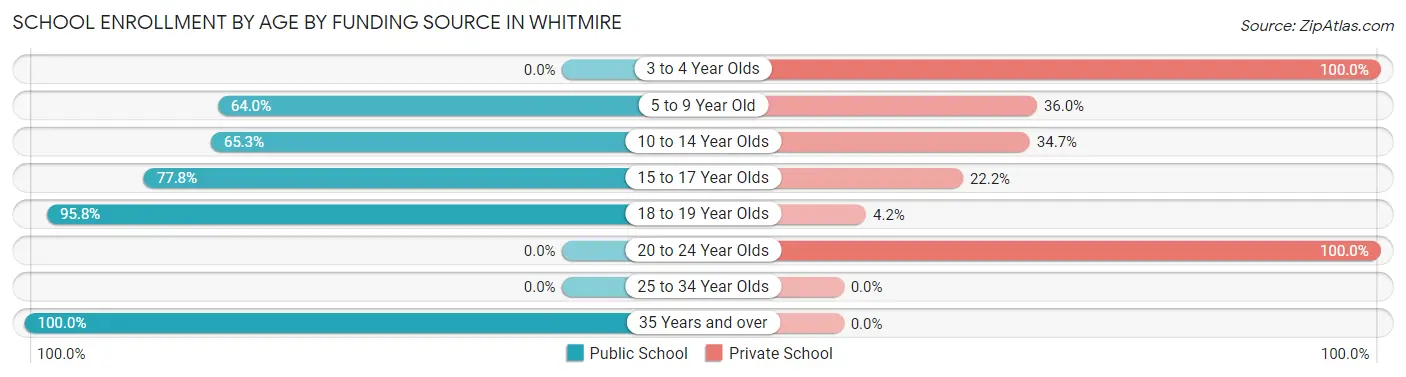
| Age Bracket | Public School | Private School |
| 3 to 4 Year Olds | 0 (0.0%) | 16 (100.0%) |
| 5 to 9 Year Old | 16 (64.0%) | 9 (36.0%) |
| 10 to 14 Year Olds | 32 (65.3%) | 17 (34.7%) |
| 15 to 17 Year Olds | 14 (77.8%) | 4 (22.2%) |
| 18 to 19 Year Olds | 46 (95.8%) | 2 (4.2%) |
| 20 to 24 Year Olds | 0 (0.0%) | 1 (100.0%) |
| 25 to 34 Year Olds | 0 (0.0%) | 0 (0.0%) |
| 35 Years and over | 4 (100.0%) | 0 (0.0%) |
| Total | 112 (69.6%) | 49 (30.4%) |
Educational Attainment by Field of Study in Whitmire
Education (34 | 26.2%), business (33 | 25.4%), bio, nature & agricultural (13 | 10.0%), liberal arts & history (12 | 9.2%), and visual & performing arts (11 | 8.5%) are the most common fields of study among 130 individuals in Whitmire who have obtained a bachelor's degree or higher.
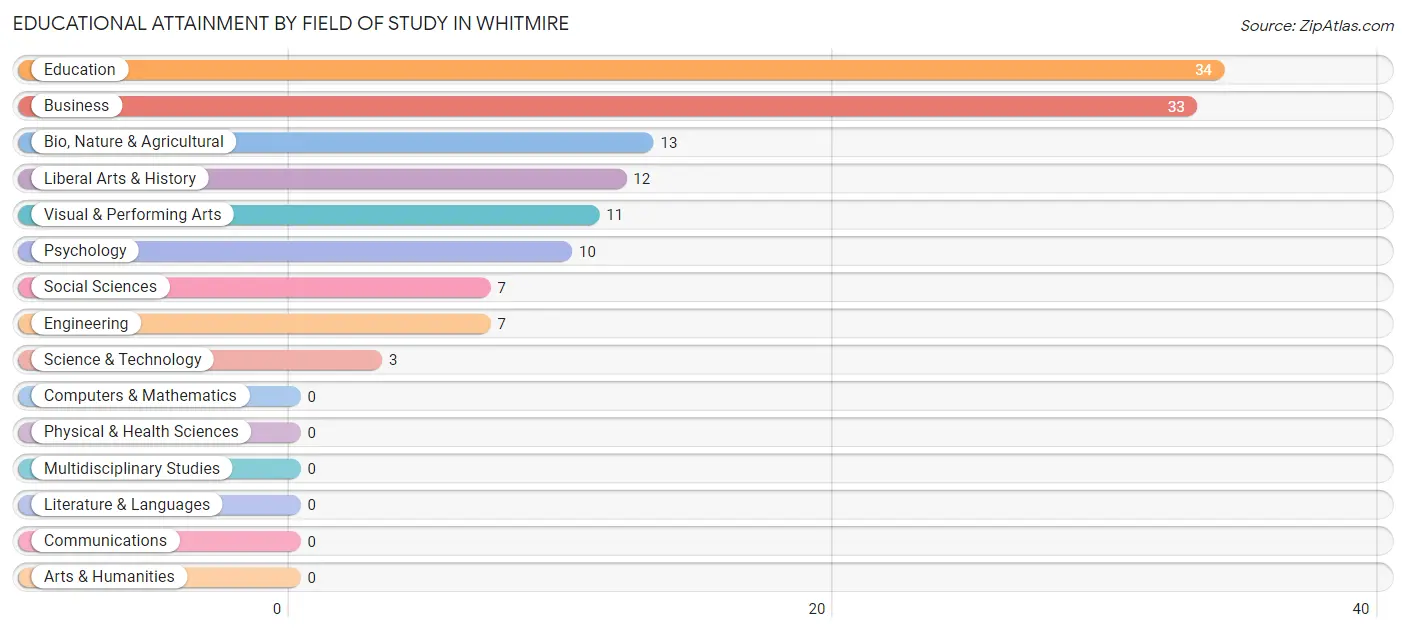
| Field of Study | # Graduates | % Graduates |
| Computers & Mathematics | 0 | 0.0% |
| Bio, Nature & Agricultural | 13 | 10.0% |
| Physical & Health Sciences | 0 | 0.0% |
| Psychology | 10 | 7.7% |
| Social Sciences | 7 | 5.4% |
| Engineering | 7 | 5.4% |
| Multidisciplinary Studies | 0 | 0.0% |
| Science & Technology | 3 | 2.3% |
| Business | 33 | 25.4% |
| Education | 34 | 26.2% |
| Literature & Languages | 0 | 0.0% |
| Liberal Arts & History | 12 | 9.2% |
| Visual & Performing Arts | 11 | 8.5% |
| Communications | 0 | 0.0% |
| Arts & Humanities | 0 | 0.0% |
| Total | 130 | 100.0% |
Transportation & Commute in Whitmire
Vehicle Availability by Sex in Whitmire
The most prevalent vehicle ownership categories in Whitmire are males with 2 vehicles (146, accounting for 47.7%) and females with 2 vehicles (64, making up 76.0%).
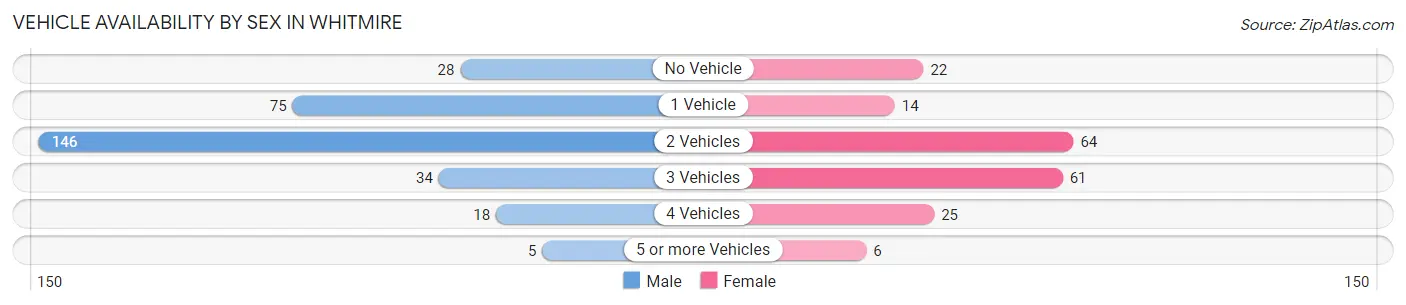
| Vehicles Available | Male | Female |
| No Vehicle | 28 (9.1%) | 22 (11.5%) |
| 1 Vehicle | 75 (24.5%) | 14 (7.3%) |
| 2 Vehicles | 146 (47.7%) | 64 (33.3%) |
| 3 Vehicles | 34 (11.1%) | 61 (31.8%) |
| 4 Vehicles | 18 (5.9%) | 25 (13.0%) |
| 5 or more Vehicles | 5 (1.6%) | 6 (3.1%) |
| Total | 306 (100.0%) | 192 (100.0%) |
Commute Time in Whitmire
The most frequently occuring commute durations in Whitmire are 20 to 24 minutes (129 commuters, 26.2%), 45 to 59 minutes (77 commuters, 15.6%), and 60 to 89 minutes (75 commuters, 15.2%).
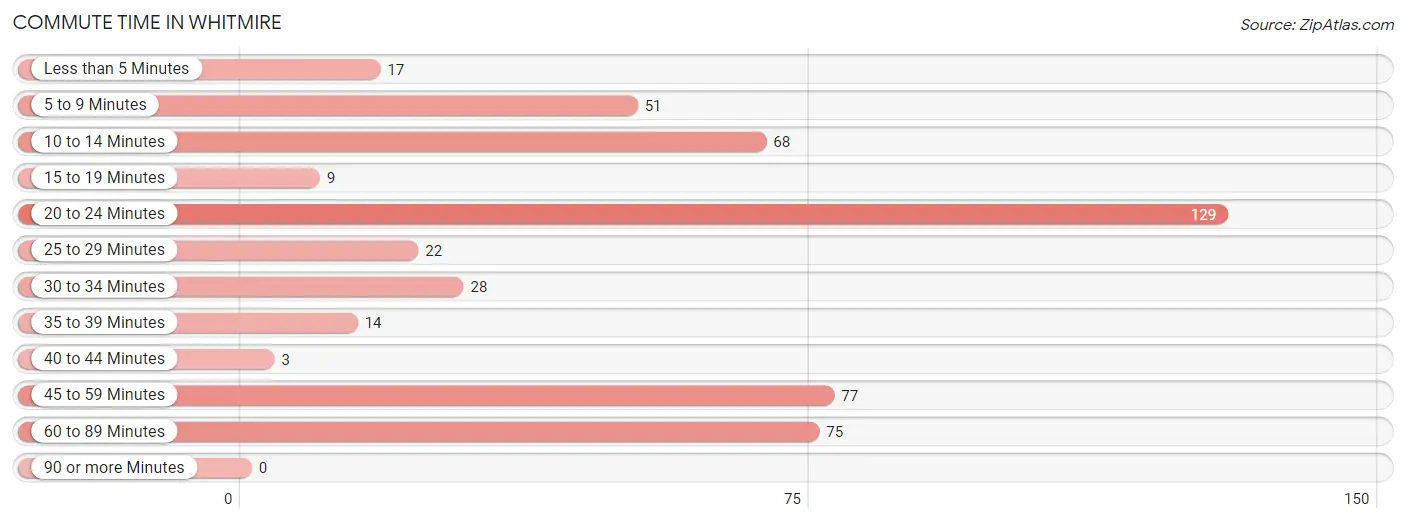
| Commute Time | # Commuters | % Commuters |
| Less than 5 Minutes | 17 | 3.5% |
| 5 to 9 Minutes | 51 | 10.3% |
| 10 to 14 Minutes | 68 | 13.8% |
| 15 to 19 Minutes | 9 | 1.8% |
| 20 to 24 Minutes | 129 | 26.2% |
| 25 to 29 Minutes | 22 | 4.5% |
| 30 to 34 Minutes | 28 | 5.7% |
| 35 to 39 Minutes | 14 | 2.8% |
| 40 to 44 Minutes | 3 | 0.6% |
| 45 to 59 Minutes | 77 | 15.6% |
| 60 to 89 Minutes | 75 | 15.2% |
| 90 or more Minutes | 0 | 0.0% |
Commute Time by Sex in Whitmire
The most common commute times in Whitmire are 20 to 24 minutes (78 commuters, 25.5%) for males and 20 to 24 minutes (51 commuters, 27.3%) for females.
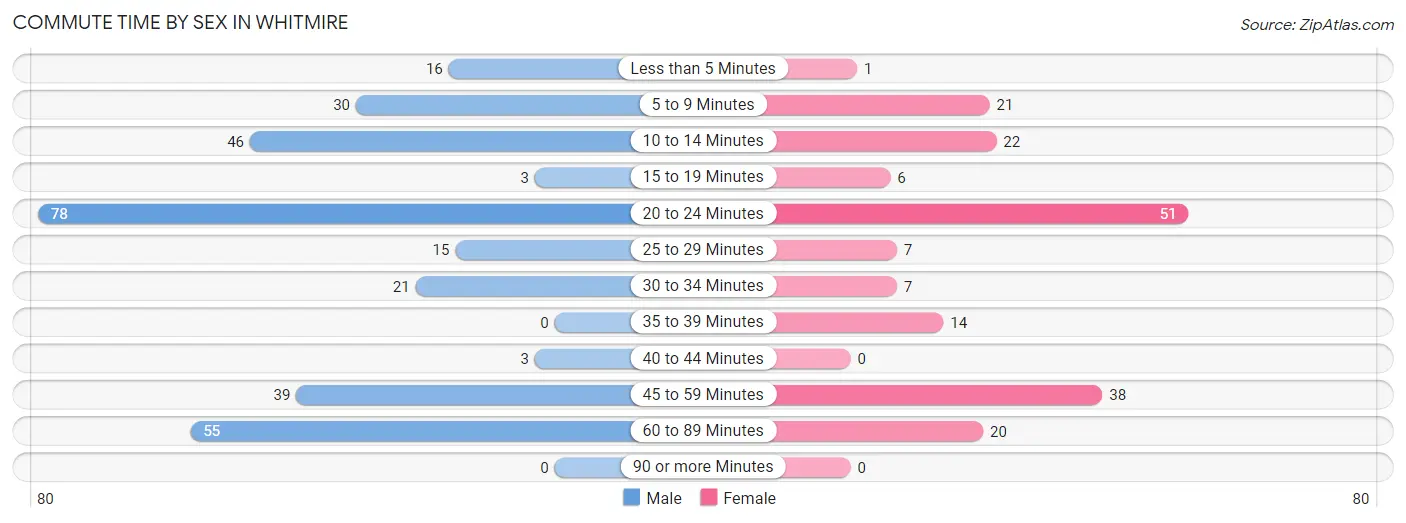
| Commute Time | Male | Female |
| Less than 5 Minutes | 16 (5.2%) | 1 (0.5%) |
| 5 to 9 Minutes | 30 (9.8%) | 21 (11.2%) |
| 10 to 14 Minutes | 46 (15.0%) | 22 (11.8%) |
| 15 to 19 Minutes | 3 (1.0%) | 6 (3.2%) |
| 20 to 24 Minutes | 78 (25.5%) | 51 (27.3%) |
| 25 to 29 Minutes | 15 (4.9%) | 7 (3.7%) |
| 30 to 34 Minutes | 21 (6.9%) | 7 (3.7%) |
| 35 to 39 Minutes | 0 (0.0%) | 14 (7.5%) |
| 40 to 44 Minutes | 3 (1.0%) | 0 (0.0%) |
| 45 to 59 Minutes | 39 (12.8%) | 38 (20.3%) |
| 60 to 89 Minutes | 55 (18.0%) | 20 (10.7%) |
| 90 or more Minutes | 0 (0.0%) | 0 (0.0%) |
Time of Departure to Work by Sex in Whitmire
The most frequent times of departure to work in Whitmire are 7:00 AM to 7:29 AM (63, 20.6%) for males and 8:00 AM to 8:29 AM (54, 28.9%) for females.
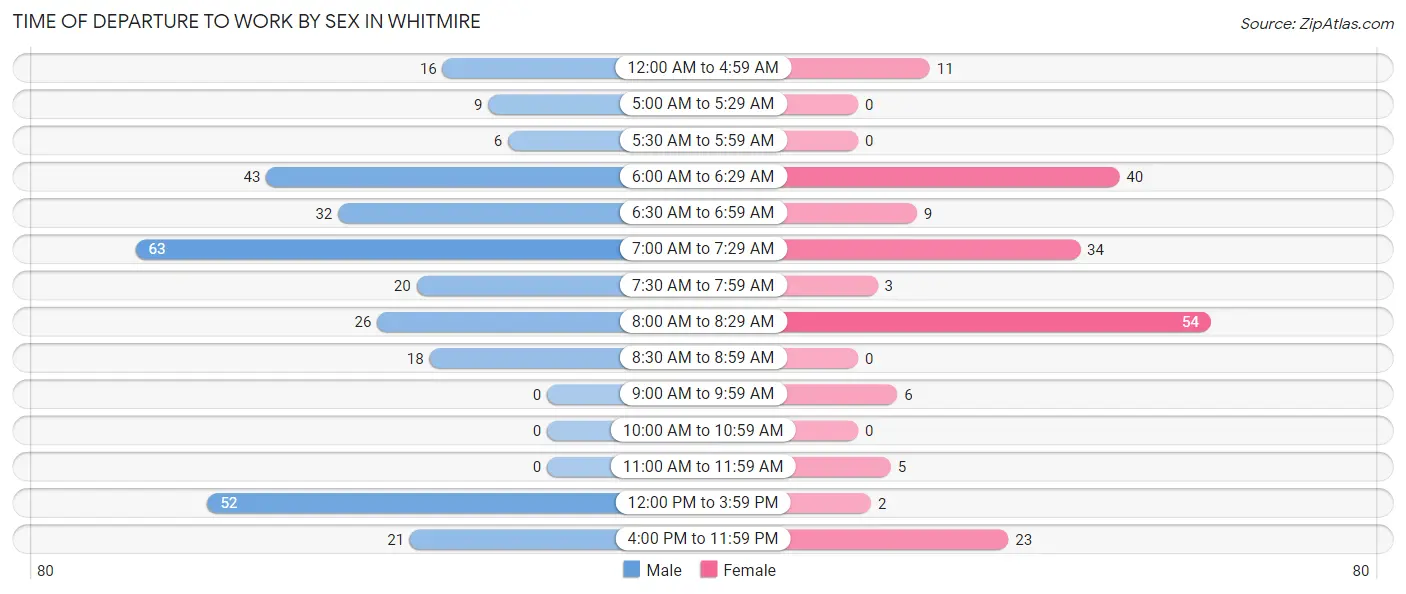
| Time of Departure | Male | Female |
| 12:00 AM to 4:59 AM | 16 (5.2%) | 11 (5.9%) |
| 5:00 AM to 5:29 AM | 9 (2.9%) | 0 (0.0%) |
| 5:30 AM to 5:59 AM | 6 (2.0%) | 0 (0.0%) |
| 6:00 AM to 6:29 AM | 43 (14.1%) | 40 (21.4%) |
| 6:30 AM to 6:59 AM | 32 (10.5%) | 9 (4.8%) |
| 7:00 AM to 7:29 AM | 63 (20.6%) | 34 (18.2%) |
| 7:30 AM to 7:59 AM | 20 (6.5%) | 3 (1.6%) |
| 8:00 AM to 8:29 AM | 26 (8.5%) | 54 (28.9%) |
| 8:30 AM to 8:59 AM | 18 (5.9%) | 0 (0.0%) |
| 9:00 AM to 9:59 AM | 0 (0.0%) | 6 (3.2%) |
| 10:00 AM to 10:59 AM | 0 (0.0%) | 0 (0.0%) |
| 11:00 AM to 11:59 AM | 0 (0.0%) | 5 (2.7%) |
| 12:00 PM to 3:59 PM | 52 (17.0%) | 2 (1.1%) |
| 4:00 PM to 11:59 PM | 21 (6.9%) | 23 (12.3%) |
| Total | 306 (100.0%) | 187 (100.0%) |
Housing Occupancy in Whitmire
Occupancy by Ownership in Whitmire
Of the total 656 dwellings in Whitmire, owner-occupied units account for 521 (79.4%), while renter-occupied units make up 135 (20.6%).
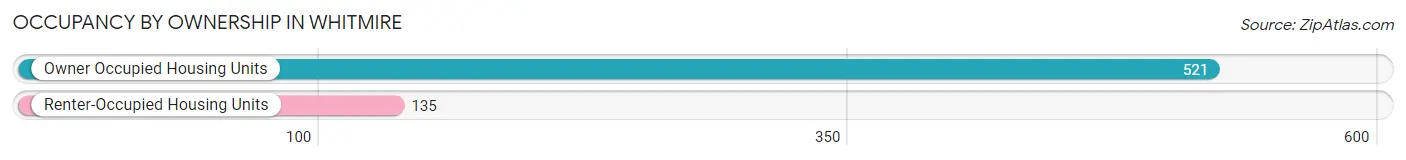
| Occupancy | # Housing Units | % Housing Units |
| Owner Occupied Housing Units | 521 | 79.4% |
| Renter-Occupied Housing Units | 135 | 20.6% |
| Total Occupied Housing Units | 656 | 100.0% |
Occupancy by Household Size in Whitmire
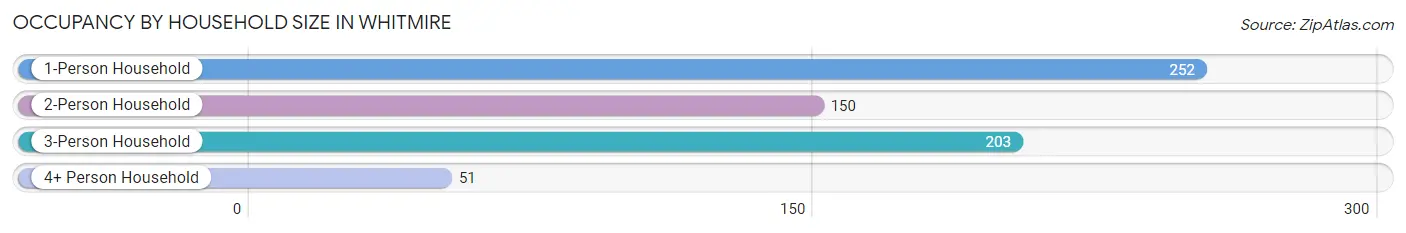
| Household Size | # Housing Units | % Housing Units |
| 1-Person Household | 252 | 38.4% |
| 2-Person Household | 150 | 22.9% |
| 3-Person Household | 203 | 30.9% |
| 4+ Person Household | 51 | 7.8% |
| Total Housing Units | 656 | 100.0% |
Occupancy by Ownership by Household Size in Whitmire
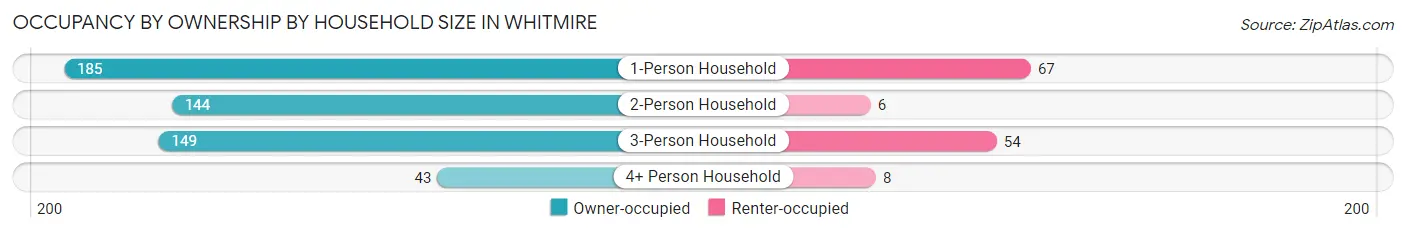
| Household Size | Owner-occupied | Renter-occupied |
| 1-Person Household | 185 (73.4%) | 67 (26.6%) |
| 2-Person Household | 144 (96.0%) | 6 (4.0%) |
| 3-Person Household | 149 (73.4%) | 54 (26.6%) |
| 4+ Person Household | 43 (84.3%) | 8 (15.7%) |
| Total Housing Units | 521 (79.4%) | 135 (20.6%) |
Occupancy by Educational Attainment in Whitmire
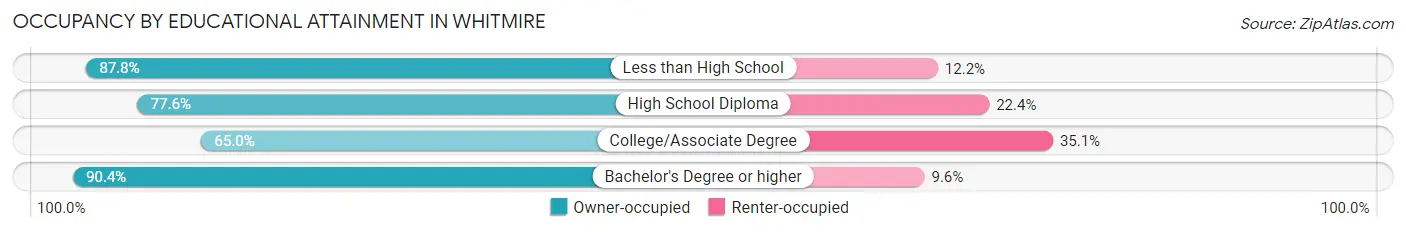
| Household Size | Owner-occupied | Renter-occupied |
| Less than High School | 129 (87.8%) | 18 (12.2%) |
| High School Diploma | 263 (77.6%) | 76 (22.4%) |
| College/Associate Degree | 63 (64.9%) | 34 (35.0%) |
| Bachelor's Degree or higher | 66 (90.4%) | 7 (9.6%) |
Occupancy by Age of Householder in Whitmire
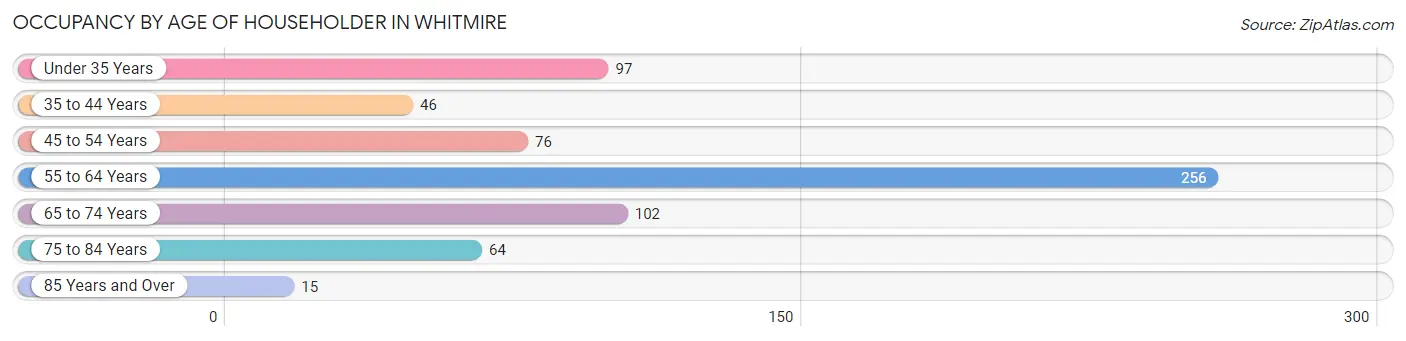
| Age Bracket | # Households | % Households |
| Under 35 Years | 97 | 14.8% |
| 35 to 44 Years | 46 | 7.0% |
| 45 to 54 Years | 76 | 11.6% |
| 55 to 64 Years | 256 | 39.0% |
| 65 to 74 Years | 102 | 15.5% |
| 75 to 84 Years | 64 | 9.8% |
| 85 Years and Over | 15 | 2.3% |
| Total | 656 | 100.0% |
Housing Finances in Whitmire
Median Income by Occupancy in Whitmire
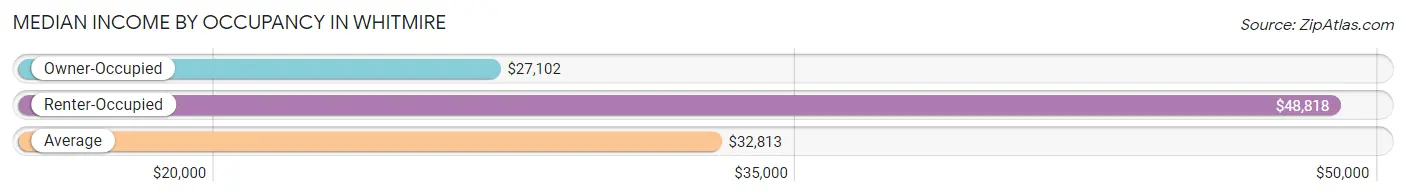
| Occupancy Type | # Households | Median Income |
| Owner-Occupied | 521 (79.4%) | $27,102 |
| Renter-Occupied | 135 (20.6%) | $48,818 |
| Average | 656 (100.0%) | $32,813 |
Occupancy by Householder Income Bracket in Whitmire
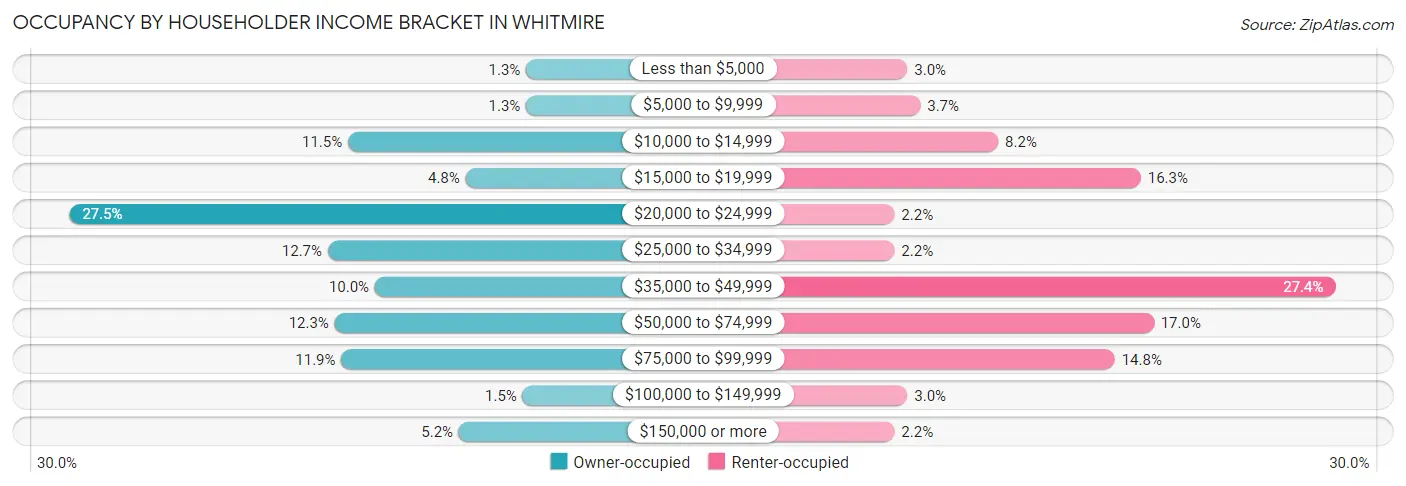
| Income Bracket | Owner-occupied | Renter-occupied |
| Less than $5,000 | 7 (1.3%) | 4 (3.0%) |
| $5,000 to $9,999 | 7 (1.3%) | 5 (3.7%) |
| $10,000 to $14,999 | 60 (11.5%) | 11 (8.2%) |
| $15,000 to $19,999 | 25 (4.8%) | 22 (16.3%) |
| $20,000 to $24,999 | 143 (27.5%) | 3 (2.2%) |
| $25,000 to $34,999 | 66 (12.7%) | 3 (2.2%) |
| $35,000 to $49,999 | 52 (10.0%) | 37 (27.4%) |
| $50,000 to $74,999 | 64 (12.3%) | 23 (17.0%) |
| $75,000 to $99,999 | 62 (11.9%) | 20 (14.8%) |
| $100,000 to $149,999 | 8 (1.5%) | 4 (3.0%) |
| $150,000 or more | 27 (5.2%) | 3 (2.2%) |
| Total | 521 (100.0%) | 135 (100.0%) |
Monthly Housing Cost Tiers in Whitmire
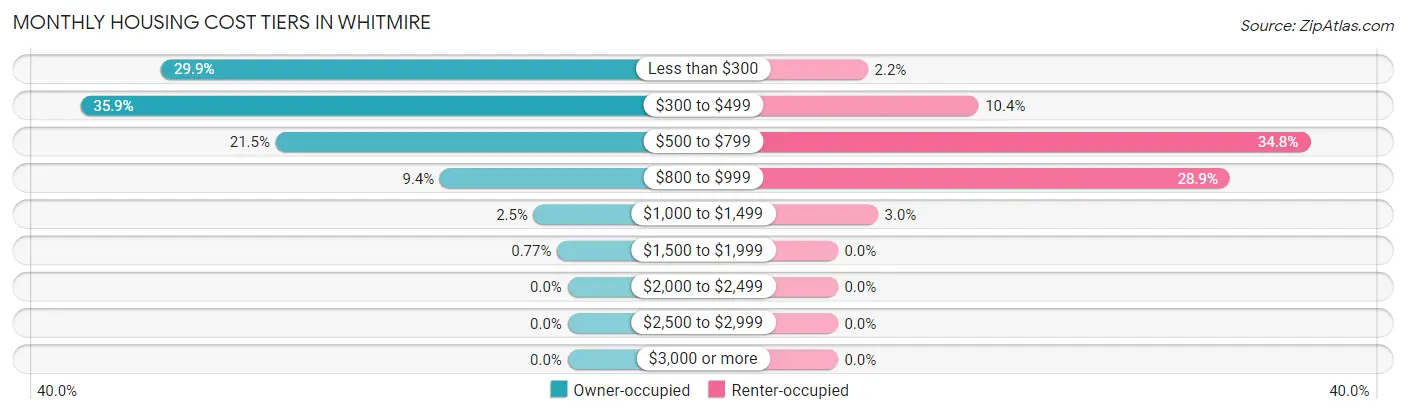
| Monthly Cost | Owner-occupied | Renter-occupied |
| Less than $300 | 156 (29.9%) | 3 (2.2%) |
| $300 to $499 | 187 (35.9%) | 14 (10.4%) |
| $500 to $799 | 112 (21.5%) | 47 (34.8%) |
| $800 to $999 | 49 (9.4%) | 39 (28.9%) |
| $1,000 to $1,499 | 13 (2.5%) | 4 (3.0%) |
| $1,500 to $1,999 | 4 (0.8%) | 0 (0.0%) |
| $2,000 to $2,499 | 0 (0.0%) | 0 (0.0%) |
| $2,500 to $2,999 | 0 (0.0%) | 0 (0.0%) |
| $3,000 or more | 0 (0.0%) | 0 (0.0%) |
| Total | 521 (100.0%) | 135 (100.0%) |
Physical Housing Characteristics in Whitmire
Housing Structures in Whitmire
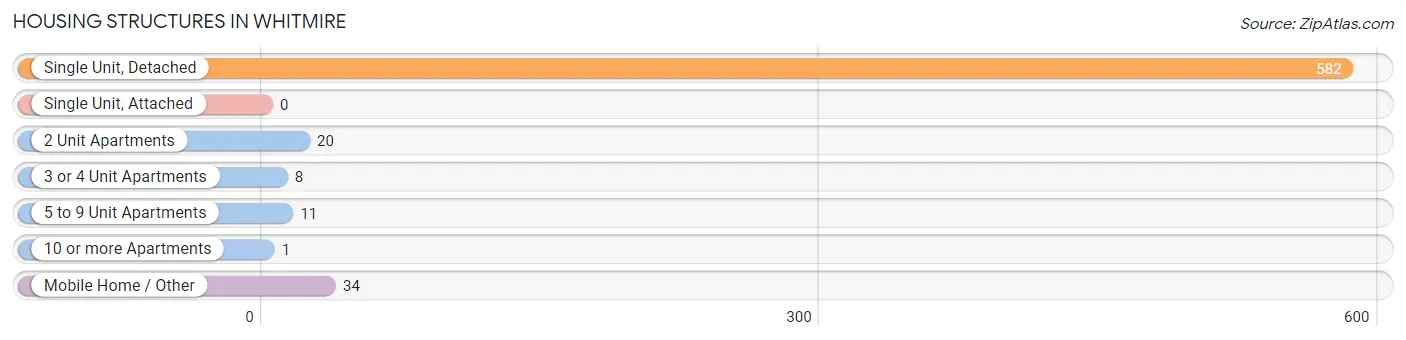
| Structure Type | # Housing Units | % Housing Units |
| Single Unit, Detached | 582 | 88.7% |
| Single Unit, Attached | 0 | 0.0% |
| 2 Unit Apartments | 20 | 3.0% |
| 3 or 4 Unit Apartments | 8 | 1.2% |
| 5 to 9 Unit Apartments | 11 | 1.7% |
| 10 or more Apartments | 1 | 0.2% |
| Mobile Home / Other | 34 | 5.2% |
| Total | 656 | 100.0% |
Housing Structures by Occupancy in Whitmire
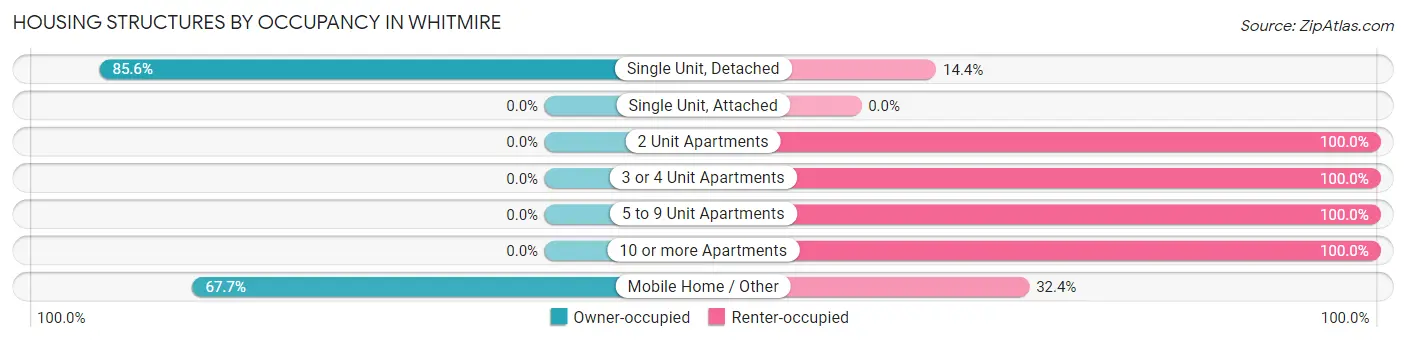
| Structure Type | Owner-occupied | Renter-occupied |
| Single Unit, Detached | 498 (85.6%) | 84 (14.4%) |
| Single Unit, Attached | 0 (0.0%) | 0 (0.0%) |
| 2 Unit Apartments | 0 (0.0%) | 20 (100.0%) |
| 3 or 4 Unit Apartments | 0 (0.0%) | 8 (100.0%) |
| 5 to 9 Unit Apartments | 0 (0.0%) | 11 (100.0%) |
| 10 or more Apartments | 0 (0.0%) | 1 (100.0%) |
| Mobile Home / Other | 23 (67.6%) | 11 (32.4%) |
| Total | 521 (79.4%) | 135 (20.6%) |
Housing Structures by Number of Rooms in Whitmire
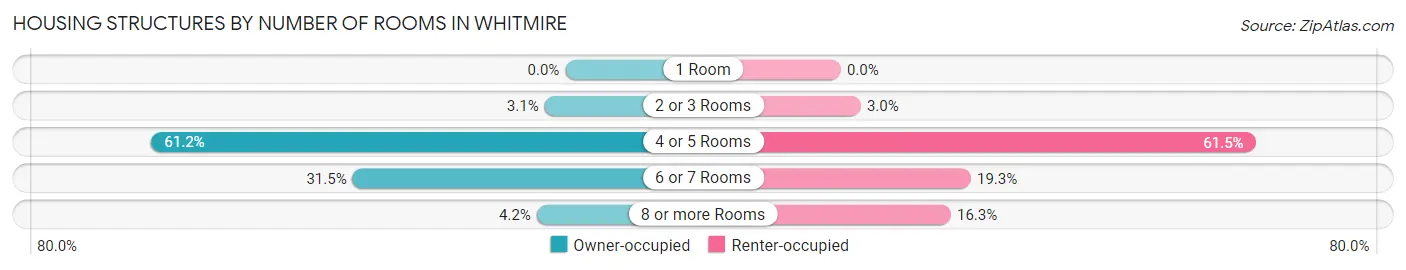
| Number of Rooms | Owner-occupied | Renter-occupied |
| 1 Room | 0 (0.0%) | 0 (0.0%) |
| 2 or 3 Rooms | 16 (3.1%) | 4 (3.0%) |
| 4 or 5 Rooms | 319 (61.2%) | 83 (61.5%) |
| 6 or 7 Rooms | 164 (31.5%) | 26 (19.3%) |
| 8 or more Rooms | 22 (4.2%) | 22 (16.3%) |
| Total | 521 (100.0%) | 135 (100.0%) |
Housing Structure by Heating Type in Whitmire
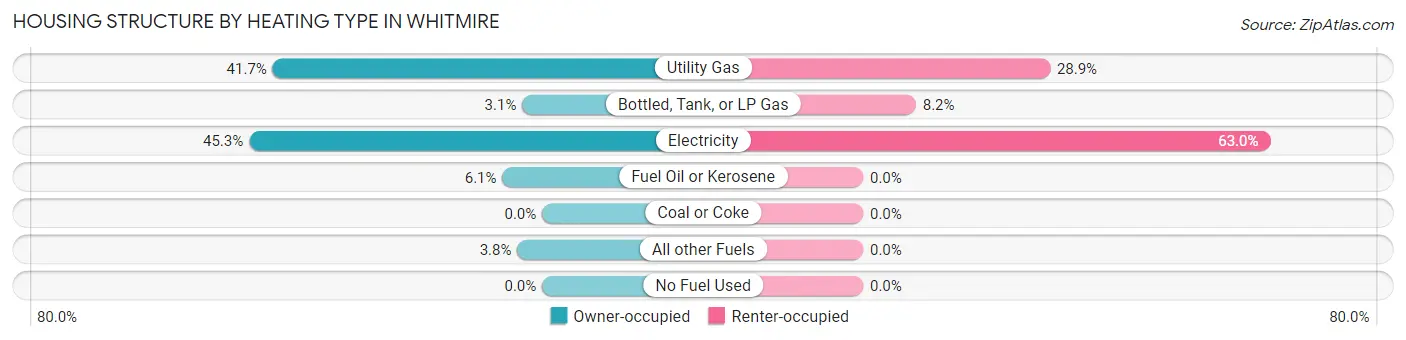
| Heating Type | Owner-occupied | Renter-occupied |
| Utility Gas | 217 (41.6%) | 39 (28.9%) |
| Bottled, Tank, or LP Gas | 16 (3.1%) | 11 (8.2%) |
| Electricity | 236 (45.3%) | 85 (63.0%) |
| Fuel Oil or Kerosene | 32 (6.1%) | 0 (0.0%) |
| Coal or Coke | 0 (0.0%) | 0 (0.0%) |
| All other Fuels | 20 (3.8%) | 0 (0.0%) |
| No Fuel Used | 0 (0.0%) | 0 (0.0%) |
| Total | 521 (100.0%) | 135 (100.0%) |
Household Vehicle Usage in Whitmire
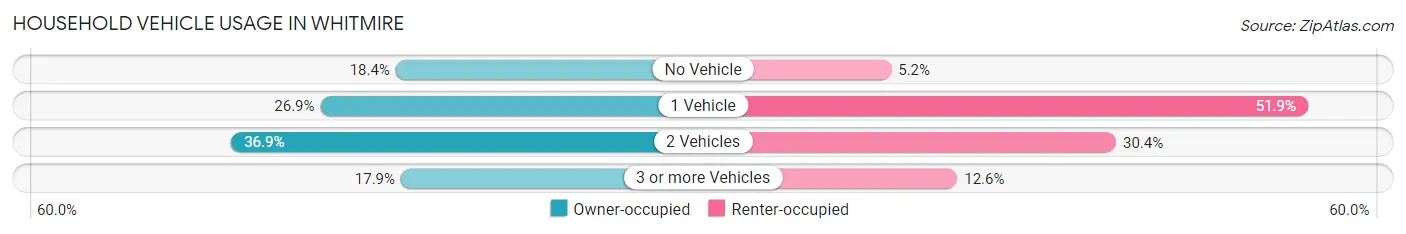
| Vehicles per Household | Owner-occupied | Renter-occupied |
| No Vehicle | 96 (18.4%) | 7 (5.2%) |
| 1 Vehicle | 140 (26.9%) | 70 (51.8%) |
| 2 Vehicles | 192 (36.8%) | 41 (30.4%) |
| 3 or more Vehicles | 93 (17.8%) | 17 (12.6%) |
| Total | 521 (100.0%) | 135 (100.0%) |
Real Estate & Mortgages in Whitmire
Real Estate and Mortgage Overview in Whitmire
| Characteristic | Without Mortgage | With Mortgage |
| Housing Units | 382 | 139 |
| Median Property Value | $39,800 | $103,200 |
| Median Household Income | $24,900 | $15 |
| Monthly Housing Costs | $315 | $0 |
| Real Estate Taxes | $481 | $9 |
Property Value by Mortgage Status in Whitmire
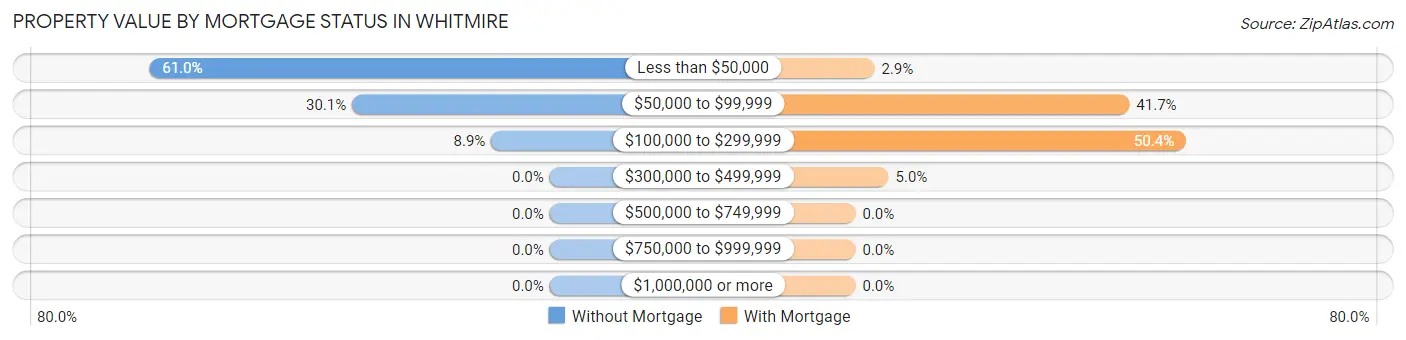
| Property Value | Without Mortgage | With Mortgage |
| Less than $50,000 | 233 (61.0%) | 4 (2.9%) |
| $50,000 to $99,999 | 115 (30.1%) | 58 (41.7%) |
| $100,000 to $299,999 | 34 (8.9%) | 70 (50.4%) |
| $300,000 to $499,999 | 0 (0.0%) | 7 (5.0%) |
| $500,000 to $749,999 | 0 (0.0%) | 0 (0.0%) |
| $750,000 to $999,999 | 0 (0.0%) | 0 (0.0%) |
| $1,000,000 or more | 0 (0.0%) | 0 (0.0%) |
| Total | 382 (100.0%) | 139 (100.0%) |
Household Income by Mortgage Status in Whitmire
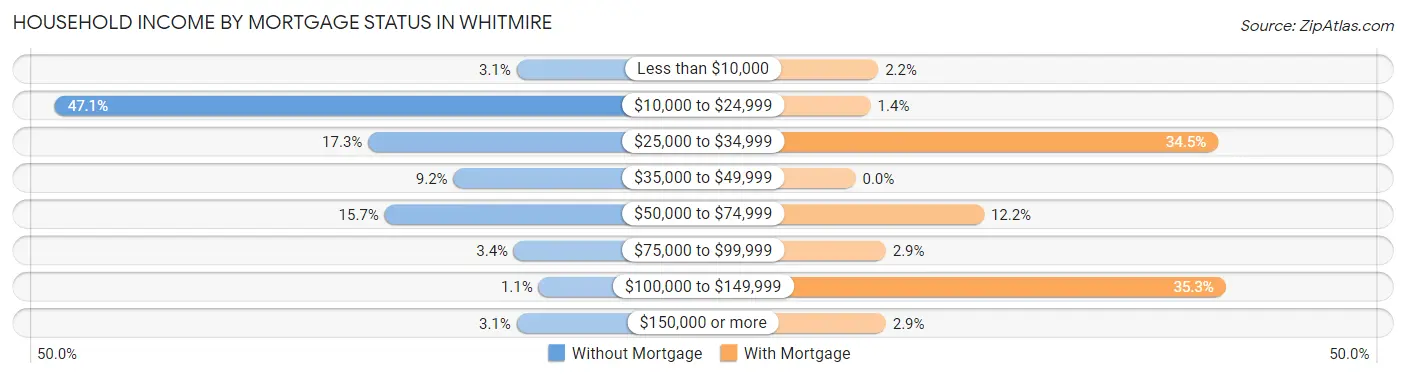
| Household Income | Without Mortgage | With Mortgage |
| Less than $10,000 | 12 (3.1%) | 3 (2.2%) |
| $10,000 to $24,999 | 180 (47.1%) | 2 (1.4%) |
| $25,000 to $34,999 | 66 (17.3%) | 48 (34.5%) |
| $35,000 to $49,999 | 35 (9.2%) | 0 (0.0%) |
| $50,000 to $74,999 | 60 (15.7%) | 17 (12.2%) |
| $75,000 to $99,999 | 13 (3.4%) | 4 (2.9%) |
| $100,000 to $149,999 | 4 (1.1%) | 49 (35.2%) |
| $150,000 or more | 12 (3.1%) | 4 (2.9%) |
| Total | 382 (100.0%) | 139 (100.0%) |
Property Value to Household Income Ratio in Whitmire
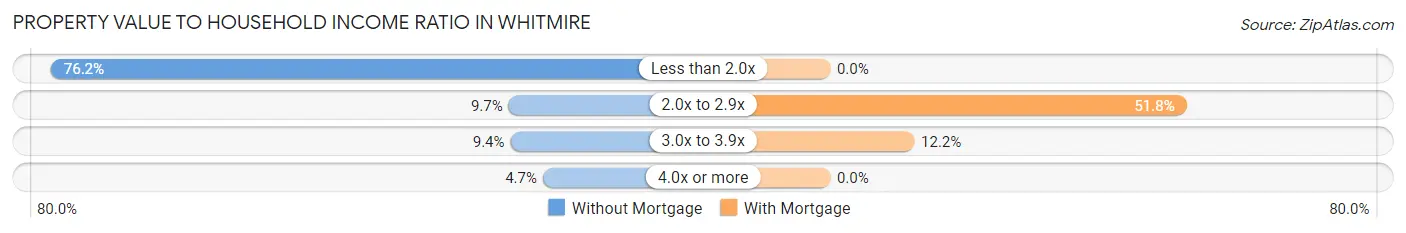
| Value-to-Income Ratio | Without Mortgage | With Mortgage |
| Less than 2.0x | 291 (76.2%) | 0 (0.0%) |
| 2.0x to 2.9x | 37 (9.7%) | 72 (51.8%) |
| 3.0x to 3.9x | 36 (9.4%) | 17 (12.2%) |
| 4.0x or more | 18 (4.7%) | 0 (0.0%) |
| Total | 382 (100.0%) | 139 (100.0%) |
Real Estate Taxes by Mortgage Status in Whitmire
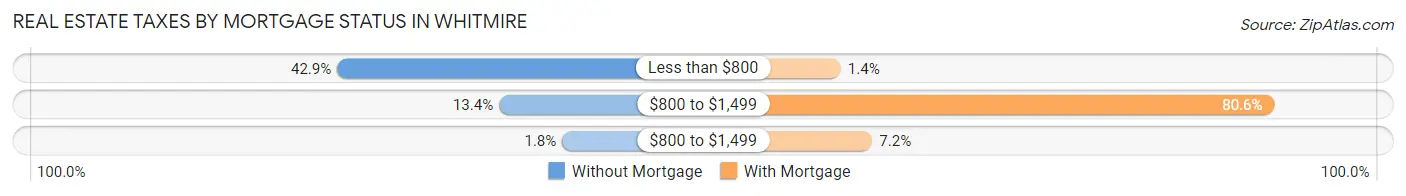
| Property Taxes | Without Mortgage | With Mortgage |
| Less than $800 | 164 (42.9%) | 2 (1.4%) |
| $800 to $1,499 | 51 (13.4%) | 112 (80.6%) |
| $800 to $1,499 | 7 (1.8%) | 10 (7.2%) |
| Total | 382 (100.0%) | 139 (100.0%) |
Health & Disability in Whitmire
Health Insurance Coverage by Age in Whitmire
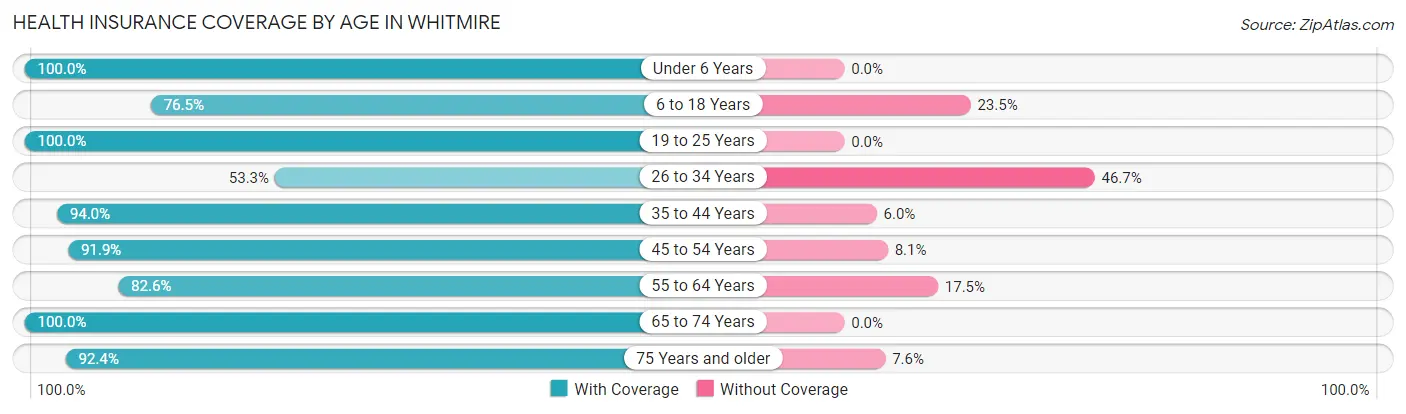
| Age Bracket | With Coverage | Without Coverage |
| Under 6 Years | 72 (100.0%) | 0 (0.0%) |
| 6 to 18 Years | 104 (76.5%) | 32 (23.5%) |
| 19 to 25 Years | 79 (100.0%) | 0 (0.0%) |
| 26 to 34 Years | 40 (53.3%) | 35 (46.7%) |
| 35 to 44 Years | 125 (94.0%) | 8 (6.0%) |
| 45 to 54 Years | 125 (91.9%) | 11 (8.1%) |
| 55 to 64 Years | 298 (82.6%) | 63 (17.4%) |
| 65 to 74 Years | 145 (100.0%) | 0 (0.0%) |
| 75 Years and older | 109 (92.4%) | 9 (7.6%) |
| Total | 1,097 (87.4%) | 158 (12.6%) |
Health Insurance Coverage by Citizenship Status in Whitmire
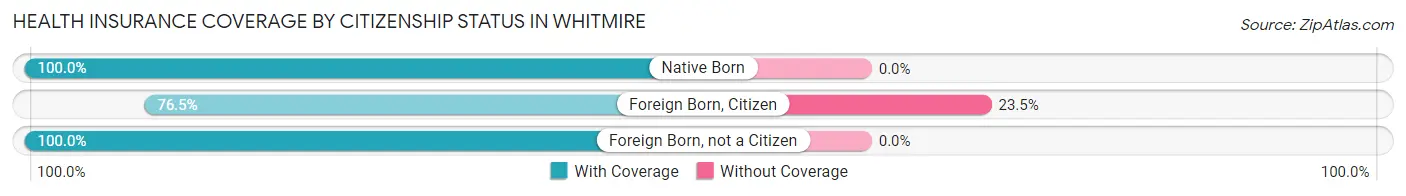
| Citizenship Status | With Coverage | Without Coverage |
| Native Born | 72 (100.0%) | 0 (0.0%) |
| Foreign Born, Citizen | 104 (76.5%) | 32 (23.5%) |
| Foreign Born, not a Citizen | 79 (100.0%) | 0 (0.0%) |
Health Insurance Coverage by Household Income in Whitmire
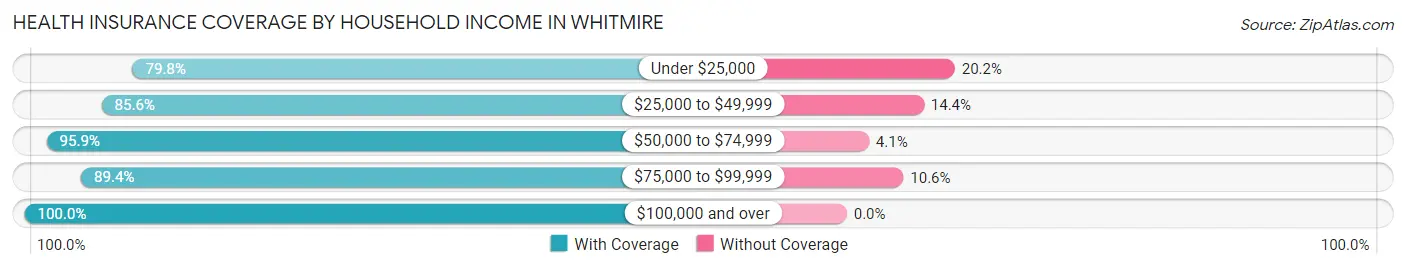
| Household Income | With Coverage | Without Coverage |
| Under $25,000 | 351 (79.8%) | 89 (20.2%) |
| $25,000 to $49,999 | 231 (85.6%) | 39 (14.4%) |
| $50,000 to $74,999 | 162 (95.9%) | 7 (4.1%) |
| $75,000 to $99,999 | 194 (89.4%) | 23 (10.6%) |
| $100,000 and over | 159 (100.0%) | 0 (0.0%) |
Public vs Private Health Insurance Coverage by Age in Whitmire
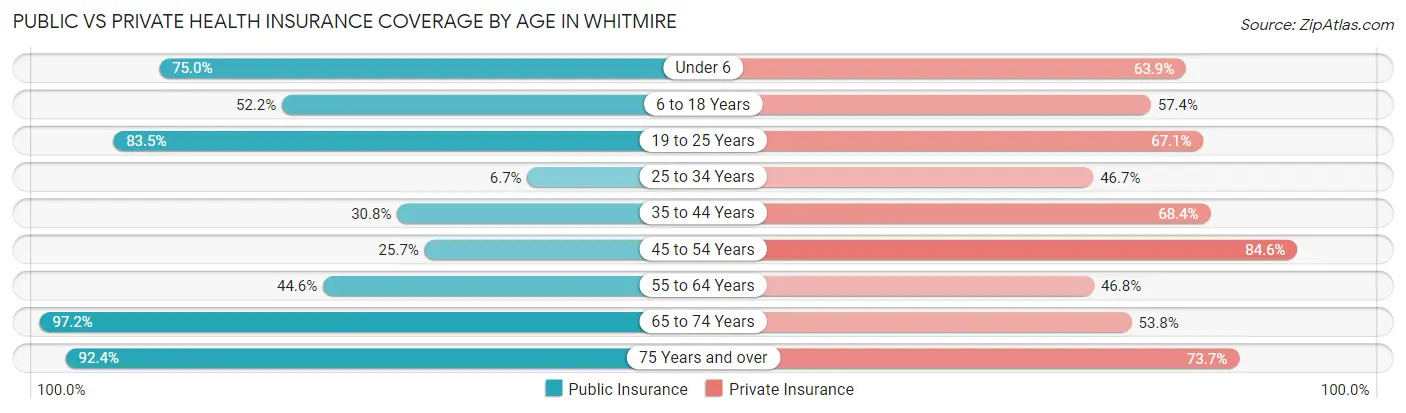
| Age Bracket | Public Insurance | Private Insurance |
| Under 6 | 54 (75.0%) | 46 (63.9%) |
| 6 to 18 Years | 71 (52.2%) | 78 (57.4%) |
| 19 to 25 Years | 66 (83.5%) | 53 (67.1%) |
| 25 to 34 Years | 5 (6.7%) | 35 (46.7%) |
| 35 to 44 Years | 41 (30.8%) | 91 (68.4%) |
| 45 to 54 Years | 35 (25.7%) | 115 (84.6%) |
| 55 to 64 Years | 161 (44.6%) | 169 (46.8%) |
| 65 to 74 Years | 141 (97.2%) | 78 (53.8%) |
| 75 Years and over | 109 (92.4%) | 87 (73.7%) |
| Total | 683 (54.4%) | 752 (59.9%) |
Disability Status by Sex by Age in Whitmire
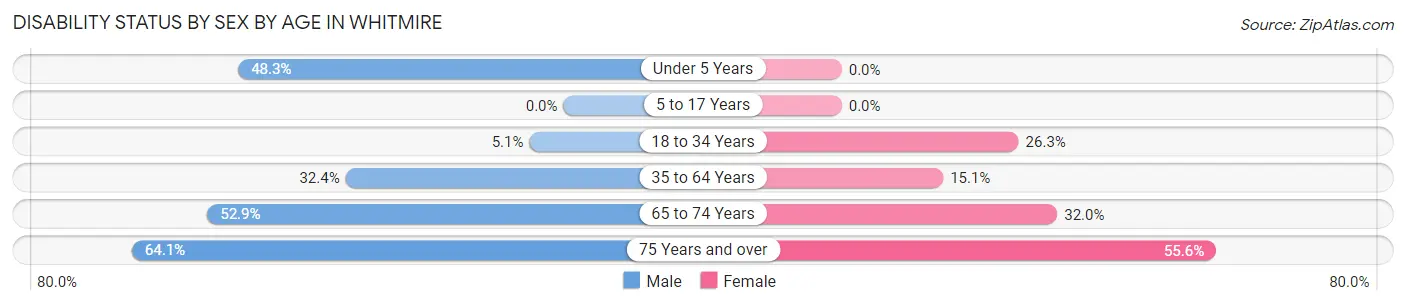
| Age Bracket | Male | Female |
| Under 5 Years | 28 (48.3%) | 0 (0.0%) |
| 5 to 17 Years | 0 (0.0%) | 0 (0.0%) |
| 18 to 34 Years | 5 (5.1%) | 26 (26.3%) |
| 35 to 64 Years | 120 (32.4%) | 39 (15.1%) |
| 65 to 74 Years | 37 (52.9%) | 24 (32.0%) |
| 75 Years and over | 41 (64.1%) | 30 (55.6%) |
Disability Class by Sex by Age in Whitmire
Disability Class: Hearing Difficulty
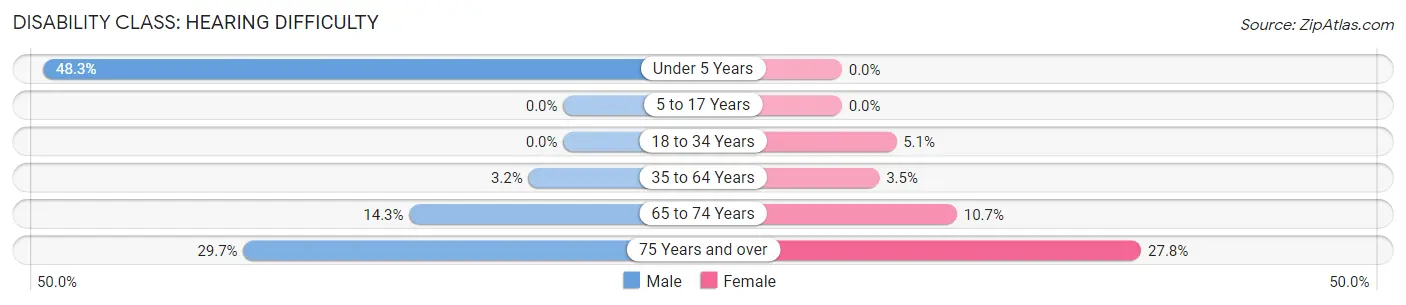
| Age Bracket | Male | Female |
| Under 5 Years | 28 (48.3%) | 0 (0.0%) |
| 5 to 17 Years | 0 (0.0%) | 0 (0.0%) |
| 18 to 34 Years | 0 (0.0%) | 5 (5.1%) |
| 35 to 64 Years | 12 (3.2%) | 9 (3.5%) |
| 65 to 74 Years | 10 (14.3%) | 8 (10.7%) |
| 75 Years and over | 19 (29.7%) | 15 (27.8%) |
Disability Class: Vision Difficulty
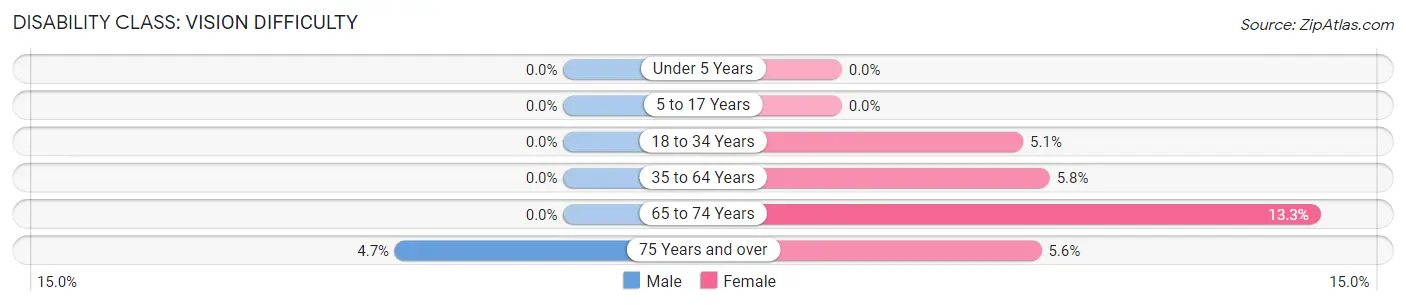
| Age Bracket | Male | Female |
| Under 5 Years | 0 (0.0%) | 0 (0.0%) |
| 5 to 17 Years | 0 (0.0%) | 0 (0.0%) |
| 18 to 34 Years | 0 (0.0%) | 5 (5.1%) |
| 35 to 64 Years | 0 (0.0%) | 15 (5.8%) |
| 65 to 74 Years | 0 (0.0%) | 10 (13.3%) |
| 75 Years and over | 3 (4.7%) | 3 (5.6%) |
Disability Class: Cognitive Difficulty
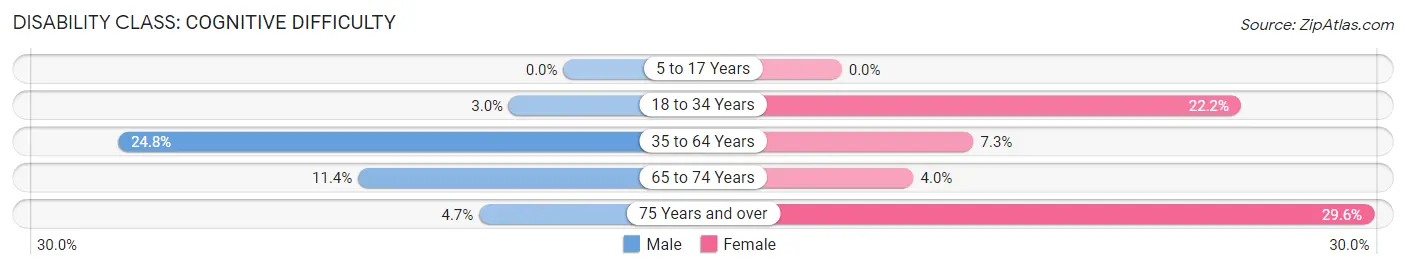
| Age Bracket | Male | Female |
| 5 to 17 Years | 0 (0.0%) | 0 (0.0%) |
| 18 to 34 Years | 3 (3.0%) | 22 (22.2%) |
| 35 to 64 Years | 92 (24.8%) | 19 (7.3%) |
| 65 to 74 Years | 8 (11.4%) | 3 (4.0%) |
| 75 Years and over | 3 (4.7%) | 16 (29.6%) |
Disability Class: Ambulatory Difficulty
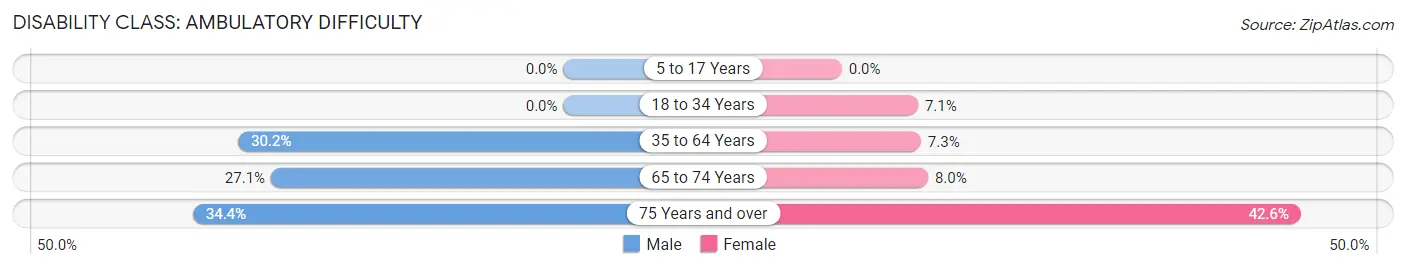
| Age Bracket | Male | Female |
| 5 to 17 Years | 0 (0.0%) | 0 (0.0%) |
| 18 to 34 Years | 0 (0.0%) | 7 (7.1%) |
| 35 to 64 Years | 112 (30.2%) | 19 (7.3%) |
| 65 to 74 Years | 19 (27.1%) | 6 (8.0%) |
| 75 Years and over | 22 (34.4%) | 23 (42.6%) |
Disability Class: Self-Care Difficulty
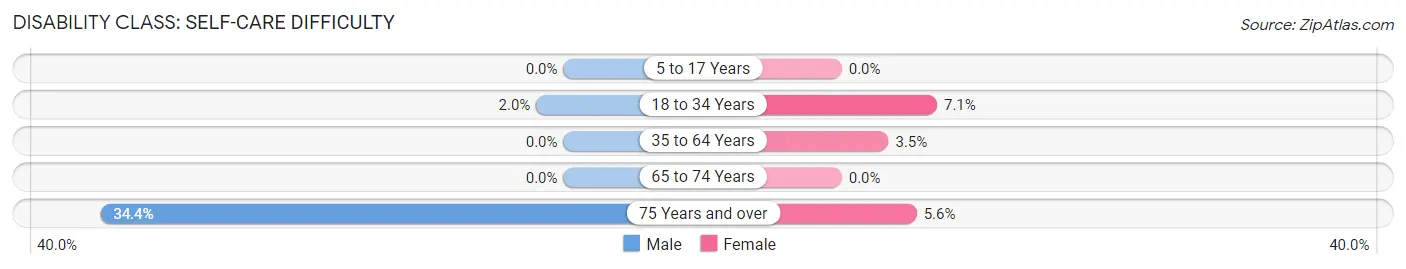
| Age Bracket | Male | Female |
| 5 to 17 Years | 0 (0.0%) | 0 (0.0%) |
| 18 to 34 Years | 2 (2.0%) | 7 (7.1%) |
| 35 to 64 Years | 0 (0.0%) | 9 (3.5%) |
| 65 to 74 Years | 0 (0.0%) | 0 (0.0%) |
| 75 Years and over | 22 (34.4%) | 3 (5.6%) |
Technology Access in Whitmire
Computing Device Access in Whitmire
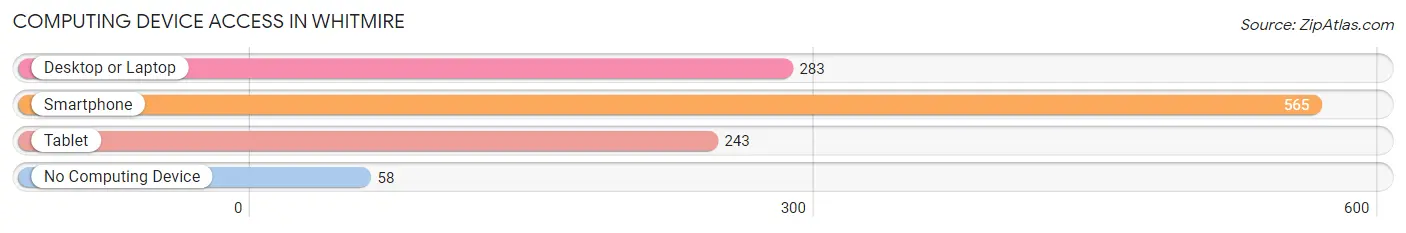
| Device Type | # Households | % Households |
| Desktop or Laptop | 283 | 43.1% |
| Smartphone | 565 | 86.1% |
| Tablet | 243 | 37.0% |
| No Computing Device | 58 | 8.8% |
| Total | 656 | 100.0% |
Internet Access in Whitmire
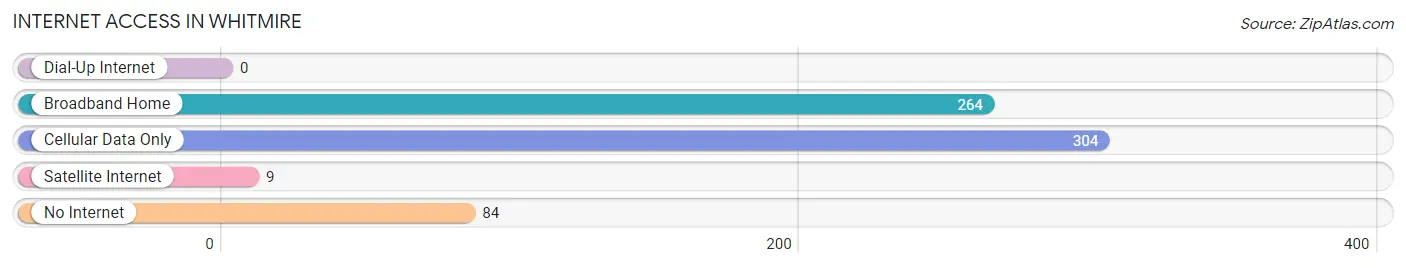
| Internet Type | # Households | % Households |
| Dial-Up Internet | 0 | 0.0% |
| Broadband Home | 264 | 40.2% |
| Cellular Data Only | 304 | 46.3% |
| Satellite Internet | 9 | 1.4% |
| No Internet | 84 | 12.8% |
| Total | 656 | 100.0% |
Whitmire Summary
History
Whitmire is a small town located in Newberry County, South Carolina. It was founded in 1883 by William Whitmire, a local farmer. The town was originally known as Whitmire’s Crossroads, but the name was changed to Whitmire in 1887. The town was incorporated in 1895.
Whitmire has a rich history of industry and agriculture. In the late 19th century, the town was home to several cotton mills, a sawmill, and a gristmill. The town also had a thriving agricultural industry, with many local farmers growing cotton, corn, and other crops.
In the early 20th century, Whitmire experienced a period of growth and prosperity. The town was home to several businesses, including a bank, a hotel, a movie theater, and a variety of stores. The town also had a thriving educational system, with several schools and a college.
In the mid-20th century, Whitmire experienced a period of decline. Many of the businesses and industries that had been the backbone of the town’s economy closed or moved away. The town’s population also began to decline, as many people moved away in search of better opportunities.
In recent years, Whitmire has experienced a period of revitalization. The town has seen an influx of new businesses and industries, and the population has begun to grow again. The town is now home to several restaurants, shops, and other businesses.
Geography
Whitmire is located in the foothills of the Blue Ridge Mountains in Newberry County, South Carolina. The town is situated at the intersection of US Highway 176 and SC Highway 34. The town is located approximately 25 miles northwest of Columbia, the state capital.
The town is situated on a plateau, with an elevation of approximately 1,000 feet. The terrain is mostly flat, with some rolling hills. The town is surrounded by forests and farmland. The nearby Broad River provides a source of recreation for the town’s residents.
Economy
The economy of Whitmire is largely based on agriculture and manufacturing. The town is home to several farms, which produce a variety of crops, including cotton, corn, soybeans, and wheat. The town is also home to several manufacturing companies, which produce a variety of products, including textiles, furniture, and automotive parts.
The town is also home to several businesses, including restaurants, shops, and other services. The town is also home to a variety of educational institutions, including a community college and a technical college.
Demographics
As of the 2010 census, the population of Whitmire was 1,845. The town has a population density of approximately 1,000 people per square mile. The median age of the town’s residents is 39.7 years.
The racial makeup of the town is approximately 79.3% White, 17.2% African American, 0.7% Native American, 0.3% Asian, 0.1% Pacific Islander, and 2.4% from other races. The town’s population is approximately 57.2% female and 42.8% male.
The median household income in Whitmire is approximately $30,000. The town’s poverty rate is approximately 17.3%. The town’s unemployment rate is approximately 6.2%. The town’s median home value is approximately $90,000.
Common Questions
What is Per Capita Income in Whitmire?
Per Capita income in Whitmire is $23,183.
What is the Median Family Income in Whitmire?
Median Family Income in Whitmire is $38,977.
What is the Median Household income in Whitmire?
Median Household Income in Whitmire is $32,813.
What is Income or Wage Gap in Whitmire?
Income or Wage Gap in Whitmire is 23.8%.
Women in Whitmire earn 76.2 cents for every dollar earned by a man.
What is Inequality or Gini Index in Whitmire?
Inequality or Gini Index in Whitmire is 0.43.
What is the Total Population of Whitmire?
Total Population of Whitmire is 1,255.
What is the Total Male Population of Whitmire?
Total Male Population of Whitmire is 709.
What is the Total Female Population of Whitmire?
Total Female Population of Whitmire is 546.
What is the Ratio of Males per 100 Females in Whitmire?
There are 129.85 Males per 100 Females in Whitmire.
What is the Ratio of Females per 100 Males in Whitmire?
There are 77.01 Females per 100 Males in Whitmire.
What is the Median Population Age in Whitmire?
Median Population Age in Whitmire is 54.5 Years.
What is the Average Family Size in Whitmire
Average Family Size in Whitmire is 2.5 People.
What is the Average Household Size in Whitmire
Average Household Size in Whitmire is 1.9 People.
How Large is the Labor Force in Whitmire?
There are 540 People in the Labor Forcein in Whitmire.
What is the Percentage of People in the Labor Force in Whitmire?
49.0% of People are in the Labor Force in Whitmire.
What is the Unemployment Rate in Whitmire?
Unemployment Rate in Whitmire is 5.9%.