Ruby, SC Map & Demographics
Ruby Map
Ruby Overview
$24,577
PER CAPITA INCOME
$36,641
AVG FAMILY INCOME
$37,083
AVG HOUSEHOLD INCOME
1.1%
WAGE / INCOME GAP [ % ]
98.9¢/ $1
WAGE / INCOME GAP [ $ ]
0.37
INEQUALITY / GINI INDEX
359
TOTAL POPULATION
138
MALE POPULATION
221
FEMALE POPULATION
62.44
MALES / 100 FEMALES
160.14
FEMALES / 100 MALES
37.5
MEDIAN AGE
2.8
AVG FAMILY SIZE
2.2
AVG HOUSEHOLD SIZE
135
LABOR FORCE [ PEOPLE ]
50.8%
PERCENT IN LABOR FORCE
0.7%
UNEMPLOYMENT RATE
Ruby Zip Codes
Ruby Area Codes
Income in Ruby
Income Overview in Ruby
Per Capita Income in Ruby is $24,577, while median incomes of families and households are $36,641 and $37,083 respectively.
| Characteristic | Number | Measure |
| Per Capita Income | 359 | $24,577 |
| Median Family Income | 105 | $36,641 |
| Mean Family Income | 105 | $54,150 |
| Median Household Income | 162 | $37,083 |
| Mean Household Income | 162 | $54,720 |
| Income Deficit | 105 | $0 |
| Wage / Income Gap (%) | 359 | 1.15% |
| Wage / Income Gap ($) | 359 | 98.85¢ per $1 |
| Gini / Inequality Index | 359 | 0.37 |
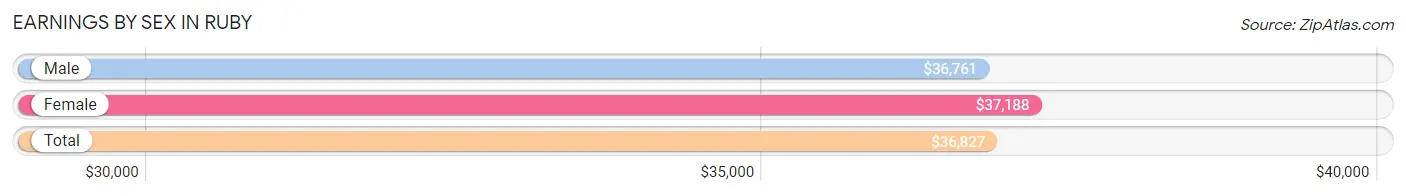
Earnings by Sex in Ruby
Average Earnings in Ruby are $36,827, $36,761 for men and $37,188 for women, a difference of 1.1%.
| Sex | Number | Average Earnings |
| Male | 84 (60.9%) | $36,761 |
| Female | 54 (39.1%) | $37,188 |
| Total | 138 (100.0%) | $36,827 |
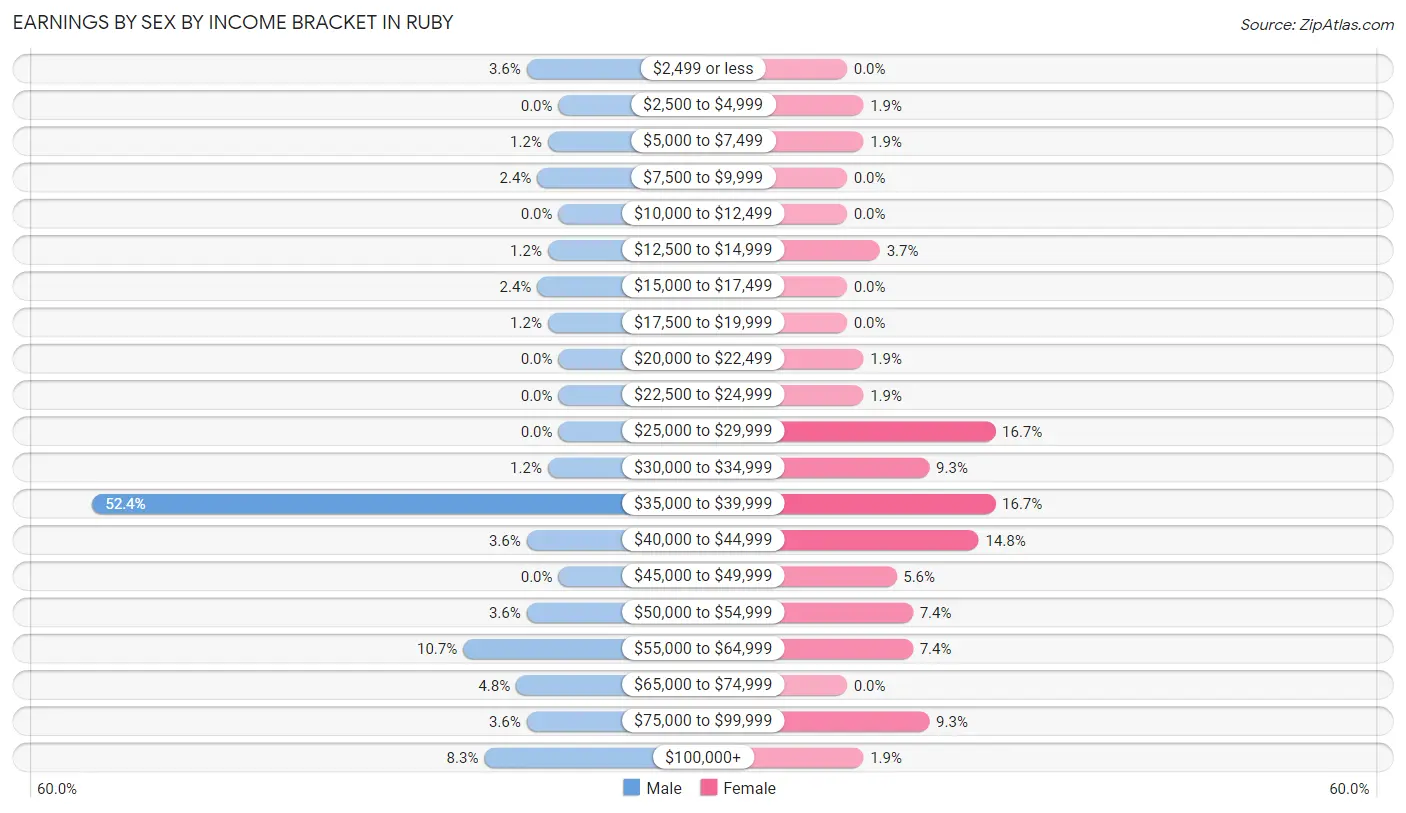
Earnings by Sex by Income Bracket in Ruby
The most common earnings brackets in Ruby are $35,000 to $39,999 for men (44 | 52.4%) and $25,000 to $29,999 for women (9 | 16.7%).
| Income | Male | Female |
| $2,499 or less | 3 (3.6%) | 0 (0.0%) |
| $2,500 to $4,999 | 0 (0.0%) | 1 (1.8%) |
| $5,000 to $7,499 | 1 (1.2%) | 1 (1.8%) |
| $7,500 to $9,999 | 2 (2.4%) | 0 (0.0%) |
| $10,000 to $12,499 | 0 (0.0%) | 0 (0.0%) |
| $12,500 to $14,999 | 1 (1.2%) | 2 (3.7%) |
| $15,000 to $17,499 | 2 (2.4%) | 0 (0.0%) |
| $17,500 to $19,999 | 1 (1.2%) | 0 (0.0%) |
| $20,000 to $22,499 | 0 (0.0%) | 1 (1.8%) |
| $22,500 to $24,999 | 0 (0.0%) | 1 (1.8%) |
| $25,000 to $29,999 | 0 (0.0%) | 9 (16.7%) |
| $30,000 to $34,999 | 1 (1.2%) | 5 (9.3%) |
| $35,000 to $39,999 | 44 (52.4%) | 9 (16.7%) |
| $40,000 to $44,999 | 3 (3.6%) | 8 (14.8%) |
| $45,000 to $49,999 | 0 (0.0%) | 3 (5.6%) |
| $50,000 to $54,999 | 3 (3.6%) | 4 (7.4%) |
| $55,000 to $64,999 | 9 (10.7%) | 4 (7.4%) |
| $65,000 to $74,999 | 4 (4.8%) | 0 (0.0%) |
| $75,000 to $99,999 | 3 (3.6%) | 5 (9.3%) |
| $100,000+ | 7 (8.3%) | 1 (1.8%) |
| Total | 84 (100.0%) | 54 (100.0%) |
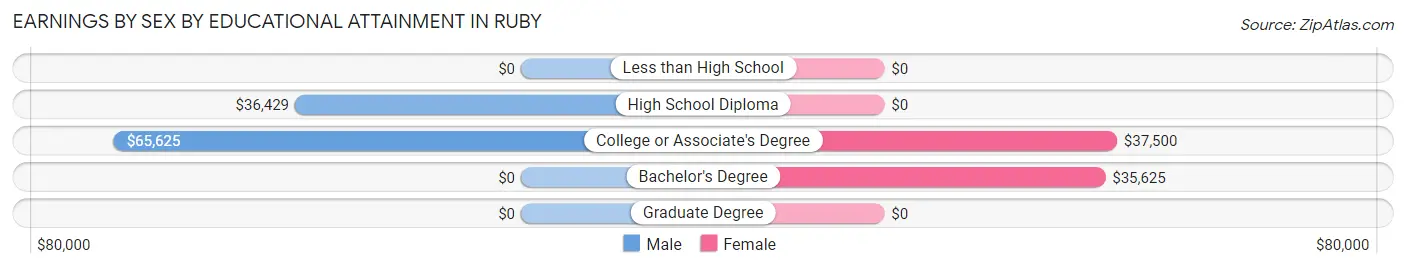
Earnings by Sex by Educational Attainment in Ruby
Average earnings in Ruby are $36,818 for men and $37,188 for women, a difference of 1.0%. Men with an educational attainment of college or associate's degree enjoy the highest average annual earnings of $65,625, while those with high school diploma education earn the least with $36,429. Women with an educational attainment of college or associate's degree earn the most with the average annual earnings of $37,500, while those with bachelor's degree education have the smallest earnings of $35,625.
| Educational Attainment | Male Income | Female Income |
| Less than High School | - | - |
| High School Diploma | $36,429 | $0 |
| College or Associate's Degree | $65,625 | $37,500 |
| Bachelor's Degree | - | - |
| Graduate Degree | - | - |
| Total | $36,818 | $37,188 |
Family Income in Ruby
Family Income Brackets in Ruby
According to the Ruby family income data, there are 51 families falling into the $35,000 to $49,999 income range, which is the most common income bracket and makes up 48.6% of all families. Conversely, the less than $10,000 income bracket is the least frequent group with only 1 families (0.9%) belonging to this category.
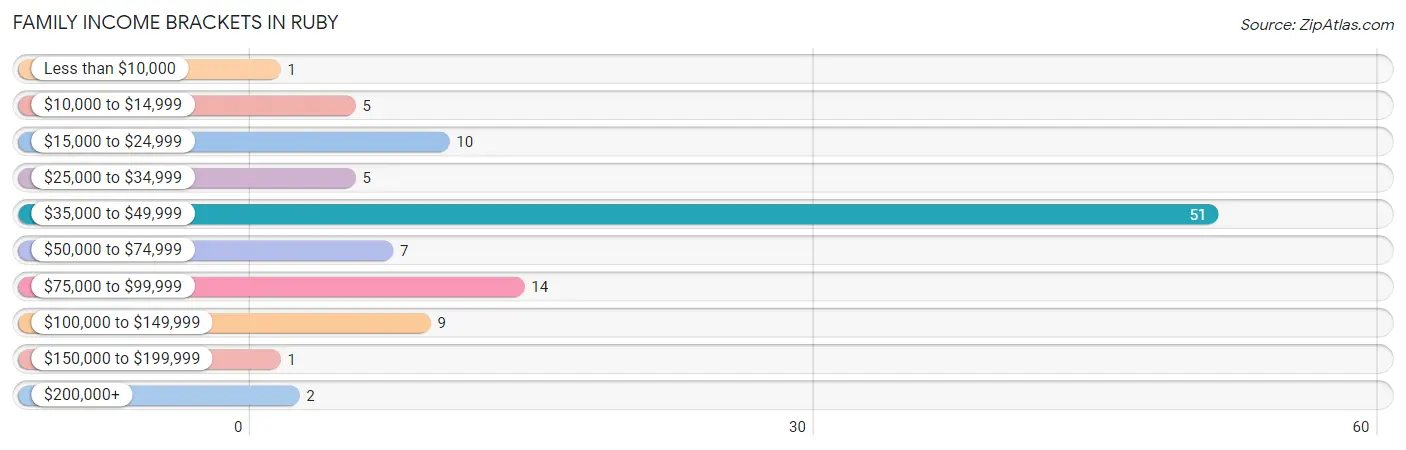
| Income Bracket | # Families | % Families |
| Less than $10,000 | 1 | 1.0% |
| $10,000 to $14,999 | 5 | 4.8% |
| $15,000 to $24,999 | 10 | 9.5% |
| $25,000 to $34,999 | 5 | 4.8% |
| $35,000 to $49,999 | 51 | 48.6% |
| $50,000 to $74,999 | 7 | 6.7% |
| $75,000 to $99,999 | 14 | 13.3% |
| $100,000 to $149,999 | 9 | 8.6% |
| $150,000 to $199,999 | 1 | 1.0% |
| $200,000+ | 2 | 1.9% |
Family Income by Famaliy Size in Ruby
2-person families (44 | 41.9%) account for the highest median family income in Ruby with $46,250 per family, while 2-person families (44 | 41.9%) have the highest median income of $23,125 per family member.
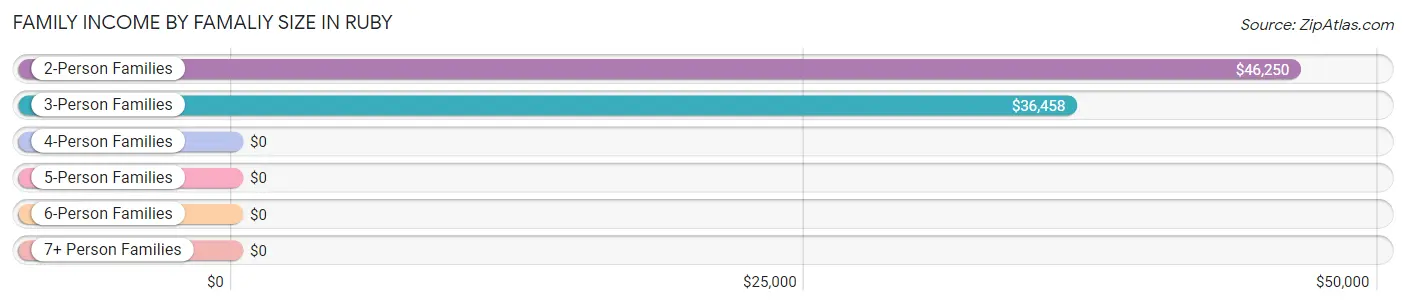
| Income Bracket | # Families | Median Income |
| 2-Person Families | 44 (41.9%) | $46,250 |
| 3-Person Families | 49 (46.7%) | $36,458 |
| 4-Person Families | 11 (10.5%) | $0 |
| 5-Person Families | 0 (0.0%) | $0 |
| 6-Person Families | 1 (0.9%) | $0 |
| 7+ Person Families | 0 (0.0%) | $0 |
| Total | 105 (100.0%) | $36,641 |
Family Income by Number of Earners in Ruby
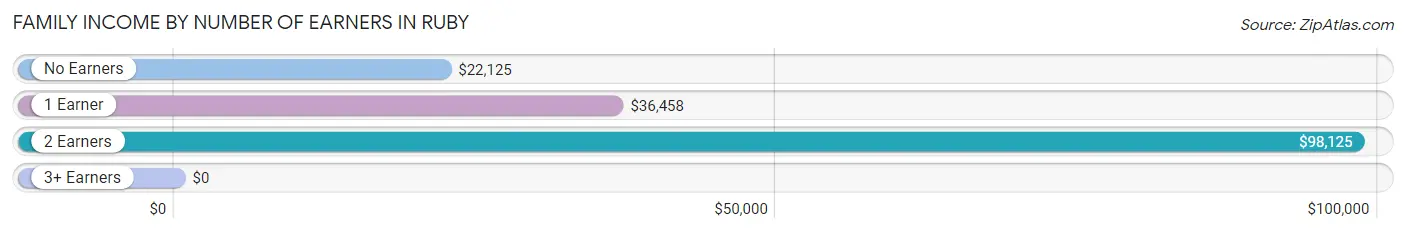
| Number of Earners | # Families | Median Income |
| No Earners | 27 (25.7%) | $22,125 |
| 1 Earner | 58 (55.2%) | $36,458 |
| 2 Earners | 20 (19.1%) | $98,125 |
| 3+ Earners | 0 (0.0%) | $0 |
| Total | 105 (100.0%) | $36,641 |
Household Income in Ruby
Household Income Brackets in Ruby
With 72 households falling in the category, the $35,000 to $49,999 income range is the most frequent in Ruby, accounting for 44.4% of all households. In contrast, only 2 households (1.2%) fall into the $200,000+ income bracket, making it the least populous group.
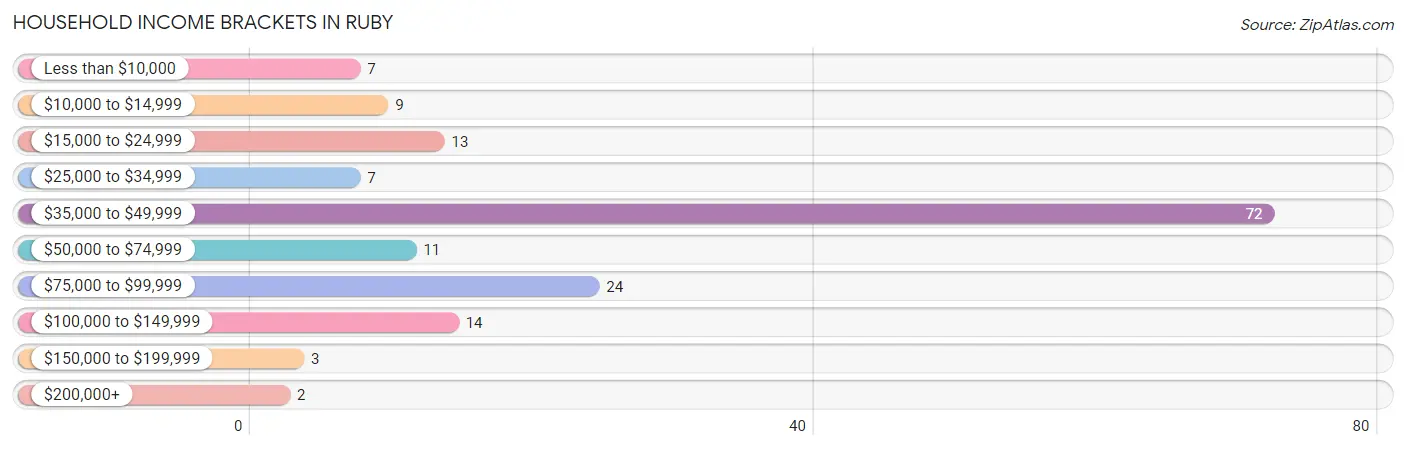
| Income Bracket | # Households | % Households |
| Less than $10,000 | 7 | 4.3% |
| $10,000 to $14,999 | 9 | 5.6% |
| $15,000 to $24,999 | 13 | 8.0% |
| $25,000 to $34,999 | 7 | 4.3% |
| $35,000 to $49,999 | 72 | 44.4% |
| $50,000 to $74,999 | 11 | 6.8% |
| $75,000 to $99,999 | 24 | 14.8% |
| $100,000 to $149,999 | 14 | 8.6% |
| $150,000 to $199,999 | 3 | 1.9% |
| $200,000+ | 2 | 1.2% |
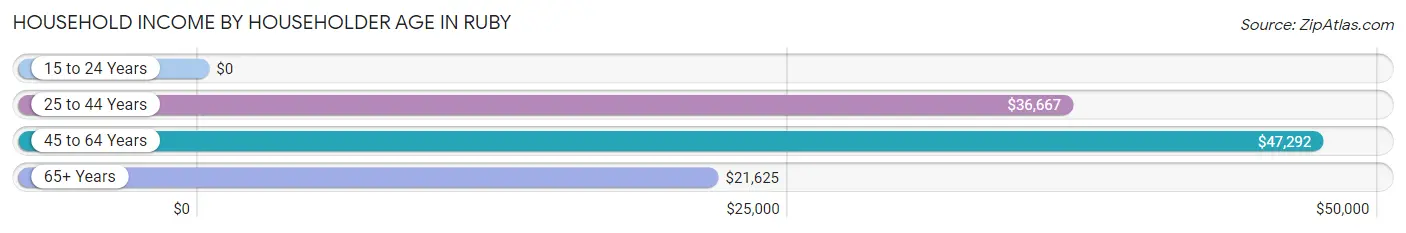
Household Income by Householder Age in Ruby
The median household income in Ruby is $37,083, with the highest median household income of $47,292 found in the 45 to 64 years age bracket for the primary householder. A total of 53 households (32.7%) fall into this category.
| Income Bracket | # Households | Median Income |
| 15 to 24 Years | 0 (0.0%) | $0 |
| 25 to 44 Years | 76 (46.9%) | $36,667 |
| 45 to 64 Years | 53 (32.7%) | $47,292 |
| 65+ Years | 33 (20.4%) | $21,625 |
| Total | 162 (100.0%) | $37,083 |
Poverty in Ruby
Income Below Poverty by Sex and Age in Ruby
With 15.9% poverty level for males and 15.4% for females among the residents of Ruby, 18 to 24 year old males and 12 to 14 year old females are the most vulnerable to poverty, with 3 males (100.0%) and 1 females (100.0%) in their respective age groups living below the poverty level.
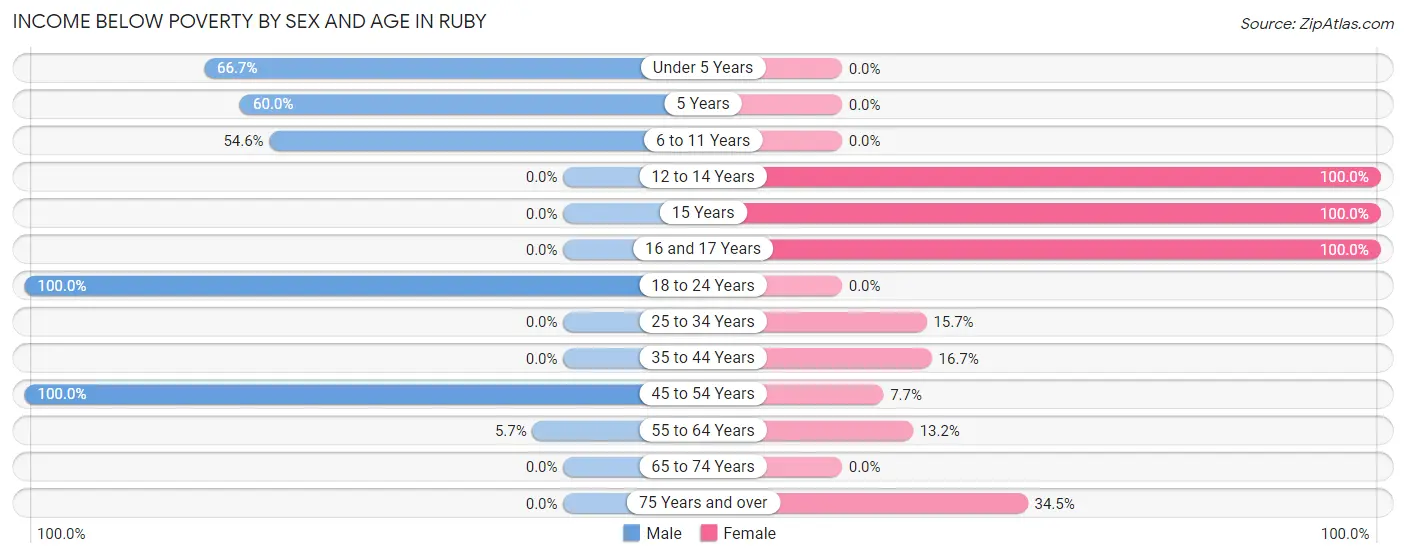
| Age Bracket | Male | Female |
| Under 5 Years | 4 (66.7%) | 0 (0.0%) |
| 5 Years | 6 (60.0%) | 0 (0.0%) |
| 6 to 11 Years | 6 (54.5%) | 0 (0.0%) |
| 12 to 14 Years | 0 (0.0%) | 1 (100.0%) |
| 15 Years | 0 (0.0%) | 4 (100.0%) |
| 16 and 17 Years | 0 (0.0%) | 1 (100.0%) |
| 18 to 24 Years | 3 (100.0%) | 0 (0.0%) |
| 25 to 34 Years | 0 (0.0%) | 11 (15.7%) |
| 35 to 44 Years | 0 (0.0%) | 1 (16.7%) |
| 45 to 54 Years | 1 (100.0%) | 1 (7.7%) |
| 55 to 64 Years | 2 (5.7%) | 5 (13.2%) |
| 65 to 74 Years | 0 (0.0%) | 0 (0.0%) |
| 75 Years and over | 0 (0.0%) | 10 (34.5%) |
| Total | 22 (15.9%) | 34 (15.4%) |
Income Above Poverty by Sex and Age in Ruby
According to the poverty statistics in Ruby, males aged 12 to 14 years and females aged under 5 years are the age groups that are most secure financially, with 100.0% of males and 100.0% of females in these age groups living above the poverty line.
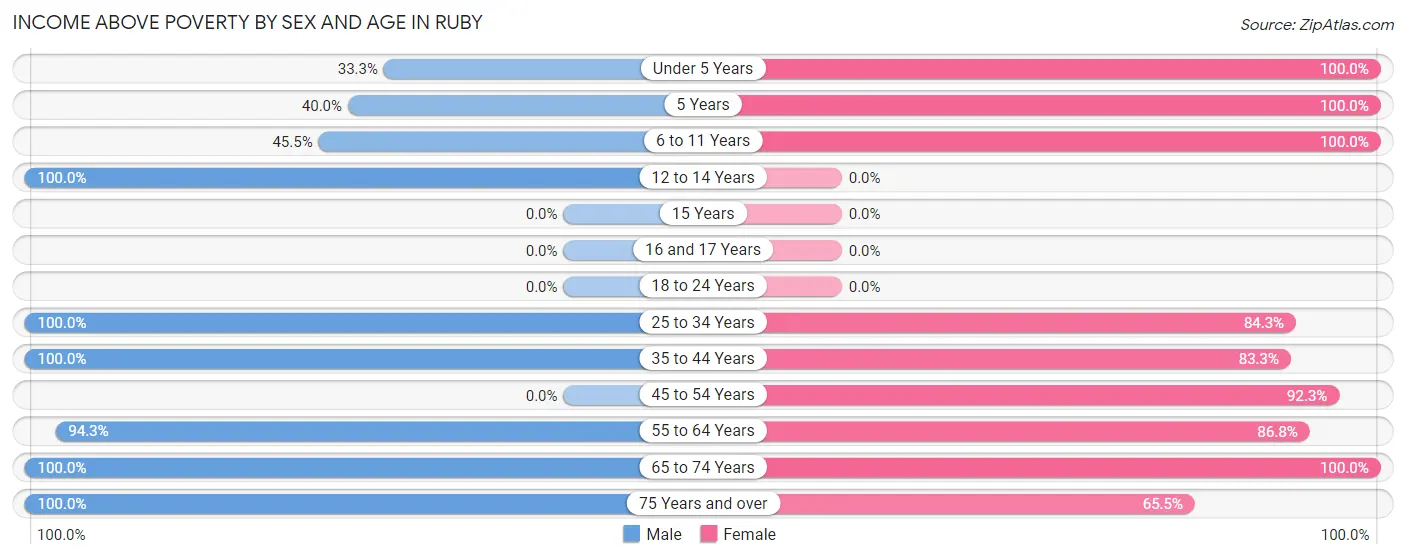
| Age Bracket | Male | Female |
| Under 5 Years | 2 (33.3%) | 2 (100.0%) |
| 5 Years | 4 (40.0%) | 52 (100.0%) |
| 6 to 11 Years | 5 (45.5%) | 2 (100.0%) |
| 12 to 14 Years | 5 (100.0%) | 0 (0.0%) |
| 15 Years | 0 (0.0%) | 0 (0.0%) |
| 16 and 17 Years | 0 (0.0%) | 0 (0.0%) |
| 18 to 24 Years | 0 (0.0%) | 0 (0.0%) |
| 25 to 34 Years | 9 (100.0%) | 59 (84.3%) |
| 35 to 44 Years | 51 (100.0%) | 5 (83.3%) |
| 45 to 54 Years | 0 (0.0%) | 12 (92.3%) |
| 55 to 64 Years | 33 (94.3%) | 33 (86.8%) |
| 65 to 74 Years | 3 (100.0%) | 3 (100.0%) |
| 75 Years and over | 4 (100.0%) | 19 (65.5%) |
| Total | 116 (84.1%) | 187 (84.6%) |
Income Below Poverty Among Married-Couple Families in Ruby
The poverty statistics for married-couple families in Ruby show that 1.2% or 1 of the total 82 families live below the poverty line. Families with no children have the highest poverty rate of 3.7%, comprising of 1 families. On the other hand, families with 1 or 2 children have the lowest poverty rate of 0.0%, which includes 0 families.
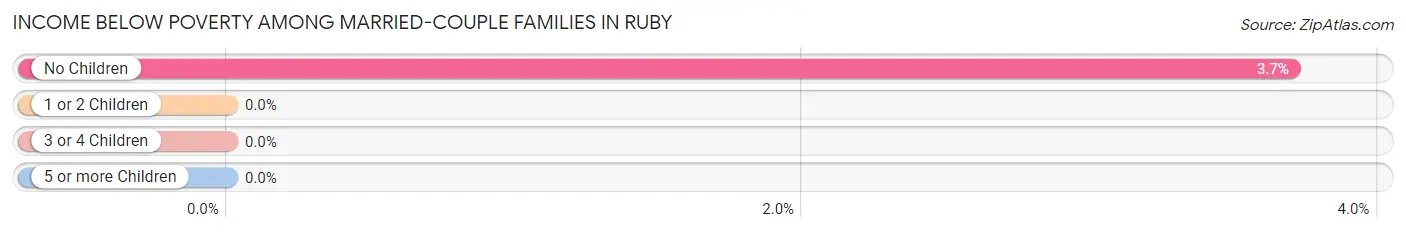
| Children | Above Poverty | Below Poverty |
| No Children | 26 (96.3%) | 1 (3.7%) |
| 1 or 2 Children | 55 (100.0%) | 0 (0.0%) |
| 3 or 4 Children | 0 (0.0%) | 0 (0.0%) |
| 5 or more Children | 0 (0.0%) | 0 (0.0%) |
| Total | 81 (98.8%) | 1 (1.2%) |
Income Below Poverty Among Single-Parent Households in Ruby
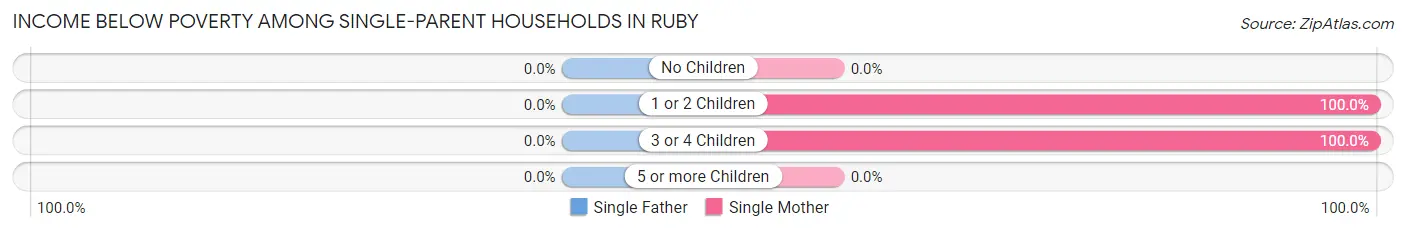
| Children | Single Father | Single Mother |
| No Children | 0 (0.0%) | 0 (0.0%) |
| 1 or 2 Children | 0 (0.0%) | 10 (100.0%) |
| 3 or 4 Children | 0 (0.0%) | 1 (100.0%) |
| 5 or more Children | 0 (0.0%) | 0 (0.0%) |
| Total | 0 (0.0%) | 11 (47.8%) |
Income Below Poverty Among Married-Couple vs Single-Parent Households in Ruby
The poverty data for Ruby shows that 1 of the married-couple family households (1.2%) and 11 of the single-parent households (47.8%) are living below the poverty level. Within the married-couple family households, those with no children have the highest poverty rate, with 1 households (3.7%) falling below the poverty line. Among the single-parent households, those with 1 or 2 children have the highest poverty rate, with 10 household (100.0%) living below poverty.
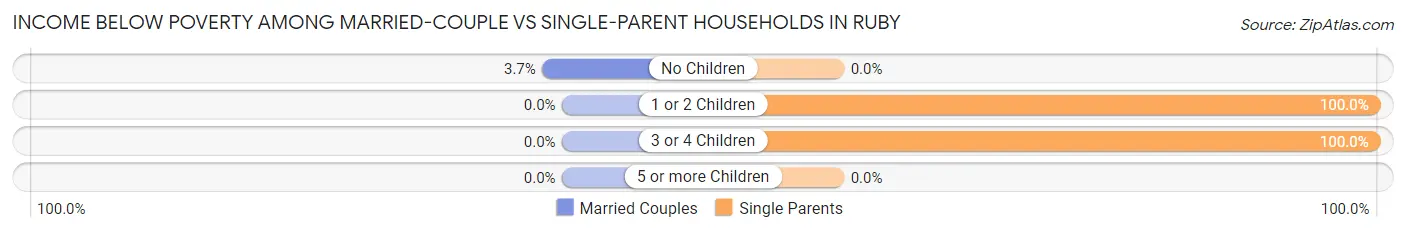
| Children | Married-Couple Families | Single-Parent Households |
| No Children | 1 (3.7%) | 0 (0.0%) |
| 1 or 2 Children | 0 (0.0%) | 10 (100.0%) |
| 3 or 4 Children | 0 (0.0%) | 1 (100.0%) |
| 5 or more Children | 0 (0.0%) | 0 (0.0%) |
| Total | 1 (1.2%) | 11 (47.8%) |
Race in Ruby
The most populous races in Ruby are White / Caucasian (193 | 53.8%), Black / African American (158 | 44.0%), and Hispanic or Latino (31 | 8.6%).
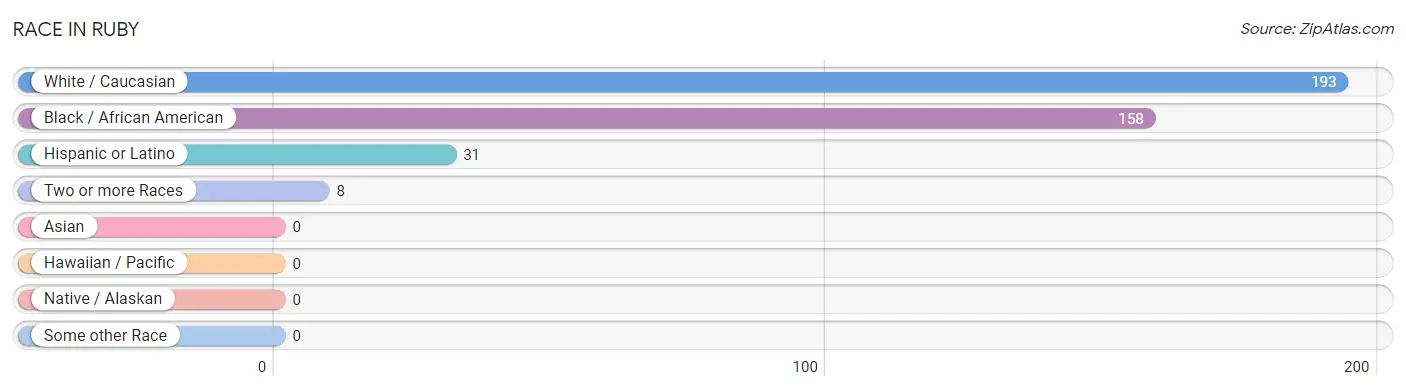
| Race | # Population | % Population |
| Asian | 0 | 0.0% |
| Black / African American | 158 | 44.0% |
| Hawaiian / Pacific | 0 | 0.0% |
| Hispanic or Latino | 31 | 8.6% |
| Native / Alaskan | 0 | 0.0% |
| White / Caucasian | 193 | 53.8% |
| Two or more Races | 8 | 2.2% |
| Some other Race | 0 | 0.0% |
| Total | 359 | 100.0% |
Ancestry in Ruby
The most populous ancestries reported in Ruby are English (42 | 11.7%), Mexican (27 | 7.5%), Irish (19 | 5.3%), German (16 | 4.5%), and Scottish (10 | 2.8%), together accounting for 31.8% of all Ruby residents.
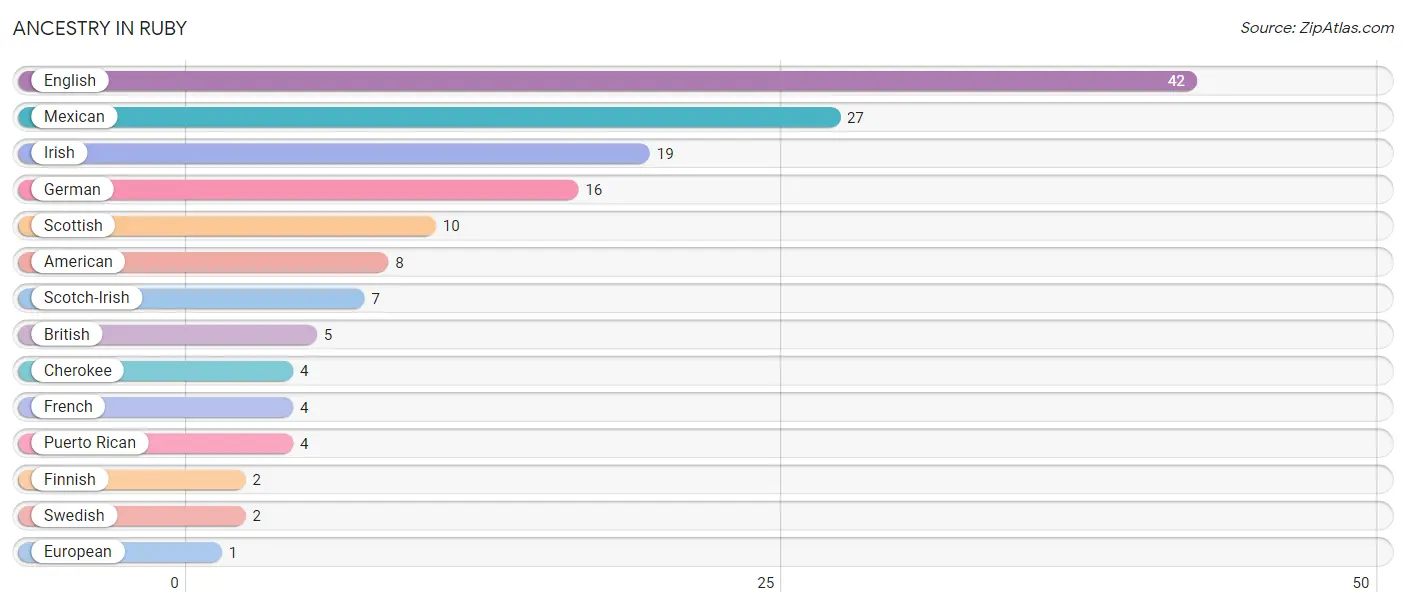
| Ancestry | # Population | % Population |
| American | 8 | 2.2% |
| British | 5 | 1.4% |
| Cherokee | 4 | 1.1% |
| English | 42 | 11.7% |
| European | 1 | 0.3% |
| Finnish | 2 | 0.6% |
| French | 4 | 1.1% |
| German | 16 | 4.5% |
| Irish | 19 | 5.3% |
| Mexican | 27 | 7.5% |
| Puerto Rican | 4 | 1.1% |
| Scotch-Irish | 7 | 1.9% |
| Scottish | 10 | 2.8% |
| Swedish | 2 | 0.6% | View All 14 Rows |
Immigrants in Ruby

| Immigration Origin | # Population | % Population | View All 0 Rows |
Sex and Age in Ruby
Sex and Age in Ruby
The most populous age groups in Ruby are 35 to 39 Years (46 | 33.3%) for men and 5 to 9 Years (54 | 24.4%) for women.
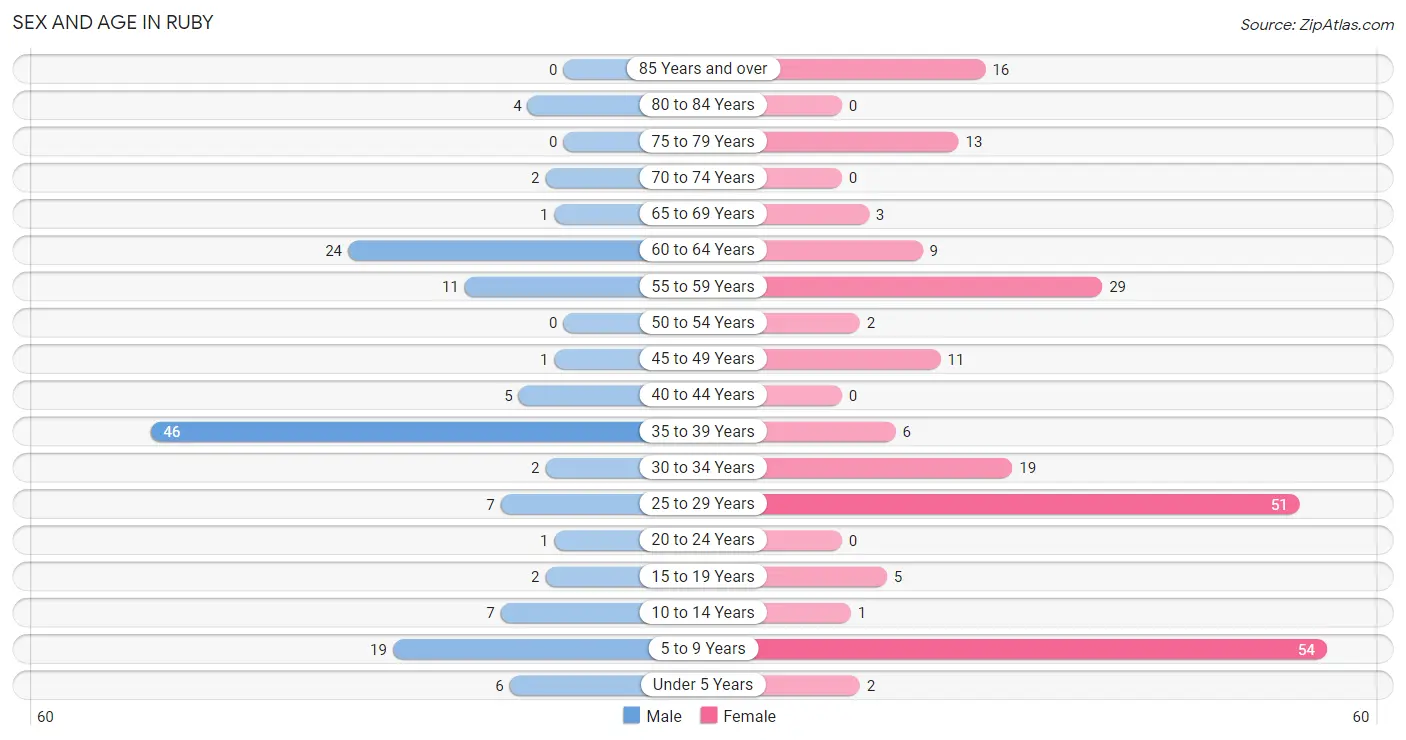
| Age Bracket | Male | Female |
| Under 5 Years | 6 (4.3%) | 2 (0.9%) |
| 5 to 9 Years | 19 (13.8%) | 54 (24.4%) |
| 10 to 14 Years | 7 (5.1%) | 1 (0.4%) |
| 15 to 19 Years | 2 (1.5%) | 5 (2.3%) |
| 20 to 24 Years | 1 (0.7%) | 0 (0.0%) |
| 25 to 29 Years | 7 (5.1%) | 51 (23.1%) |
| 30 to 34 Years | 2 (1.5%) | 19 (8.6%) |
| 35 to 39 Years | 46 (33.3%) | 6 (2.7%) |
| 40 to 44 Years | 5 (3.6%) | 0 (0.0%) |
| 45 to 49 Years | 1 (0.7%) | 11 (5.0%) |
| 50 to 54 Years | 0 (0.0%) | 2 (0.9%) |
| 55 to 59 Years | 11 (8.0%) | 29 (13.1%) |
| 60 to 64 Years | 24 (17.4%) | 9 (4.1%) |
| 65 to 69 Years | 1 (0.7%) | 3 (1.4%) |
| 70 to 74 Years | 2 (1.5%) | 0 (0.0%) |
| 75 to 79 Years | 0 (0.0%) | 13 (5.9%) |
| 80 to 84 Years | 4 (2.9%) | 0 (0.0%) |
| 85 Years and over | 0 (0.0%) | 16 (7.2%) |
| Total | 138 (100.0%) | 221 (100.0%) |
Families and Households in Ruby
Median Family Size in Ruby
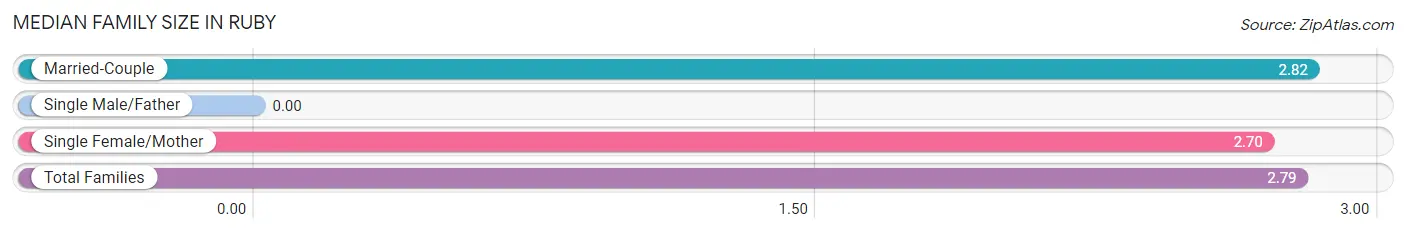
| Family Type | # Families | Family Size |
| Married-Couple | 82 (78.1%) | 2.82 |
| Single Male/Father | 0 (0.0%) | - |
| Single Female/Mother | 23 (21.9%) | 2.70 |
| Total Families | 105 (100.0%) | 2.79 |
Median Household Size in Ruby
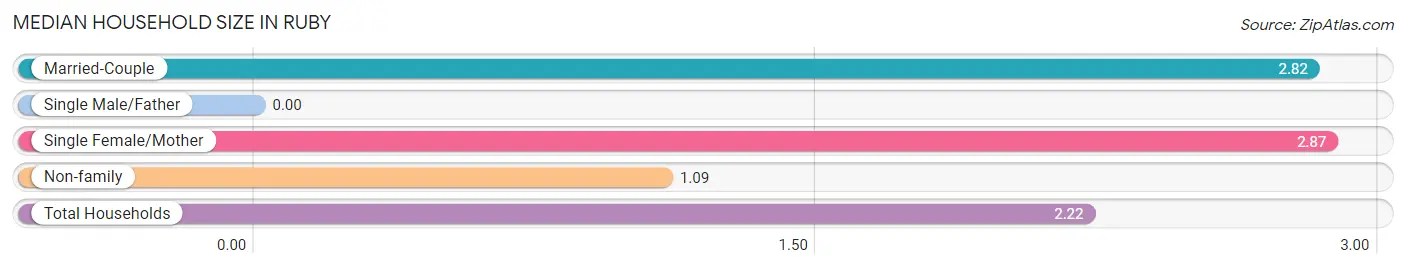
| Household Type | # Households | Household Size |
| Married-Couple | 82 (50.6%) | 2.82 |
| Single Male/Father | 0 (0.0%) | - |
| Single Female/Mother | 23 (14.2%) | 2.87 |
| Non-family | 57 (35.2%) | 1.09 |
| Total Households | 162 (100.0%) | 2.22 |
Household Size by Marriage Status in Ruby
Out of a total of 162 households in Ruby, 105 (64.8%) are family households, while 57 (35.2%) are nonfamily households. The most numerous type of family households are 3-person households, comprising 49, and the most common type of nonfamily households are 1-person households, comprising 49.
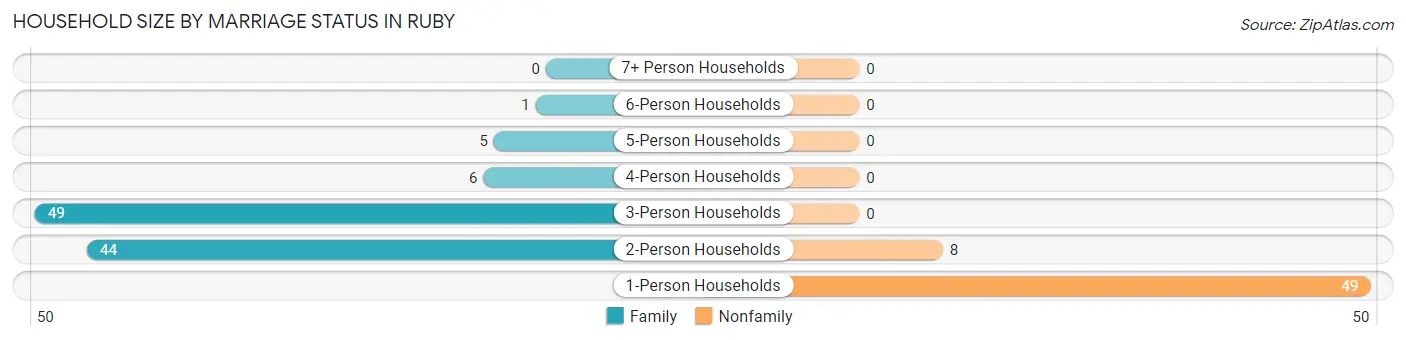
| Household Size | Family Households | Nonfamily Households |
| 1-Person Households | - | 49 (30.2%) |
| 2-Person Households | 44 (27.2%) | 8 (4.9%) |
| 3-Person Households | 49 (30.2%) | 0 (0.0%) |
| 4-Person Households | 6 (3.7%) | 0 (0.0%) |
| 5-Person Households | 5 (3.1%) | 0 (0.0%) |
| 6-Person Households | 1 (0.6%) | 0 (0.0%) |
| 7+ Person Households | 0 (0.0%) | 0 (0.0%) |
| Total | 105 (64.8%) | 57 (35.2%) |
Female Fertility in Ruby
Fertility by Age in Ruby
Average fertility rate in Ruby is 11.0 births per 1,000 women. Women in the age bracket of 20 to 34 years have the highest fertility rate with 14.0 births per 1,000 women. Women in the age bracket of 20 to 34 years acount for 100.0% of all women with births.
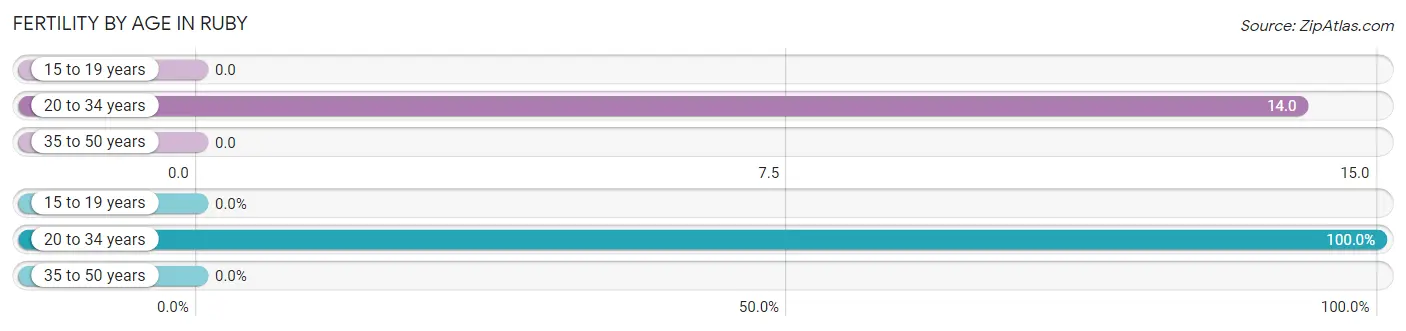
| Age Bracket | Women with Births | Births / 1,000 Women |
| 15 to 19 years | 0 (0.0%) | 0.0 |
| 20 to 34 years | 1 (100.0%) | 14.0 |
| 35 to 50 years | 0 (0.0%) | 0.0 |
| Total | 1 (100.0%) | 11.0 |
Fertility by Age by Marriage Status in Ruby
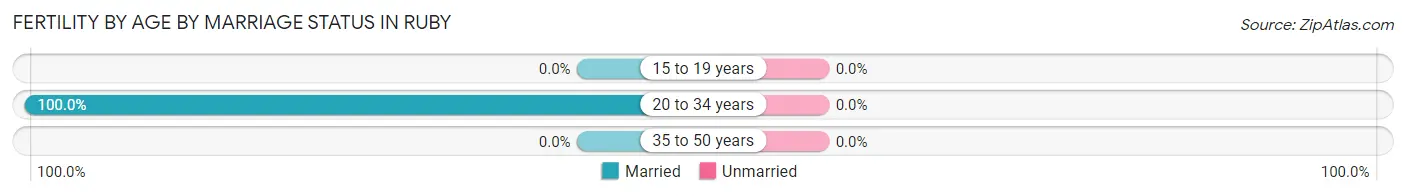
| Age Bracket | Married | Unmarried |
| 15 to 19 years | 0 (0.0%) | 0 (0.0%) |
| 20 to 34 years | 1 (100.0%) | 0 (0.0%) |
| 35 to 50 years | 0 (0.0%) | 0 (0.0%) |
| Total | 1 (100.0%) | 0 (0.0%) |
Fertility by Education in Ruby
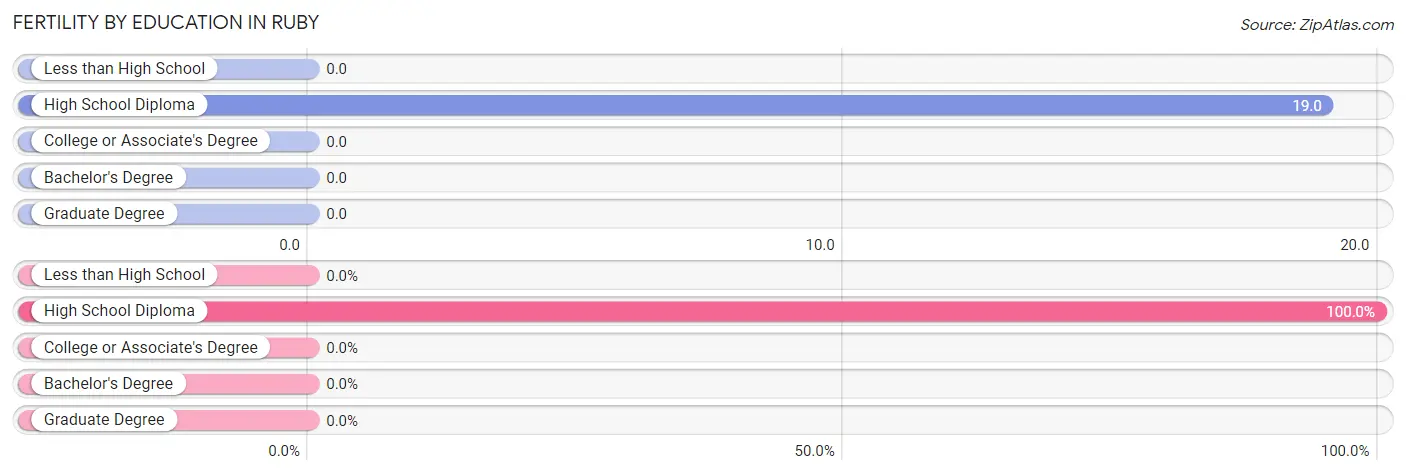
| Educational Attainment | Women with Births | Births / 1,000 Women |
| Less than High School | 0 (0.0%) | 0.0 |
| High School Diploma | 1 (100.0%) | 19.0 |
| College or Associate's Degree | 0 (0.0%) | 0.0 |
| Bachelor's Degree | 0 (0.0%) | 0.0 |
| Graduate Degree | 0 (0.0%) | 0.0 |
| Total | 1 (100.0%) | 11.0 |
Fertility by Education by Marriage Status in Ruby
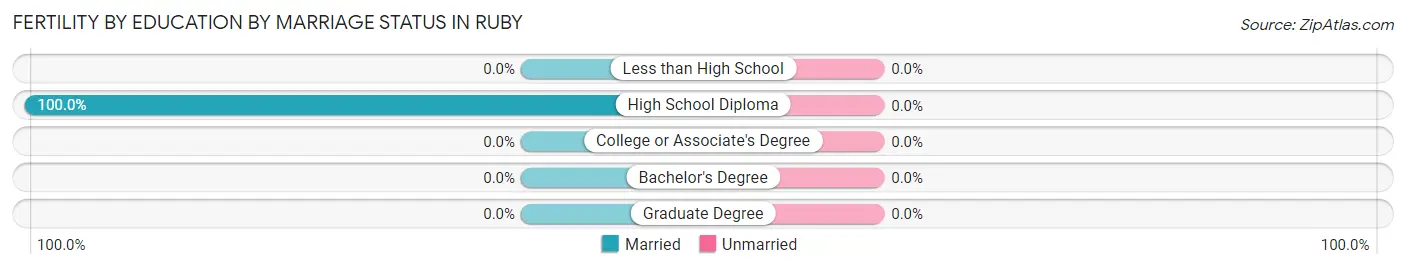
| Educational Attainment | Married | Unmarried |
| Less than High School | 0 (0.0%) | 0 (0.0%) |
| High School Diploma | 1 (100.0%) | 0 (0.0%) |
| College or Associate's Degree | 0 (0.0%) | 0 (0.0%) |
| Bachelor's Degree | 0 (0.0%) | 0 (0.0%) |
| Graduate Degree | 0 (0.0%) | 0 (0.0%) |
| Total | 1 (100.0%) | 0 (0.0%) |
Employment Characteristics in Ruby
Employment by Class of Employer in Ruby
Among the 129 employed individuals in Ruby, private company employees (107 | 83.0%), local government employees (8 | 6.2%), and self-employed (not incorporated) (6 | 4.6%) make up the most common classes of employment.
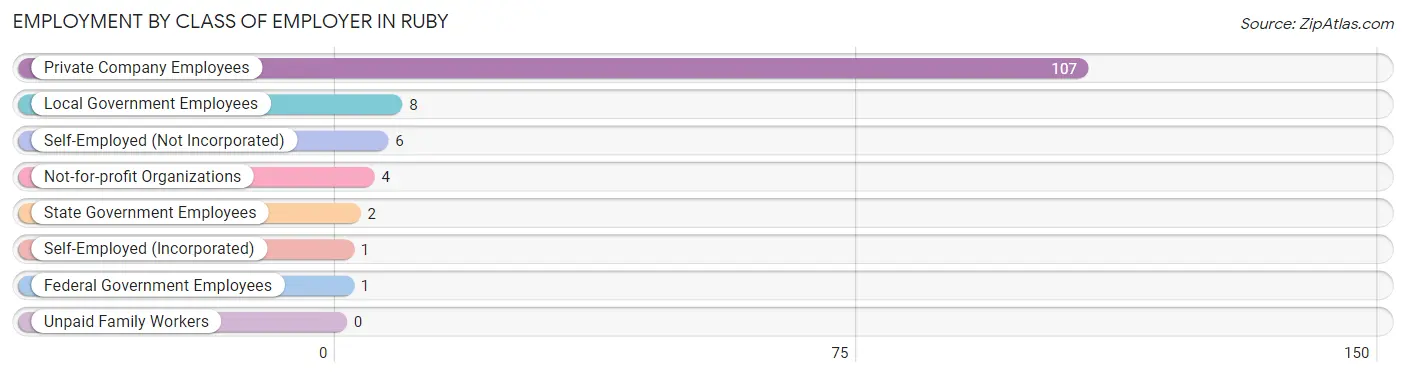
| Employer Class | # Employees | % Employees |
| Private Company Employees | 107 | 83.0% |
| Self-Employed (Incorporated) | 1 | 0.8% |
| Self-Employed (Not Incorporated) | 6 | 4.6% |
| Not-for-profit Organizations | 4 | 3.1% |
| Local Government Employees | 8 | 6.2% |
| State Government Employees | 2 | 1.5% |
| Federal Government Employees | 1 | 0.8% |
| Unpaid Family Workers | 0 | 0.0% |
| Total | 129 | 100.0% |
Employment Status by Age in Ruby
According to the labor force statistics for Ruby, out of the total population over 16 years of age (266), 50.8% or 135 individuals are in the labor force, with 0.7% or 1 of them unemployed. The age group with the highest labor force participation rate is 20 to 24 years, with 100.0% or 1 individuals in the labor force. Within the labor force, the 20 to 24 years age range has the highest percentage of unemployed individuals, with 100.0% or 1 of them being unemployed.
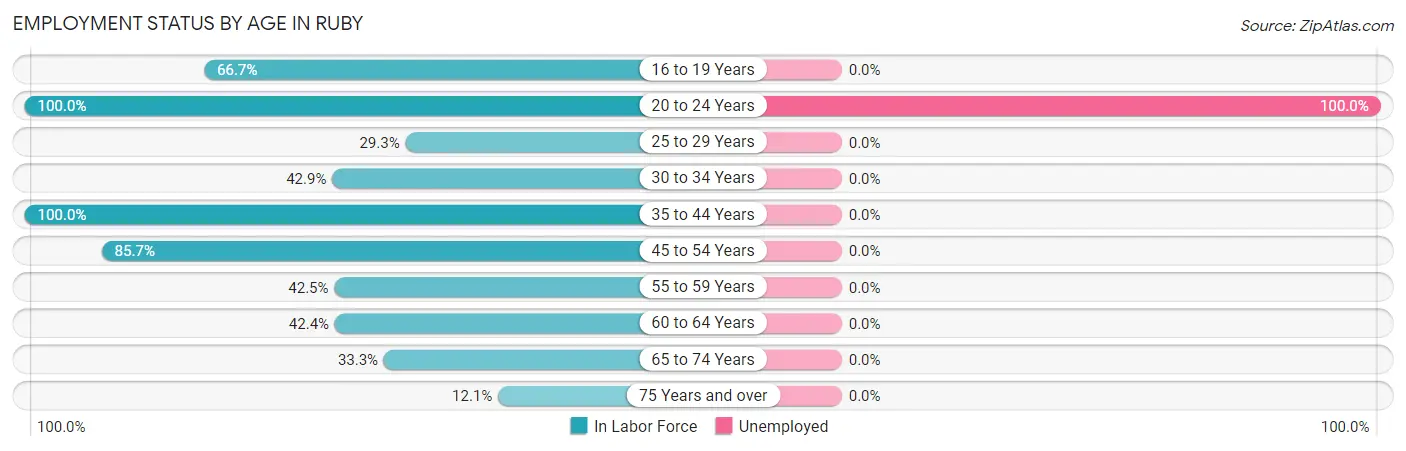
| Age Bracket | In Labor Force | Unemployed |
| 16 to 19 Years | 2 (66.7%) | 0 (0.0%) |
| 20 to 24 Years | 1 (100.0%) | 1 (100.0%) |
| 25 to 29 Years | 17 (29.3%) | 0 (0.0%) |
| 30 to 34 Years | 9 (42.9%) | 0 (0.0%) |
| 35 to 44 Years | 57 (100.0%) | 0 (0.0%) |
| 45 to 54 Years | 12 (85.7%) | 0 (0.0%) |
| 55 to 59 Years | 17 (42.5%) | 0 (0.0%) |
| 60 to 64 Years | 14 (42.4%) | 0 (0.0%) |
| 65 to 74 Years | 2 (33.3%) | 0 (0.0%) |
| 75 Years and over | 4 (12.1%) | 0 (0.0%) |
| Total | 135 (50.8%) | 1 (0.7%) |
Employment Status by Educational Attainment in Ruby
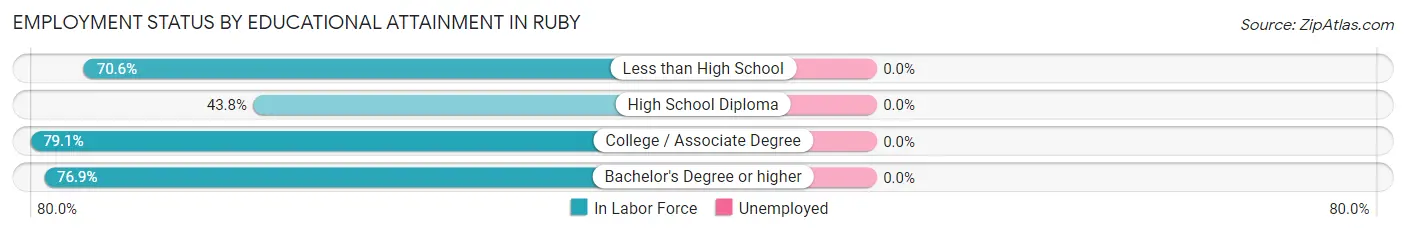
| Educational Attainment | In Labor Force | Unemployed |
| Less than High School | 12 (70.6%) | 0 (0.0%) |
| High School Diploma | 60 (43.8%) | 0 (0.0%) |
| College / Associate Degree | 34 (79.1%) | 0 (0.0%) |
| Bachelor's Degree or higher | 20 (76.9%) | 0 (0.0%) |
| Total | 126 (56.5%) | 0 (0.0%) |
Employment Occupations by Sex in Ruby
Management, Business, Science and Arts Occupations
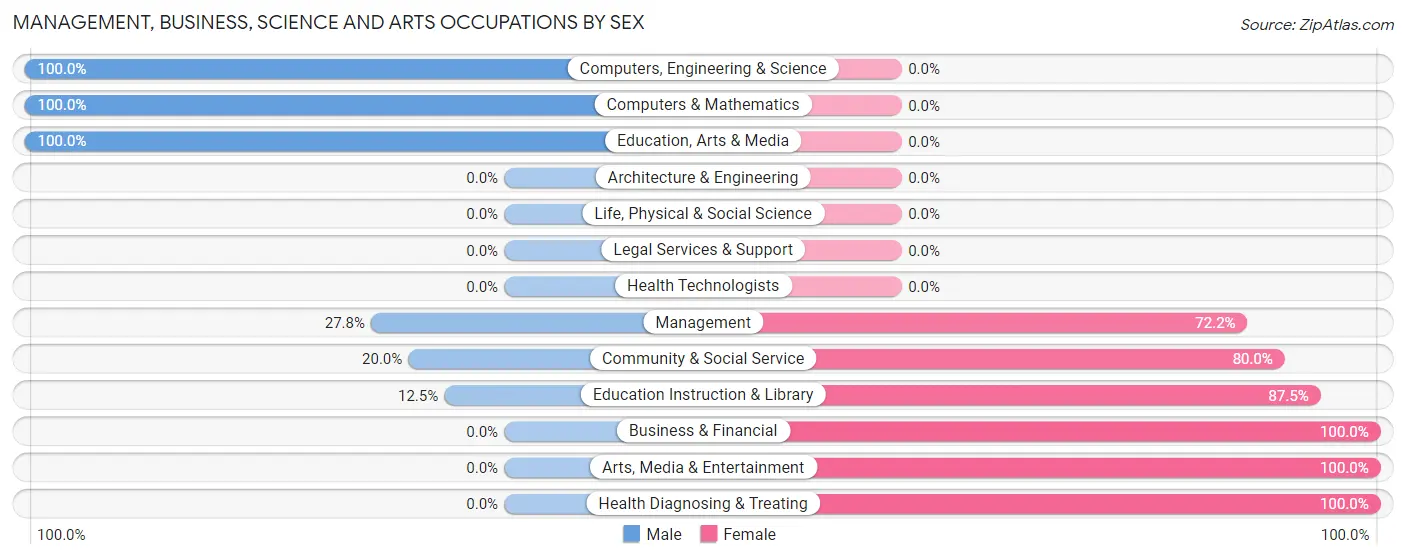
The most common Management, Business, Science and Arts occupations in Ruby are Management (18 | 13.4%), Community & Social Service (10 | 7.5%), Education Instruction & Library (8 | 6.0%), Business & Financial (4 | 3.0%), and Computers, Engineering & Science (2 | 1.5%).
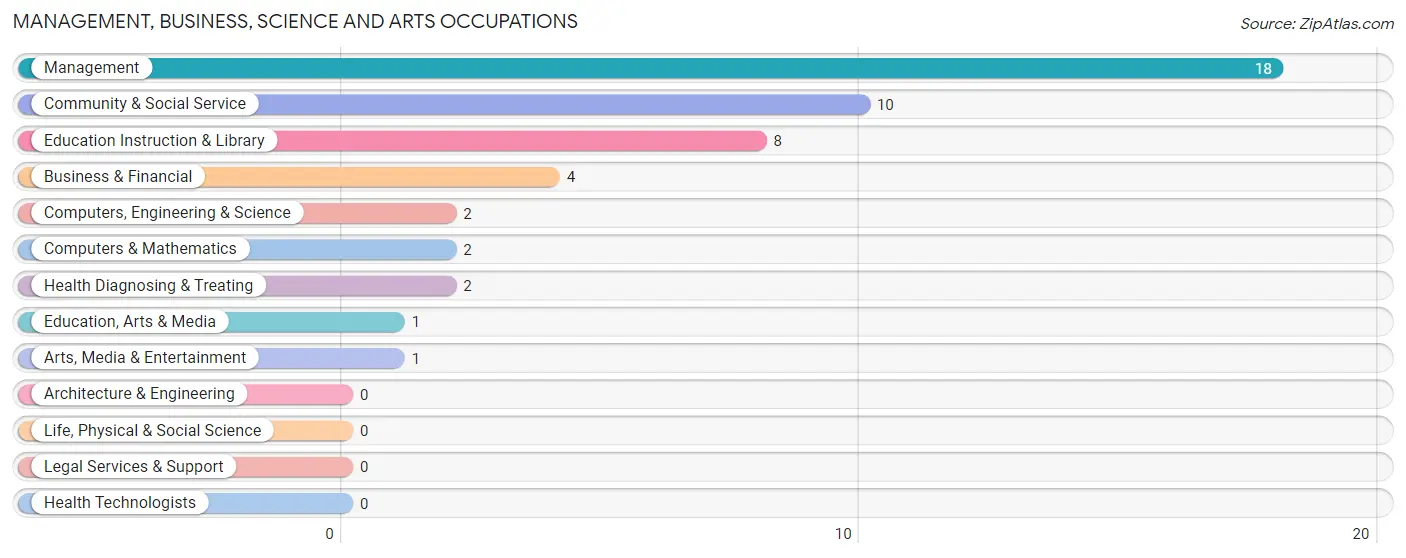
Management, Business, Science and Arts Occupations by Sex
Within the Management, Business, Science and Arts occupations in Ruby, the most male-oriented occupations are Computers, Engineering & Science (100.0%), Computers & Mathematics (100.0%), and Education, Arts & Media (100.0%), while the most female-oriented occupations are Business & Financial (100.0%), Arts, Media & Entertainment (100.0%), and Health Diagnosing & Treating (100.0%).
| Occupation | Male | Female |
| Management | 5 (27.8%) | 13 (72.2%) |
| Business & Financial | 0 (0.0%) | 4 (100.0%) |
| Computers, Engineering & Science | 2 (100.0%) | 0 (0.0%) |
| Computers & Mathematics | 2 (100.0%) | 0 (0.0%) |
| Architecture & Engineering | 0 (0.0%) | 0 (0.0%) |
| Life, Physical & Social Science | 0 (0.0%) | 0 (0.0%) |
| Community & Social Service | 2 (20.0%) | 8 (80.0%) |
| Education, Arts & Media | 1 (100.0%) | 0 (0.0%) |
| Legal Services & Support | 0 (0.0%) | 0 (0.0%) |
| Education Instruction & Library | 1 (12.5%) | 7 (87.5%) |
| Arts, Media & Entertainment | 0 (0.0%) | 1 (100.0%) |
| Health Diagnosing & Treating | 0 (0.0%) | 2 (100.0%) |
| Health Technologists | 0 (0.0%) | 0 (0.0%) |
| Total (Category) | 9 (25.0%) | 27 (75.0%) |
| Total (Overall) | 81 (60.5%) | 53 (39.6%) |
Services Occupations
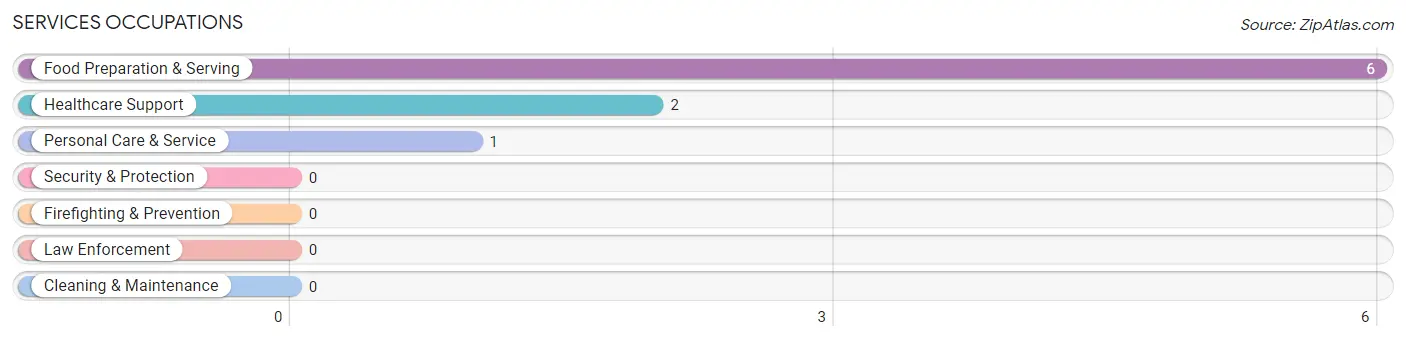
The most common Services occupations in Ruby are Food Preparation & Serving (6 | 4.5%), Healthcare Support (2 | 1.5%), and Personal Care & Service (1 | 0.7%).
Services Occupations by Sex
| Occupation | Male | Female |
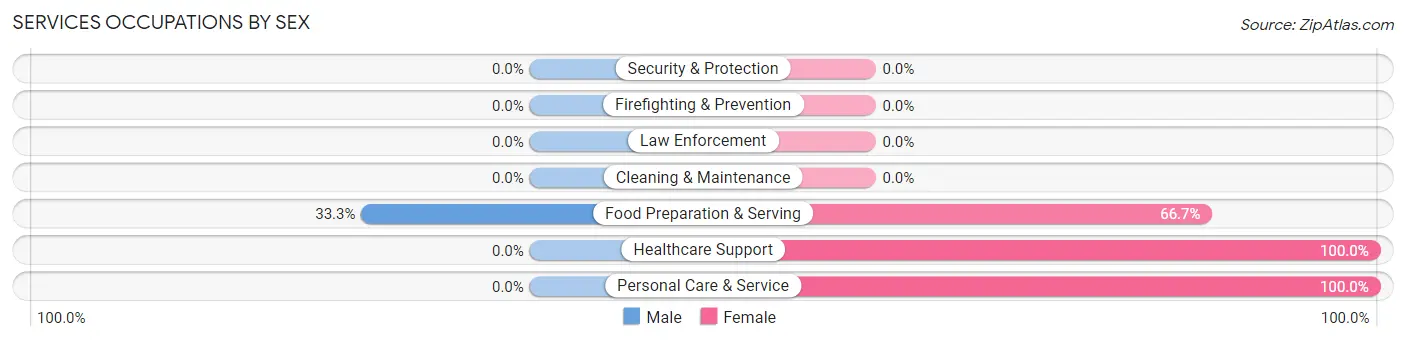
| Healthcare Support | 0 (0.0%) | 2 (100.0%) |
| Security & Protection | 0 (0.0%) | 0 (0.0%) |
| Firefighting & Prevention | 0 (0.0%) | 0 (0.0%) |
| Law Enforcement | 0 (0.0%) | 0 (0.0%) |
| Food Preparation & Serving | 2 (33.3%) | 4 (66.7%) |
| Cleaning & Maintenance | 0 (0.0%) | 0 (0.0%) |
| Personal Care & Service | 0 (0.0%) | 1 (100.0%) |
| Total (Category) | 2 (22.2%) | 7 (77.8%) |
| Total (Overall) | 81 (60.5%) | 53 (39.6%) |
Sales and Office Occupations
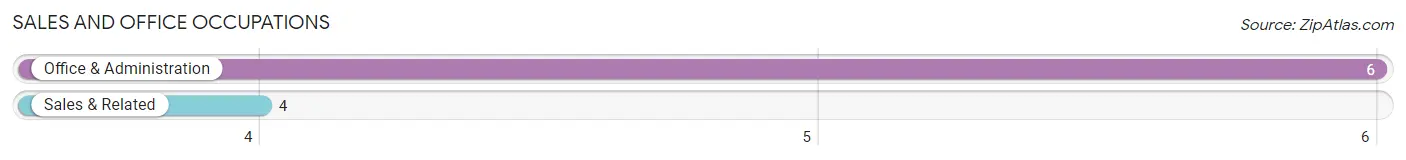
The most common Sales and Office occupations in Ruby are Office & Administration (6 | 4.5%), and Sales & Related (4 | 3.0%).
Sales and Office Occupations by Sex
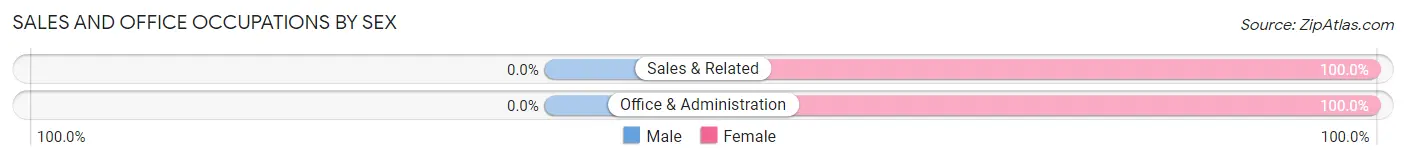
| Occupation | Male | Female |
| Sales & Related | 0 (0.0%) | 4 (100.0%) |
| Office & Administration | 0 (0.0%) | 6 (100.0%) |
| Total (Category) | 0 (0.0%) | 10 (100.0%) |
| Total (Overall) | 81 (60.5%) | 53 (39.6%) |
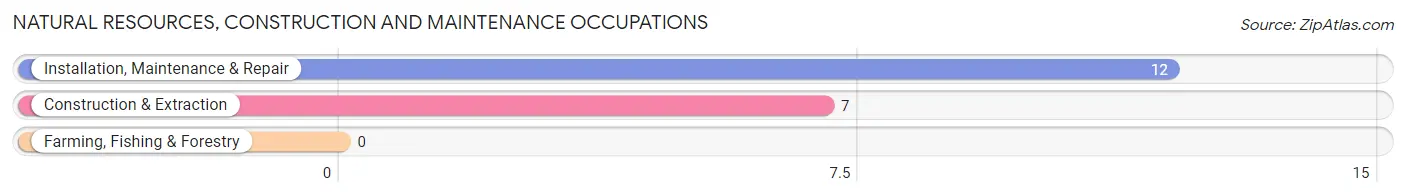
Natural Resources, Construction and Maintenance Occupations
The most common Natural Resources, Construction and Maintenance occupations in Ruby are Installation, Maintenance & Repair (12 | 9.0%), and Construction & Extraction (7 | 5.2%).
Natural Resources, Construction and Maintenance Occupations by Sex
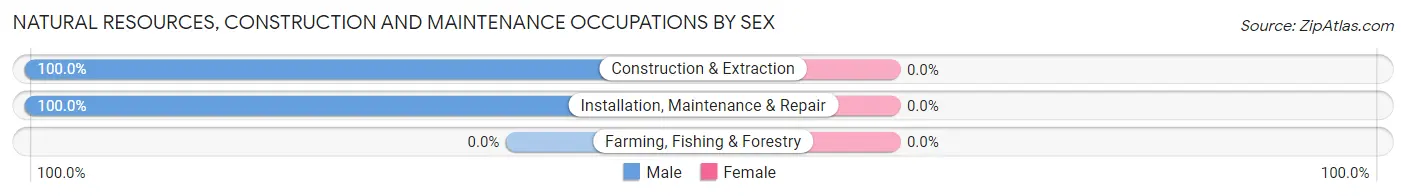
| Occupation | Male | Female |
| Farming, Fishing & Forestry | 0 (0.0%) | 0 (0.0%) |
| Construction & Extraction | 7 (100.0%) | 0 (0.0%) |
| Installation, Maintenance & Repair | 12 (100.0%) | 0 (0.0%) |
| Total (Category) | 19 (100.0%) | 0 (0.0%) |
| Total (Overall) | 81 (60.5%) | 53 (39.6%) |
Production, Transportation and Moving Occupations
The most common Production, Transportation and Moving occupations in Ruby are Material Moving (42 | 31.3%), Production (16 | 11.9%), and Transportation (2 | 1.5%).
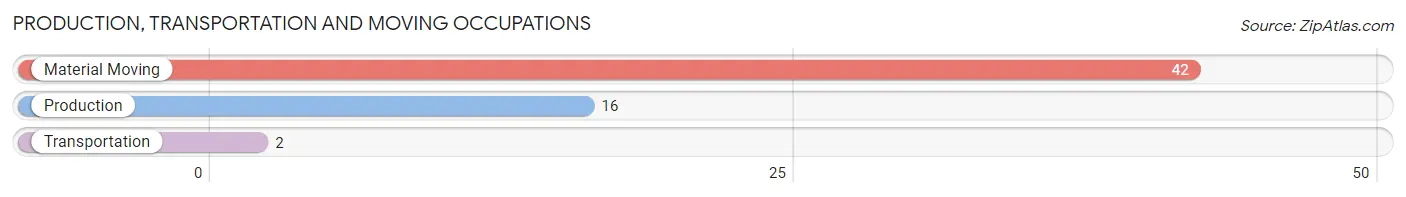
Production, Transportation and Moving Occupations by Sex
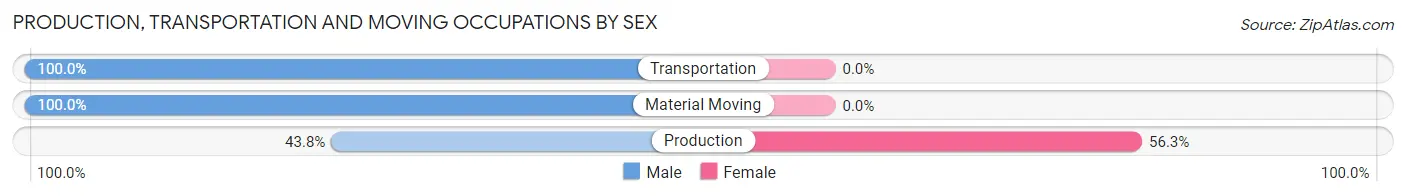
| Occupation | Male | Female |
| Production | 7 (43.8%) | 9 (56.2%) |
| Transportation | 2 (100.0%) | 0 (0.0%) |
| Material Moving | 42 (100.0%) | 0 (0.0%) |
| Total (Category) | 51 (85.0%) | 9 (15.0%) |
| Total (Overall) | 81 (60.5%) | 53 (39.6%) |
Employment Industries by Sex in Ruby
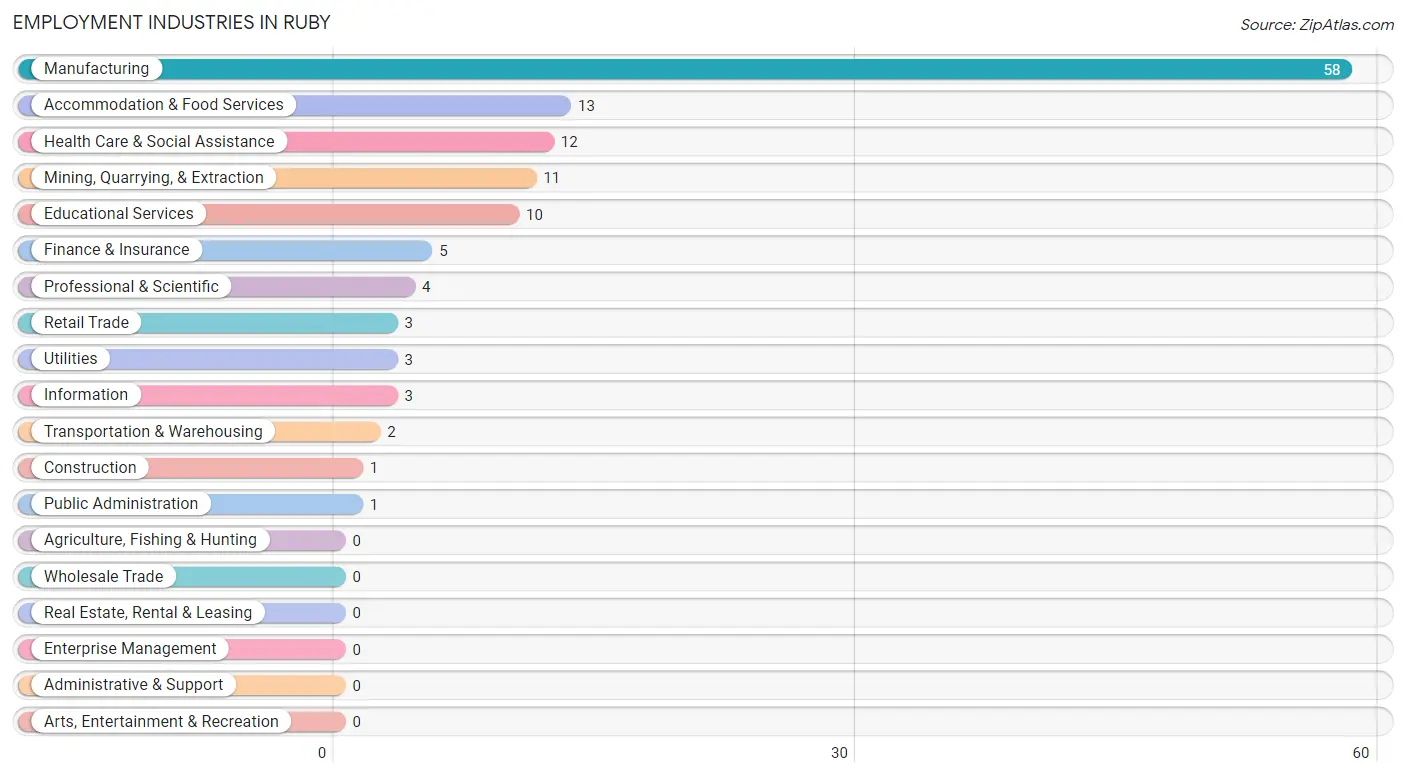
Employment Industries in Ruby
The major employment industries in Ruby include Manufacturing (58 | 43.3%), Accommodation & Food Services (13 | 9.7%), Health Care & Social Assistance (12 | 9.0%), Mining, Quarrying, & Extraction (11 | 8.2%), and Educational Services (10 | 7.5%).
Employment Industries by Sex in Ruby
The Ruby industries that see more men than women are Mining, Quarrying, & Extraction (100.0%), Transportation & Warehousing (100.0%), and Utilities (100.0%), whereas the industries that tend to have a higher number of women are Construction (100.0%), Retail Trade (100.0%), and Finance & Insurance (100.0%).
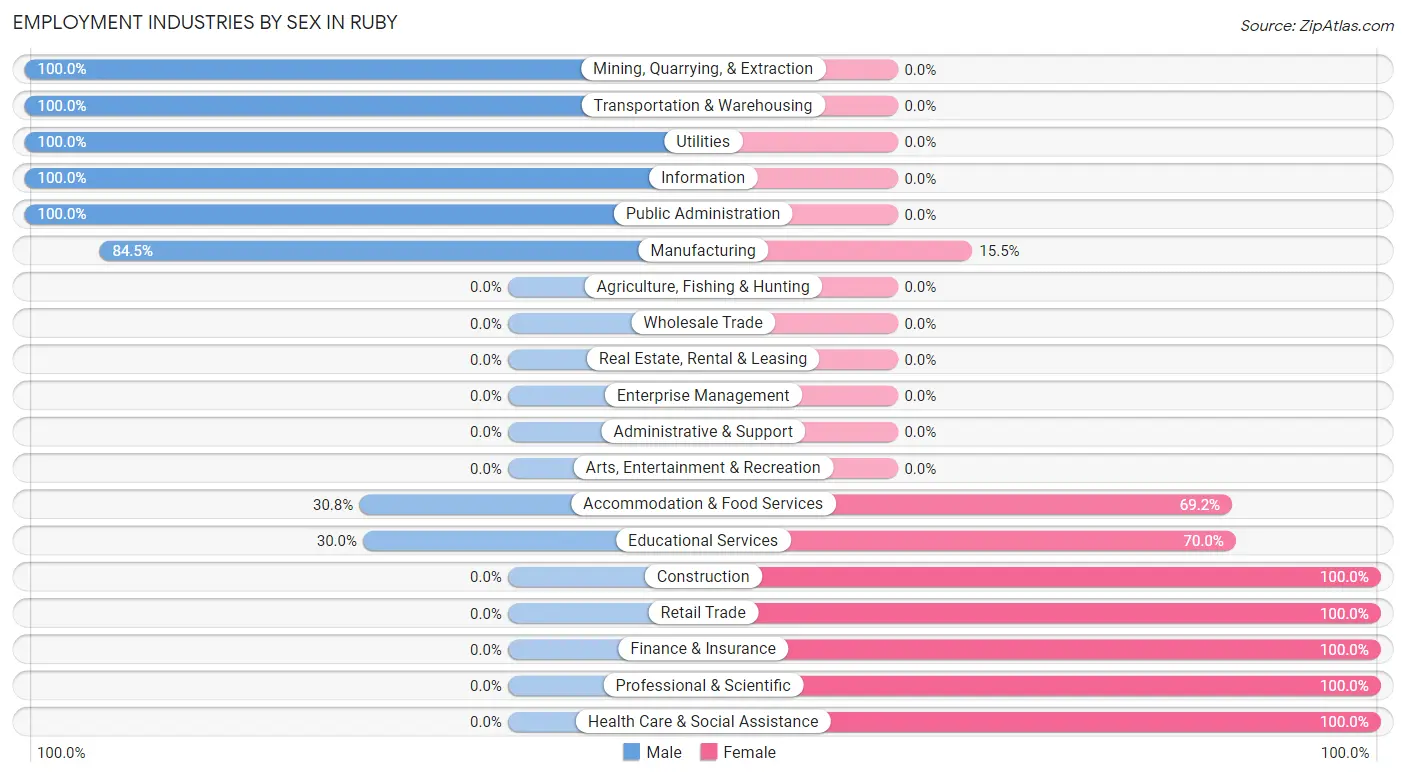
| Industry | Male | Female |
| Agriculture, Fishing & Hunting | 0 (0.0%) | 0 (0.0%) |
| Mining, Quarrying, & Extraction | 11 (100.0%) | 0 (0.0%) |
| Construction | 0 (0.0%) | 1 (100.0%) |
| Manufacturing | 49 (84.5%) | 9 (15.5%) |
| Wholesale Trade | 0 (0.0%) | 0 (0.0%) |
| Retail Trade | 0 (0.0%) | 3 (100.0%) |
| Transportation & Warehousing | 2 (100.0%) | 0 (0.0%) |
| Utilities | 3 (100.0%) | 0 (0.0%) |
| Information | 3 (100.0%) | 0 (0.0%) |
| Finance & Insurance | 0 (0.0%) | 5 (100.0%) |
| Real Estate, Rental & Leasing | 0 (0.0%) | 0 (0.0%) |
| Professional & Scientific | 0 (0.0%) | 4 (100.0%) |
| Enterprise Management | 0 (0.0%) | 0 (0.0%) |
| Administrative & Support | 0 (0.0%) | 0 (0.0%) |
| Educational Services | 3 (30.0%) | 7 (70.0%) |
| Health Care & Social Assistance | 0 (0.0%) | 12 (100.0%) |
| Arts, Entertainment & Recreation | 0 (0.0%) | 0 (0.0%) |
| Accommodation & Food Services | 4 (30.8%) | 9 (69.2%) |
| Public Administration | 1 (100.0%) | 0 (0.0%) |
| Total | 81 (60.5%) | 53 (39.6%) |
Education in Ruby
School Enrollment in Ruby
The most common levels of schooling among the 89 students in Ruby are elementary school (58 | 65.2%), nursery / preschool (11 | 12.4%), and middle school (8 | 9.0%).
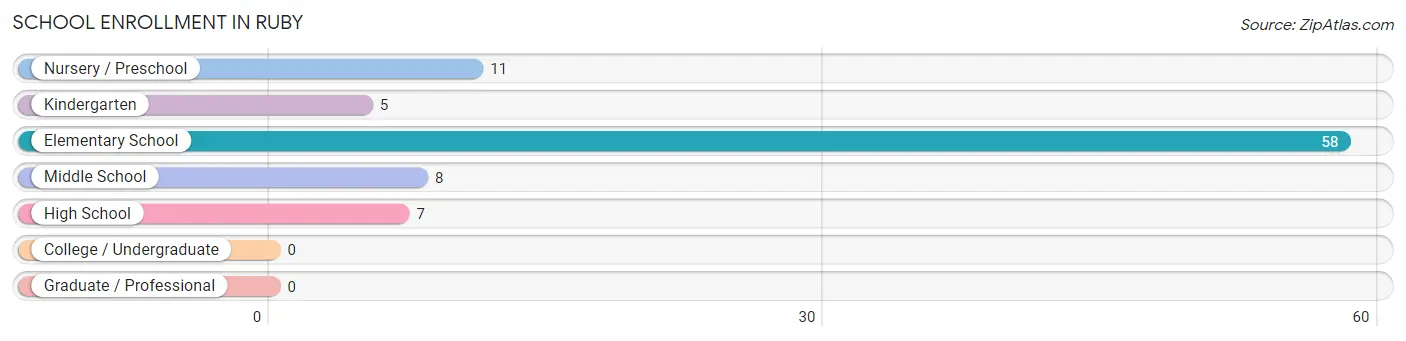
| School Level | # Students | % Students |
| Nursery / Preschool | 11 | 12.4% |
| Kindergarten | 5 | 5.6% |
| Elementary School | 58 | 65.2% |
| Middle School | 8 | 9.0% |
| High School | 7 | 7.9% |
| College / Undergraduate | 0 | 0.0% |
| Graduate / Professional | 0 | 0.0% |
| Total | 89 | 100.0% |
School Enrollment by Age by Funding Source in Ruby
Out of a total of 89 students who are enrolled in schools in Ruby, 1 (1.1%) attend a private institution, while the remaining 88 (98.9%) are enrolled in public schools. The age group of 3 to 4 year olds has the highest likelihood of being enrolled in private schools, with 1 (100.0% in the age bracket) enrolled. Conversely, the age group of 5 to 9 year old has the lowest likelihood of being enrolled in a private school, with 73 (100.0% in the age bracket) attending a public institution.
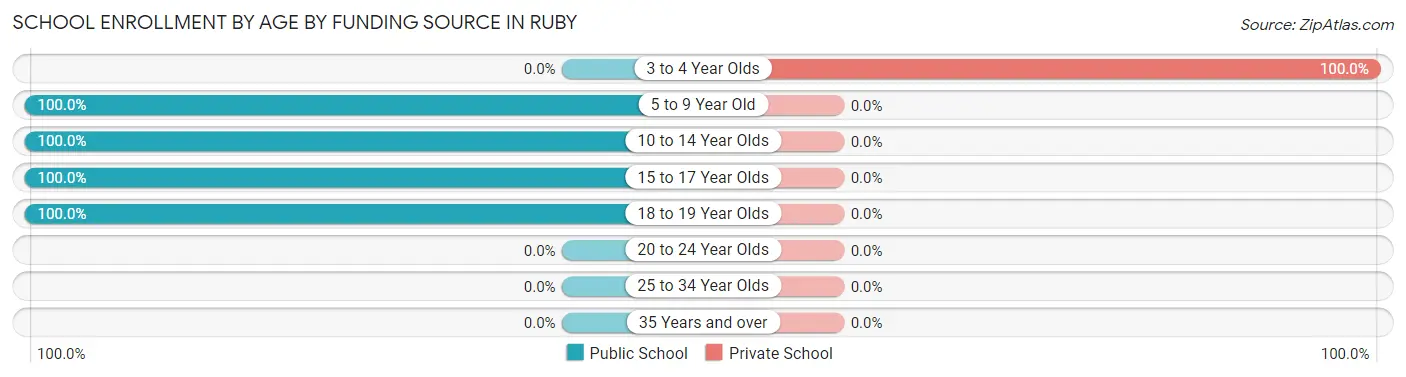
| Age Bracket | Public School | Private School |
| 3 to 4 Year Olds | 0 (0.0%) | 1 (100.0%) |
| 5 to 9 Year Old | 73 (100.0%) | 0 (0.0%) |
| 10 to 14 Year Olds | 8 (100.0%) | 0 (0.0%) |
| 15 to 17 Year Olds | 5 (100.0%) | 0 (0.0%) |
| 18 to 19 Year Olds | 2 (100.0%) | 0 (0.0%) |
| 20 to 24 Year Olds | 0 (0.0%) | 0 (0.0%) |
| 25 to 34 Year Olds | 0 (0.0%) | 0 (0.0%) |
| 35 Years and over | 0 (0.0%) | 0 (0.0%) |
| Total | 88 (98.9%) | 1 (1.1%) |
Educational Attainment by Field of Study in Ruby
Arts & humanities (13 | 37.1%), education (7 | 20.0%), science & technology (5 | 14.3%), business (5 | 14.3%), and social sciences (2 | 5.7%) are the most common fields of study among 35 individuals in Ruby who have obtained a bachelor's degree or higher.
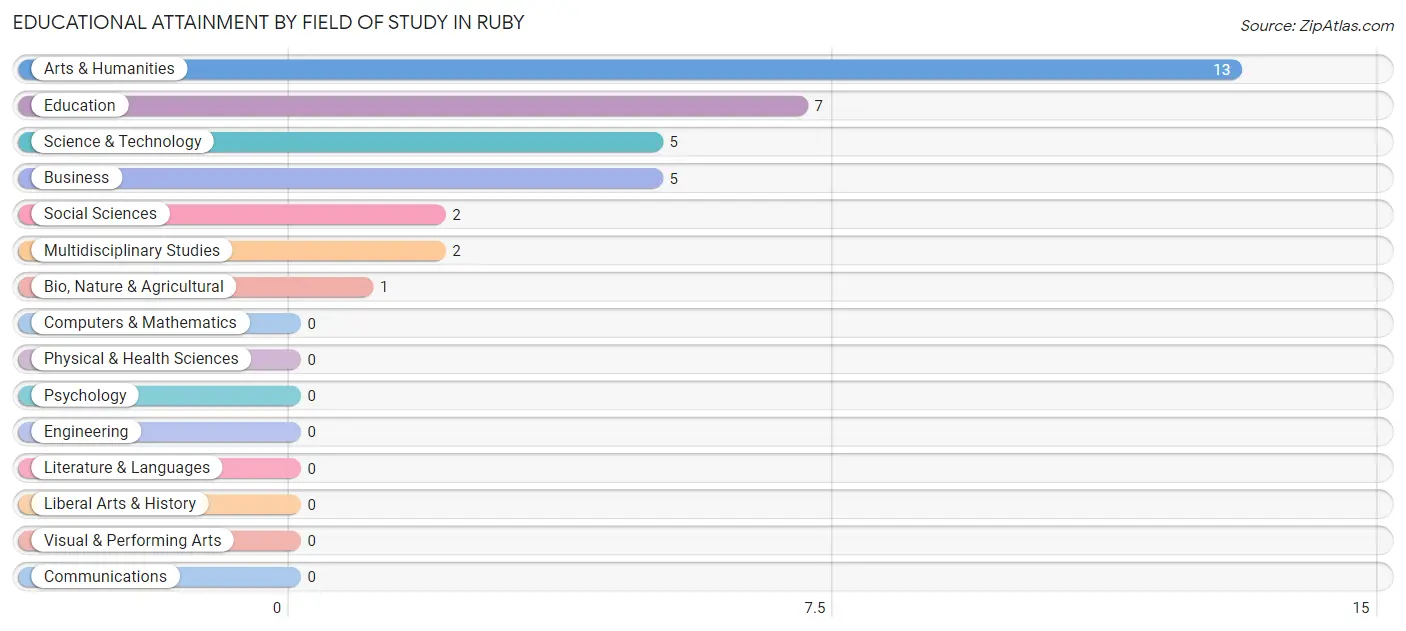
| Field of Study | # Graduates | % Graduates |
| Computers & Mathematics | 0 | 0.0% |
| Bio, Nature & Agricultural | 1 | 2.9% |
| Physical & Health Sciences | 0 | 0.0% |
| Psychology | 0 | 0.0% |
| Social Sciences | 2 | 5.7% |
| Engineering | 0 | 0.0% |
| Multidisciplinary Studies | 2 | 5.7% |
| Science & Technology | 5 | 14.3% |
| Business | 5 | 14.3% |
| Education | 7 | 20.0% |
| Literature & Languages | 0 | 0.0% |
| Liberal Arts & History | 0 | 0.0% |
| Visual & Performing Arts | 0 | 0.0% |
| Communications | 0 | 0.0% |
| Arts & Humanities | 13 | 37.1% |
| Total | 35 | 100.0% |
Transportation & Commute in Ruby
Vehicle Availability by Sex in Ruby
The most prevalent vehicle ownership categories in Ruby are males with 3 vehicles (55, accounting for 67.9%) and females with 3 vehicles (16, making up 114.6%).
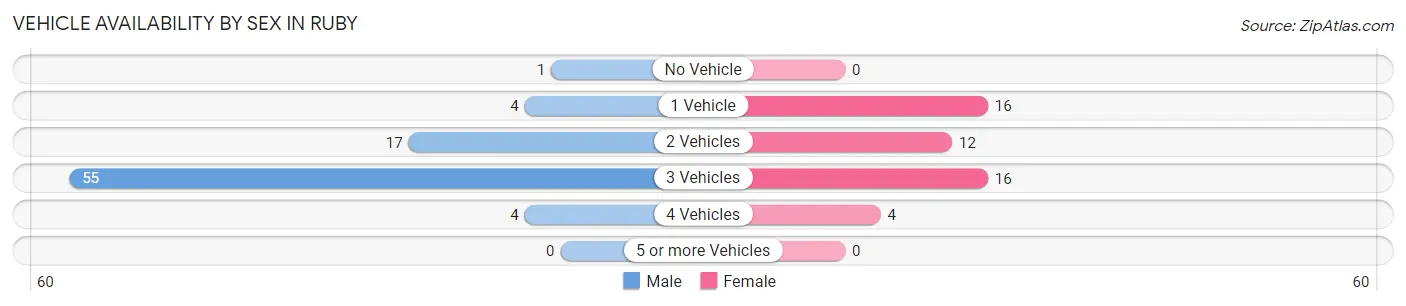
| Vehicles Available | Male | Female |
| No Vehicle | 1 (1.2%) | 0 (0.0%) |
| 1 Vehicle | 4 (4.9%) | 16 (33.3%) |
| 2 Vehicles | 17 (21.0%) | 12 (25.0%) |
| 3 Vehicles | 55 (67.9%) | 16 (33.3%) |
| 4 Vehicles | 4 (4.9%) | 4 (8.3%) |
| 5 or more Vehicles | 0 (0.0%) | 0 (0.0%) |
| Total | 81 (100.0%) | 48 (100.0%) |
Commute Time in Ruby
The most frequently occuring commute durations in Ruby are 10 to 14 minutes (49 commuters, 38.0%), 20 to 24 minutes (21 commuters, 16.3%), and 45 to 59 minutes (11 commuters, 8.5%).
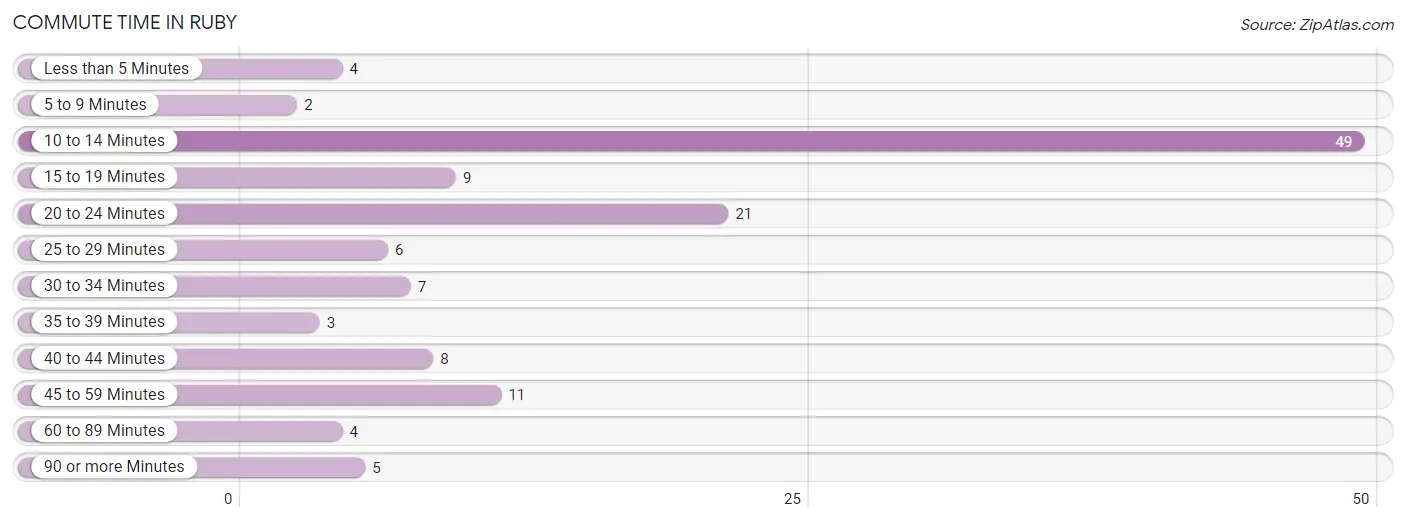
| Commute Time | # Commuters | % Commuters |
| Less than 5 Minutes | 4 | 3.1% |
| 5 to 9 Minutes | 2 | 1.5% |
| 10 to 14 Minutes | 49 | 38.0% |
| 15 to 19 Minutes | 9 | 7.0% |
| 20 to 24 Minutes | 21 | 16.3% |
| 25 to 29 Minutes | 6 | 4.6% |
| 30 to 34 Minutes | 7 | 5.4% |
| 35 to 39 Minutes | 3 | 2.3% |
| 40 to 44 Minutes | 8 | 6.2% |
| 45 to 59 Minutes | 11 | 8.5% |
| 60 to 89 Minutes | 4 | 3.1% |
| 90 or more Minutes | 5 | 3.9% |
Commute Time by Sex in Ruby
The most common commute times in Ruby are 10 to 14 minutes (44 commuters, 54.3%) for males and 20 to 24 minutes (17 commuters, 35.4%) for females.
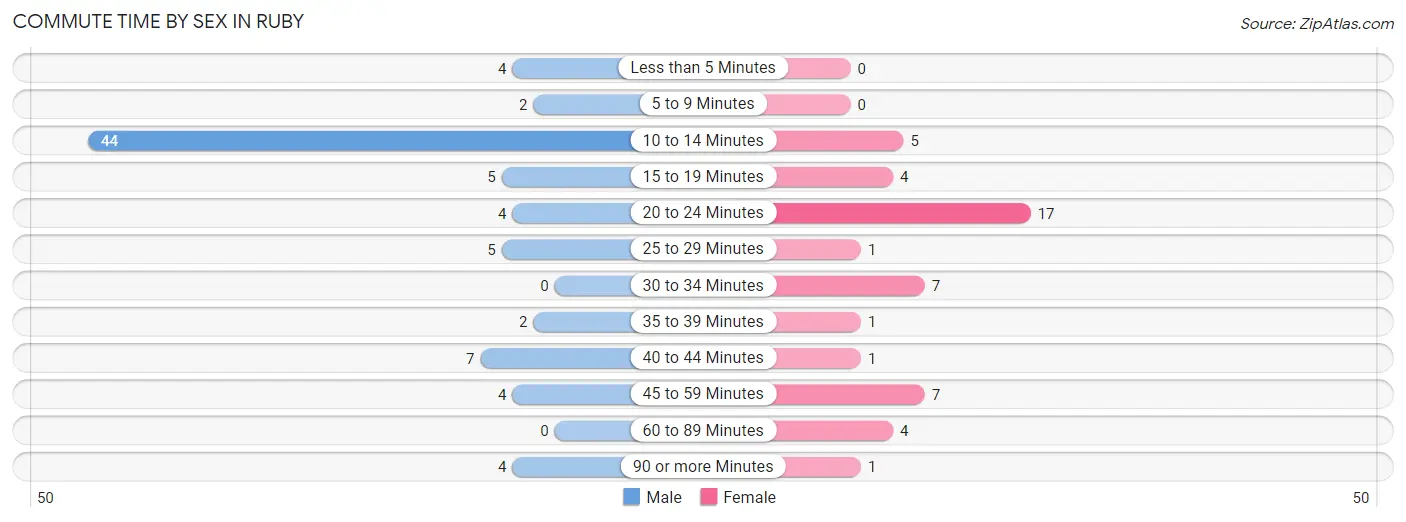
| Commute Time | Male | Female |
| Less than 5 Minutes | 4 (4.9%) | 0 (0.0%) |
| 5 to 9 Minutes | 2 (2.5%) | 0 (0.0%) |
| 10 to 14 Minutes | 44 (54.3%) | 5 (10.4%) |
| 15 to 19 Minutes | 5 (6.2%) | 4 (8.3%) |
| 20 to 24 Minutes | 4 (4.9%) | 17 (35.4%) |
| 25 to 29 Minutes | 5 (6.2%) | 1 (2.1%) |
| 30 to 34 Minutes | 0 (0.0%) | 7 (14.6%) |
| 35 to 39 Minutes | 2 (2.5%) | 1 (2.1%) |
| 40 to 44 Minutes | 7 (8.6%) | 1 (2.1%) |
| 45 to 59 Minutes | 4 (4.9%) | 7 (14.6%) |
| 60 to 89 Minutes | 0 (0.0%) | 4 (8.3%) |
| 90 or more Minutes | 4 (4.9%) | 1 (2.1%) |
Time of Departure to Work by Sex in Ruby
The most frequent times of departure to work in Ruby are 12:00 PM to 3:59 PM (44, 54.3%) for males and 7:00 AM to 7:29 AM (12, 25.0%) for females.
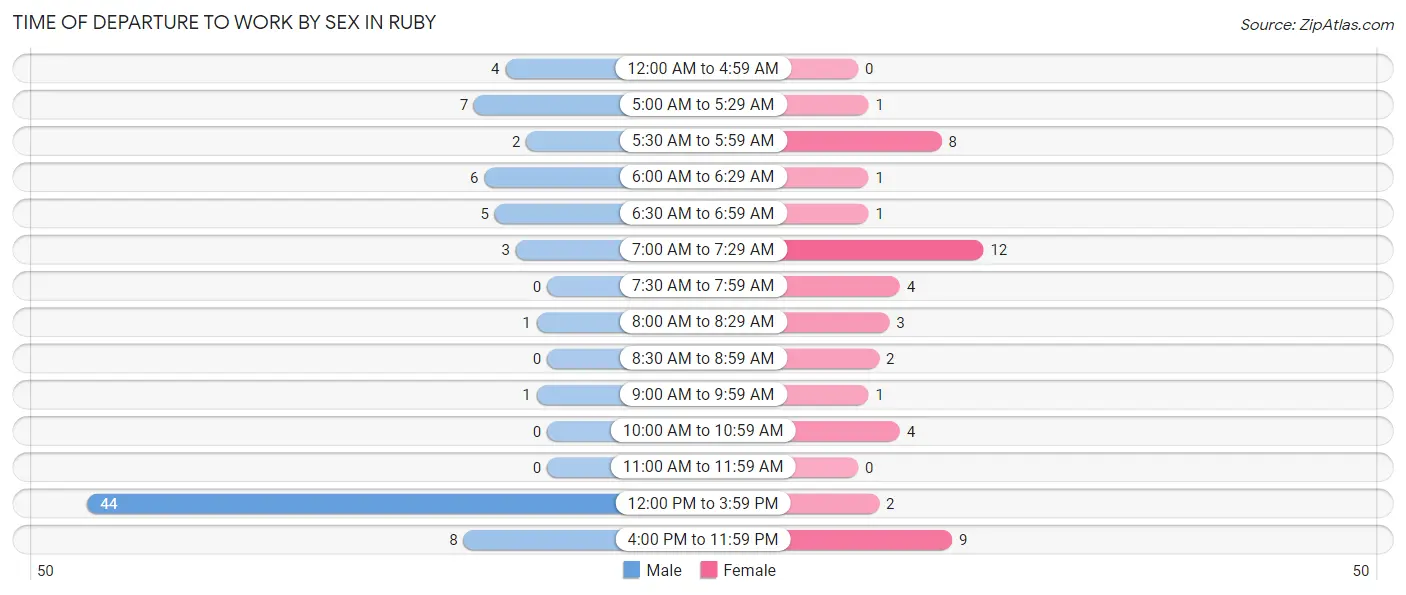
| Time of Departure | Male | Female |
| 12:00 AM to 4:59 AM | 4 (4.9%) | 0 (0.0%) |
| 5:00 AM to 5:29 AM | 7 (8.6%) | 1 (2.1%) |
| 5:30 AM to 5:59 AM | 2 (2.5%) | 8 (16.7%) |
| 6:00 AM to 6:29 AM | 6 (7.4%) | 1 (2.1%) |
| 6:30 AM to 6:59 AM | 5 (6.2%) | 1 (2.1%) |
| 7:00 AM to 7:29 AM | 3 (3.7%) | 12 (25.0%) |
| 7:30 AM to 7:59 AM | 0 (0.0%) | 4 (8.3%) |
| 8:00 AM to 8:29 AM | 1 (1.2%) | 3 (6.2%) |
| 8:30 AM to 8:59 AM | 0 (0.0%) | 2 (4.2%) |
| 9:00 AM to 9:59 AM | 1 (1.2%) | 1 (2.1%) |
| 10:00 AM to 10:59 AM | 0 (0.0%) | 4 (8.3%) |
| 11:00 AM to 11:59 AM | 0 (0.0%) | 0 (0.0%) |
| 12:00 PM to 3:59 PM | 44 (54.3%) | 2 (4.2%) |
| 4:00 PM to 11:59 PM | 8 (9.9%) | 9 (18.8%) |
| Total | 81 (100.0%) | 48 (100.0%) |
Housing Occupancy in Ruby
Occupancy by Ownership in Ruby
Of the total 162 dwellings in Ruby, owner-occupied units account for 138 (85.2%), while renter-occupied units make up 24 (14.8%).
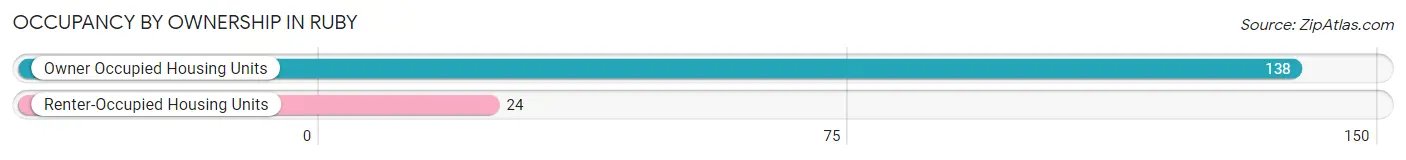
| Occupancy | # Housing Units | % Housing Units |
| Owner Occupied Housing Units | 138 | 85.2% |
| Renter-Occupied Housing Units | 24 | 14.8% |
| Total Occupied Housing Units | 162 | 100.0% |
Occupancy by Household Size in Ruby
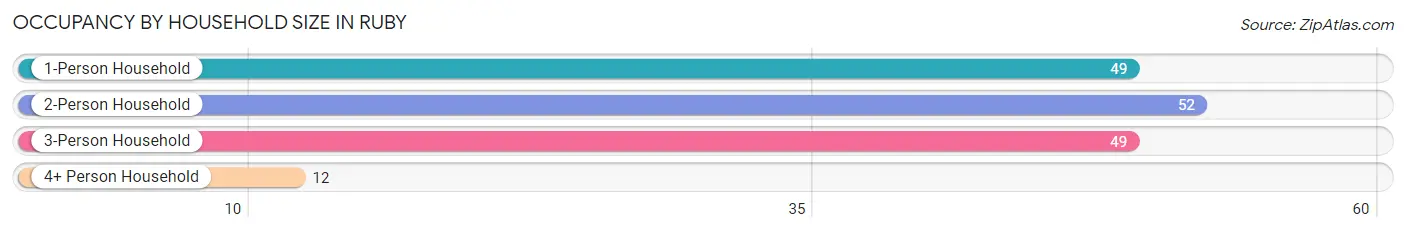
| Household Size | # Housing Units | % Housing Units |
| 1-Person Household | 49 | 30.2% |
| 2-Person Household | 52 | 32.1% |
| 3-Person Household | 49 | 30.2% |
| 4+ Person Household | 12 | 7.4% |
| Total Housing Units | 162 | 100.0% |
Occupancy by Ownership by Household Size in Ruby
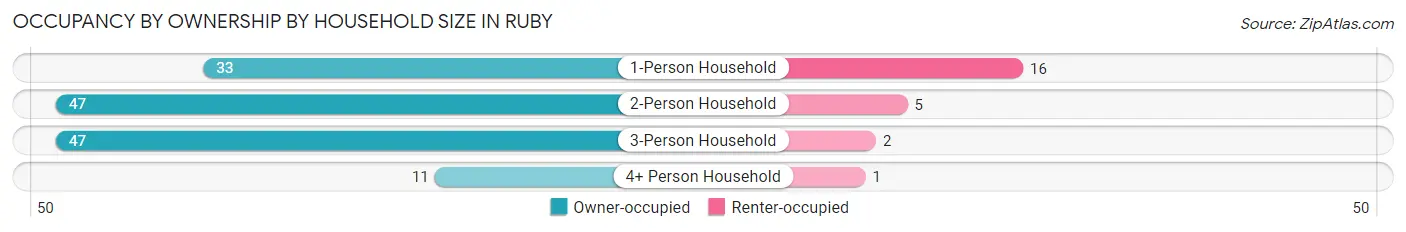
| Household Size | Owner-occupied | Renter-occupied |
| 1-Person Household | 33 (67.3%) | 16 (32.7%) |
| 2-Person Household | 47 (90.4%) | 5 (9.6%) |
| 3-Person Household | 47 (95.9%) | 2 (4.1%) |
| 4+ Person Household | 11 (91.7%) | 1 (8.3%) |
| Total Housing Units | 138 (85.2%) | 24 (14.8%) |
Occupancy by Educational Attainment in Ruby
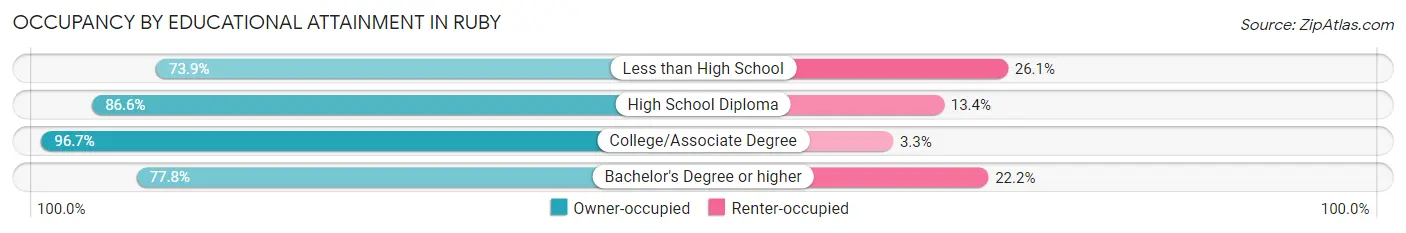
| Household Size | Owner-occupied | Renter-occupied |
| Less than High School | 17 (73.9%) | 6 (26.1%) |
| High School Diploma | 71 (86.6%) | 11 (13.4%) |
| College/Associate Degree | 29 (96.7%) | 1 (3.3%) |
| Bachelor's Degree or higher | 21 (77.8%) | 6 (22.2%) |
Occupancy by Age of Householder in Ruby
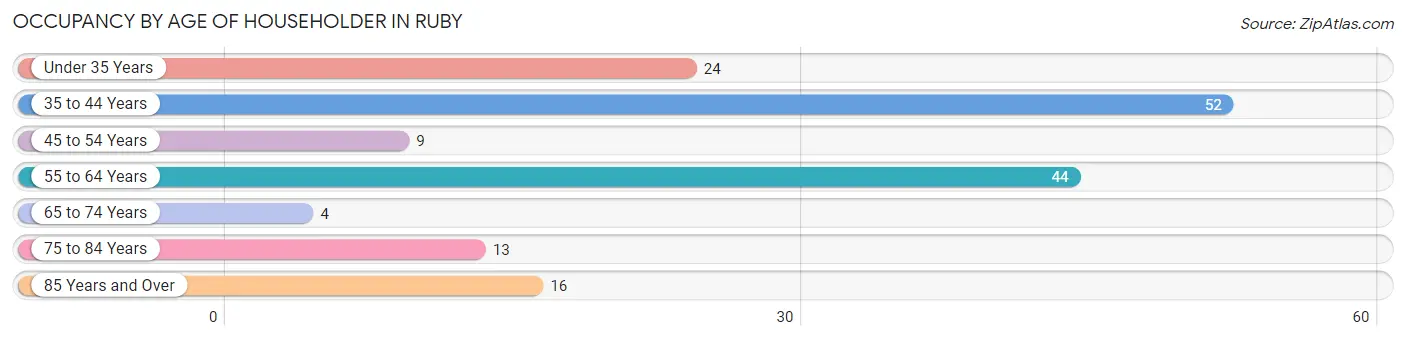
| Age Bracket | # Households | % Households |
| Under 35 Years | 24 | 14.8% |
| 35 to 44 Years | 52 | 32.1% |
| 45 to 54 Years | 9 | 5.6% |
| 55 to 64 Years | 44 | 27.2% |
| 65 to 74 Years | 4 | 2.5% |
| 75 to 84 Years | 13 | 8.0% |
| 85 Years and Over | 16 | 9.9% |
| Total | 162 | 100.0% |
Housing Finances in Ruby
Median Income by Occupancy in Ruby
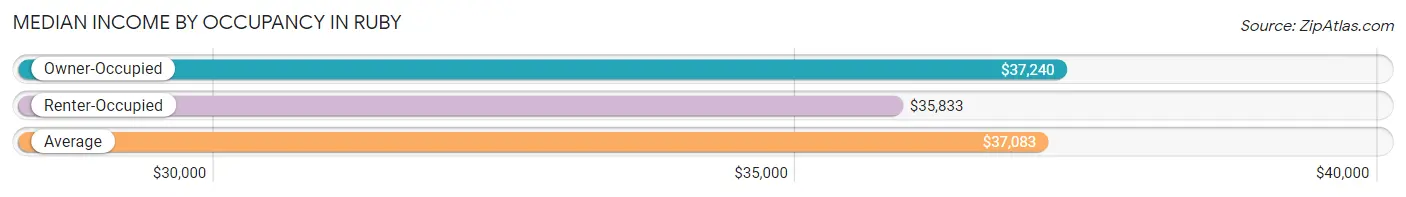
| Occupancy Type | # Households | Median Income |
| Owner-Occupied | 138 (85.2%) | $37,240 |
| Renter-Occupied | 24 (14.8%) | $35,833 |
| Average | 162 (100.0%) | $37,083 |
Occupancy by Householder Income Bracket in Ruby
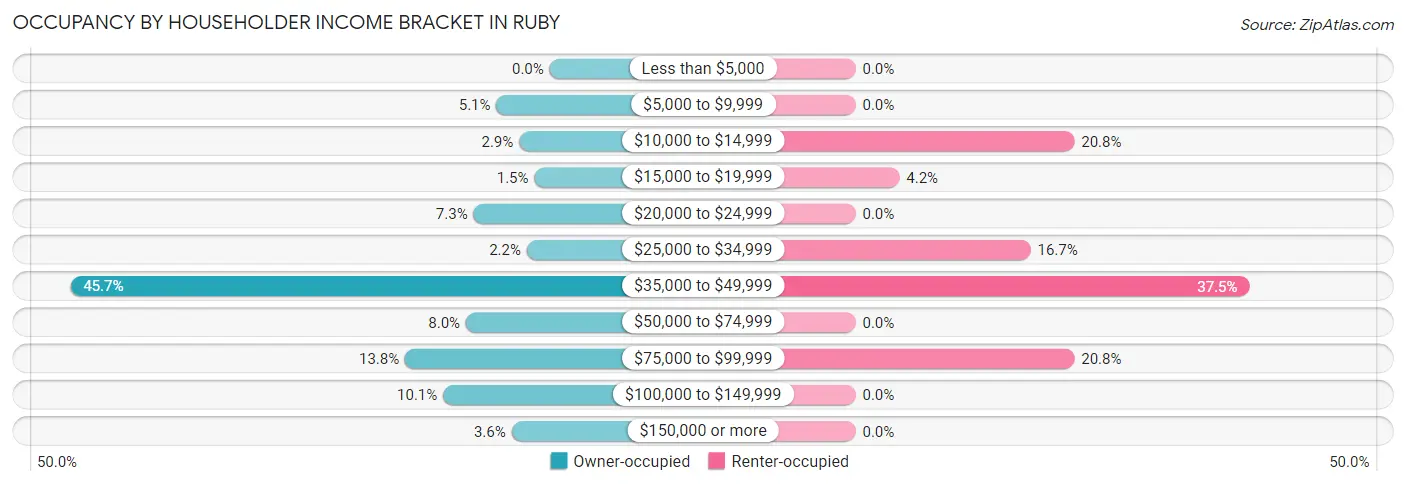
| Income Bracket | Owner-occupied | Renter-occupied |
| Less than $5,000 | 0 (0.0%) | 0 (0.0%) |
| $5,000 to $9,999 | 7 (5.1%) | 0 (0.0%) |
| $10,000 to $14,999 | 4 (2.9%) | 5 (20.8%) |
| $15,000 to $19,999 | 2 (1.5%) | 1 (4.2%) |
| $20,000 to $24,999 | 10 (7.2%) | 0 (0.0%) |
| $25,000 to $34,999 | 3 (2.2%) | 4 (16.7%) |
| $35,000 to $49,999 | 63 (45.7%) | 9 (37.5%) |
| $50,000 to $74,999 | 11 (8.0%) | 0 (0.0%) |
| $75,000 to $99,999 | 19 (13.8%) | 5 (20.8%) |
| $100,000 to $149,999 | 14 (10.1%) | 0 (0.0%) |
| $150,000 or more | 5 (3.6%) | 0 (0.0%) |
| Total | 138 (100.0%) | 24 (100.0%) |
Monthly Housing Cost Tiers in Ruby
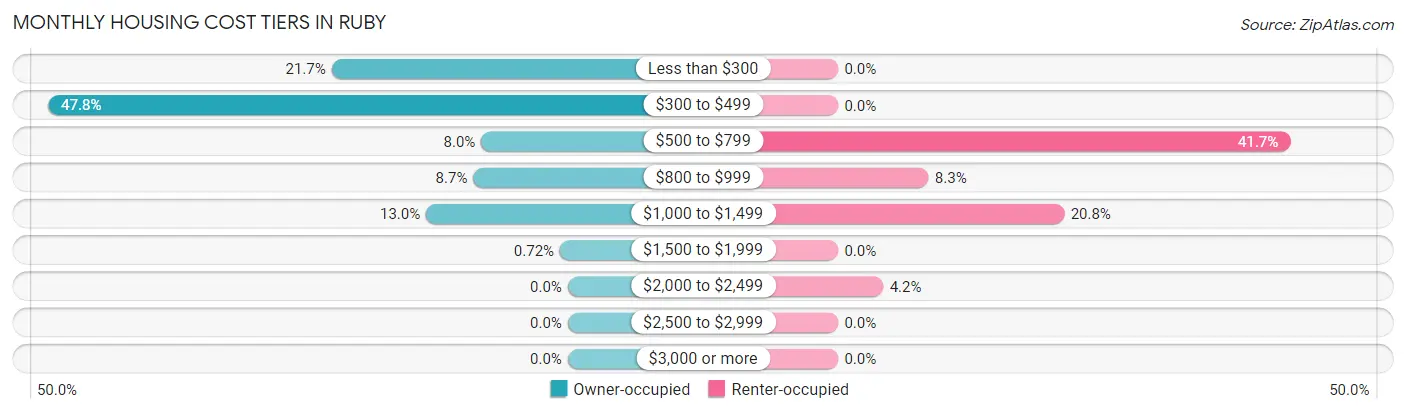
| Monthly Cost | Owner-occupied | Renter-occupied |
| Less than $300 | 30 (21.7%) | 0 (0.0%) |
| $300 to $499 | 66 (47.8%) | 0 (0.0%) |
| $500 to $799 | 11 (8.0%) | 10 (41.7%) |
| $800 to $999 | 12 (8.7%) | 2 (8.3%) |
| $1,000 to $1,499 | 18 (13.0%) | 5 (20.8%) |
| $1,500 to $1,999 | 1 (0.7%) | 0 (0.0%) |
| $2,000 to $2,499 | 0 (0.0%) | 1 (4.2%) |
| $2,500 to $2,999 | 0 (0.0%) | 0 (0.0%) |
| $3,000 or more | 0 (0.0%) | 0 (0.0%) |
| Total | 138 (100.0%) | 24 (100.0%) |
Physical Housing Characteristics in Ruby
Housing Structures in Ruby
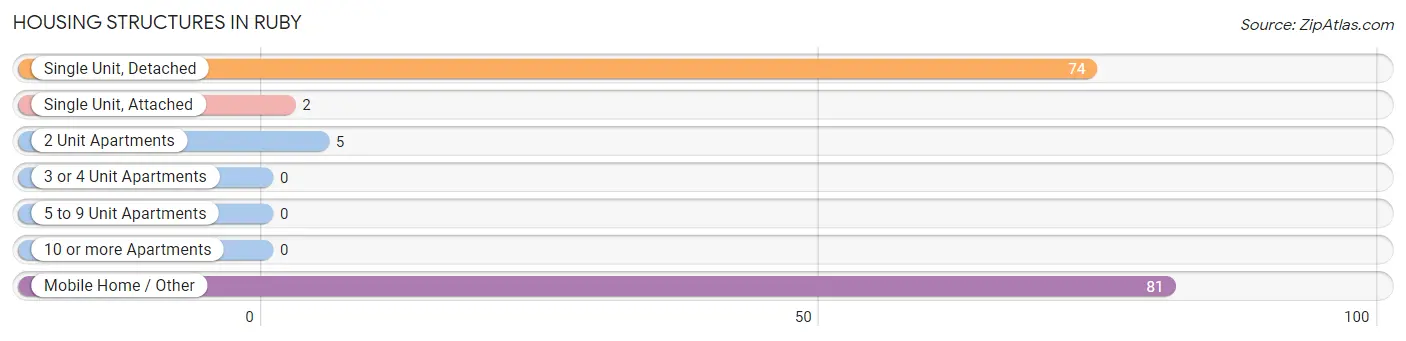
| Structure Type | # Housing Units | % Housing Units |
| Single Unit, Detached | 74 | 45.7% |
| Single Unit, Attached | 2 | 1.2% |
| 2 Unit Apartments | 5 | 3.1% |
| 3 or 4 Unit Apartments | 0 | 0.0% |
| 5 to 9 Unit Apartments | 0 | 0.0% |
| 10 or more Apartments | 0 | 0.0% |
| Mobile Home / Other | 81 | 50.0% |
| Total | 162 | 100.0% |
Housing Structures by Occupancy in Ruby
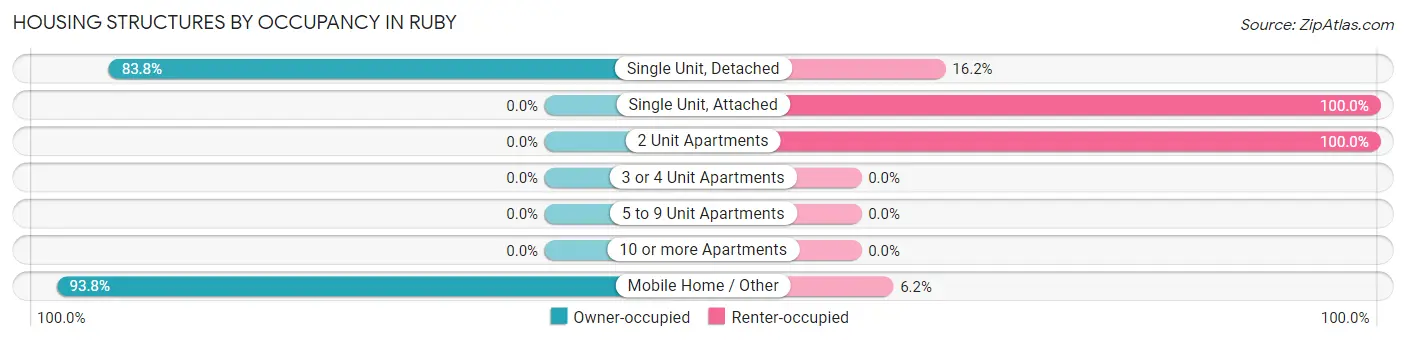
| Structure Type | Owner-occupied | Renter-occupied |
| Single Unit, Detached | 62 (83.8%) | 12 (16.2%) |
| Single Unit, Attached | 0 (0.0%) | 2 (100.0%) |
| 2 Unit Apartments | 0 (0.0%) | 5 (100.0%) |
| 3 or 4 Unit Apartments | 0 (0.0%) | 0 (0.0%) |
| 5 to 9 Unit Apartments | 0 (0.0%) | 0 (0.0%) |
| 10 or more Apartments | 0 (0.0%) | 0 (0.0%) |
| Mobile Home / Other | 76 (93.8%) | 5 (6.2%) |
| Total | 138 (85.2%) | 24 (14.8%) |
Housing Structures by Number of Rooms in Ruby
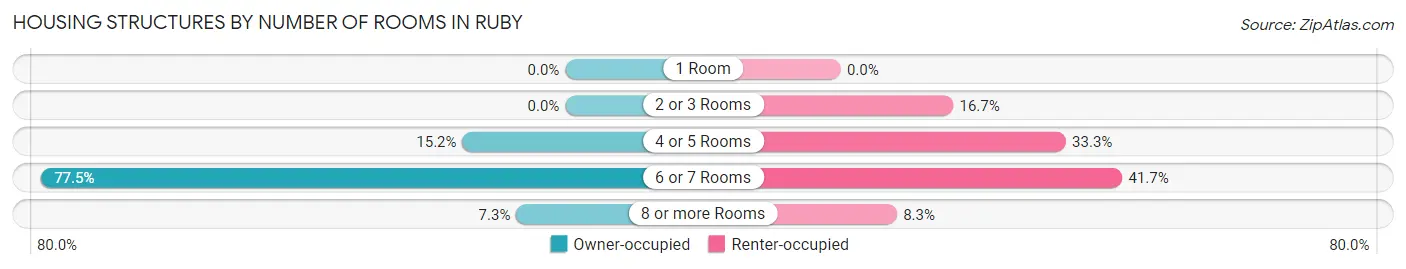
| Number of Rooms | Owner-occupied | Renter-occupied |
| 1 Room | 0 (0.0%) | 0 (0.0%) |
| 2 or 3 Rooms | 0 (0.0%) | 4 (16.7%) |
| 4 or 5 Rooms | 21 (15.2%) | 8 (33.3%) |
| 6 or 7 Rooms | 107 (77.5%) | 10 (41.7%) |
| 8 or more Rooms | 10 (7.2%) | 2 (8.3%) |
| Total | 138 (100.0%) | 24 (100.0%) |
Housing Structure by Heating Type in Ruby
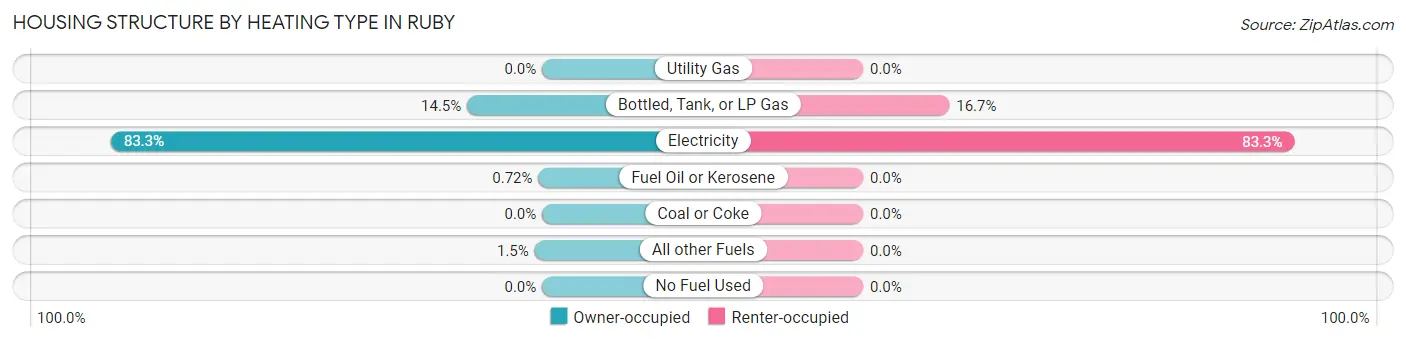
| Heating Type | Owner-occupied | Renter-occupied |
| Utility Gas | 0 (0.0%) | 0 (0.0%) |
| Bottled, Tank, or LP Gas | 20 (14.5%) | 4 (16.7%) |
| Electricity | 115 (83.3%) | 20 (83.3%) |
| Fuel Oil or Kerosene | 1 (0.7%) | 0 (0.0%) |
| Coal or Coke | 0 (0.0%) | 0 (0.0%) |
| All other Fuels | 2 (1.5%) | 0 (0.0%) |
| No Fuel Used | 0 (0.0%) | 0 (0.0%) |
| Total | 138 (100.0%) | 24 (100.0%) |
Household Vehicle Usage in Ruby
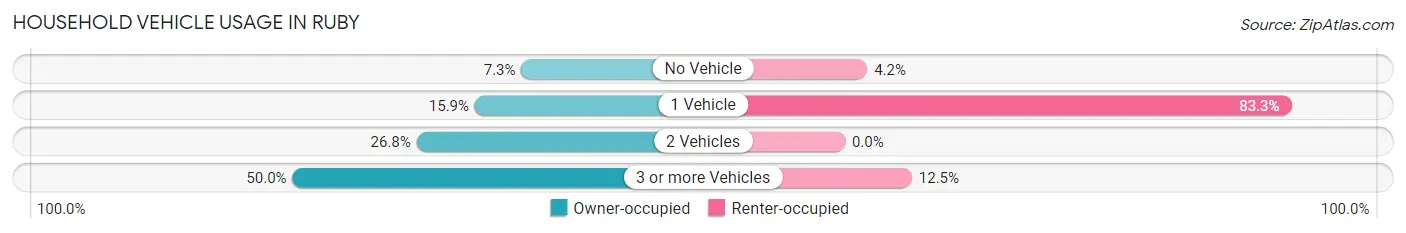
| Vehicles per Household | Owner-occupied | Renter-occupied |
| No Vehicle | 10 (7.2%) | 1 (4.2%) |
| 1 Vehicle | 22 (15.9%) | 20 (83.3%) |
| 2 Vehicles | 37 (26.8%) | 0 (0.0%) |
| 3 or more Vehicles | 69 (50.0%) | 3 (12.5%) |
| Total | 138 (100.0%) | 24 (100.0%) |
Real Estate & Mortgages in Ruby
Real Estate and Mortgage Overview in Ruby
| Characteristic | Without Mortgage | With Mortgage |
| Housing Units | 93 | 45 |
| Median Property Value | $136,300 | $97,400 |
| Median Household Income | $36,641 | $0 |
| Monthly Housing Costs | $421 | $0 |
| Real Estate Taxes | $676 | $2 |
Property Value by Mortgage Status in Ruby
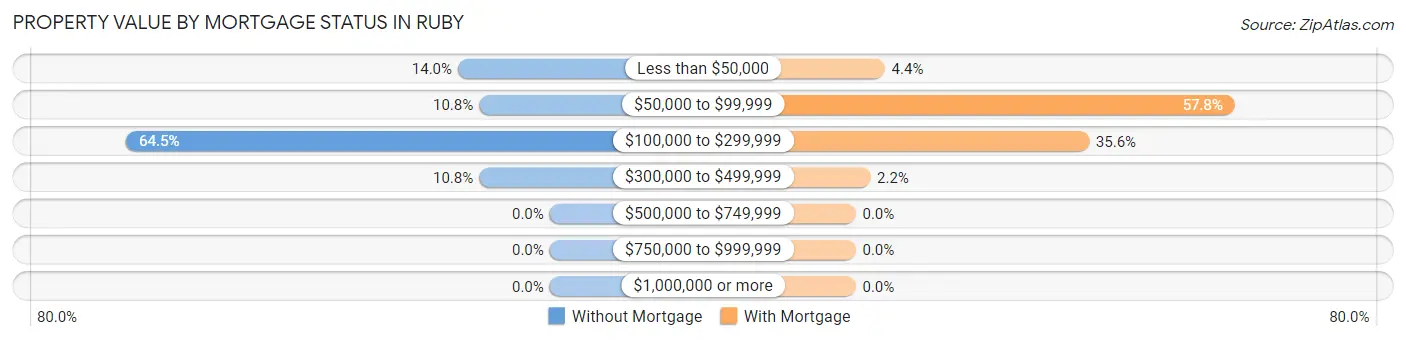
| Property Value | Without Mortgage | With Mortgage |
| Less than $50,000 | 13 (14.0%) | 2 (4.4%) |
| $50,000 to $99,999 | 10 (10.7%) | 26 (57.8%) |
| $100,000 to $299,999 | 60 (64.5%) | 16 (35.6%) |
| $300,000 to $499,999 | 10 (10.7%) | 1 (2.2%) |
| $500,000 to $749,999 | 0 (0.0%) | 0 (0.0%) |
| $750,000 to $999,999 | 0 (0.0%) | 0 (0.0%) |
| $1,000,000 or more | 0 (0.0%) | 0 (0.0%) |
| Total | 93 (100.0%) | 45 (100.0%) |
Household Income by Mortgage Status in Ruby
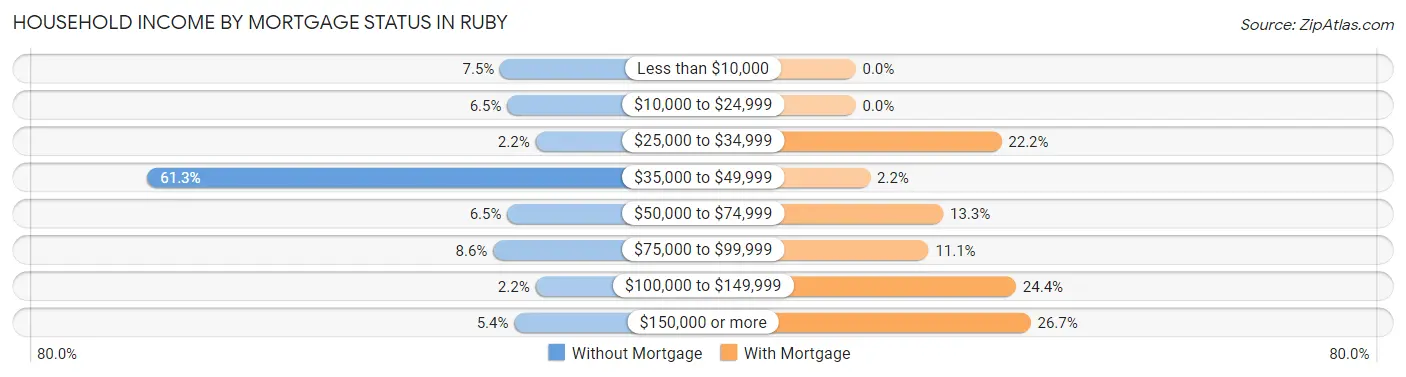
| Household Income | Without Mortgage | With Mortgage |
| Less than $10,000 | 7 (7.5%) | 0 (0.0%) |
| $10,000 to $24,999 | 6 (6.5%) | 0 (0.0%) |
| $25,000 to $34,999 | 2 (2.1%) | 10 (22.2%) |
| $35,000 to $49,999 | 57 (61.3%) | 1 (2.2%) |
| $50,000 to $74,999 | 6 (6.5%) | 6 (13.3%) |
| $75,000 to $99,999 | 8 (8.6%) | 5 (11.1%) |
| $100,000 to $149,999 | 2 (2.1%) | 11 (24.4%) |
| $150,000 or more | 5 (5.4%) | 12 (26.7%) |
| Total | 93 (100.0%) | 45 (100.0%) |
Property Value to Household Income Ratio in Ruby
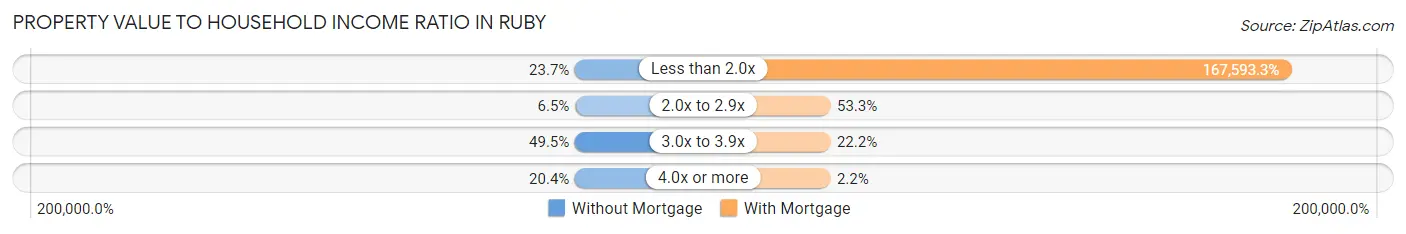
| Value-to-Income Ratio | Without Mortgage | With Mortgage |
| Less than 2.0x | 22 (23.7%) | 75,417 (167,593.3%) |
| 2.0x to 2.9x | 6 (6.5%) | 24 (53.3%) |
| 3.0x to 3.9x | 46 (49.5%) | 10 (22.2%) |
| 4.0x or more | 19 (20.4%) | 1 (2.2%) |
| Total | 93 (100.0%) | 45 (100.0%) |
Real Estate Taxes by Mortgage Status in Ruby
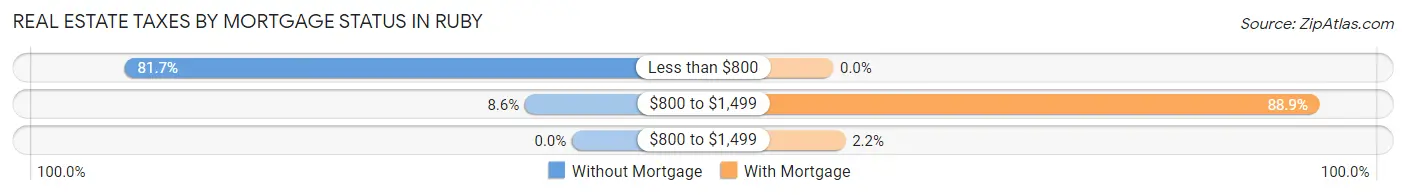
| Property Taxes | Without Mortgage | With Mortgage |
| Less than $800 | 76 (81.7%) | 0 (0.0%) |
| $800 to $1,499 | 8 (8.6%) | 40 (88.9%) |
| $800 to $1,499 | 0 (0.0%) | 1 (2.2%) |
| Total | 93 (100.0%) | 45 (100.0%) |
Health & Disability in Ruby
Health Insurance Coverage by Age in Ruby
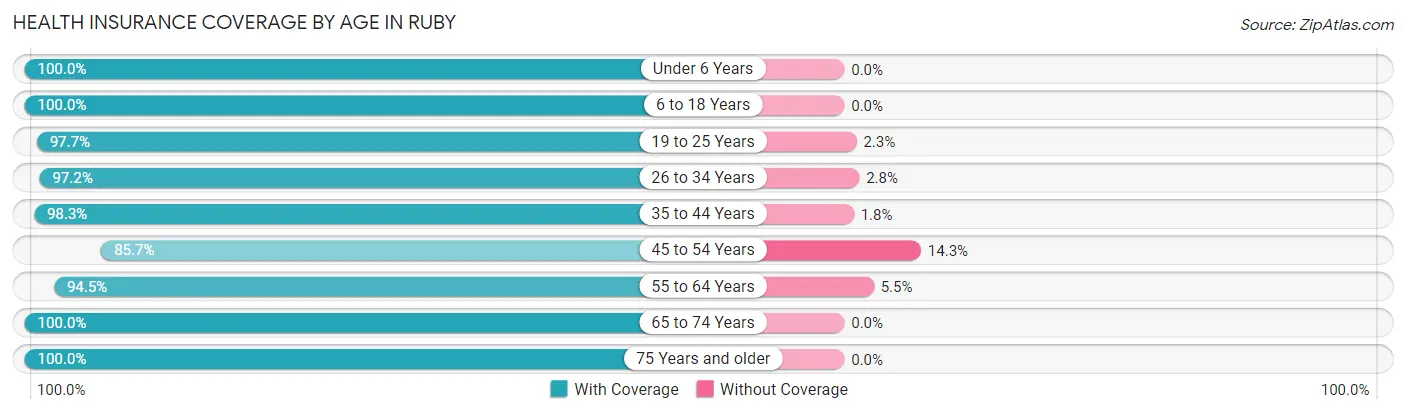
| Age Bracket | With Coverage | Without Coverage |
| Under 6 Years | 70 (100.0%) | 0 (0.0%) |
| 6 to 18 Years | 26 (100.0%) | 0 (0.0%) |
| 19 to 25 Years | 43 (97.7%) | 1 (2.3%) |
| 26 to 34 Years | 35 (97.2%) | 1 (2.8%) |
| 35 to 44 Years | 56 (98.3%) | 1 (1.8%) |
| 45 to 54 Years | 12 (85.7%) | 2 (14.3%) |
| 55 to 64 Years | 69 (94.5%) | 4 (5.5%) |
| 65 to 74 Years | 6 (100.0%) | 0 (0.0%) |
| 75 Years and older | 33 (100.0%) | 0 (0.0%) |
| Total | 350 (97.5%) | 9 (2.5%) |
Health Insurance Coverage by Citizenship Status in Ruby
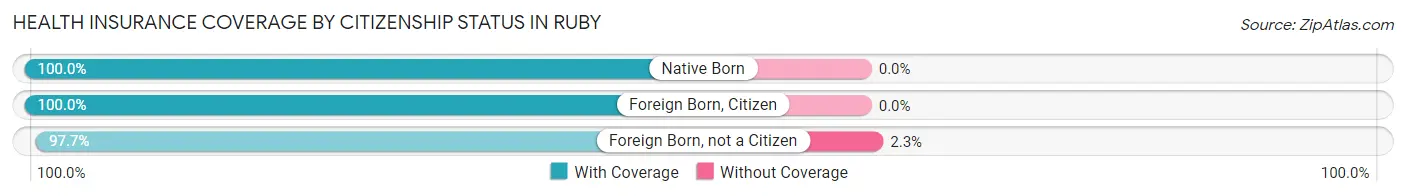
| Citizenship Status | With Coverage | Without Coverage |
| Native Born | 70 (100.0%) | 0 (0.0%) |
| Foreign Born, Citizen | 26 (100.0%) | 0 (0.0%) |
| Foreign Born, not a Citizen | 43 (97.7%) | 1 (2.3%) |
Health Insurance Coverage by Household Income in Ruby
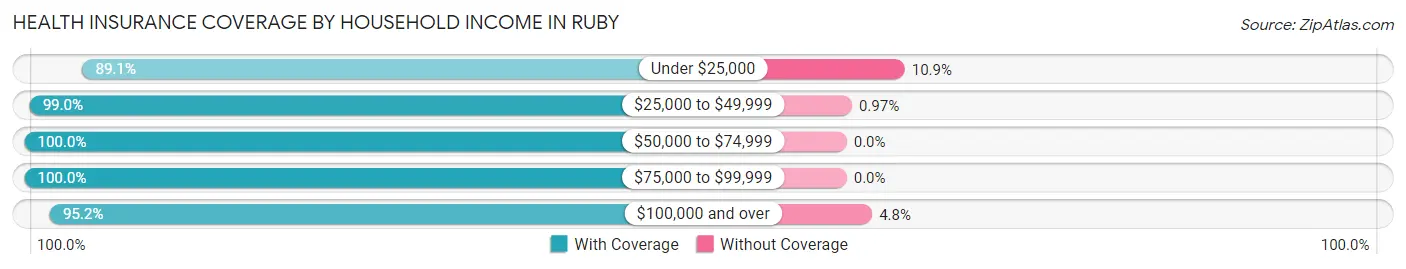
| Household Income | With Coverage | Without Coverage |
| Under $25,000 | 41 (89.1%) | 5 (10.9%) |
| $25,000 to $49,999 | 204 (99.0%) | 2 (1.0%) |
| $50,000 to $74,999 | 20 (100.0%) | 0 (0.0%) |
| $75,000 to $99,999 | 45 (100.0%) | 0 (0.0%) |
| $100,000 and over | 40 (95.2%) | 2 (4.8%) |
Public vs Private Health Insurance Coverage by Age in Ruby
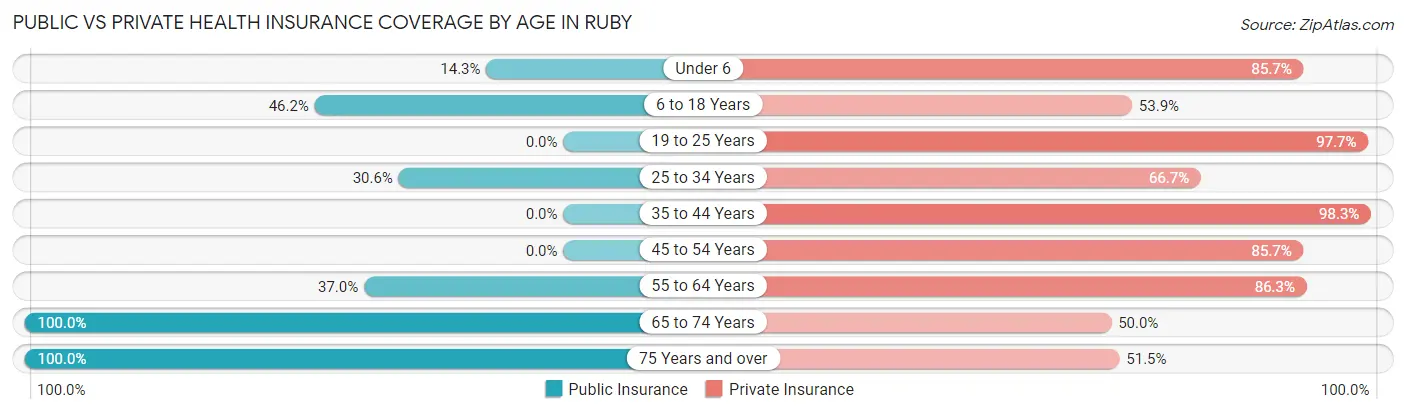
| Age Bracket | Public Insurance | Private Insurance |
| Under 6 | 10 (14.3%) | 60 (85.7%) |
| 6 to 18 Years | 12 (46.2%) | 14 (53.8%) |
| 19 to 25 Years | 0 (0.0%) | 43 (97.7%) |
| 25 to 34 Years | 11 (30.6%) | 24 (66.7%) |
| 35 to 44 Years | 0 (0.0%) | 56 (98.3%) |
| 45 to 54 Years | 0 (0.0%) | 12 (85.7%) |
| 55 to 64 Years | 27 (37.0%) | 63 (86.3%) |
| 65 to 74 Years | 6 (100.0%) | 3 (50.0%) |
| 75 Years and over | 33 (100.0%) | 17 (51.5%) |
| Total | 99 (27.6%) | 292 (81.3%) |
Disability Status by Sex by Age in Ruby
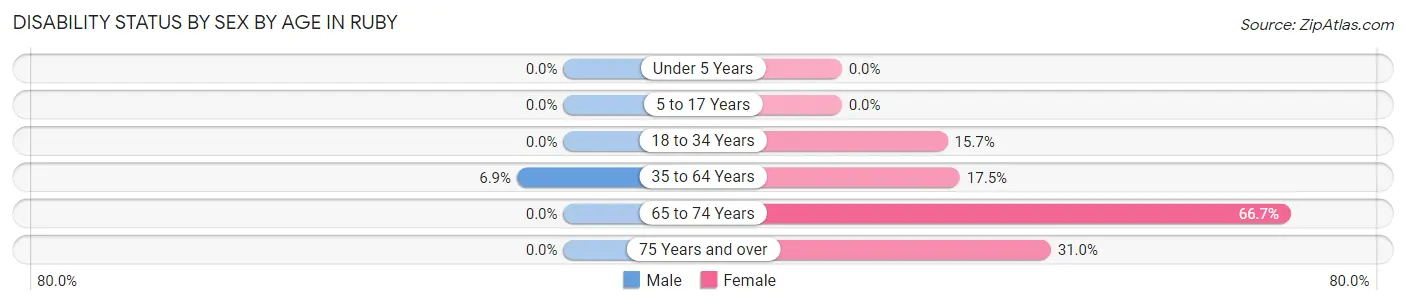
| Age Bracket | Male | Female |
| Under 5 Years | 0 (0.0%) | 0 (0.0%) |
| 5 to 17 Years | 0 (0.0%) | 0 (0.0%) |
| 18 to 34 Years | 0 (0.0%) | 11 (15.7%) |
| 35 to 64 Years | 6 (6.9%) | 10 (17.5%) |
| 65 to 74 Years | 0 (0.0%) | 2 (66.7%) |
| 75 Years and over | 0 (0.0%) | 9 (31.0%) |
Disability Class by Sex by Age in Ruby
Disability Class: Hearing Difficulty
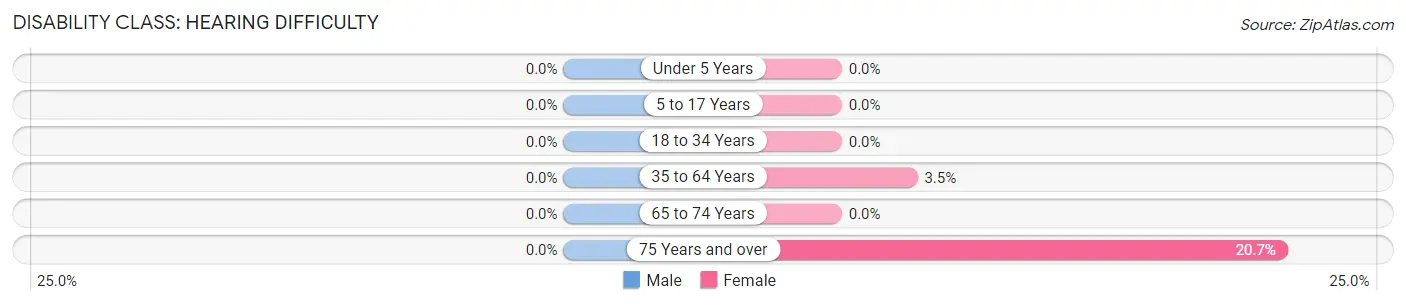
| Age Bracket | Male | Female |
| Under 5 Years | 0 (0.0%) | 0 (0.0%) |
| 5 to 17 Years | 0 (0.0%) | 0 (0.0%) |
| 18 to 34 Years | 0 (0.0%) | 0 (0.0%) |
| 35 to 64 Years | 0 (0.0%) | 2 (3.5%) |
| 65 to 74 Years | 0 (0.0%) | 0 (0.0%) |
| 75 Years and over | 0 (0.0%) | 6 (20.7%) |
Disability Class: Vision Difficulty
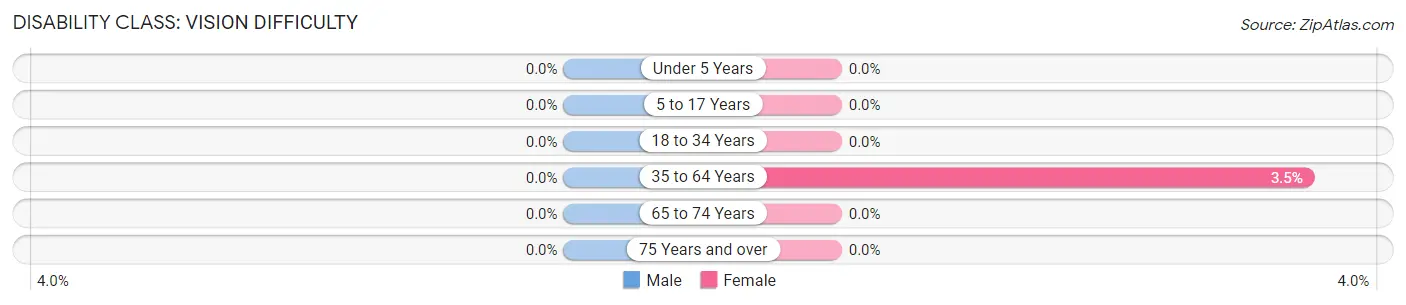
| Age Bracket | Male | Female |
| Under 5 Years | 0 (0.0%) | 0 (0.0%) |
| 5 to 17 Years | 0 (0.0%) | 0 (0.0%) |
| 18 to 34 Years | 0 (0.0%) | 0 (0.0%) |
| 35 to 64 Years | 0 (0.0%) | 2 (3.5%) |
| 65 to 74 Years | 0 (0.0%) | 0 (0.0%) |
| 75 Years and over | 0 (0.0%) | 0 (0.0%) |
Disability Class: Cognitive Difficulty
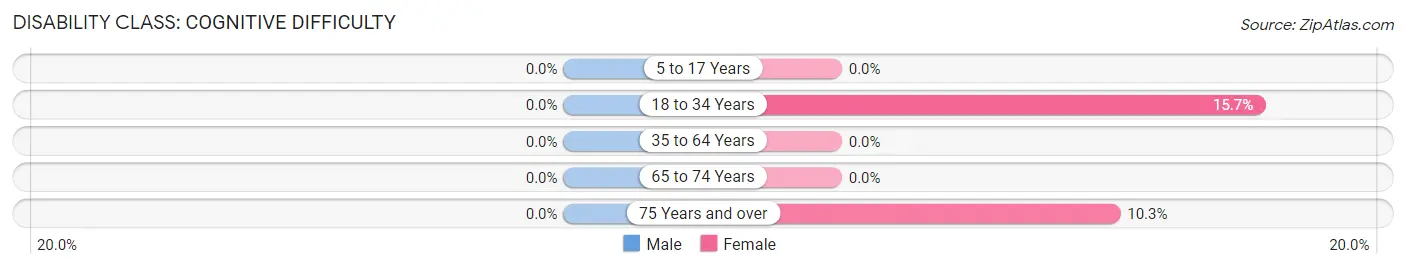
| Age Bracket | Male | Female |
| 5 to 17 Years | 0 (0.0%) | 0 (0.0%) |
| 18 to 34 Years | 0 (0.0%) | 11 (15.7%) |
| 35 to 64 Years | 0 (0.0%) | 0 (0.0%) |
| 65 to 74 Years | 0 (0.0%) | 0 (0.0%) |
| 75 Years and over | 0 (0.0%) | 3 (10.3%) |
Disability Class: Ambulatory Difficulty
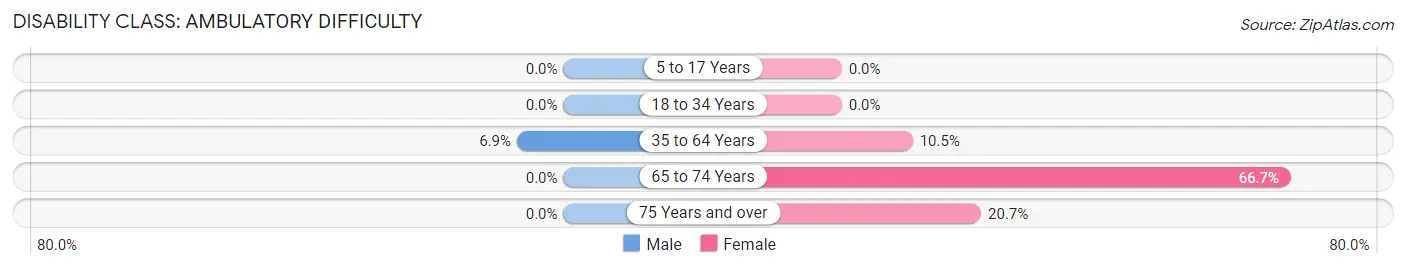
| Age Bracket | Male | Female |
| 5 to 17 Years | 0 (0.0%) | 0 (0.0%) |
| 18 to 34 Years | 0 (0.0%) | 0 (0.0%) |
| 35 to 64 Years | 6 (6.9%) | 6 (10.5%) |
| 65 to 74 Years | 0 (0.0%) | 2 (66.7%) |
| 75 Years and over | 0 (0.0%) | 6 (20.7%) |
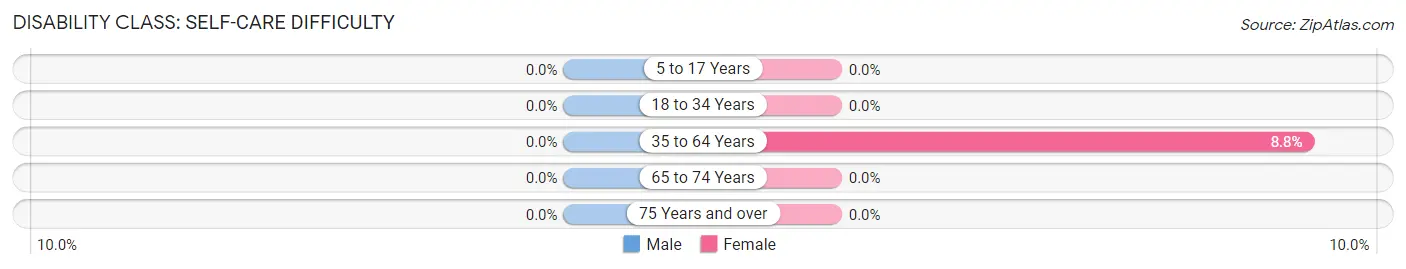
Disability Class: Self-Care Difficulty
| Age Bracket | Male | Female |
| 5 to 17 Years | 0 (0.0%) | 0 (0.0%) |
| 18 to 34 Years | 0 (0.0%) | 0 (0.0%) |
| 35 to 64 Years | 0 (0.0%) | 5 (8.8%) |
| 65 to 74 Years | 0 (0.0%) | 0 (0.0%) |
| 75 Years and over | 0 (0.0%) | 0 (0.0%) |
Technology Access in Ruby
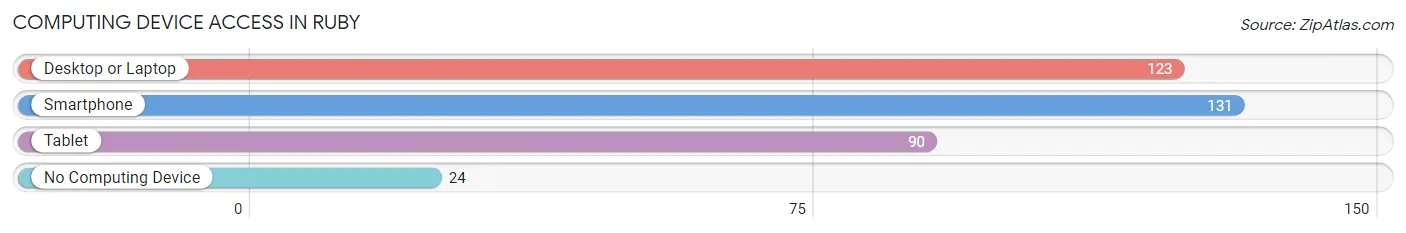
Computing Device Access in Ruby
| Device Type | # Households | % Households |
| Desktop or Laptop | 123 | 75.9% |
| Smartphone | 131 | 80.9% |
| Tablet | 90 | 55.6% |
| No Computing Device | 24 | 14.8% |
| Total | 162 | 100.0% |
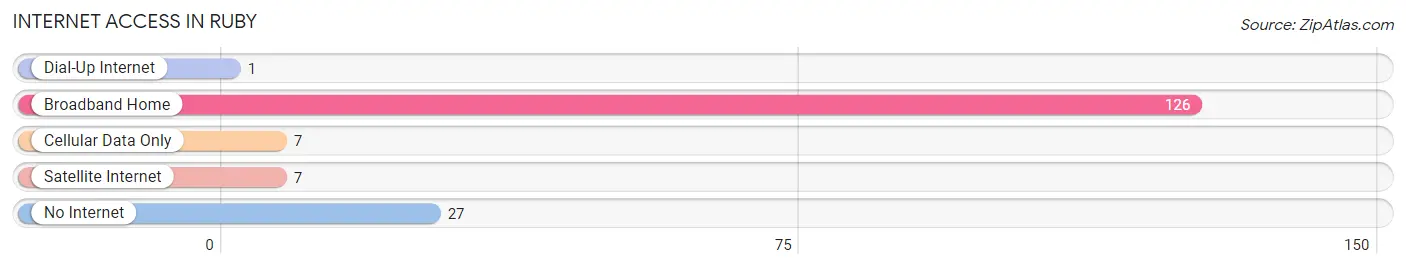
Internet Access in Ruby
| Internet Type | # Households | % Households |
| Dial-Up Internet | 1 | 0.6% |
| Broadband Home | 126 | 77.8% |
| Cellular Data Only | 7 | 4.3% |
| Satellite Internet | 7 | 4.3% |
| No Internet | 27 | 16.7% |
| Total | 162 | 100.0% |
Ruby Summary
Ruby, South Carolina is a small town located in the Midlands region of the state. It is situated in the northern part of Sumter County, approximately 20 miles from the county seat of Sumter. The town was founded in 1891 and is named after the nearby Ruby Creek. As of the 2010 census, the population of Ruby was 1,072.
History
The area that is now Ruby was originally inhabited by the Catawba Indians. The first European settlers arrived in the area in the late 1700s. The town of Ruby was founded in 1891 and was named after the nearby Ruby Creek. The town was incorporated in 1895.
In the early 1900s, Ruby was a thriving agricultural community. Cotton was the main crop grown in the area, and the town was home to several cotton gins. The town also had a sawmill, a grist mill, and a general store.
In the 1920s, the town began to decline as the cotton industry declined. The Great Depression further exacerbated the town’s economic woes. In the 1940s, the town began to experience a resurgence as the economy began to improve.
Geography
Ruby is located in the northern part of Sumter County, approximately 20 miles from the county seat of Sumter. The town is situated in the Midlands region of the state. The town is located at an elevation of approximately 200 feet above sea level.
The town is situated on the banks of Ruby Creek, which is a tributary of the Black River. The town is surrounded by a mix of farmland and woodlands. The nearest major city is Columbia, which is approximately 40 miles away.
Economy
The economy of Ruby is largely based on agriculture. Cotton is still grown in the area, although it is not as prominent as it once was. The town is also home to several small businesses, including a grocery store, a hardware store, and a gas station.
The town is also home to several manufacturing companies, including a furniture manufacturer and a plastics manufacturer. The town is also home to a number of small service-based businesses, such as auto repair shops and restaurants.
Demographics
As of the 2010 census, the population of Ruby was 1,072. The racial makeup of the town was 79.2% White, 17.3% African American, 0.7% Native American, 0.3% Asian, 0.1% Pacific Islander, and 2.4% from other races.
The median household income in Ruby was $30,938, and the median family income was $37,500. The per capita income in the town was $15,945. Approximately 17.3% of the population was below the poverty line.
Conclusion
Ruby, South Carolina is a small town located in the Midlands region of the state. It is situated in the northern part of Sumter County, approximately 20 miles from the county seat of Sumter. The town was founded in 1891 and is named after the nearby Ruby Creek. As of the 2010 census, the population of Ruby was 1,072. The economy of Ruby is largely based on agriculture, although the town is also home to several small businesses and manufacturing companies. The racial makeup of the town was 79.2% White, 17.3% African American, 0.7% Native American, 0.3% Asian, 0.1% Pacific Islander, and 2.4% from other races. The median household income in Ruby was $30,938, and the median family income was $37,500. Approximately 17.3% of the population was below the poverty line.
Common Questions
What is Per Capita Income in Ruby?
Per Capita income in Ruby is $24,577.
What is the Median Family Income in Ruby?
Median Family Income in Ruby is $36,641.
What is the Median Household income in Ruby?
Median Household Income in Ruby is $37,083.
What is Income or Wage Gap in Ruby?
Income or Wage Gap in Ruby is 1.1%.
Women in Ruby earn 98.9 cents for every dollar earned by a man.
What is Inequality or Gini Index in Ruby?
Inequality or Gini Index in Ruby is 0.37.
What is the Total Population of Ruby?
Total Population of Ruby is 359.
What is the Total Male Population of Ruby?
Total Male Population of Ruby is 138.
What is the Total Female Population of Ruby?
Total Female Population of Ruby is 221.
What is the Ratio of Males per 100 Females in Ruby?
There are 62.44 Males per 100 Females in Ruby.
What is the Ratio of Females per 100 Males in Ruby?
There are 160.14 Females per 100 Males in Ruby.
What is the Median Population Age in Ruby?
Median Population Age in Ruby is 37.5 Years.
What is the Average Family Size in Ruby
Average Family Size in Ruby is 2.8 People.
What is the Average Household Size in Ruby
Average Household Size in Ruby is 2.2 People.
How Large is the Labor Force in Ruby?
There are 135 People in the Labor Forcein in Ruby.
What is the Percentage of People in the Labor Force in Ruby?
50.8% of People are in the Labor Force in Ruby.
What is the Unemployment Rate in Ruby?
Unemployment Rate in Ruby is 0.7%.