Elgin, SC Map & Demographics
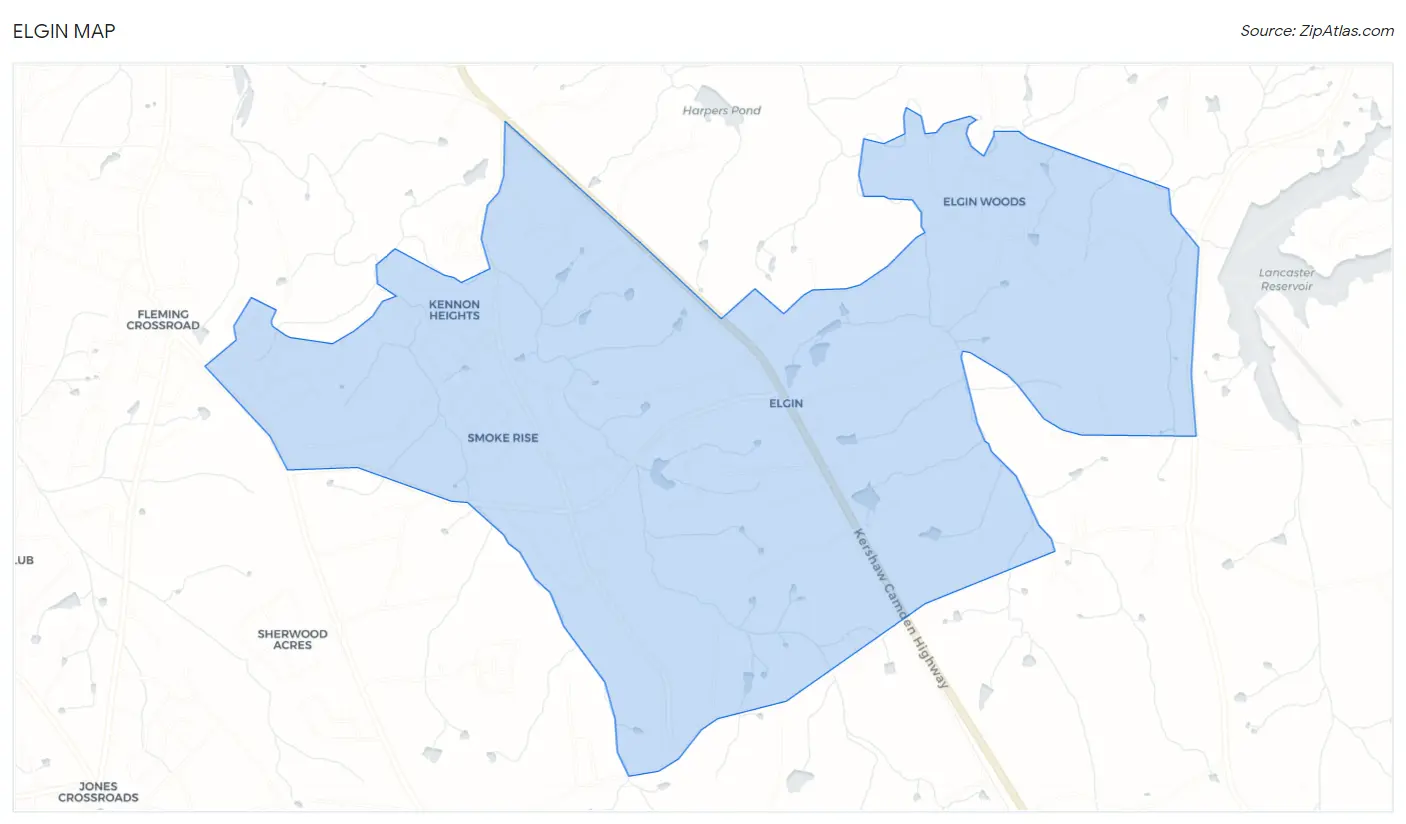
Elgin Map
Elgin Overview
$31,484
PER CAPITA INCOME
$63,750
AVG FAMILY INCOME
$72,898
AVG HOUSEHOLD INCOME
24.2%
WAGE / INCOME GAP [ % ]
75.8¢/ $1
WAGE / INCOME GAP [ $ ]
$8,140
FAMILY INCOME DEFICIT
0.32
INEQUALITY / GINI INDEX
2,882
TOTAL POPULATION
1,487
MALE POPULATION
1,395
FEMALE POPULATION
106.59
MALES / 100 FEMALES
93.81
FEMALES / 100 MALES
47.9
MEDIAN AGE
2.9
AVG FAMILY SIZE
2.8
AVG HOUSEHOLD SIZE
1,498
LABOR FORCE [ PEOPLE ]
56.6%
PERCENT IN LABOR FORCE
2.4%
UNEMPLOYMENT RATE
Elgin Zip Codes
Elgin Area Codes
Income in Elgin
Income Overview in Elgin
Per Capita Income in Elgin is $31,484, while median incomes of families and households are $63,750 and $72,898 respectively.
| Characteristic | Number | Measure |
| Per Capita Income | 2,882 | $31,484 |
| Median Family Income | 900 | $63,750 |
| Mean Family Income | 900 | $81,500 |
| Median Household Income | 1,048 | $72,898 |
| Mean Household Income | 1,048 | $81,958 |
| Income Deficit | 900 | $8,140 |
| Wage / Income Gap (%) | 2,882 | 24.20% |
| Wage / Income Gap ($) | 2,882 | 75.80¢ per $1 |
| Gini / Inequality Index | 2,882 | 0.32 |
Earnings by Sex in Elgin
Average Earnings in Elgin are $34,421, $41,633 for men and $31,558 for women, a difference of 24.2%.
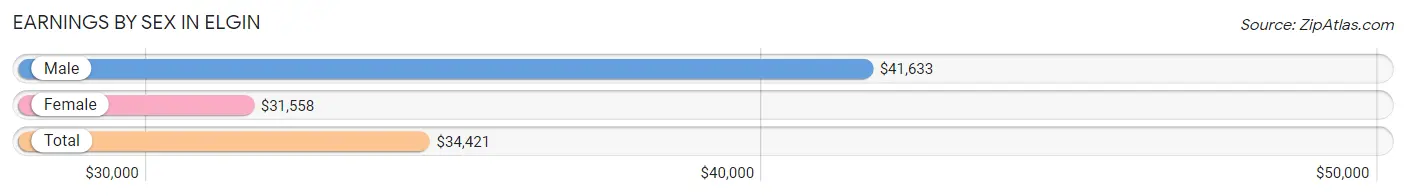
| Sex | Number | Average Earnings |
| Male | 869 (58.1%) | $41,633 |
| Female | 627 (41.9%) | $31,558 |
| Total | 1,496 (100.0%) | $34,421 |
Earnings by Sex by Income Bracket in Elgin
The most common earnings brackets in Elgin are $55,000 to $64,999 for men (160 | 18.4%) and $65,000 to $74,999 for women (159 | 25.4%).
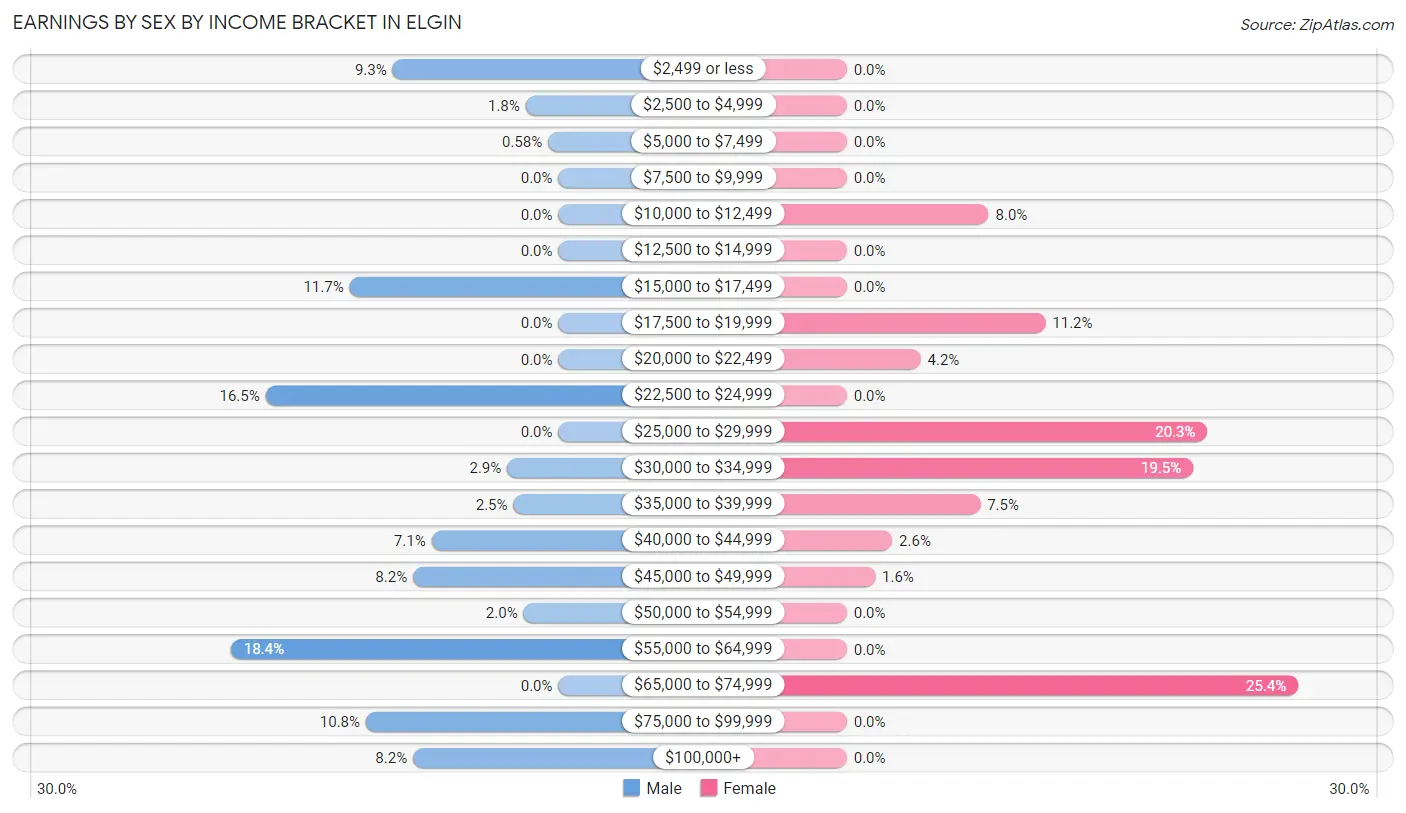
| Income | Male | Female |
| $2,499 or less | 81 (9.3%) | 0 (0.0%) |
| $2,500 to $4,999 | 16 (1.8%) | 0 (0.0%) |
| $5,000 to $7,499 | 5 (0.6%) | 0 (0.0%) |
| $7,500 to $9,999 | 0 (0.0%) | 0 (0.0%) |
| $10,000 to $12,499 | 0 (0.0%) | 50 (8.0%) |
| $12,500 to $14,999 | 0 (0.0%) | 0 (0.0%) |
| $15,000 to $17,499 | 102 (11.7%) | 0 (0.0%) |
| $17,500 to $19,999 | 0 (0.0%) | 70 (11.2%) |
| $20,000 to $22,499 | 0 (0.0%) | 26 (4.2%) |
| $22,500 to $24,999 | 143 (16.5%) | 0 (0.0%) |
| $25,000 to $29,999 | 0 (0.0%) | 127 (20.3%) |
| $30,000 to $34,999 | 25 (2.9%) | 122 (19.5%) |
| $35,000 to $39,999 | 22 (2.5%) | 47 (7.5%) |
| $40,000 to $44,999 | 62 (7.1%) | 16 (2.5%) |
| $45,000 to $49,999 | 71 (8.2%) | 10 (1.6%) |
| $50,000 to $54,999 | 17 (2.0%) | 0 (0.0%) |
| $55,000 to $64,999 | 160 (18.4%) | 0 (0.0%) |
| $65,000 to $74,999 | 0 (0.0%) | 159 (25.4%) |
| $75,000 to $99,999 | 94 (10.8%) | 0 (0.0%) |
| $100,000+ | 71 (8.2%) | 0 (0.0%) |
| Total | 869 (100.0%) | 627 (100.0%) |
Earnings by Sex by Educational Attainment in Elgin
Average earnings in Elgin are $45,705 for men and $34,101 for women, a difference of 25.4%. Men with an educational attainment of high school diploma enjoy the highest average annual earnings of $56,133, while those with college or associate's degree education earn the least with $45,855. Women with an educational attainment of college or associate's degree earn the most with the average annual earnings of $31,692, while those with college or associate's degree education have the smallest earnings of $31,692.
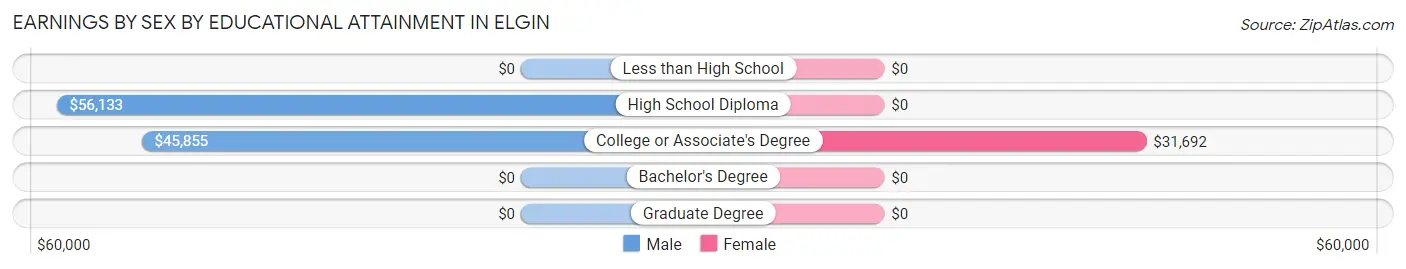
| Educational Attainment | Male Income | Female Income |
| Less than High School | - | - |
| High School Diploma | $56,133 | $0 |
| College or Associate's Degree | $45,855 | $31,692 |
| Bachelor's Degree | - | - |
| Graduate Degree | - | - |
| Total | $45,705 | $34,101 |
Family Income in Elgin
Family Income Brackets in Elgin
According to the Elgin family income data, there are 307 families falling into the $50,000 to $74,999 income range, which is the most common income bracket and makes up 34.1% of all families.
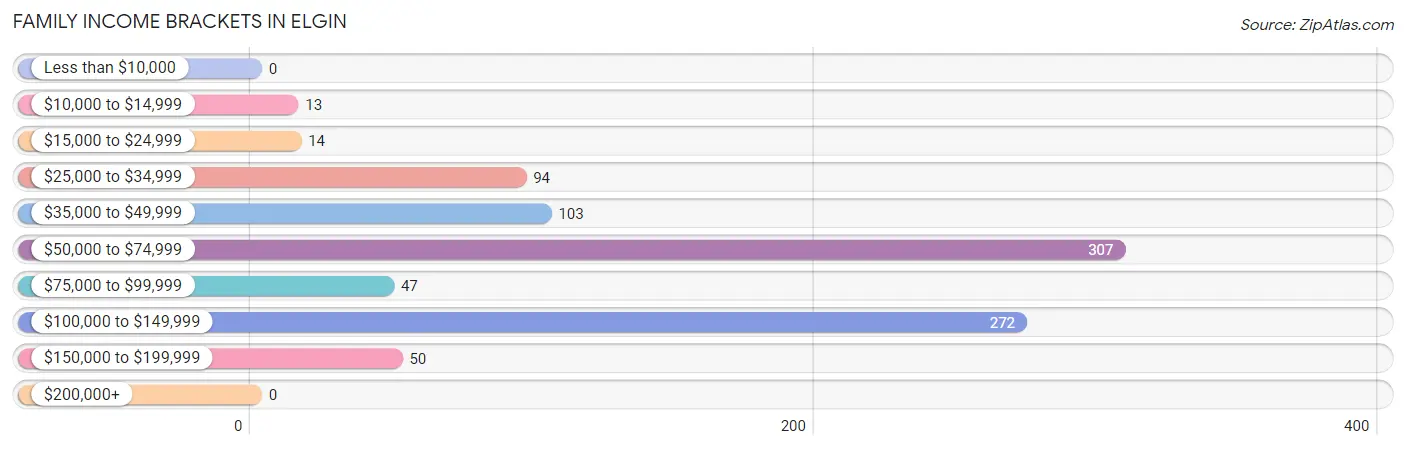
| Income Bracket | # Families | % Families |
| Less than $10,000 | 0 | 0.0% |
| $10,000 to $14,999 | 13 | 1.4% |
| $15,000 to $24,999 | 14 | 1.6% |
| $25,000 to $34,999 | 94 | 10.4% |
| $35,000 to $49,999 | 103 | 11.4% |
| $50,000 to $74,999 | 307 | 34.1% |
| $75,000 to $99,999 | 47 | 5.2% |
| $100,000 to $149,999 | 272 | 30.2% |
| $150,000 to $199,999 | 50 | 5.6% |
| $200,000+ | 0 | 0.0% |
Family Income by Famaliy Size in Elgin
3-person families (219 | 24.3%) account for the highest median family income in Elgin with $114,622 per family, while 3-person families (219 | 24.3%) have the highest median income of $38,207 per family member.
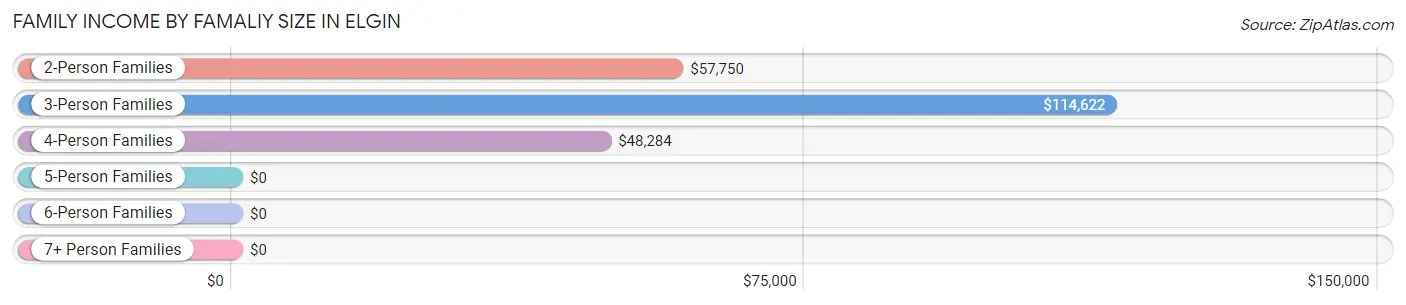
| Income Bracket | # Families | Median Income |
| 2-Person Families | 492 (54.7%) | $57,750 |
| 3-Person Families | 219 (24.3%) | $114,622 |
| 4-Person Families | 124 (13.8%) | $48,284 |
| 5-Person Families | 51 (5.7%) | $0 |
| 6-Person Families | 14 (1.6%) | $0 |
| 7+ Person Families | 0 (0.0%) | $0 |
| Total | 900 (100.0%) | $63,750 |
Family Income by Number of Earners in Elgin
The median family income in Elgin is $63,750, with families comprising 2 earners (302) having the highest median family income of $120,859, while families with no earners (245) have the lowest median family income of $51,424, accounting for 33.6% and 27.2% of families, respectively.
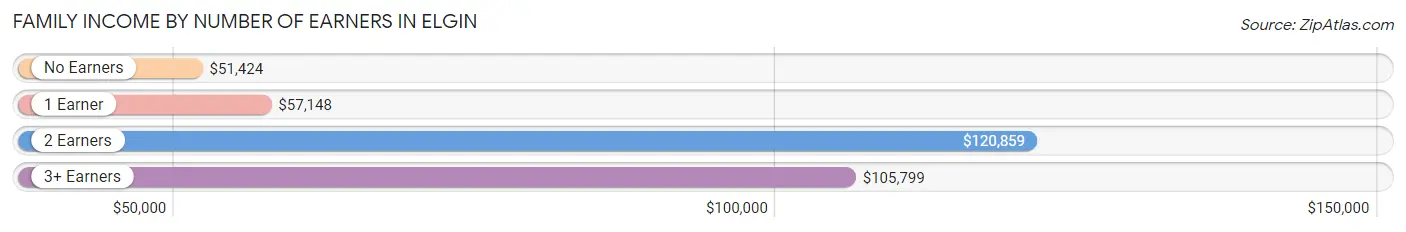
| Number of Earners | # Families | Median Income |
| No Earners | 245 (27.2%) | $51,424 |
| 1 Earner | 196 (21.8%) | $57,148 |
| 2 Earners | 302 (33.6%) | $120,859 |
| 3+ Earners | 157 (17.4%) | $105,799 |
| Total | 900 (100.0%) | $63,750 |
Household Income in Elgin
Household Income Brackets in Elgin
With 314 households falling in the category, the $100,000 to $149,999 income range is the most frequent in Elgin, accounting for 30.0% of all households.
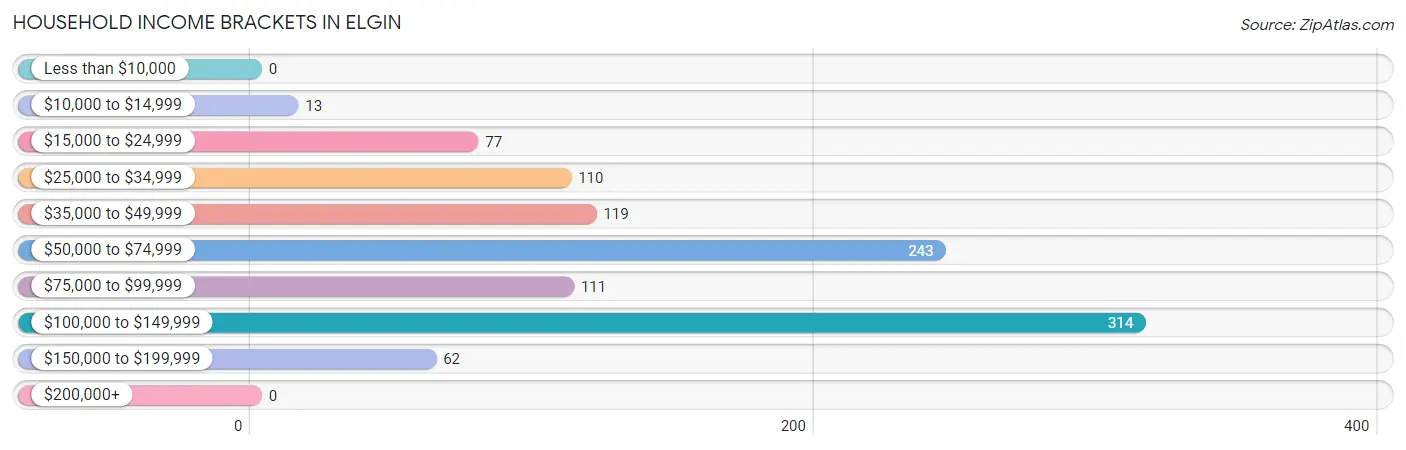
| Income Bracket | # Households | % Households |
| Less than $10,000 | 0 | 0.0% |
| $10,000 to $14,999 | 13 | 1.2% |
| $15,000 to $24,999 | 77 | 7.3% |
| $25,000 to $34,999 | 110 | 10.5% |
| $35,000 to $49,999 | 119 | 11.4% |
| $50,000 to $74,999 | 243 | 23.2% |
| $75,000 to $99,999 | 111 | 10.6% |
| $100,000 to $149,999 | 314 | 30.0% |
| $150,000 to $199,999 | 62 | 5.9% |
| $200,000+ | 0 | 0.0% |
Household Income by Householder Age in Elgin
The median household income in Elgin is $72,898, with the highest median household income of $107,431 found in the 45 to 64 years age bracket for the primary householder. A total of 542 households (51.7%) fall into this category.
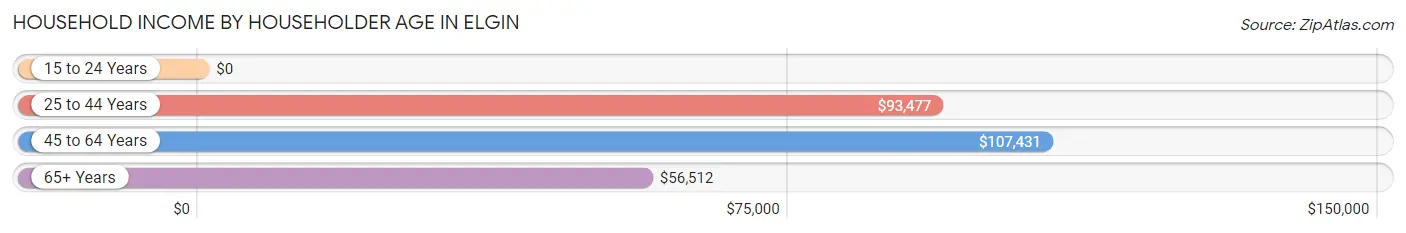
| Income Bracket | # Households | Median Income |
| 15 to 24 Years | 0 (0.0%) | $0 |
| 25 to 44 Years | 110 (10.5%) | $93,477 |
| 45 to 64 Years | 542 (51.7%) | $107,431 |
| 65+ Years | 396 (37.8%) | $56,512 |
| Total | 1,048 (100.0%) | $72,898 |
Poverty in Elgin
Income Below Poverty by Sex and Age in Elgin
With 4.3% poverty level for males and 7.7% for females among the residents of Elgin, 12 to 14 year old males and 12 to 14 year old females are the most vulnerable to poverty, with 12 males (21.8%) and 12 females (100.0%) in their respective age groups living below the poverty level.
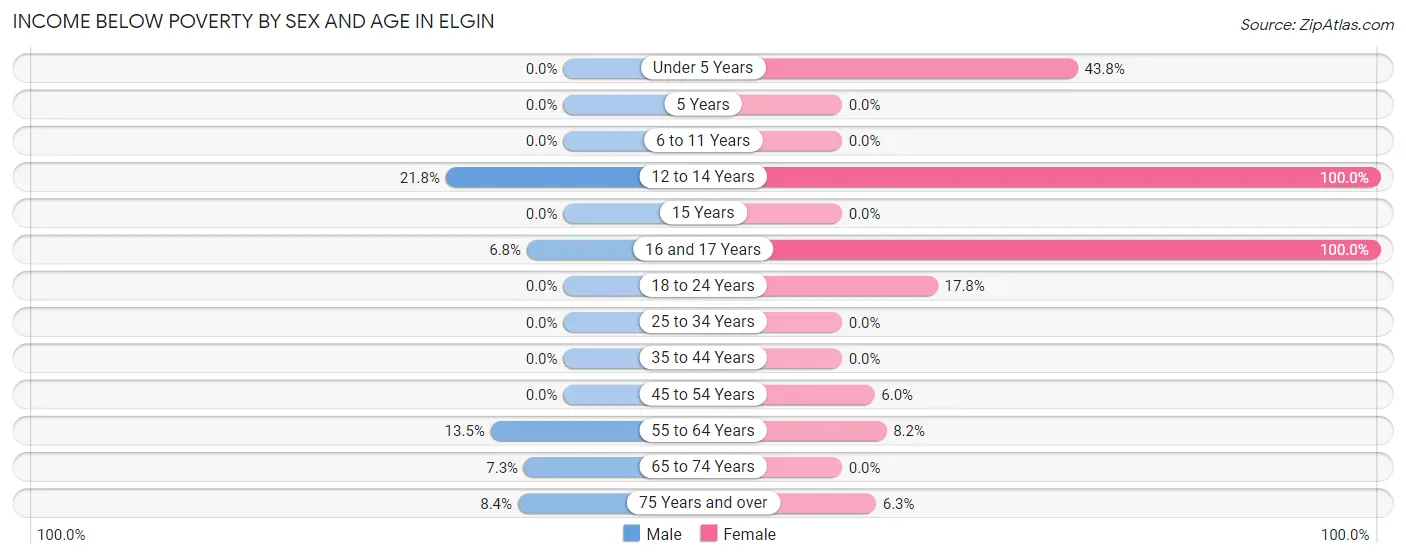
| Age Bracket | Male | Female |
| Under 5 Years | 0 (0.0%) | 14 (43.8%) |
| 5 Years | 0 (0.0%) | 0 (0.0%) |
| 6 to 11 Years | 0 (0.0%) | 0 (0.0%) |
| 12 to 14 Years | 12 (21.8%) | 12 (100.0%) |
| 15 Years | 0 (0.0%) | 0 (0.0%) |
| 16 and 17 Years | 9 (6.8%) | 10 (100.0%) |
| 18 to 24 Years | 0 (0.0%) | 24 (17.8%) |
| 25 to 34 Years | 0 (0.0%) | 0 (0.0%) |
| 35 to 44 Years | 0 (0.0%) | 0 (0.0%) |
| 45 to 54 Years | 0 (0.0%) | 20 (6.0%) |
| 55 to 64 Years | 17 (13.5%) | 14 (8.2%) |
| 65 to 74 Years | 12 (7.3%) | 0 (0.0%) |
| 75 Years and over | 13 (8.4%) | 14 (6.3%) |
| Total | 63 (4.3%) | 108 (7.7%) |
Income Above Poverty by Sex and Age in Elgin
According to the poverty statistics in Elgin, males aged under 5 years and females aged 5 years are the age groups that are most secure financially, with 100.0% of males and 100.0% of females in these age groups living above the poverty line.
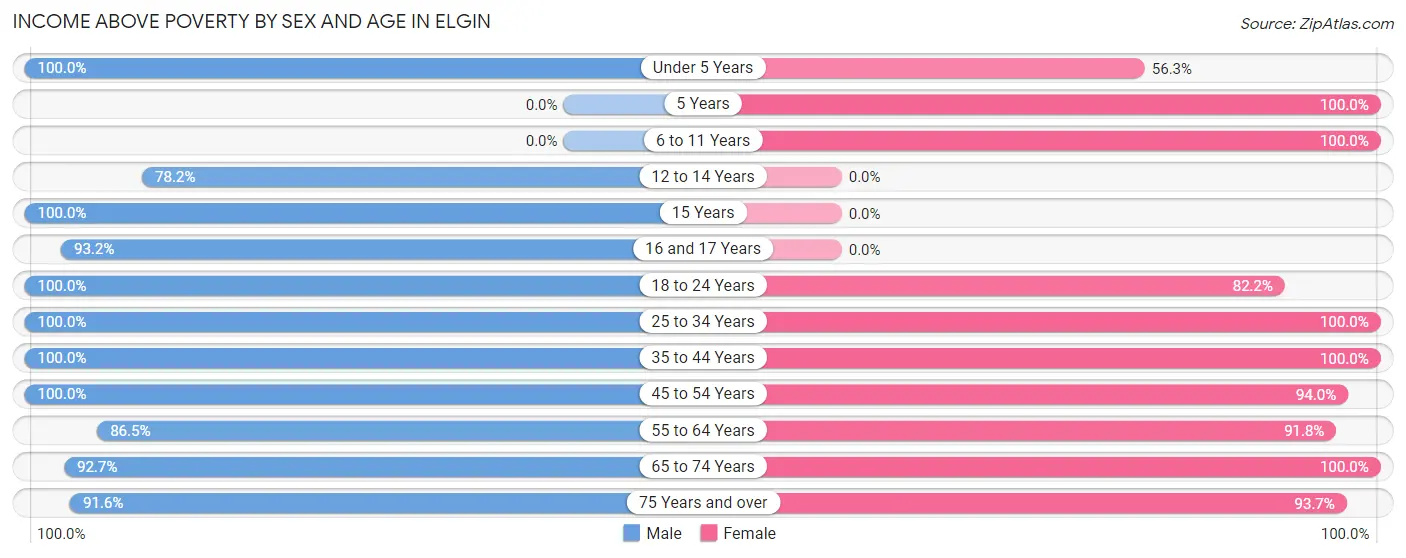
| Age Bracket | Male | Female |
| Under 5 Years | 49 (100.0%) | 18 (56.2%) |
| 5 Years | 0 (0.0%) | 17 (100.0%) |
| 6 to 11 Years | 0 (0.0%) | 17 (100.0%) |
| 12 to 14 Years | 43 (78.2%) | 0 (0.0%) |
| 15 Years | 22 (100.0%) | 0 (0.0%) |
| 16 and 17 Years | 124 (93.2%) | 0 (0.0%) |
| 18 to 24 Years | 72 (100.0%) | 111 (82.2%) |
| 25 to 34 Years | 245 (100.0%) | 153 (100.0%) |
| 35 to 44 Years | 75 (100.0%) | 104 (100.0%) |
| 45 to 54 Years | 361 (100.0%) | 311 (94.0%) |
| 55 to 64 Years | 109 (86.5%) | 156 (91.8%) |
| 65 to 74 Years | 152 (92.7%) | 192 (100.0%) |
| 75 Years and over | 141 (91.6%) | 208 (93.7%) |
| Total | 1,393 (95.7%) | 1,287 (92.3%) |
Income Below Poverty Among Married-Couple Families in Elgin
The poverty statistics for married-couple families in Elgin show that 6.7% or 47 of the total 703 families live below the poverty line. Families with 3 or 4 children have the highest poverty rate of 100.0%, comprising of 14 families. On the other hand, families with no children have the lowest poverty rate of 3.0%, which includes 13 families.
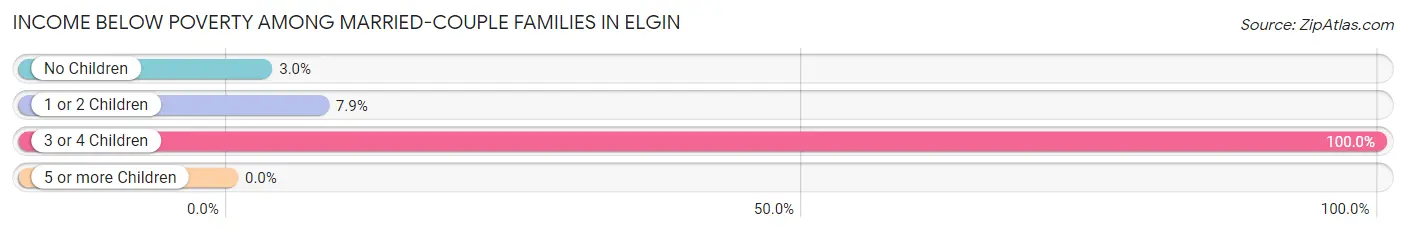
| Children | Above Poverty | Below Poverty |
| No Children | 423 (97.0%) | 13 (3.0%) |
| 1 or 2 Children | 233 (92.1%) | 20 (7.9%) |
| 3 or 4 Children | 0 (0.0%) | 14 (100.0%) |
| 5 or more Children | 0 (0.0%) | 0 (0.0%) |
| Total | 656 (93.3%) | 47 (6.7%) |
Income Below Poverty Among Single-Parent Households in Elgin
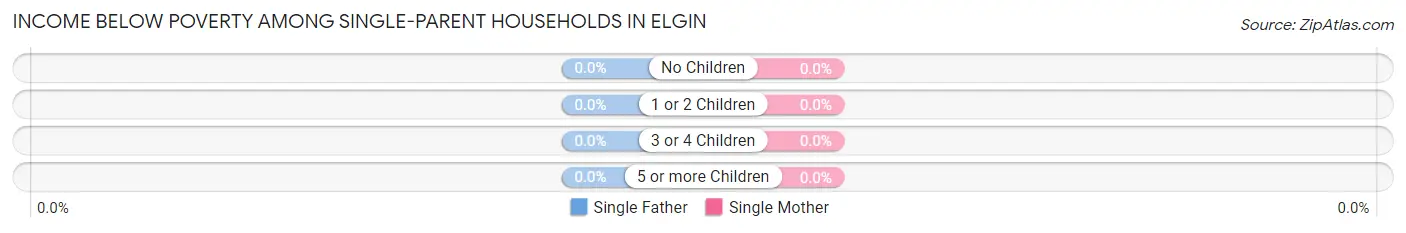
| Children | Single Father | Single Mother |
| No Children | 0 (0.0%) | 0 (0.0%) |
| 1 or 2 Children | 0 (0.0%) | 0 (0.0%) |
| 3 or 4 Children | 0 (0.0%) | 0 (0.0%) |
| 5 or more Children | 0 (0.0%) | 0 (0.0%) |
| Total | 0 (0.0%) | 0 (0.0%) |
Income Below Poverty Among Married-Couple vs Single-Parent Households in Elgin
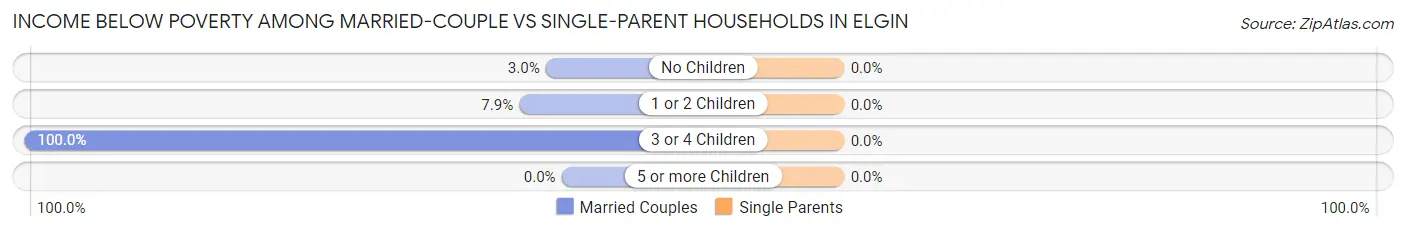
| Children | Married-Couple Families | Single-Parent Households |
| No Children | 13 (3.0%) | 0 (0.0%) |
| 1 or 2 Children | 20 (7.9%) | 0 (0.0%) |
| 3 or 4 Children | 14 (100.0%) | 0 (0.0%) |
| 5 or more Children | 0 (0.0%) | 0 (0.0%) |
| Total | 47 (6.7%) | 0 (0.0%) |
Race in Elgin
The most populous races in Elgin are White / Caucasian (1,895 | 65.7%), Black / African American (657 | 22.8%), and Hispanic or Latino (278 | 9.7%).
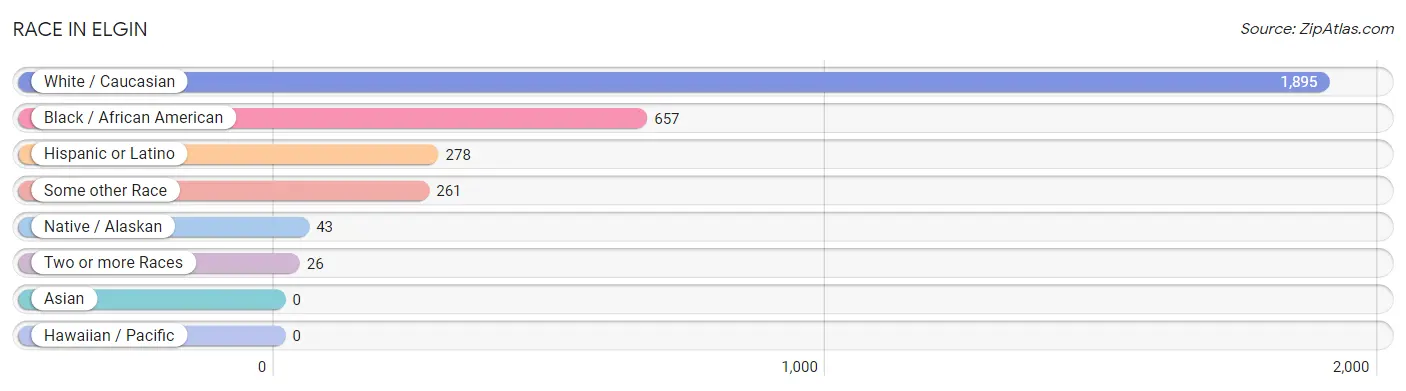
| Race | # Population | % Population |
| Asian | 0 | 0.0% |
| Black / African American | 657 | 22.8% |
| Hawaiian / Pacific | 0 | 0.0% |
| Hispanic or Latino | 278 | 9.7% |
| Native / Alaskan | 43 | 1.5% |
| White / Caucasian | 1,895 | 65.7% |
| Two or more Races | 26 | 0.9% |
| Some other Race | 261 | 9.1% |
| Total | 2,882 | 100.0% |
Ancestry in Elgin
The most populous ancestries reported in Elgin are Irish (296 | 10.3%), Mexican (261 | 9.1%), English (240 | 8.3%), German (162 | 5.6%), and Scotch-Irish (142 | 4.9%), together accounting for 38.2% of all Elgin residents.
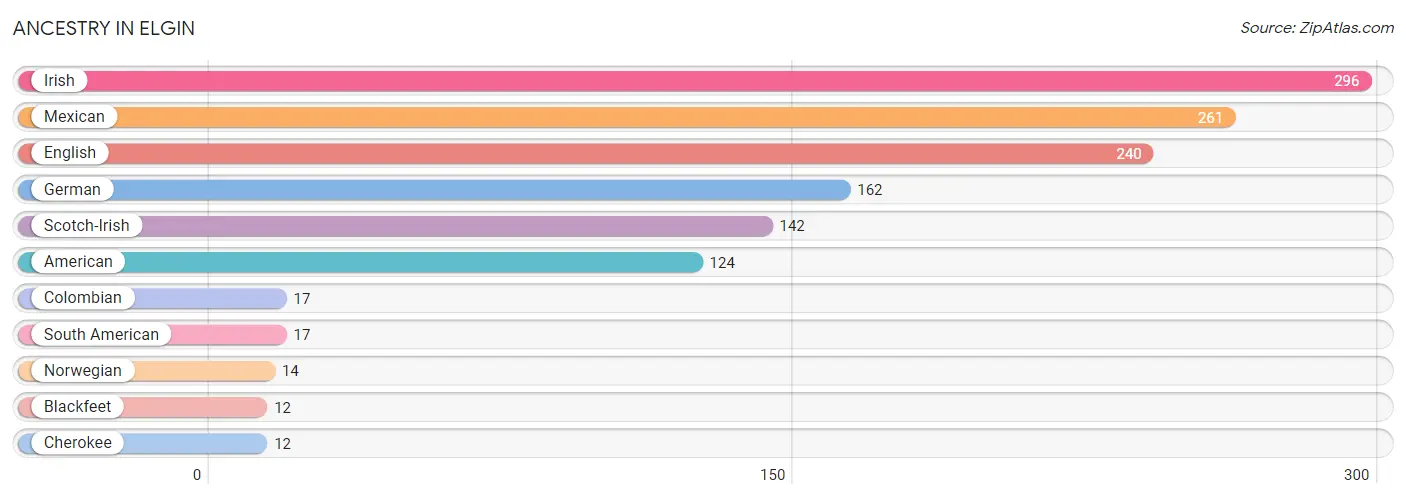
| Ancestry | # Population | % Population |
| American | 124 | 4.3% |
| Blackfeet | 12 | 0.4% |
| Cherokee | 12 | 0.4% |
| Colombian | 17 | 0.6% |
| English | 240 | 8.3% |
| German | 162 | 5.6% |
| Irish | 296 | 10.3% |
| Mexican | 261 | 9.1% |
| Norwegian | 14 | 0.5% |
| Scotch-Irish | 142 | 4.9% |
| South American | 17 | 0.6% | View All 11 Rows |
Immigrants in Elgin
The most numerous immigrant groups reported in Elgin came from Latin America (223 | 7.7%), Central America (206 | 7.1%), Mexico (206 | 7.1%), Colombia (17 | 0.6%), and South America (17 | 0.6%), together accounting for 23.2% of all Elgin residents.
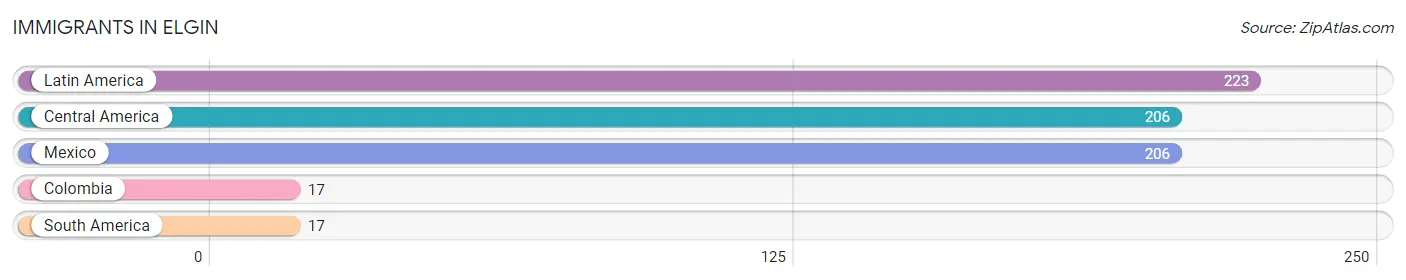
| Immigration Origin | # Population | % Population |
| Central America | 206 | 7.1% |
| Colombia | 17 | 0.6% |
| Latin America | 223 | 7.7% |
| Mexico | 206 | 7.1% |
| South America | 17 | 0.6% | View All 5 Rows |
Sex and Age in Elgin
Sex and Age in Elgin
The most populous age groups in Elgin are 25 to 29 Years (223 | 15.0%) for men and 45 to 49 Years (227 | 16.3%) for women.
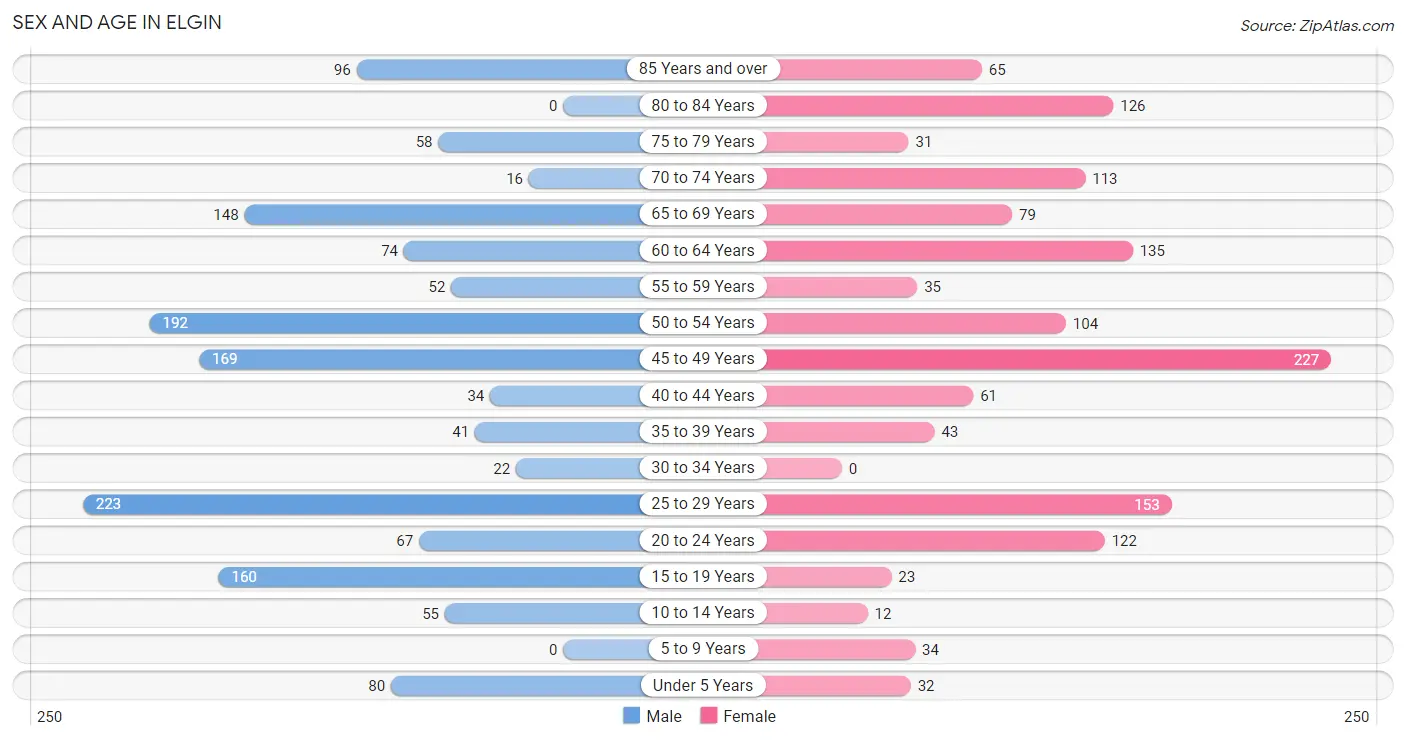
| Age Bracket | Male | Female |
| Under 5 Years | 80 (5.4%) | 32 (2.3%) |
| 5 to 9 Years | 0 (0.0%) | 34 (2.4%) |
| 10 to 14 Years | 55 (3.7%) | 12 (0.9%) |
| 15 to 19 Years | 160 (10.8%) | 23 (1.7%) |
| 20 to 24 Years | 67 (4.5%) | 122 (8.7%) |
| 25 to 29 Years | 223 (15.0%) | 153 (11.0%) |
| 30 to 34 Years | 22 (1.5%) | 0 (0.0%) |
| 35 to 39 Years | 41 (2.8%) | 43 (3.1%) |
| 40 to 44 Years | 34 (2.3%) | 61 (4.4%) |
| 45 to 49 Years | 169 (11.4%) | 227 (16.3%) |
| 50 to 54 Years | 192 (12.9%) | 104 (7.5%) |
| 55 to 59 Years | 52 (3.5%) | 35 (2.5%) |
| 60 to 64 Years | 74 (5.0%) | 135 (9.7%) |
| 65 to 69 Years | 148 (10.0%) | 79 (5.7%) |
| 70 to 74 Years | 16 (1.1%) | 113 (8.1%) |
| 75 to 79 Years | 58 (3.9%) | 31 (2.2%) |
| 80 to 84 Years | 0 (0.0%) | 126 (9.0%) |
| 85 Years and over | 96 (6.5%) | 65 (4.7%) |
| Total | 1,487 (100.0%) | 1,395 (100.0%) |
Families and Households in Elgin
Median Family Size in Elgin
The median family size in Elgin is 2.94 persons per family, with married-couple families (703 | 78.1%) accounting for the largest median family size of 3.12 persons per family. On the other hand, single male/father families (94 | 10.4%) represent the smallest median family size with 2.15 persons per family.
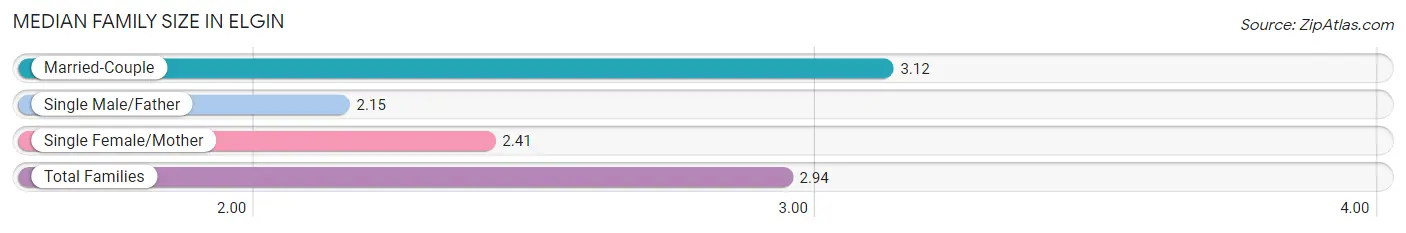
| Family Type | # Families | Family Size |
| Married-Couple | 703 (78.1%) | 3.12 |
| Single Male/Father | 94 (10.4%) | 2.15 |
| Single Female/Mother | 103 (11.4%) | 2.41 |
| Total Families | 900 (100.0%) | 2.94 |
Median Household Size in Elgin
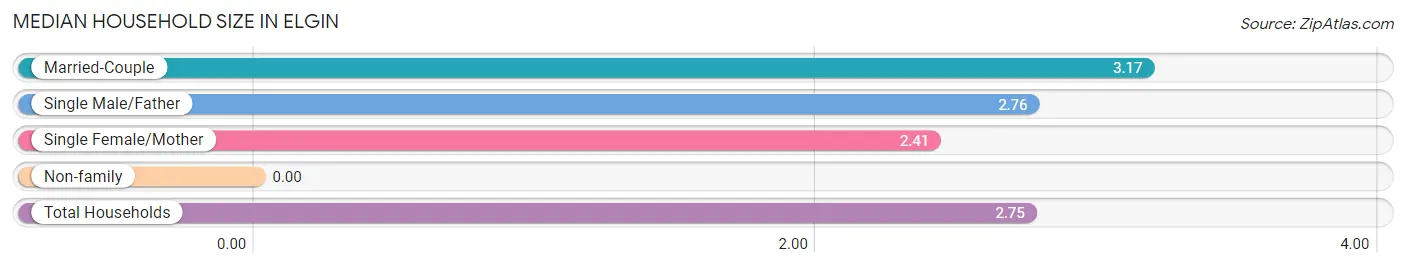
| Household Type | # Households | Household Size |
| Married-Couple | 703 (67.1%) | 3.17 |
| Single Male/Father | 94 (9.0%) | 2.76 |
| Single Female/Mother | 103 (9.8%) | 2.41 |
| Non-family | 148 (14.1%) | - |
| Total Households | 1,048 (100.0%) | 2.75 |
Household Size by Marriage Status in Elgin
Out of a total of 1,048 households in Elgin, 900 (85.9%) are family households, while 148 (14.1%) are nonfamily households. The most numerous type of family households are 2-person households, comprising 428, and the most common type of nonfamily households are 1-person households, comprising 148.
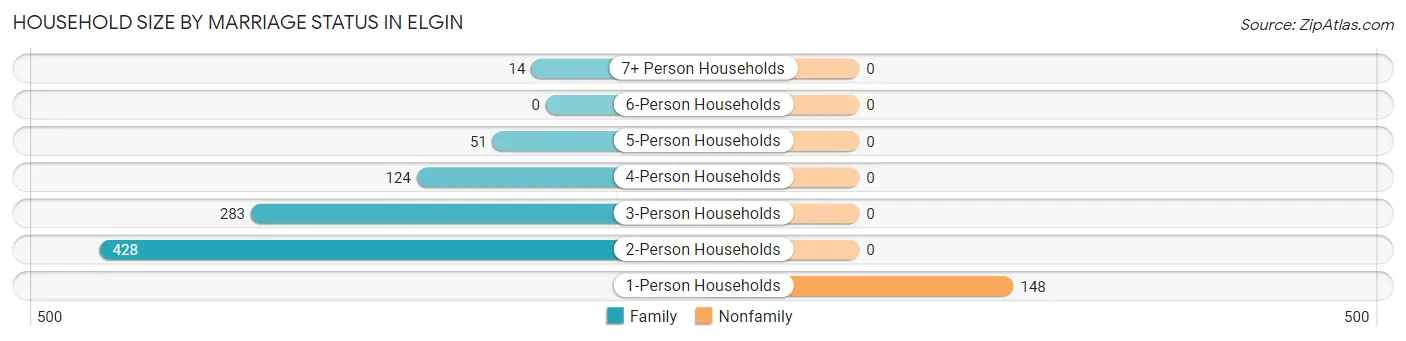
| Household Size | Family Households | Nonfamily Households |
| 1-Person Households | - | 148 (14.1%) |
| 2-Person Households | 428 (40.8%) | 0 (0.0%) |
| 3-Person Households | 283 (27.0%) | 0 (0.0%) |
| 4-Person Households | 124 (11.8%) | 0 (0.0%) |
| 5-Person Households | 51 (4.9%) | 0 (0.0%) |
| 6-Person Households | 0 (0.0%) | 0 (0.0%) |
| 7+ Person Households | 14 (1.3%) | 0 (0.0%) |
| Total | 900 (85.9%) | 148 (14.1%) |
Female Fertility in Elgin
Fertility by Age in Elgin
| Age Bracket | Women with Births | Births / 1,000 Women |
| 15 to 19 years | 0 (0.0%) | 0.0 |
| 20 to 34 years | 0 (0.0%) | 0.0 |
| 35 to 50 years | 0 (0.0%) | 0.0 |
| Total | 0 (0.0%) | 0.0 |
Fertility by Age by Marriage Status in Elgin
| Age Bracket | Married | Unmarried |
| 15 to 19 years | 0 (0.0%) | 0 (0.0%) |
| 20 to 34 years | 0 (0.0%) | 0 (0.0%) |
| 35 to 50 years | 0 (0.0%) | 0 (0.0%) |
| Total | 0 (0.0%) | 0 (0.0%) |
Fertility by Education in Elgin
| Educational Attainment | Women with Births | Births / 1,000 Women |
| Less than High School | 0 (0.0%) | 0.0 |
| High School Diploma | 0 (0.0%) | 0.0 |
| College or Associate's Degree | 0 (0.0%) | 0.0 |
| Bachelor's Degree | 0 (0.0%) | 0.0 |
| Graduate Degree | 0 (0.0%) | 0.0 |
| Total | 0 (0.0%) | 0.0 |
Fertility by Education by Marriage Status in Elgin
| Educational Attainment | Married | Unmarried |
| Less than High School | 0 (0.0%) | 0 (0.0%) |
| High School Diploma | 0 (0.0%) | 0 (0.0%) |
| College or Associate's Degree | 0 (0.0%) | 0 (0.0%) |
| Bachelor's Degree | 0 (0.0%) | 0 (0.0%) |
| Graduate Degree | 0 (0.0%) | 0 (0.0%) |
| Total | 0 (0.0%) | 0 (0.0%) |
Employment Characteristics in Elgin
Employment by Class of Employer in Elgin
Among the 1,462 employed individuals in Elgin, private company employees (867 | 59.3%), local government employees (328 | 22.4%), and self-employed (not incorporated) (135 | 9.2%) make up the most common classes of employment.
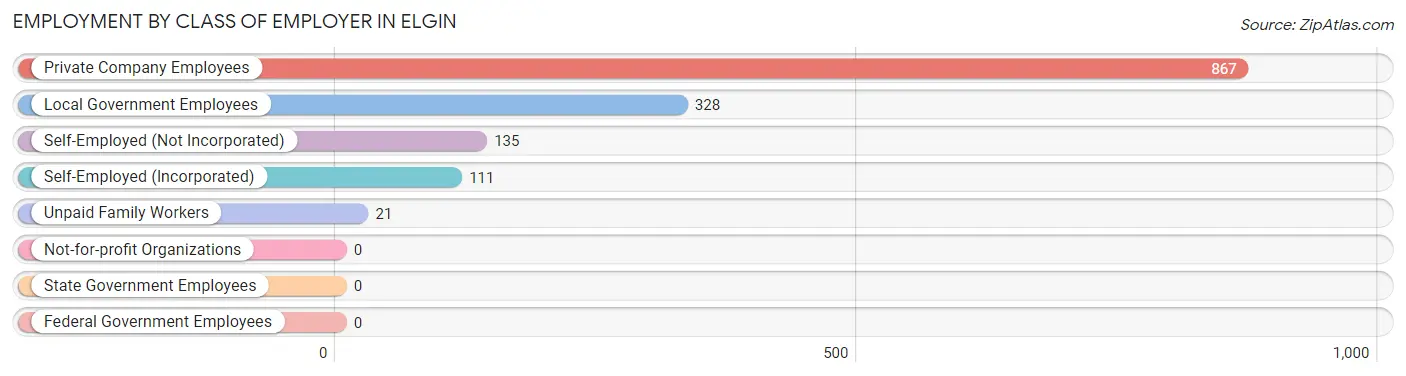
| Employer Class | # Employees | % Employees |
| Private Company Employees | 867 | 59.3% |
| Self-Employed (Incorporated) | 111 | 7.6% |
| Self-Employed (Not Incorporated) | 135 | 9.2% |
| Not-for-profit Organizations | 0 | 0.0% |
| Local Government Employees | 328 | 22.4% |
| State Government Employees | 0 | 0.0% |
| Federal Government Employees | 0 | 0.0% |
| Unpaid Family Workers | 21 | 1.4% |
| Total | 1,462 | 100.0% |
Employment Status by Age in Elgin
According to the labor force statistics for Elgin, out of the total population over 16 years of age (2,647), 56.6% or 1,498 individuals are in the labor force, with 2.4% or 36 of them unemployed. The age group with the highest labor force participation rate is 25 to 29 years, with 100.0% or 376 individuals in the labor force. Within the labor force, the 30 to 34 years age range has the highest percentage of unemployed individuals, with 100.0% or 22 of them being unemployed.
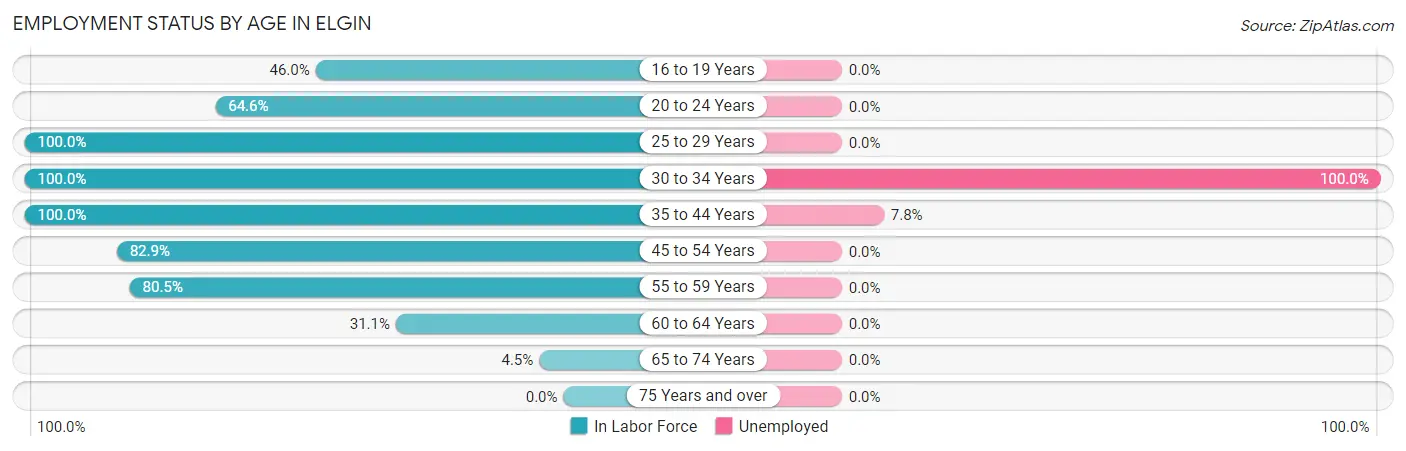
| Age Bracket | In Labor Force | Unemployed |
| 16 to 19 Years | 74 (46.0%) | 0 (0.0%) |
| 20 to 24 Years | 122 (64.6%) | 0 (0.0%) |
| 25 to 29 Years | 376 (100.0%) | 0 (0.0%) |
| 30 to 34 Years | 22 (100.0%) | 22 (100.0%) |
| 35 to 44 Years | 179 (100.0%) | 14 (7.8%) |
| 45 to 54 Years | 574 (82.9%) | 0 (0.0%) |
| 55 to 59 Years | 70 (80.5%) | 0 (0.0%) |
| 60 to 64 Years | 65 (31.1%) | 0 (0.0%) |
| 65 to 74 Years | 16 (4.5%) | 0 (0.0%) |
| 75 Years and over | 0 (0.0%) | 0 (0.0%) |
| Total | 1,498 (56.6%) | 36 (2.4%) |
Employment Status by Educational Attainment in Elgin
According to labor force statistics for Elgin, 82.2% of individuals (1,286) out of the total population between 25 and 64 years of age (1,565) are in the labor force, with 2.8% or 36 of them being unemployed. The group with the highest labor force participation rate are those with the educational attainment of college / associate degree, with 95.3% or 345 individuals in the labor force. Within the labor force, individuals with less than high school education have the highest percentage of unemployment, with 10.7% or 22 of them being unemployed.
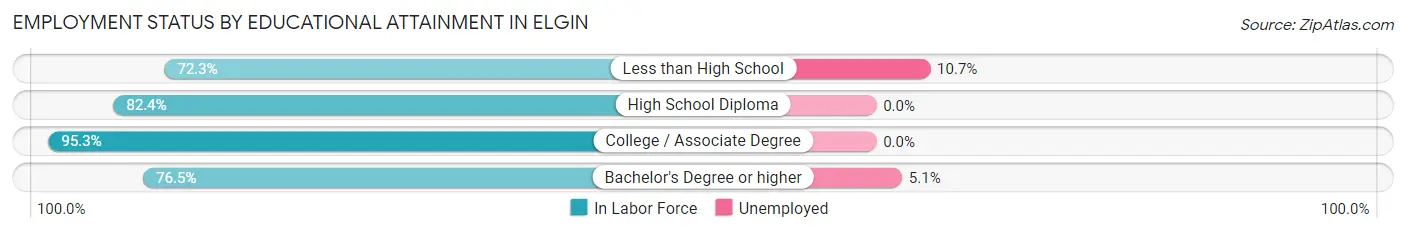
| Educational Attainment | In Labor Force | Unemployed |
| Less than High School | 206 (72.3%) | 30 (10.7%) |
| High School Diploma | 459 (82.4%) | 0 (0.0%) |
| College / Associate Degree | 345 (95.3%) | 0 (0.0%) |
| Bachelor's Degree or higher | 276 (76.5%) | 18 (5.1%) |
| Total | 1,286 (82.2%) | 44 (2.8%) |
Employment Occupations by Sex in Elgin
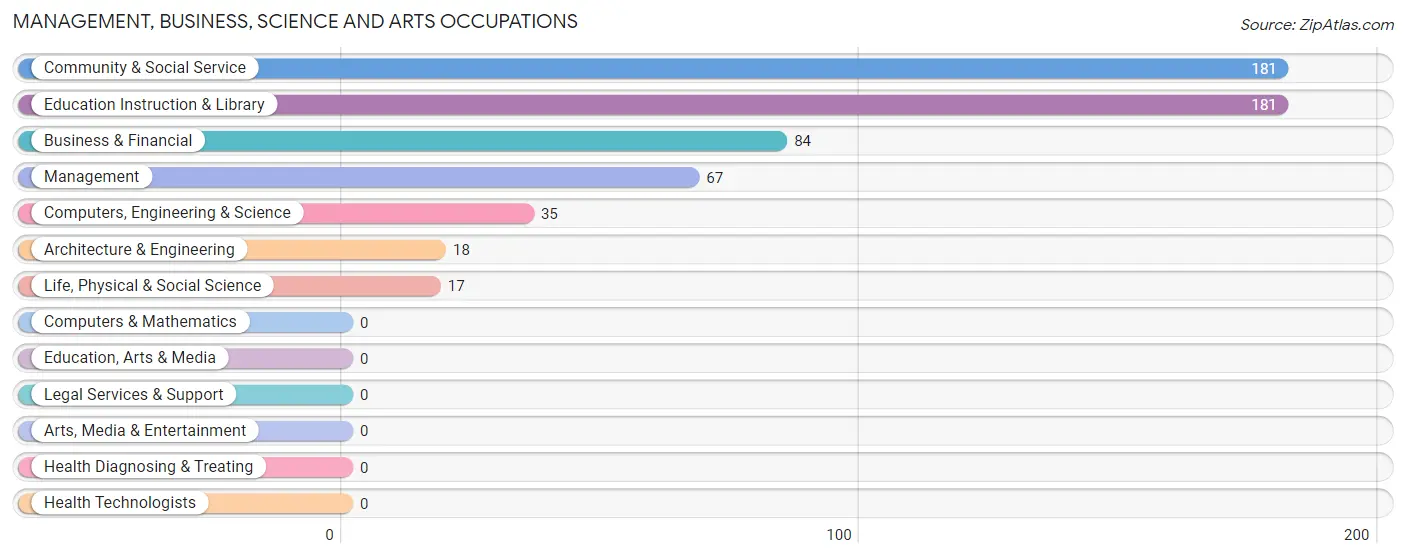
Management, Business, Science and Arts Occupations
The most common Management, Business, Science and Arts occupations in Elgin are Community & Social Service (181 | 12.4%), Education Instruction & Library (181 | 12.4%), Business & Financial (84 | 5.8%), Management (67 | 4.6%), and Computers, Engineering & Science (35 | 2.4%).
Management, Business, Science and Arts Occupations by Sex
Within the Management, Business, Science and Arts occupations in Elgin, the most male-oriented occupations are Computers, Engineering & Science (100.0%), Architecture & Engineering (100.0%), and Life, Physical & Social Science (100.0%), while the most female-oriented occupations are Community & Social Service (58.0%), Education Instruction & Library (58.0%), and Business & Financial (40.5%).
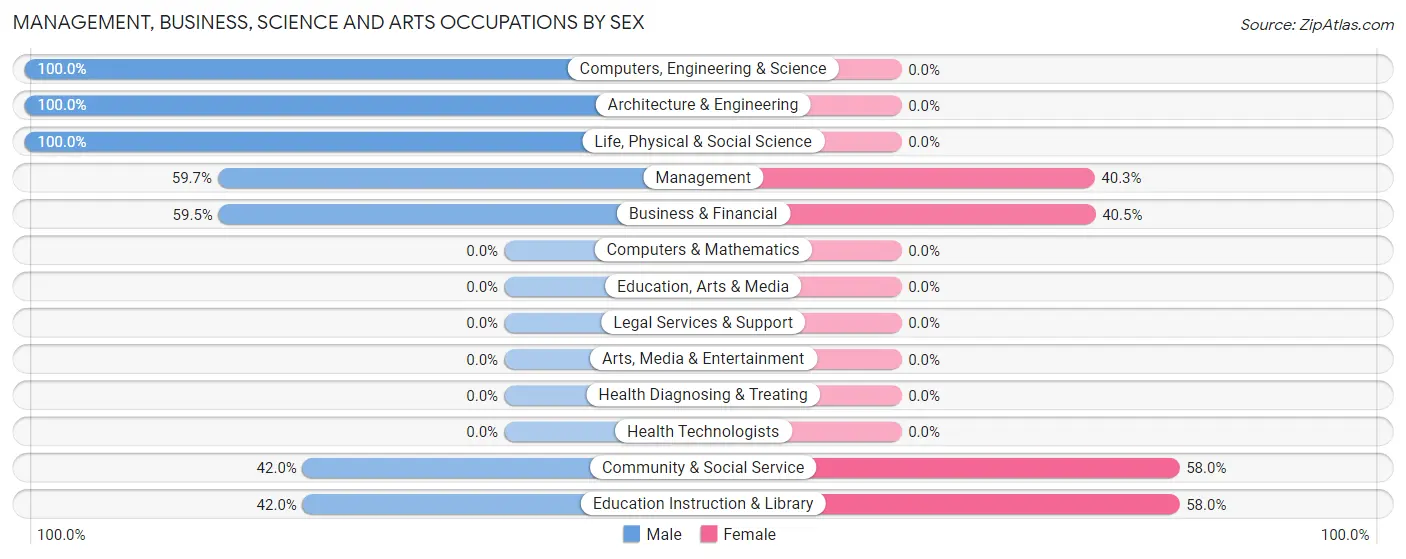
| Occupation | Male | Female |
| Management | 40 (59.7%) | 27 (40.3%) |
| Business & Financial | 50 (59.5%) | 34 (40.5%) |
| Computers, Engineering & Science | 35 (100.0%) | 0 (0.0%) |
| Computers & Mathematics | 0 (0.0%) | 0 (0.0%) |
| Architecture & Engineering | 18 (100.0%) | 0 (0.0%) |
| Life, Physical & Social Science | 17 (100.0%) | 0 (0.0%) |
| Community & Social Service | 76 (42.0%) | 105 (58.0%) |
| Education, Arts & Media | 0 (0.0%) | 0 (0.0%) |
| Legal Services & Support | 0 (0.0%) | 0 (0.0%) |
| Education Instruction & Library | 76 (42.0%) | 105 (58.0%) |
| Arts, Media & Entertainment | 0 (0.0%) | 0 (0.0%) |
| Health Diagnosing & Treating | 0 (0.0%) | 0 (0.0%) |
| Health Technologists | 0 (0.0%) | 0 (0.0%) |
| Total (Category) | 201 (54.8%) | 166 (45.2%) |
| Total (Overall) | 835 (57.1%) | 627 (42.9%) |
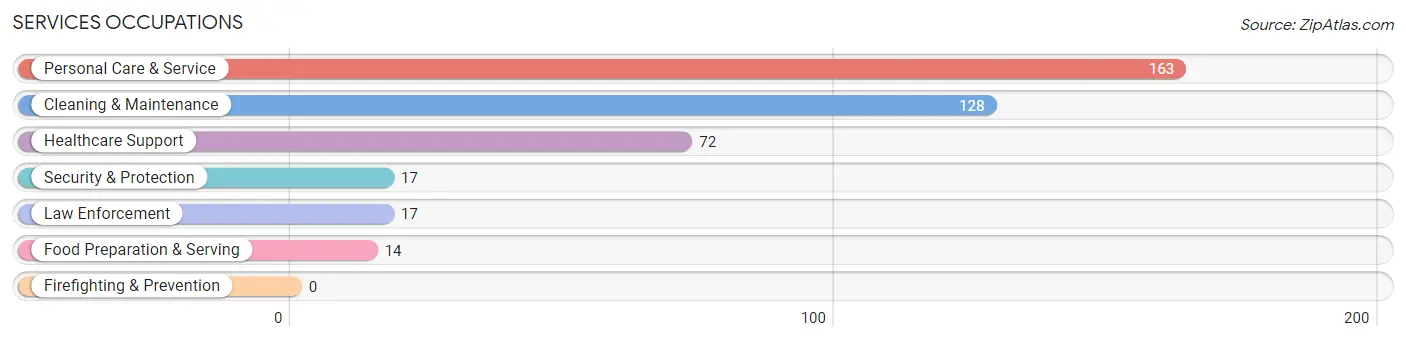
Services Occupations
The most common Services occupations in Elgin are Personal Care & Service (163 | 11.2%), Cleaning & Maintenance (128 | 8.8%), Healthcare Support (72 | 4.9%), Security & Protection (17 | 1.2%), and Law Enforcement (17 | 1.2%).
Services Occupations by Sex
Within the Services occupations in Elgin, the most male-oriented occupations are Security & Protection (100.0%), Law Enforcement (100.0%), and Food Preparation & Serving (100.0%), while the most female-oriented occupations are Healthcare Support (100.0%), and Personal Care & Service (100.0%).
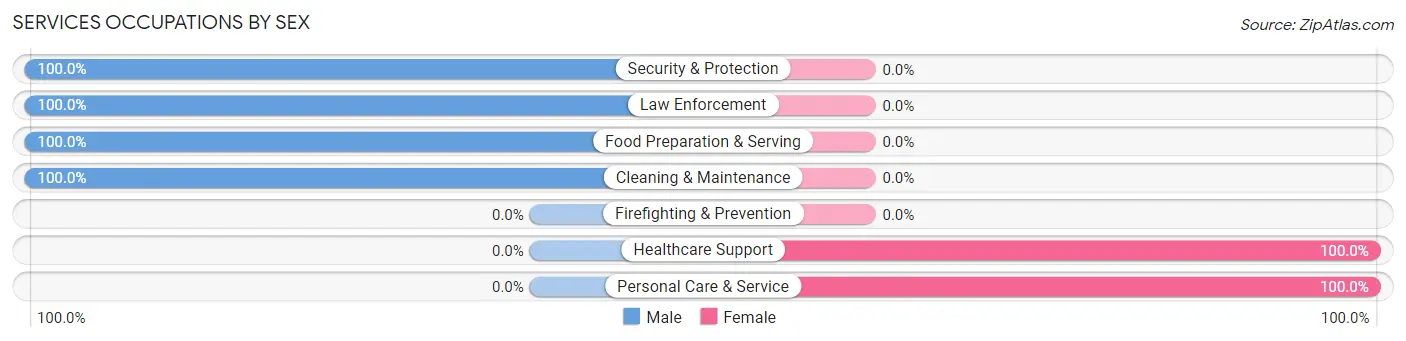
| Occupation | Male | Female |
| Healthcare Support | 0 (0.0%) | 72 (100.0%) |
| Security & Protection | 17 (100.0%) | 0 (0.0%) |
| Firefighting & Prevention | 0 (0.0%) | 0 (0.0%) |
| Law Enforcement | 17 (100.0%) | 0 (0.0%) |
| Food Preparation & Serving | 14 (100.0%) | 0 (0.0%) |
| Cleaning & Maintenance | 128 (100.0%) | 0 (0.0%) |
| Personal Care & Service | 0 (0.0%) | 163 (100.0%) |
| Total (Category) | 159 (40.4%) | 235 (59.6%) |
| Total (Overall) | 835 (57.1%) | 627 (42.9%) |
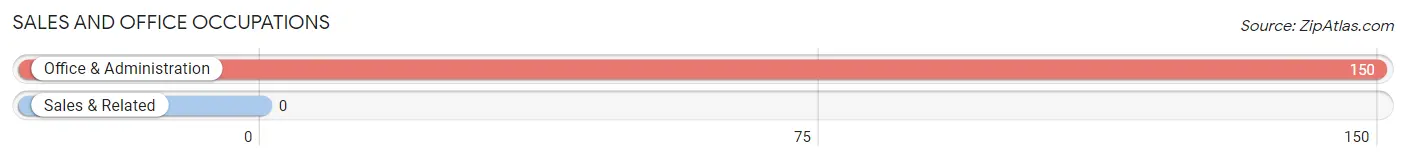
Sales and Office Occupations
The most common Sales and Office occupations in Elgin are , and Office & Administration (150 | 10.3%).
Sales and Office Occupations by Sex
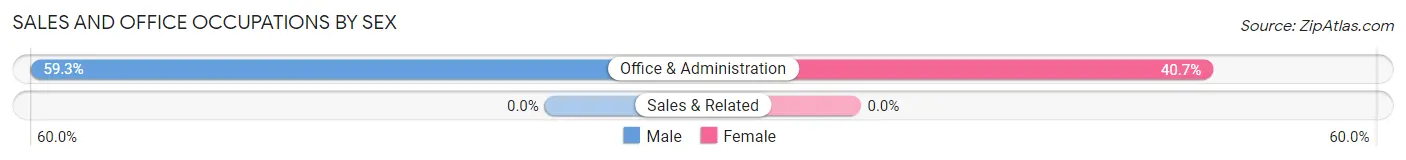
| Occupation | Male | Female |
| Sales & Related | 0 (0.0%) | 0 (0.0%) |
| Office & Administration | 89 (59.3%) | 61 (40.7%) |
| Total (Category) | 89 (59.3%) | 61 (40.7%) |
| Total (Overall) | 835 (57.1%) | 627 (42.9%) |
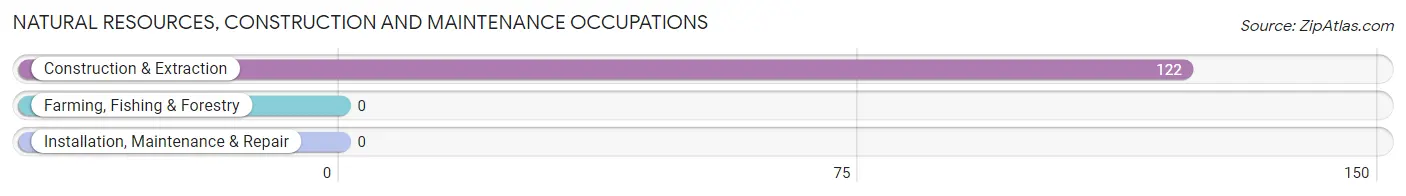
Natural Resources, Construction and Maintenance Occupations
The most common Natural Resources, Construction and Maintenance occupations in Elgin are , and Construction & Extraction (122 | 8.3%).
Natural Resources, Construction and Maintenance Occupations by Sex

| Occupation | Male | Female |
| Farming, Fishing & Forestry | 0 (0.0%) | 0 (0.0%) |
| Construction & Extraction | 122 (100.0%) | 0 (0.0%) |
| Installation, Maintenance & Repair | 0 (0.0%) | 0 (0.0%) |
| Total (Category) | 122 (100.0%) | 0 (0.0%) |
| Total (Overall) | 835 (57.1%) | 627 (42.9%) |
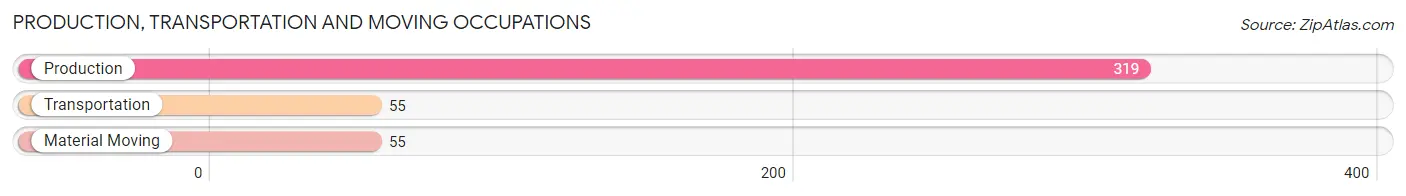
Production, Transportation and Moving Occupations
The most common Production, Transportation and Moving occupations in Elgin are Production (319 | 21.8%), Transportation (55 | 3.8%), and Material Moving (55 | 3.8%).
Production, Transportation and Moving Occupations by Sex
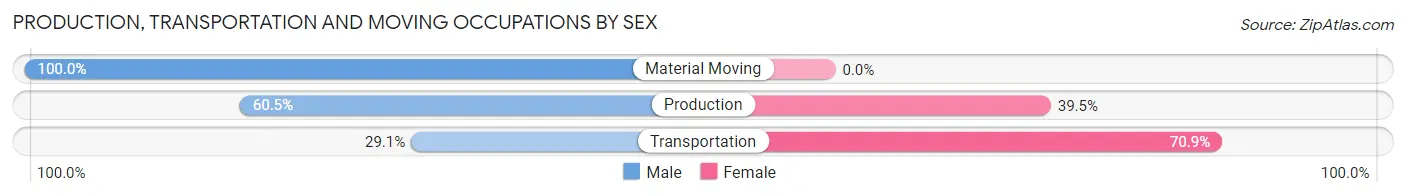
| Occupation | Male | Female |
| Production | 193 (60.5%) | 126 (39.5%) |
| Transportation | 16 (29.1%) | 39 (70.9%) |
| Material Moving | 55 (100.0%) | 0 (0.0%) |
| Total (Category) | 264 (61.5%) | 165 (38.5%) |
| Total (Overall) | 835 (57.1%) | 627 (42.9%) |
Employment Industries by Sex in Elgin
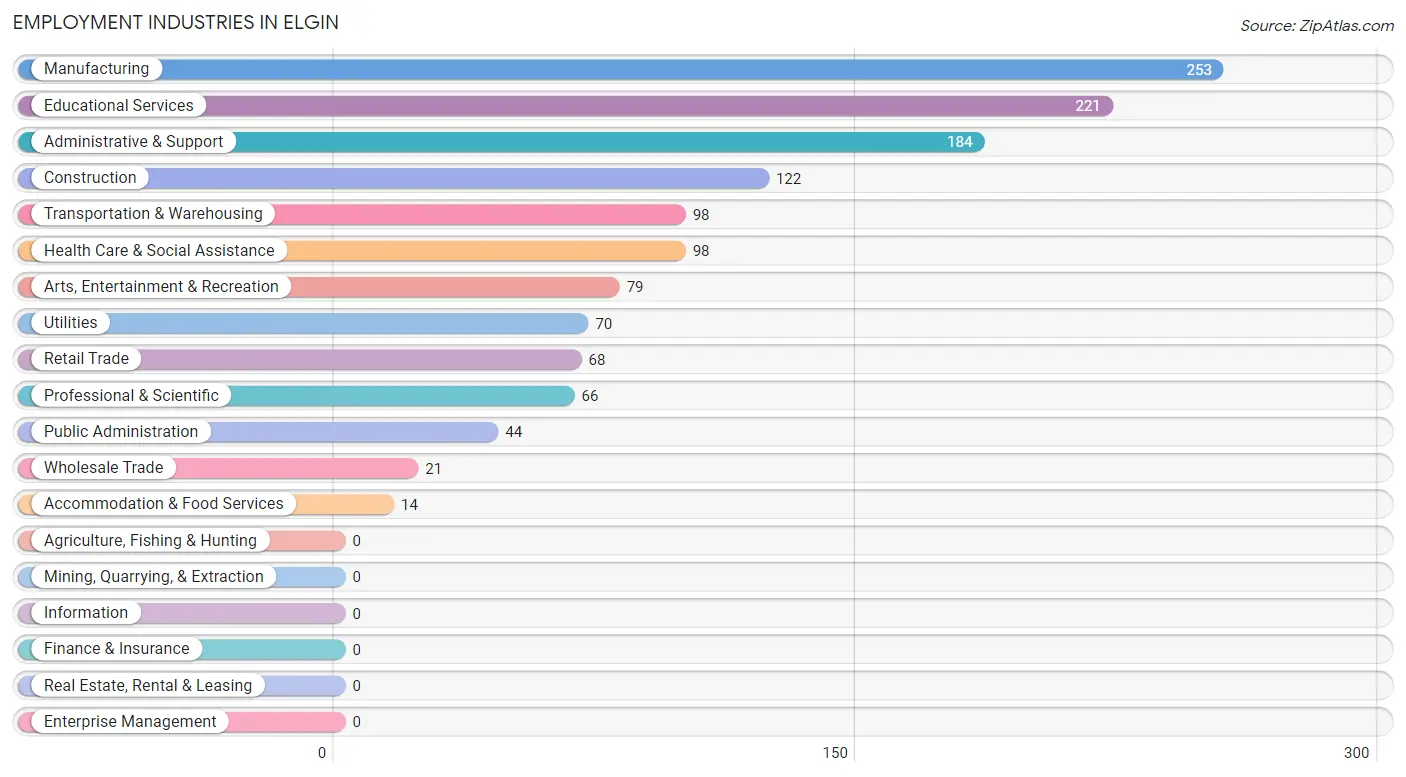
Employment Industries in Elgin
The major employment industries in Elgin include Manufacturing (253 | 17.3%), Educational Services (221 | 15.1%), Administrative & Support (184 | 12.6%), Construction (122 | 8.3%), and Transportation & Warehousing (98 | 6.7%).
Employment Industries by Sex in Elgin
The Elgin industries that see more men than women are Construction (100.0%), Wholesale Trade (100.0%), and Accommodation & Food Services (100.0%), whereas the industries that tend to have a higher number of women are Utilities (100.0%), Health Care & Social Assistance (100.0%), and Retail Trade (69.1%).
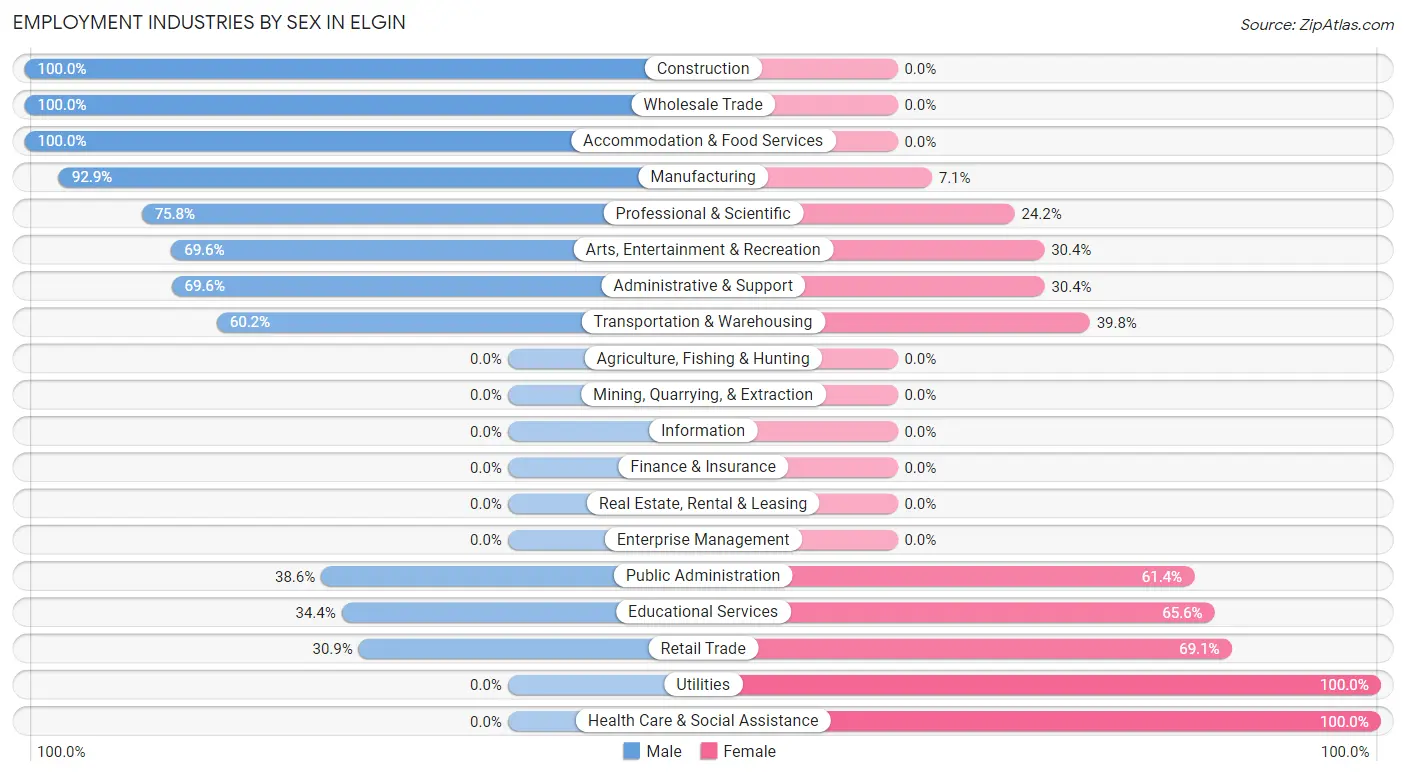
| Industry | Male | Female |
| Agriculture, Fishing & Hunting | 0 (0.0%) | 0 (0.0%) |
| Mining, Quarrying, & Extraction | 0 (0.0%) | 0 (0.0%) |
| Construction | 122 (100.0%) | 0 (0.0%) |
| Manufacturing | 235 (92.9%) | 18 (7.1%) |
| Wholesale Trade | 21 (100.0%) | 0 (0.0%) |
| Retail Trade | 21 (30.9%) | 47 (69.1%) |
| Transportation & Warehousing | 59 (60.2%) | 39 (39.8%) |
| Utilities | 0 (0.0%) | 70 (100.0%) |
| Information | 0 (0.0%) | 0 (0.0%) |
| Finance & Insurance | 0 (0.0%) | 0 (0.0%) |
| Real Estate, Rental & Leasing | 0 (0.0%) | 0 (0.0%) |
| Professional & Scientific | 50 (75.8%) | 16 (24.2%) |
| Enterprise Management | 0 (0.0%) | 0 (0.0%) |
| Administrative & Support | 128 (69.6%) | 56 (30.4%) |
| Educational Services | 76 (34.4%) | 145 (65.6%) |
| Health Care & Social Assistance | 0 (0.0%) | 98 (100.0%) |
| Arts, Entertainment & Recreation | 55 (69.6%) | 24 (30.4%) |
| Accommodation & Food Services | 14 (100.0%) | 0 (0.0%) |
| Public Administration | 17 (38.6%) | 27 (61.4%) |
| Total | 835 (57.1%) | 627 (42.9%) |
Education in Elgin
School Enrollment in Elgin
The most common levels of schooling among the 395 students in Elgin are high school (242 | 61.3%), college / undergraduate (78 | 19.8%), and middle school (41 | 10.4%).
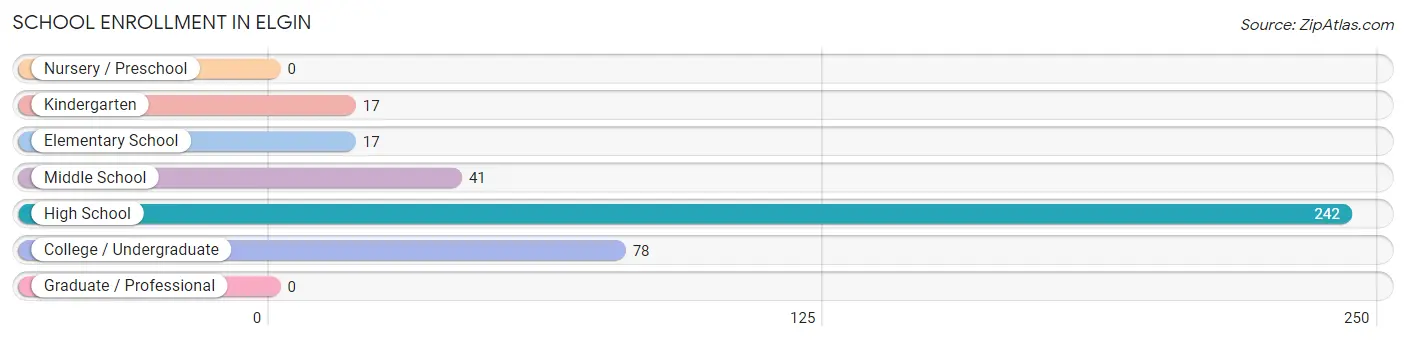
| School Level | # Students | % Students |
| Nursery / Preschool | 0 | 0.0% |
| Kindergarten | 17 | 4.3% |
| Elementary School | 17 | 4.3% |
| Middle School | 41 | 10.4% |
| High School | 242 | 61.3% |
| College / Undergraduate | 78 | 19.8% |
| Graduate / Professional | 0 | 0.0% |
| Total | 395 | 100.0% |
School Enrollment by Age by Funding Source in Elgin
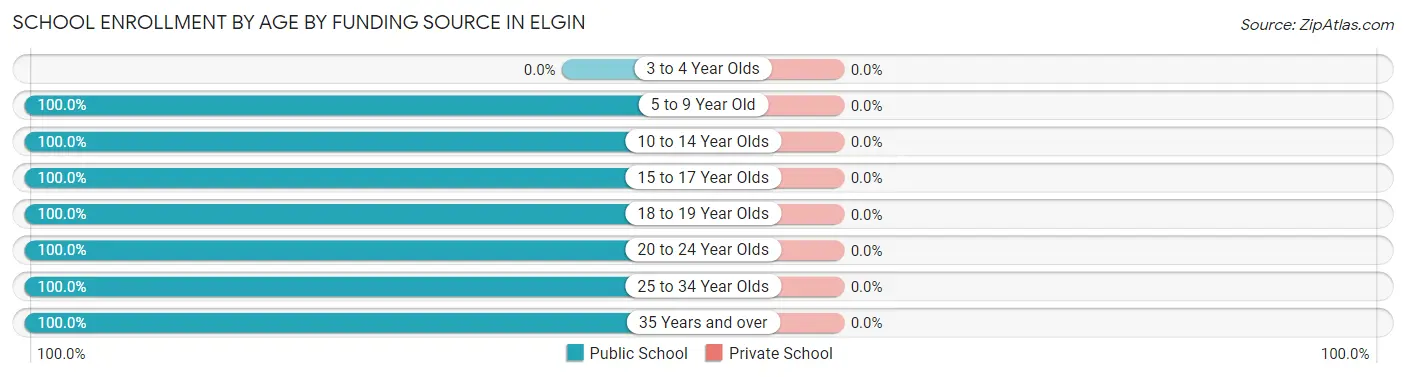
| Age Bracket | Public School | Private School |
| 3 to 4 Year Olds | 0 (0.0%) | 0 (0.0%) |
| 5 to 9 Year Old | 34 (100.0%) | 0 (0.0%) |
| 10 to 14 Year Olds | 41 (100.0%) | 0 (0.0%) |
| 15 to 17 Year Olds | 165 (100.0%) | 0 (0.0%) |
| 18 to 19 Year Olds | 18 (100.0%) | 0 (0.0%) |
| 20 to 24 Year Olds | 26 (100.0%) | 0 (0.0%) |
| 25 to 34 Year Olds | 64 (100.0%) | 0 (0.0%) |
| 35 Years and over | 47 (100.0%) | 0 (0.0%) |
| Total | 395 (100.0%) | 0 (0.0%) |
Educational Attainment by Field of Study in Elgin
Business (140 | 29.1%), bio, nature & agricultural (85 | 17.7%), multidisciplinary studies (83 | 17.3%), education (83 | 17.3%), and liberal arts & history (26 | 5.4%) are the most common fields of study among 481 individuals in Elgin who have obtained a bachelor's degree or higher.
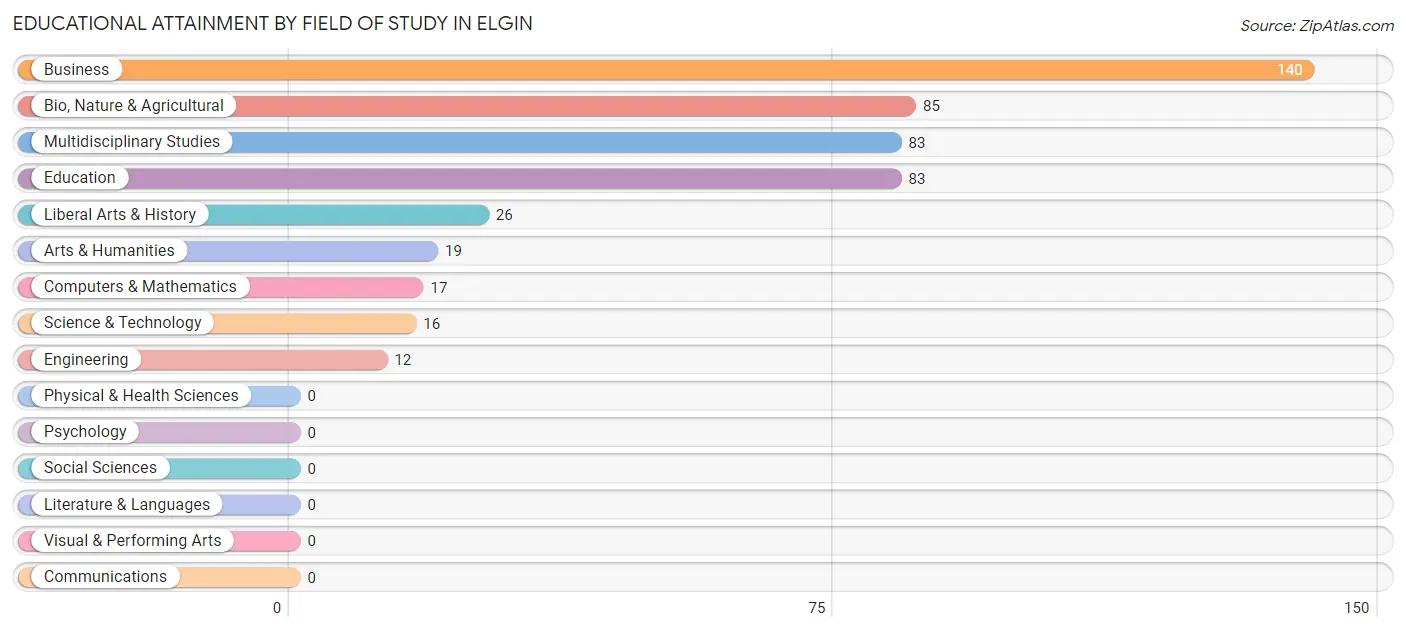
| Field of Study | # Graduates | % Graduates |
| Computers & Mathematics | 17 | 3.5% |
| Bio, Nature & Agricultural | 85 | 17.7% |
| Physical & Health Sciences | 0 | 0.0% |
| Psychology | 0 | 0.0% |
| Social Sciences | 0 | 0.0% |
| Engineering | 12 | 2.5% |
| Multidisciplinary Studies | 83 | 17.3% |
| Science & Technology | 16 | 3.3% |
| Business | 140 | 29.1% |
| Education | 83 | 17.3% |
| Literature & Languages | 0 | 0.0% |
| Liberal Arts & History | 26 | 5.4% |
| Visual & Performing Arts | 0 | 0.0% |
| Communications | 0 | 0.0% |
| Arts & Humanities | 19 | 4.0% |
| Total | 481 | 100.0% |
Transportation & Commute in Elgin
Vehicle Availability by Sex in Elgin
The most prevalent vehicle ownership categories in Elgin are males with 3 vehicles (414, accounting for 49.6%) and females with 3 vehicles (359, making up 66.0%).
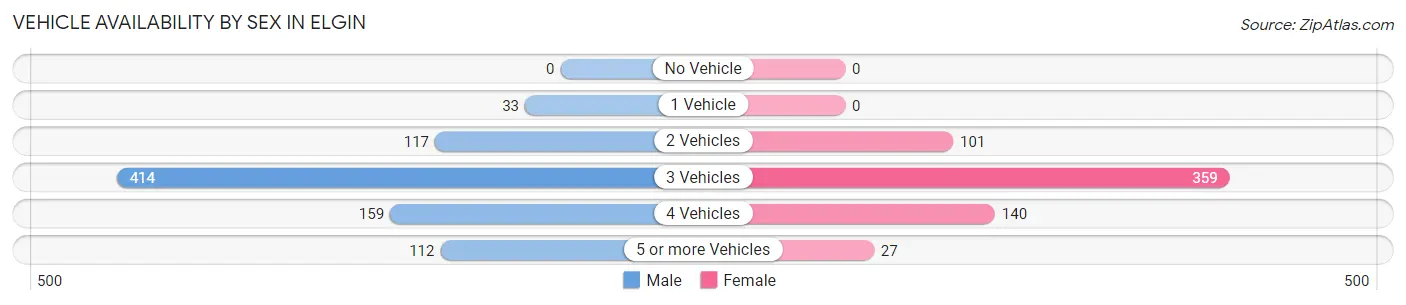
| Vehicles Available | Male | Female |
| No Vehicle | 0 (0.0%) | 0 (0.0%) |
| 1 Vehicle | 33 (4.0%) | 0 (0.0%) |
| 2 Vehicles | 117 (14.0%) | 101 (16.1%) |
| 3 Vehicles | 414 (49.6%) | 359 (57.3%) |
| 4 Vehicles | 159 (19.0%) | 140 (22.3%) |
| 5 or more Vehicles | 112 (13.4%) | 27 (4.3%) |
| Total | 835 (100.0%) | 627 (100.0%) |
Commute Time in Elgin
The most frequently occuring commute durations in Elgin are 15 to 19 minutes (264 commuters, 18.1%), 60 to 89 minutes (201 commuters, 13.8%), and 10 to 14 minutes (188 commuters, 12.9%).
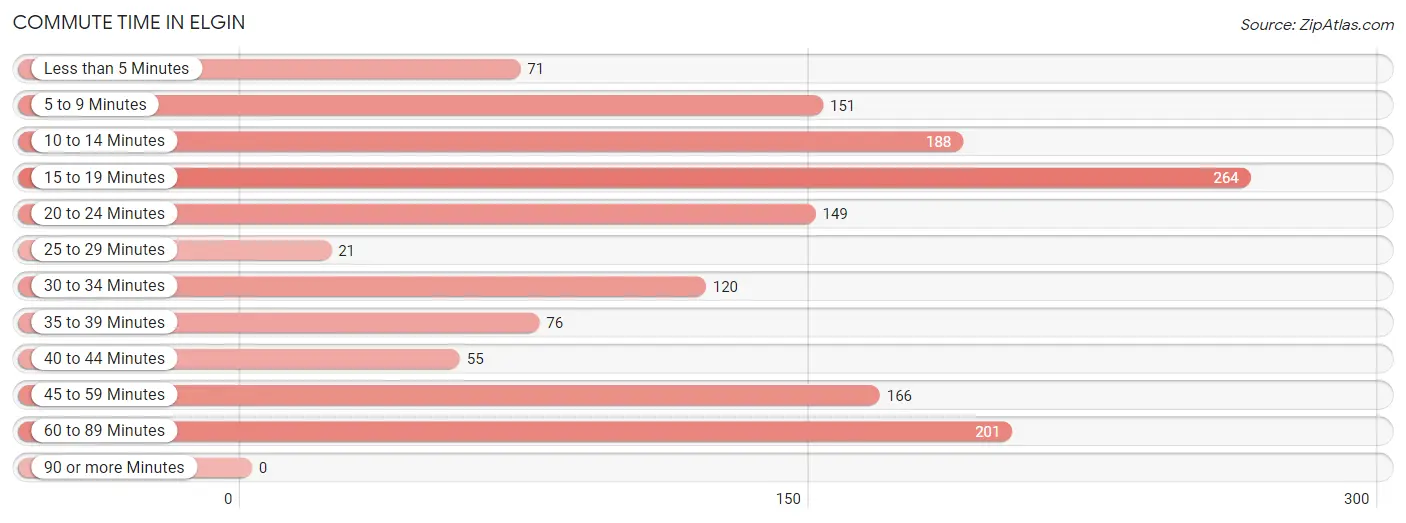
| Commute Time | # Commuters | % Commuters |
| Less than 5 Minutes | 71 | 4.9% |
| 5 to 9 Minutes | 151 | 10.3% |
| 10 to 14 Minutes | 188 | 12.9% |
| 15 to 19 Minutes | 264 | 18.1% |
| 20 to 24 Minutes | 149 | 10.2% |
| 25 to 29 Minutes | 21 | 1.4% |
| 30 to 34 Minutes | 120 | 8.2% |
| 35 to 39 Minutes | 76 | 5.2% |
| 40 to 44 Minutes | 55 | 3.8% |
| 45 to 59 Minutes | 166 | 11.4% |
| 60 to 89 Minutes | 201 | 13.8% |
| 90 or more Minutes | 0 | 0.0% |
Commute Time by Sex in Elgin
The most common commute times in Elgin are 15 to 19 minutes (181 commuters, 21.7%) for males and 5 to 9 minutes (151 commuters, 24.1%) for females.
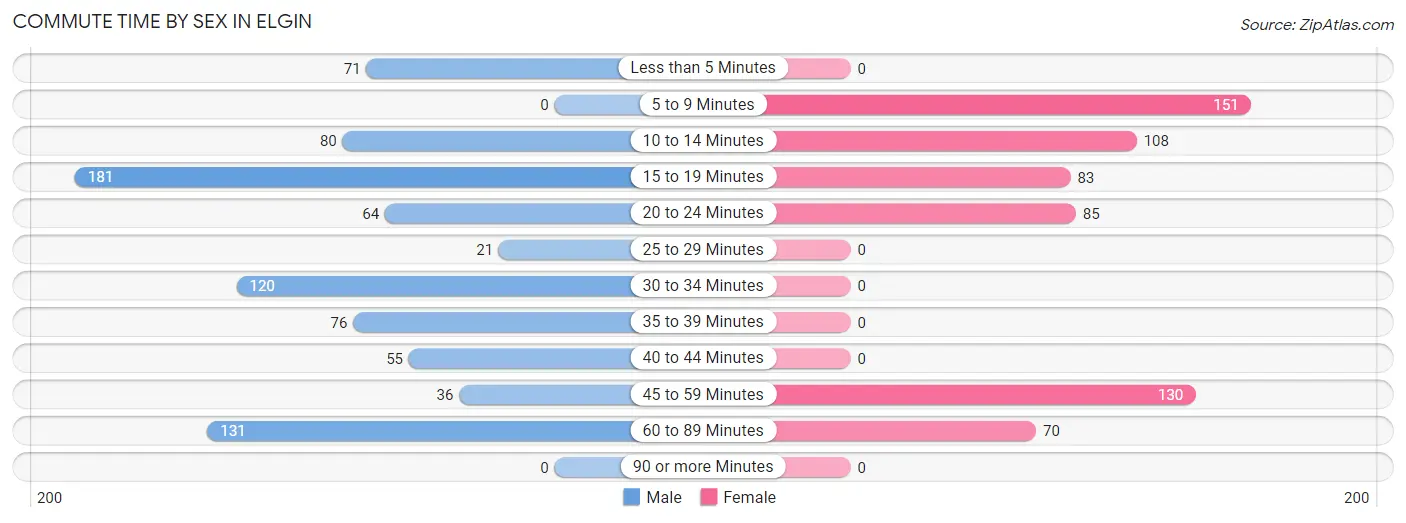
| Commute Time | Male | Female |
| Less than 5 Minutes | 71 (8.5%) | 0 (0.0%) |
| 5 to 9 Minutes | 0 (0.0%) | 151 (24.1%) |
| 10 to 14 Minutes | 80 (9.6%) | 108 (17.2%) |
| 15 to 19 Minutes | 181 (21.7%) | 83 (13.2%) |
| 20 to 24 Minutes | 64 (7.7%) | 85 (13.6%) |
| 25 to 29 Minutes | 21 (2.5%) | 0 (0.0%) |
| 30 to 34 Minutes | 120 (14.4%) | 0 (0.0%) |
| 35 to 39 Minutes | 76 (9.1%) | 0 (0.0%) |
| 40 to 44 Minutes | 55 (6.6%) | 0 (0.0%) |
| 45 to 59 Minutes | 36 (4.3%) | 130 (20.7%) |
| 60 to 89 Minutes | 131 (15.7%) | 70 (11.2%) |
| 90 or more Minutes | 0 (0.0%) | 0 (0.0%) |
Time of Departure to Work by Sex in Elgin
The most frequent times of departure to work in Elgin are 12:00 AM to 4:59 AM (152, 18.2%) for males and 6:30 AM to 6:59 AM (204, 32.5%) for females.
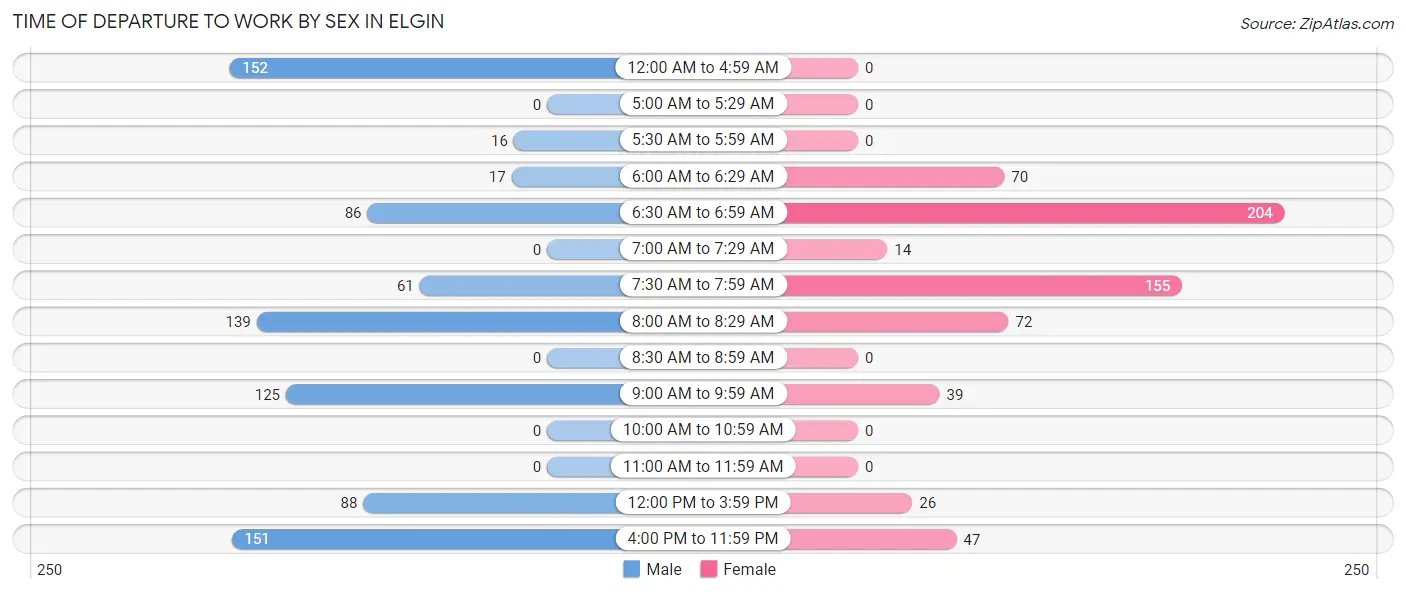
| Time of Departure | Male | Female |
| 12:00 AM to 4:59 AM | 152 (18.2%) | 0 (0.0%) |
| 5:00 AM to 5:29 AM | 0 (0.0%) | 0 (0.0%) |
| 5:30 AM to 5:59 AM | 16 (1.9%) | 0 (0.0%) |
| 6:00 AM to 6:29 AM | 17 (2.0%) | 70 (11.2%) |
| 6:30 AM to 6:59 AM | 86 (10.3%) | 204 (32.5%) |
| 7:00 AM to 7:29 AM | 0 (0.0%) | 14 (2.2%) |
| 7:30 AM to 7:59 AM | 61 (7.3%) | 155 (24.7%) |
| 8:00 AM to 8:29 AM | 139 (16.7%) | 72 (11.5%) |
| 8:30 AM to 8:59 AM | 0 (0.0%) | 0 (0.0%) |
| 9:00 AM to 9:59 AM | 125 (15.0%) | 39 (6.2%) |
| 10:00 AM to 10:59 AM | 0 (0.0%) | 0 (0.0%) |
| 11:00 AM to 11:59 AM | 0 (0.0%) | 0 (0.0%) |
| 12:00 PM to 3:59 PM | 88 (10.5%) | 26 (4.2%) |
| 4:00 PM to 11:59 PM | 151 (18.1%) | 47 (7.5%) |
| Total | 835 (100.0%) | 627 (100.0%) |
Housing Occupancy in Elgin
Occupancy by Ownership in Elgin
Of the total 1,048 dwellings in Elgin, owner-occupied units account for 940 (89.7%), while renter-occupied units make up 108 (10.3%).
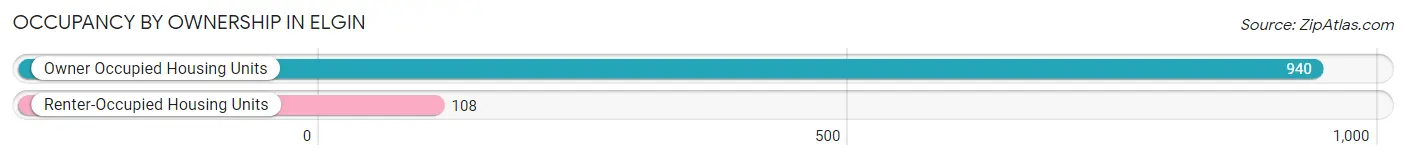
| Occupancy | # Housing Units | % Housing Units |
| Owner Occupied Housing Units | 940 | 89.7% |
| Renter-Occupied Housing Units | 108 | 10.3% |
| Total Occupied Housing Units | 1,048 | 100.0% |
Occupancy by Household Size in Elgin
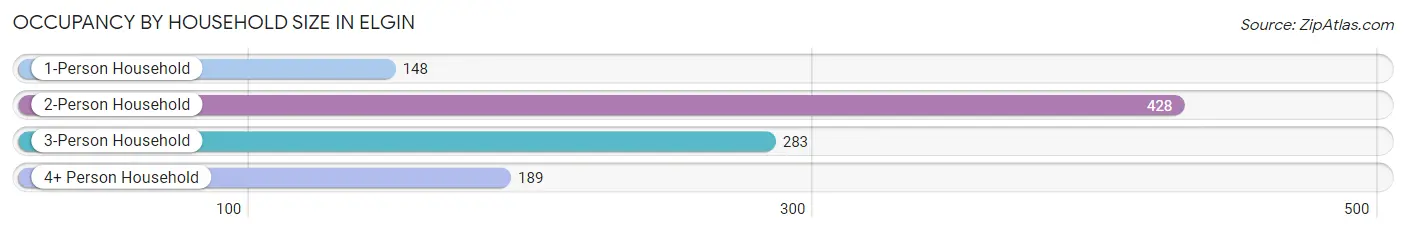
| Household Size | # Housing Units | % Housing Units |
| 1-Person Household | 148 | 14.1% |
| 2-Person Household | 428 | 40.8% |
| 3-Person Household | 283 | 27.0% |
| 4+ Person Household | 189 | 18.0% |
| Total Housing Units | 1,048 | 100.0% |
Occupancy by Ownership by Household Size in Elgin
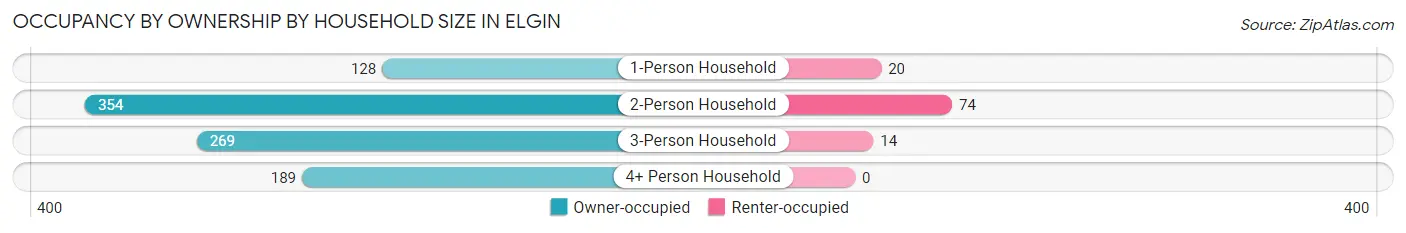
| Household Size | Owner-occupied | Renter-occupied |
| 1-Person Household | 128 (86.5%) | 20 (13.5%) |
| 2-Person Household | 354 (82.7%) | 74 (17.3%) |
| 3-Person Household | 269 (95.1%) | 14 (5.0%) |
| 4+ Person Household | 189 (100.0%) | 0 (0.0%) |
| Total Housing Units | 940 (89.7%) | 108 (10.3%) |
Occupancy by Educational Attainment in Elgin
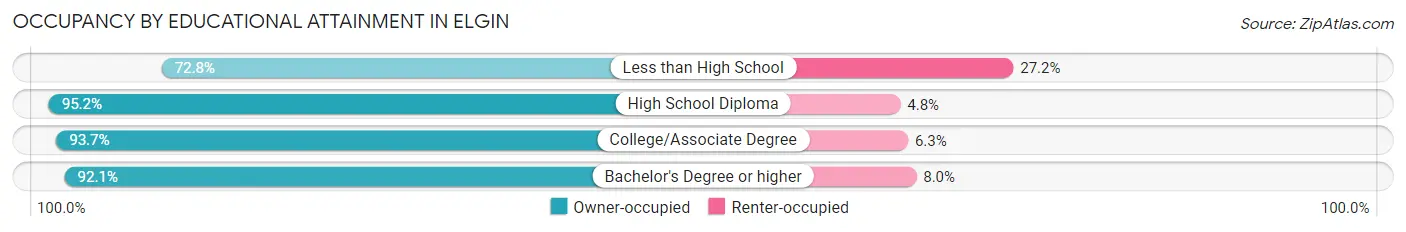
| Household Size | Owner-occupied | Renter-occupied |
| Less than High School | 158 (72.8%) | 59 (27.2%) |
| High School Diploma | 397 (95.2%) | 20 (4.8%) |
| College/Associate Degree | 223 (93.7%) | 15 (6.3%) |
| Bachelor's Degree or higher | 162 (92.0%) | 14 (8.0%) |
Occupancy by Age of Householder in Elgin
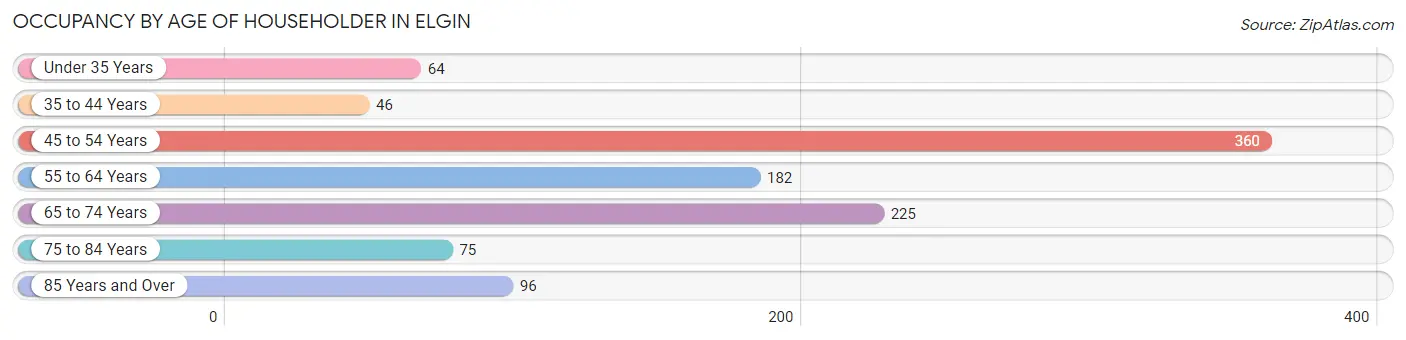
| Age Bracket | # Households | % Households |
| Under 35 Years | 64 | 6.1% |
| 35 to 44 Years | 46 | 4.4% |
| 45 to 54 Years | 360 | 34.4% |
| 55 to 64 Years | 182 | 17.4% |
| 65 to 74 Years | 225 | 21.5% |
| 75 to 84 Years | 75 | 7.2% |
| 85 Years and Over | 96 | 9.2% |
| Total | 1,048 | 100.0% |
Housing Finances in Elgin
Median Income by Occupancy in Elgin
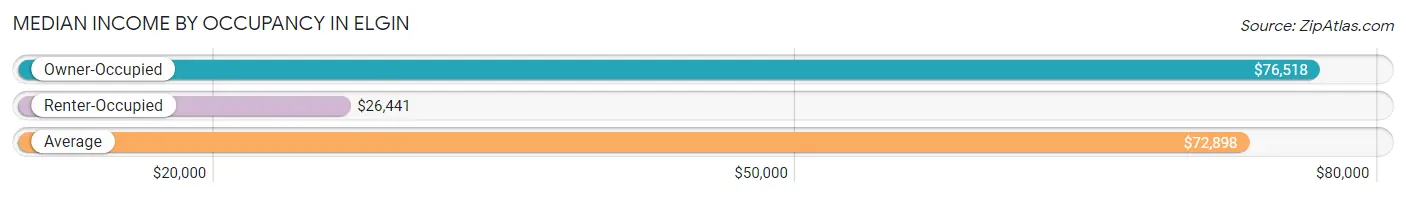
| Occupancy Type | # Households | Median Income |
| Owner-Occupied | 940 (89.7%) | $76,518 |
| Renter-Occupied | 108 (10.3%) | $26,441 |
| Average | 1,048 (100.0%) | $72,898 |
Occupancy by Householder Income Bracket in Elgin
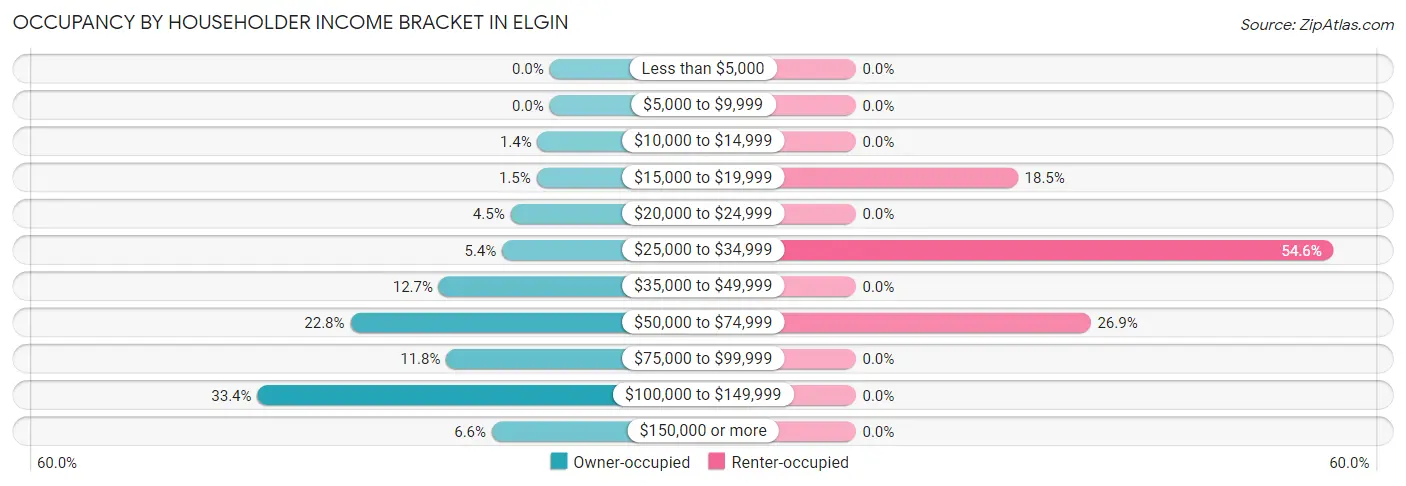
| Income Bracket | Owner-occupied | Renter-occupied |
| Less than $5,000 | 0 (0.0%) | 0 (0.0%) |
| $5,000 to $9,999 | 0 (0.0%) | 0 (0.0%) |
| $10,000 to $14,999 | 13 (1.4%) | 0 (0.0%) |
| $15,000 to $19,999 | 14 (1.5%) | 20 (18.5%) |
| $20,000 to $24,999 | 42 (4.5%) | 0 (0.0%) |
| $25,000 to $34,999 | 51 (5.4%) | 59 (54.6%) |
| $35,000 to $49,999 | 119 (12.7%) | 0 (0.0%) |
| $50,000 to $74,999 | 214 (22.8%) | 29 (26.9%) |
| $75,000 to $99,999 | 111 (11.8%) | 0 (0.0%) |
| $100,000 to $149,999 | 314 (33.4%) | 0 (0.0%) |
| $150,000 or more | 62 (6.6%) | 0 (0.0%) |
| Total | 940 (100.0%) | 108 (100.0%) |
Monthly Housing Cost Tiers in Elgin
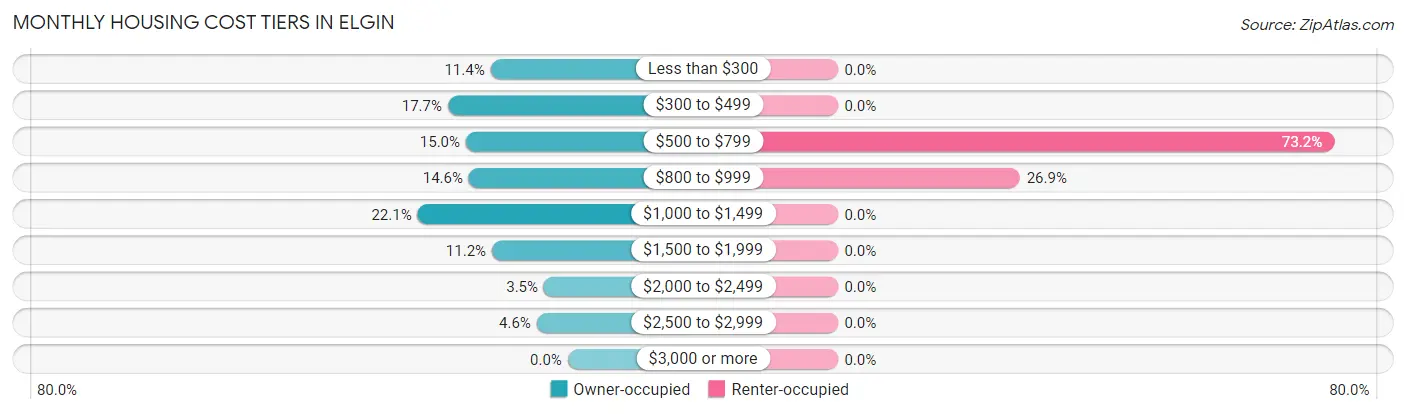
| Monthly Cost | Owner-occupied | Renter-occupied |
| Less than $300 | 107 (11.4%) | 0 (0.0%) |
| $300 to $499 | 166 (17.7%) | 0 (0.0%) |
| $500 to $799 | 141 (15.0%) | 79 (73.2%) |
| $800 to $999 | 137 (14.6%) | 29 (26.9%) |
| $1,000 to $1,499 | 208 (22.1%) | 0 (0.0%) |
| $1,500 to $1,999 | 105 (11.2%) | 0 (0.0%) |
| $2,000 to $2,499 | 33 (3.5%) | 0 (0.0%) |
| $2,500 to $2,999 | 43 (4.6%) | 0 (0.0%) |
| $3,000 or more | 0 (0.0%) | 0 (0.0%) |
| Total | 940 (100.0%) | 108 (100.0%) |
Physical Housing Characteristics in Elgin
Housing Structures in Elgin
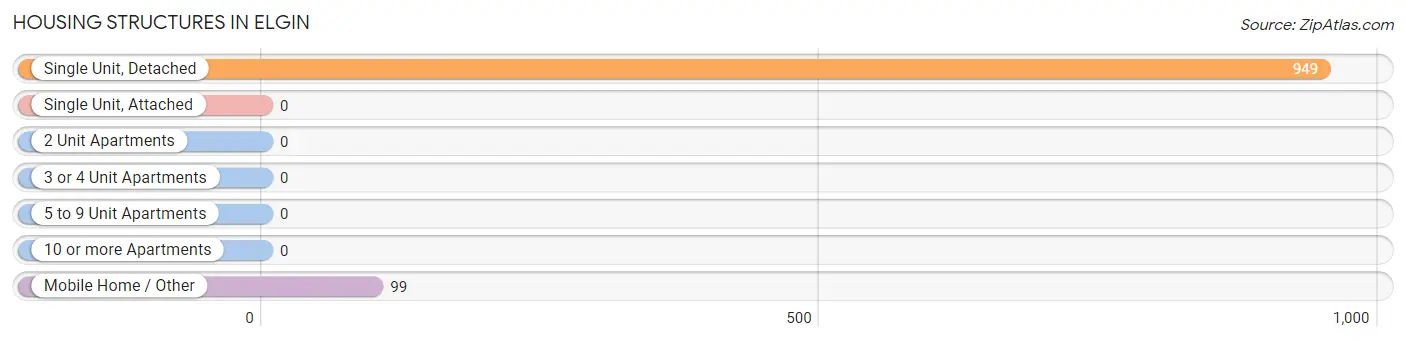
| Structure Type | # Housing Units | % Housing Units |
| Single Unit, Detached | 949 | 90.5% |
| Single Unit, Attached | 0 | 0.0% |
| 2 Unit Apartments | 0 | 0.0% |
| 3 or 4 Unit Apartments | 0 | 0.0% |
| 5 to 9 Unit Apartments | 0 | 0.0% |
| 10 or more Apartments | 0 | 0.0% |
| Mobile Home / Other | 99 | 9.5% |
| Total | 1,048 | 100.0% |
Housing Structures by Occupancy in Elgin
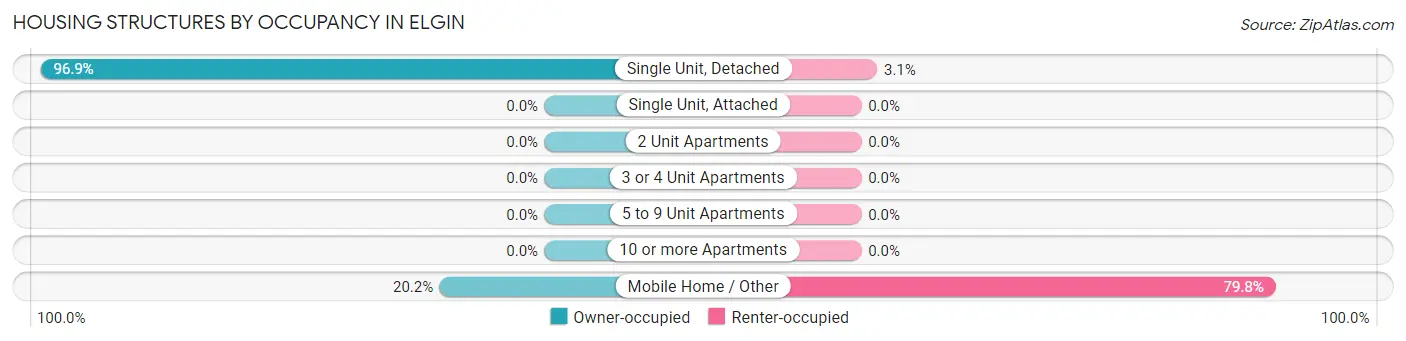
| Structure Type | Owner-occupied | Renter-occupied |
| Single Unit, Detached | 920 (96.9%) | 29 (3.1%) |
| Single Unit, Attached | 0 (0.0%) | 0 (0.0%) |
| 2 Unit Apartments | 0 (0.0%) | 0 (0.0%) |
| 3 or 4 Unit Apartments | 0 (0.0%) | 0 (0.0%) |
| 5 to 9 Unit Apartments | 0 (0.0%) | 0 (0.0%) |
| 10 or more Apartments | 0 (0.0%) | 0 (0.0%) |
| Mobile Home / Other | 20 (20.2%) | 79 (79.8%) |
| Total | 940 (89.7%) | 108 (10.3%) |
Housing Structures by Number of Rooms in Elgin
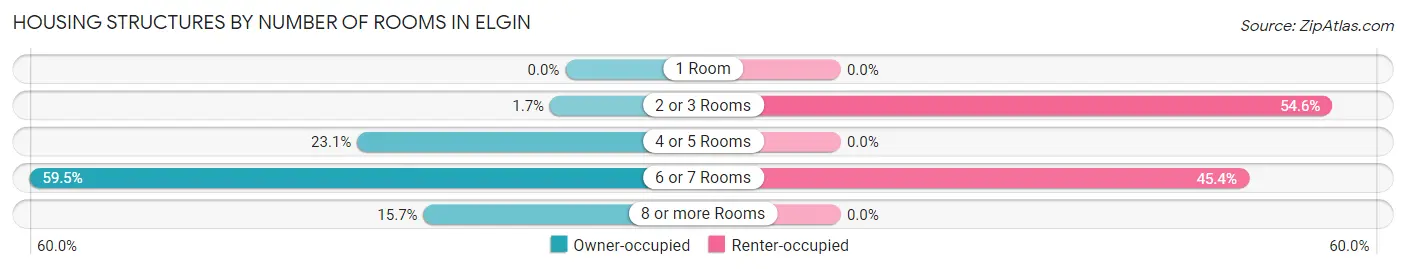
| Number of Rooms | Owner-occupied | Renter-occupied |
| 1 Room | 0 (0.0%) | 0 (0.0%) |
| 2 or 3 Rooms | 16 (1.7%) | 59 (54.6%) |
| 4 or 5 Rooms | 217 (23.1%) | 0 (0.0%) |
| 6 or 7 Rooms | 559 (59.5%) | 49 (45.4%) |
| 8 or more Rooms | 148 (15.7%) | 0 (0.0%) |
| Total | 940 (100.0%) | 108 (100.0%) |
Housing Structure by Heating Type in Elgin
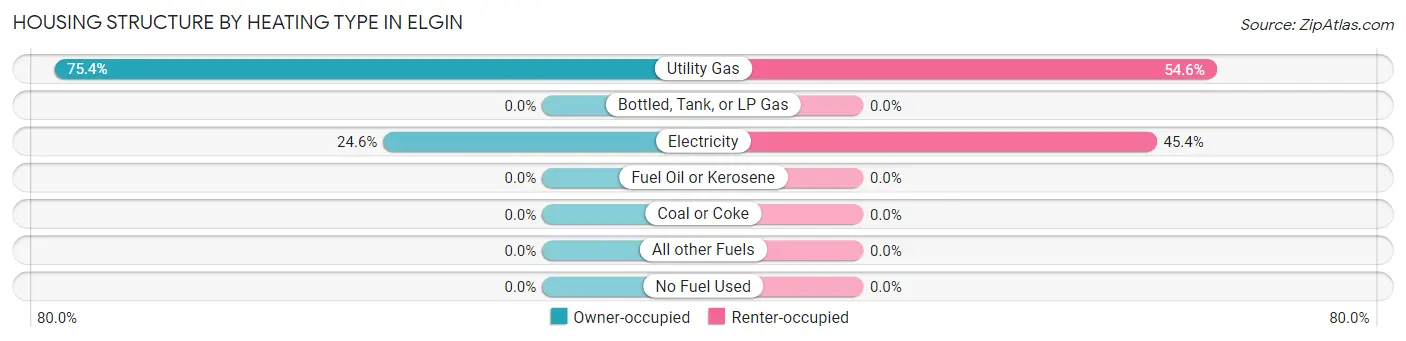
| Heating Type | Owner-occupied | Renter-occupied |
| Utility Gas | 709 (75.4%) | 59 (54.6%) |
| Bottled, Tank, or LP Gas | 0 (0.0%) | 0 (0.0%) |
| Electricity | 231 (24.6%) | 49 (45.4%) |
| Fuel Oil or Kerosene | 0 (0.0%) | 0 (0.0%) |
| Coal or Coke | 0 (0.0%) | 0 (0.0%) |
| All other Fuels | 0 (0.0%) | 0 (0.0%) |
| No Fuel Used | 0 (0.0%) | 0 (0.0%) |
| Total | 940 (100.0%) | 108 (100.0%) |
Household Vehicle Usage in Elgin
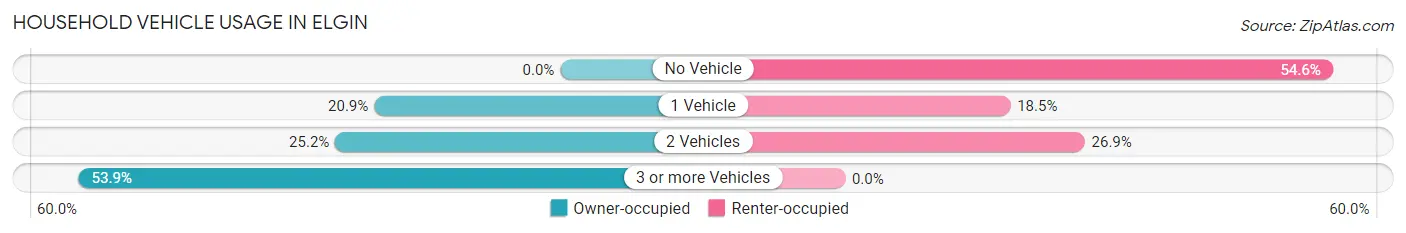
| Vehicles per Household | Owner-occupied | Renter-occupied |
| No Vehicle | 0 (0.0%) | 59 (54.6%) |
| 1 Vehicle | 196 (20.8%) | 20 (18.5%) |
| 2 Vehicles | 237 (25.2%) | 29 (26.9%) |
| 3 or more Vehicles | 507 (53.9%) | 0 (0.0%) |
| Total | 940 (100.0%) | 108 (100.0%) |
Real Estate & Mortgages in Elgin
Real Estate and Mortgage Overview in Elgin
| Characteristic | Without Mortgage | With Mortgage |
| Housing Units | 333 | 607 |
| Median Property Value | $150,400 | $182,600 |
| Median Household Income | $64,297 | $50 |
| Monthly Housing Costs | $374 | $0 |
| Real Estate Taxes | $810 | $0 |
Property Value by Mortgage Status in Elgin
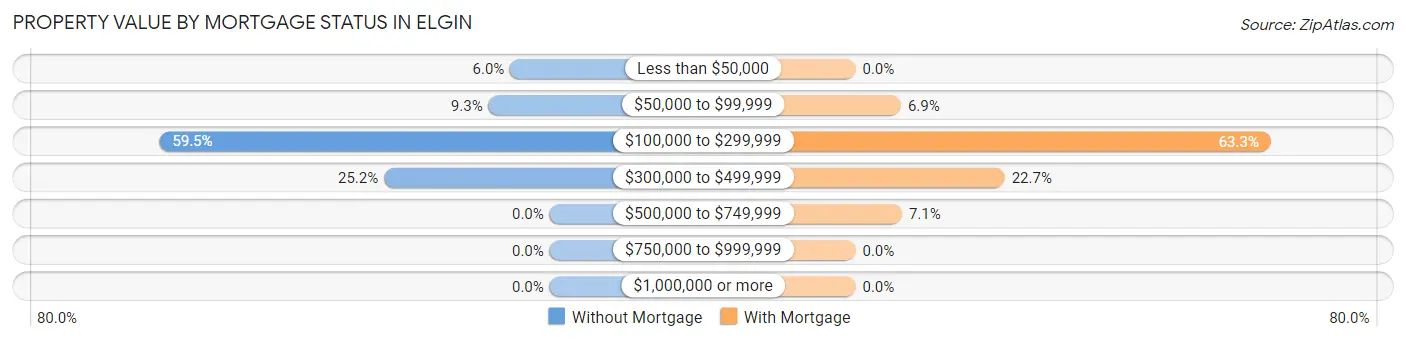
| Property Value | Without Mortgage | With Mortgage |
| Less than $50,000 | 20 (6.0%) | 0 (0.0%) |
| $50,000 to $99,999 | 31 (9.3%) | 42 (6.9%) |
| $100,000 to $299,999 | 198 (59.5%) | 384 (63.3%) |
| $300,000 to $499,999 | 84 (25.2%) | 138 (22.7%) |
| $500,000 to $749,999 | 0 (0.0%) | 43 (7.1%) |
| $750,000 to $999,999 | 0 (0.0%) | 0 (0.0%) |
| $1,000,000 or more | 0 (0.0%) | 0 (0.0%) |
| Total | 333 (100.0%) | 607 (100.0%) |
Household Income by Mortgage Status in Elgin
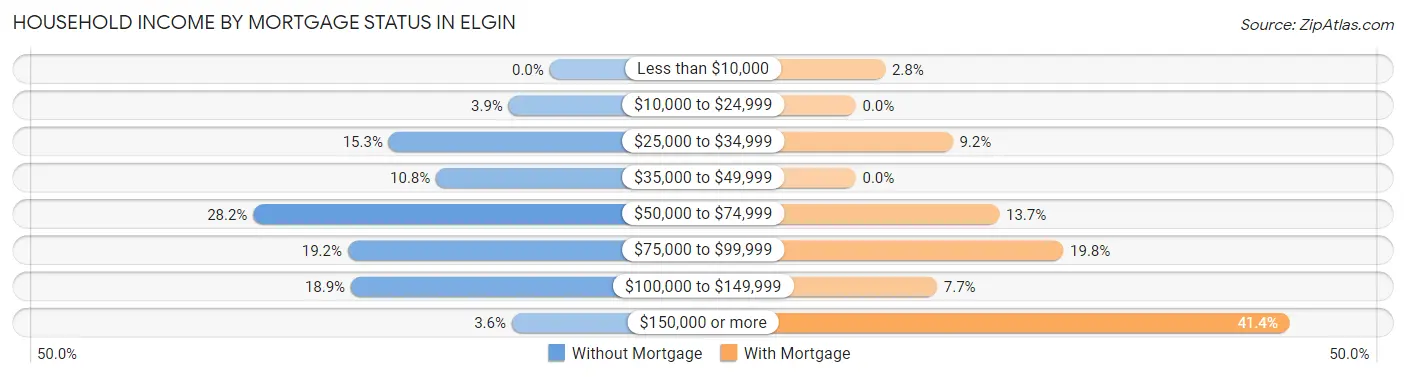
| Household Income | Without Mortgage | With Mortgage |
| Less than $10,000 | 0 (0.0%) | 17 (2.8%) |
| $10,000 to $24,999 | 13 (3.9%) | 0 (0.0%) |
| $25,000 to $34,999 | 51 (15.3%) | 56 (9.2%) |
| $35,000 to $49,999 | 36 (10.8%) | 0 (0.0%) |
| $50,000 to $74,999 | 94 (28.2%) | 83 (13.7%) |
| $75,000 to $99,999 | 64 (19.2%) | 120 (19.8%) |
| $100,000 to $149,999 | 63 (18.9%) | 47 (7.7%) |
| $150,000 or more | 12 (3.6%) | 251 (41.3%) |
| Total | 333 (100.0%) | 607 (100.0%) |
Property Value to Household Income Ratio in Elgin
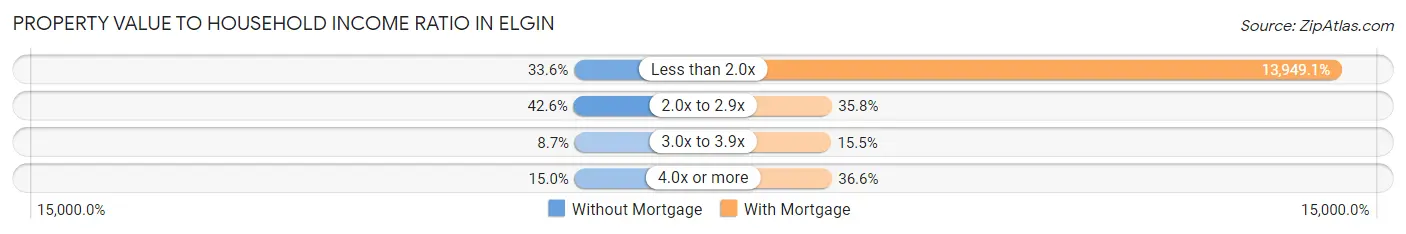
| Value-to-Income Ratio | Without Mortgage | With Mortgage |
| Less than 2.0x | 112 (33.6%) | 84,671 (13,949.1%) |
| 2.0x to 2.9x | 142 (42.6%) | 217 (35.7%) |
| 3.0x to 3.9x | 29 (8.7%) | 94 (15.5%) |
| 4.0x or more | 50 (15.0%) | 222 (36.6%) |
| Total | 333 (100.0%) | 607 (100.0%) |
Real Estate Taxes by Mortgage Status in Elgin
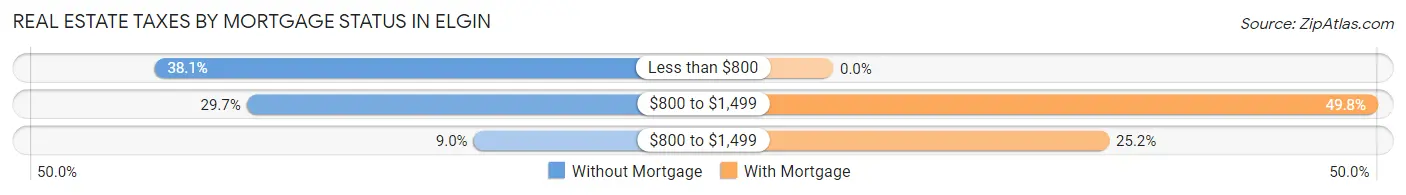
| Property Taxes | Without Mortgage | With Mortgage |
| Less than $800 | 127 (38.1%) | 0 (0.0%) |
| $800 to $1,499 | 99 (29.7%) | 302 (49.7%) |
| $800 to $1,499 | 30 (9.0%) | 153 (25.2%) |
| Total | 333 (100.0%) | 607 (100.0%) |
Health & Disability in Elgin
Health Insurance Coverage by Age in Elgin
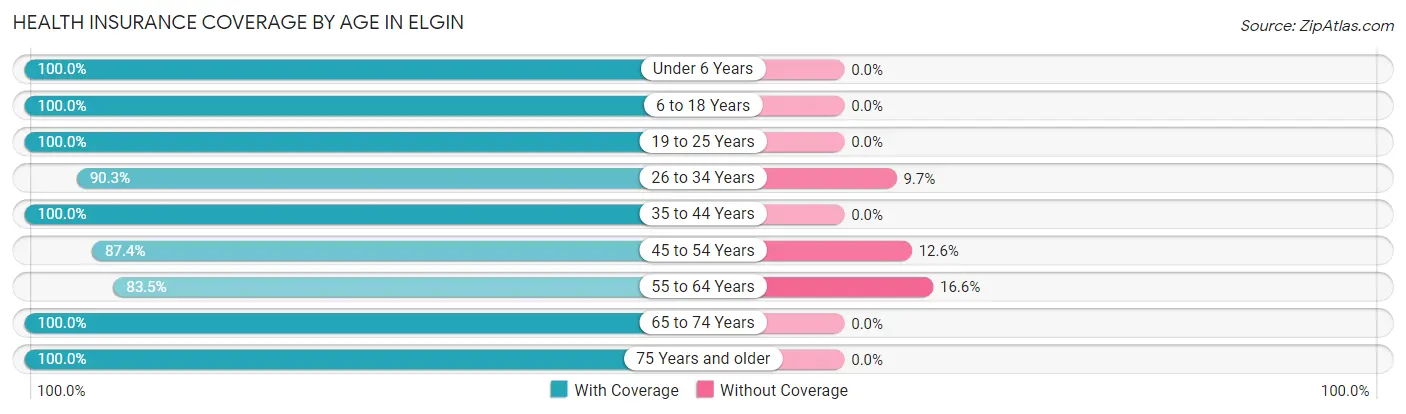
| Age Bracket | With Coverage | Without Coverage |
| Under 6 Years | 129 (100.0%) | 0 (0.0%) |
| 6 to 18 Years | 267 (100.0%) | 0 (0.0%) |
| 19 to 25 Years | 361 (100.0%) | 0 (0.0%) |
| 26 to 34 Years | 204 (90.3%) | 22 (9.7%) |
| 35 to 44 Years | 179 (100.0%) | 0 (0.0%) |
| 45 to 54 Years | 605 (87.4%) | 87 (12.6%) |
| 55 to 64 Years | 247 (83.5%) | 49 (16.6%) |
| 65 to 74 Years | 356 (100.0%) | 0 (0.0%) |
| 75 Years and older | 376 (100.0%) | 0 (0.0%) |
| Total | 2,724 (94.5%) | 158 (5.5%) |
Health Insurance Coverage by Citizenship Status in Elgin
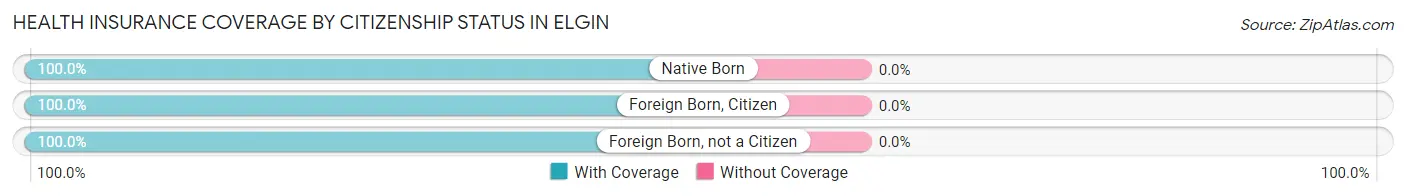
| Citizenship Status | With Coverage | Without Coverage |
| Native Born | 129 (100.0%) | 0 (0.0%) |
| Foreign Born, Citizen | 267 (100.0%) | 0 (0.0%) |
| Foreign Born, not a Citizen | 361 (100.0%) | 0 (0.0%) |
Health Insurance Coverage by Household Income in Elgin
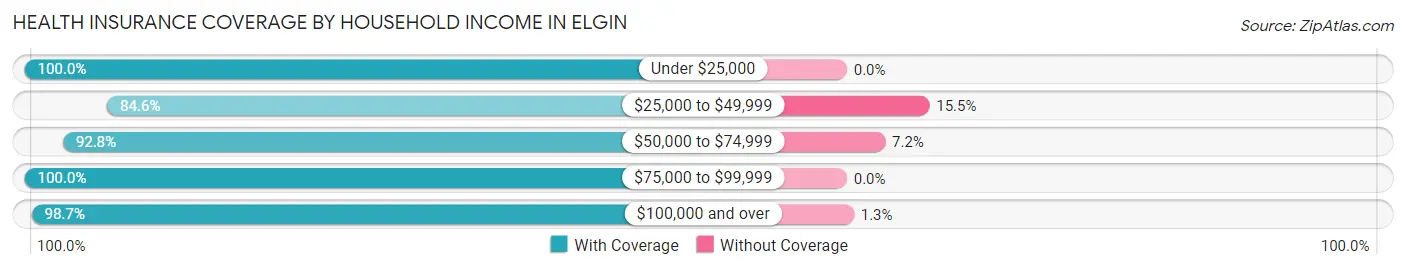
| Household Income | With Coverage | Without Coverage |
| Under $25,000 | 189 (100.0%) | 0 (0.0%) |
| $25,000 to $49,999 | 569 (84.6%) | 104 (15.4%) |
| $50,000 to $74,999 | 505 (92.8%) | 39 (7.2%) |
| $75,000 to $99,999 | 335 (100.0%) | 0 (0.0%) |
| $100,000 and over | 1,126 (98.7%) | 15 (1.3%) |
Public vs Private Health Insurance Coverage by Age in Elgin
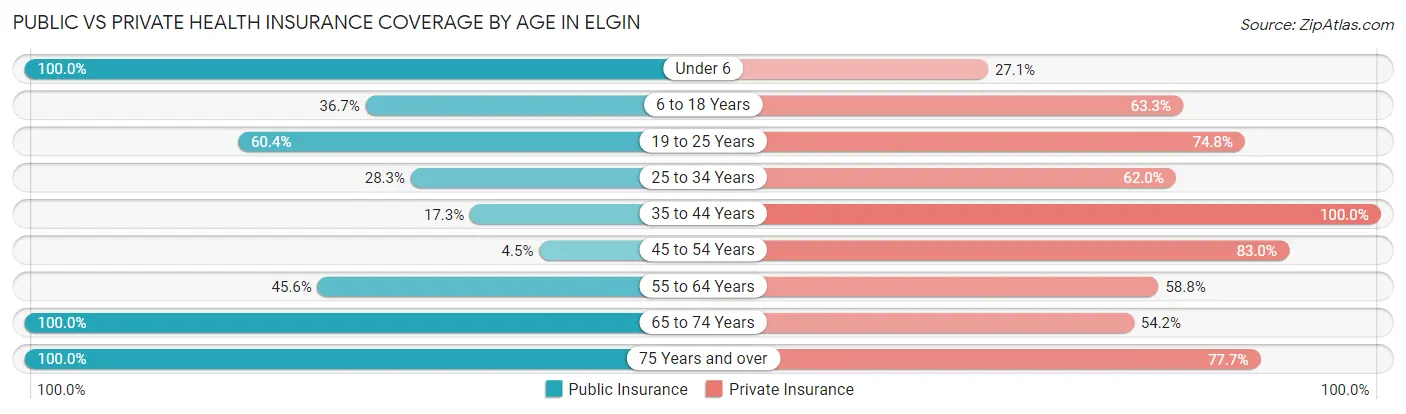
| Age Bracket | Public Insurance | Private Insurance |
| Under 6 | 129 (100.0%) | 35 (27.1%) |
| 6 to 18 Years | 98 (36.7%) | 169 (63.3%) |
| 19 to 25 Years | 218 (60.4%) | 270 (74.8%) |
| 25 to 34 Years | 64 (28.3%) | 140 (62.0%) |
| 35 to 44 Years | 31 (17.3%) | 179 (100.0%) |
| 45 to 54 Years | 31 (4.5%) | 574 (83.0%) |
| 55 to 64 Years | 135 (45.6%) | 174 (58.8%) |
| 65 to 74 Years | 356 (100.0%) | 193 (54.2%) |
| 75 Years and over | 376 (100.0%) | 292 (77.7%) |
| Total | 1,438 (49.9%) | 2,026 (70.3%) |
Disability Status by Sex by Age in Elgin
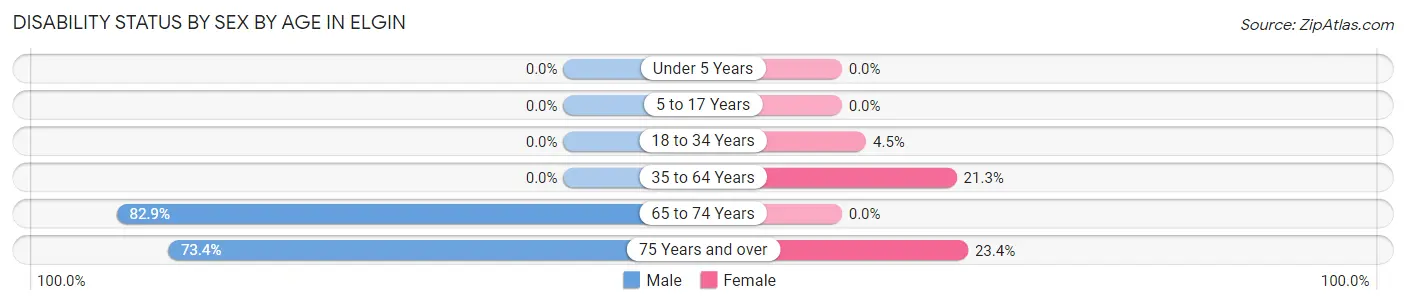
| Age Bracket | Male | Female |
| Under 5 Years | 0 (0.0%) | 0 (0.0%) |
| 5 to 17 Years | 0 (0.0%) | 0 (0.0%) |
| 18 to 34 Years | 0 (0.0%) | 13 (4.5%) |
| 35 to 64 Years | 0 (0.0%) | 129 (21.3%) |
| 65 to 74 Years | 136 (82.9%) | 0 (0.0%) |
| 75 Years and over | 113 (73.4%) | 52 (23.4%) |
Disability Class by Sex by Age in Elgin
Disability Class: Hearing Difficulty
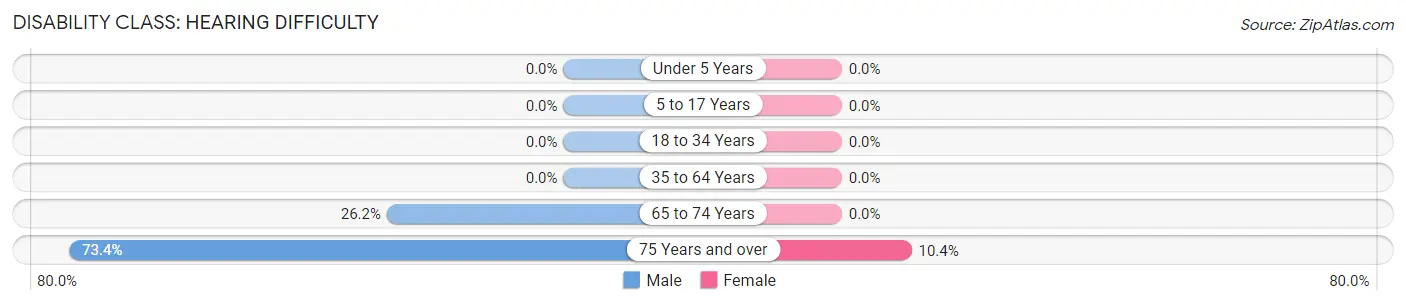
| Age Bracket | Male | Female |
| Under 5 Years | 0 (0.0%) | 0 (0.0%) |
| 5 to 17 Years | 0 (0.0%) | 0 (0.0%) |
| 18 to 34 Years | 0 (0.0%) | 0 (0.0%) |
| 35 to 64 Years | 0 (0.0%) | 0 (0.0%) |
| 65 to 74 Years | 43 (26.2%) | 0 (0.0%) |
| 75 Years and over | 113 (73.4%) | 23 (10.4%) |
Disability Class: Vision Difficulty
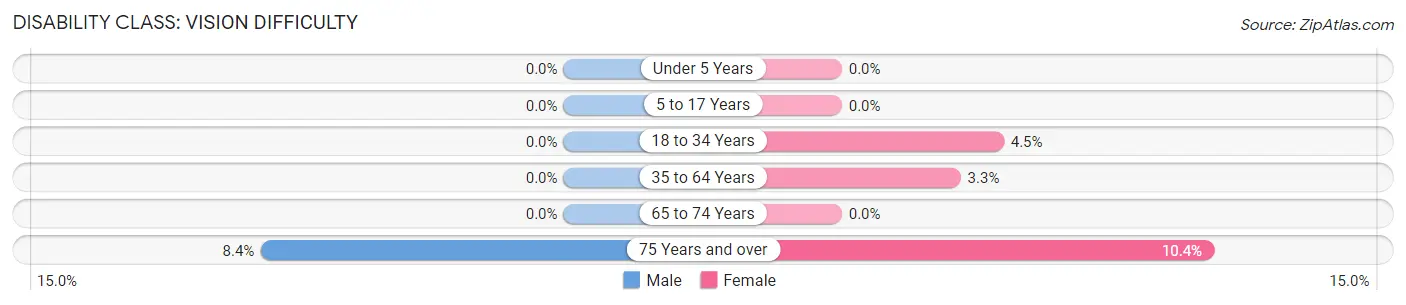
| Age Bracket | Male | Female |
| Under 5 Years | 0 (0.0%) | 0 (0.0%) |
| 5 to 17 Years | 0 (0.0%) | 0 (0.0%) |
| 18 to 34 Years | 0 (0.0%) | 13 (4.5%) |
| 35 to 64 Years | 0 (0.0%) | 20 (3.3%) |
| 65 to 74 Years | 0 (0.0%) | 0 (0.0%) |
| 75 Years and over | 13 (8.4%) | 23 (10.4%) |
Disability Class: Cognitive Difficulty
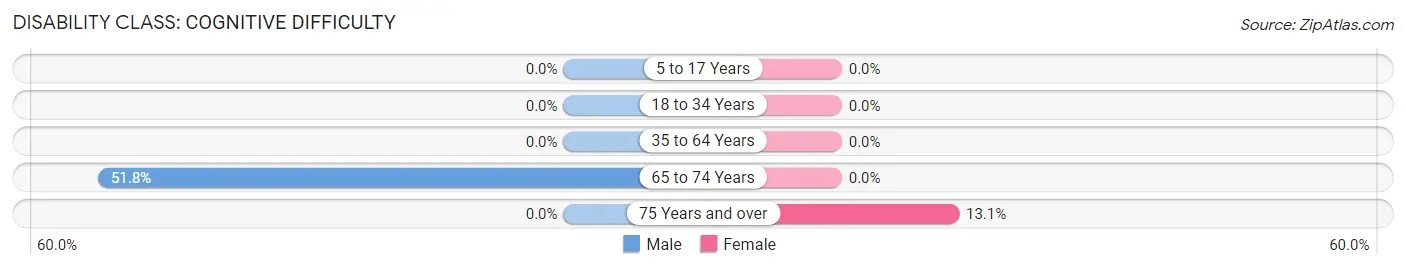
| Age Bracket | Male | Female |
| 5 to 17 Years | 0 (0.0%) | 0 (0.0%) |
| 18 to 34 Years | 0 (0.0%) | 0 (0.0%) |
| 35 to 64 Years | 0 (0.0%) | 0 (0.0%) |
| 65 to 74 Years | 85 (51.8%) | 0 (0.0%) |
| 75 Years and over | 0 (0.0%) | 29 (13.1%) |
Disability Class: Ambulatory Difficulty
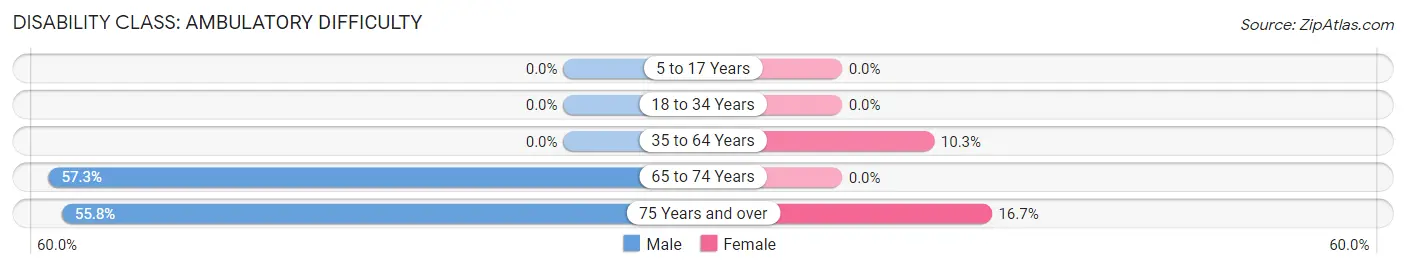
| Age Bracket | Male | Female |
| 5 to 17 Years | 0 (0.0%) | 0 (0.0%) |
| 18 to 34 Years | 0 (0.0%) | 0 (0.0%) |
| 35 to 64 Years | 0 (0.0%) | 62 (10.2%) |
| 65 to 74 Years | 94 (57.3%) | 0 (0.0%) |
| 75 Years and over | 86 (55.8%) | 37 (16.7%) |
Disability Class: Self-Care Difficulty
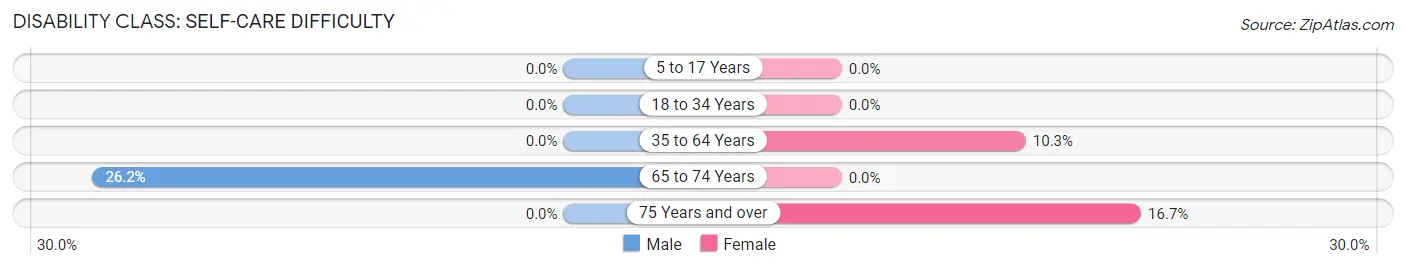
| Age Bracket | Male | Female |
| 5 to 17 Years | 0 (0.0%) | 0 (0.0%) |
| 18 to 34 Years | 0 (0.0%) | 0 (0.0%) |
| 35 to 64 Years | 0 (0.0%) | 62 (10.2%) |
| 65 to 74 Years | 43 (26.2%) | 0 (0.0%) |
| 75 Years and over | 0 (0.0%) | 37 (16.7%) |
Technology Access in Elgin
Computing Device Access in Elgin
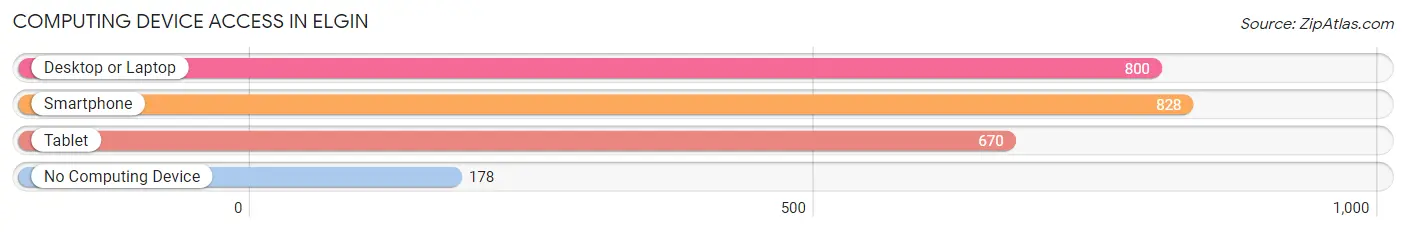
| Device Type | # Households | % Households |
| Desktop or Laptop | 800 | 76.3% |
| Smartphone | 828 | 79.0% |
| Tablet | 670 | 63.9% |
| No Computing Device | 178 | 17.0% |
| Total | 1,048 | 100.0% |
Internet Access in Elgin
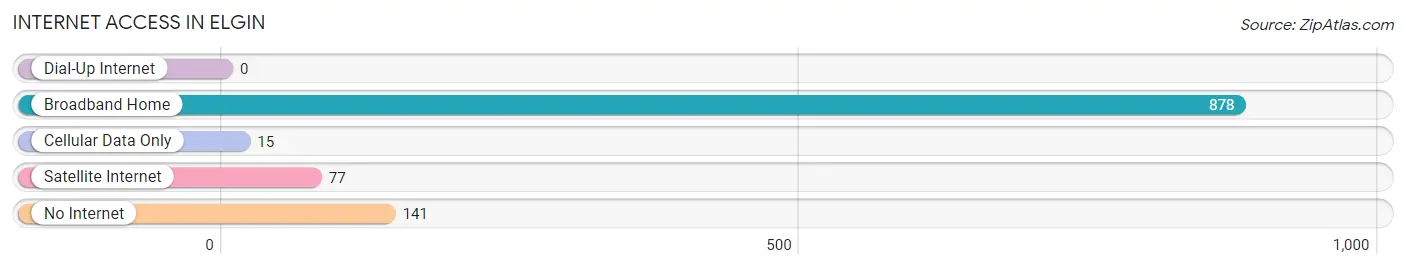
| Internet Type | # Households | % Households |
| Dial-Up Internet | 0 | 0.0% |
| Broadband Home | 878 | 83.8% |
| Cellular Data Only | 15 | 1.4% |
| Satellite Internet | 77 | 7.3% |
| No Internet | 141 | 13.5% |
| Total | 1,048 | 100.0% |
Elgin Summary
Elgin, South Carolina is a small town located in Kershaw County, approximately 20 miles east of Columbia, the state capital. The town was founded in 1872 and is named after the Scottish town of Elgin. Elgin is a rural community with a population of approximately 2,000 people.
Geography
Elgin is located in the Midlands region of South Carolina, in the Piedmont region of the United States. The town is situated on the banks of the Wateree River, which is a tributary of the Congaree River. The town is located in the Sandhills region of the state, which is characterized by sandy soils and rolling hills. The town is located at an elevation of approximately 200 feet above sea level.
The climate in Elgin is humid subtropical, with hot, humid summers and mild winters. The average annual temperature is around 70 degrees Fahrenheit, with an average high of around 90 degrees in the summer and an average low of around 50 degrees in the winter. The average annual precipitation is around 45 inches, with most of the precipitation occurring in the summer months.
Economy
The economy of Elgin is largely based on agriculture and manufacturing. The town is home to several large farms, which produce a variety of crops, including cotton, soybeans, corn, and wheat. The town is also home to several manufacturing companies, which produce a variety of products, including furniture, textiles, and automotive parts.
The town is also home to several small businesses, including restaurants, retail stores, and service providers. The town is also home to several educational institutions, including a public elementary school, a middle school, and a high school.
Demographics
As of the 2010 census, the population of Elgin was 2,000 people. The racial makeup of the town was 79.2% White, 17.2% African American, 0.7% Native American, 0.7% Asian, 0.2% Pacific Islander, and 1.9% from other races. The median household income was $37,500, and the median family income was $45,000.
The town is home to a variety of religious denominations, including Baptist, Methodist, Presbyterian, and Catholic. The town is also home to a variety of cultural and recreational activities, including festivals, parades, and sporting events.
Conclusion
Elgin, South Carolina is a small rural town located in the Midlands region of the state. The town is situated on the banks of the Wateree River and is characterized by sandy soils and rolling hills. The economy of Elgin is largely based on agriculture and manufacturing, and the town is home to several small businesses, educational institutions, and religious denominations. The population of Elgin is approximately 2,000 people, and the racial makeup of the town is 79.2% White, 17.2% African American, 0.7% Native American, 0.7% Asian, 0.2% Pacific Islander, and 1.9% from other races. The town is home to a variety of cultural and recreational activities, including festivals, parades, and sporting events.
Common Questions
What is Per Capita Income in Elgin?
Per Capita income in Elgin is $31,484.
What is the Median Family Income in Elgin?
Median Family Income in Elgin is $63,750.
What is the Median Household income in Elgin?
Median Household Income in Elgin is $72,898.
What is Income or Wage Gap in Elgin?
Income or Wage Gap in Elgin is 24.2%.
Women in Elgin earn 75.8 cents for every dollar earned by a man.
What is Family Income Deficit in Elgin?
Family Income Deficit in Elgin is $8,140.
Families that are below poverty line in Elgin earn $8,140 less on average than the poverty threshold level.
What is Inequality or Gini Index in Elgin?
Inequality or Gini Index in Elgin is 0.32.
What is the Total Population of Elgin?
Total Population of Elgin is 2,882.
What is the Total Male Population of Elgin?
Total Male Population of Elgin is 1,487.
What is the Total Female Population of Elgin?
Total Female Population of Elgin is 1,395.
What is the Ratio of Males per 100 Females in Elgin?
There are 106.59 Males per 100 Females in Elgin.
What is the Ratio of Females per 100 Males in Elgin?
There are 93.81 Females per 100 Males in Elgin.
What is the Median Population Age in Elgin?
Median Population Age in Elgin is 47.9 Years.
What is the Average Family Size in Elgin
Average Family Size in Elgin is 2.9 People.
What is the Average Household Size in Elgin
Average Household Size in Elgin is 2.8 People.
How Large is the Labor Force in Elgin?
There are 1,498 People in the Labor Forcein in Elgin.
What is the Percentage of People in the Labor Force in Elgin?
56.6% of People are in the Labor Force in Elgin.
What is the Unemployment Rate in Elgin?
Unemployment Rate in Elgin is 2.4%.