Zip Codes with the Highest Percentage of Population Employed in Computer & Mathematics in Bethlehem, PA
RELATED REPORTS & OPTIONS
Computer & Mathematics
Bethlehem
Compare Zip Codes
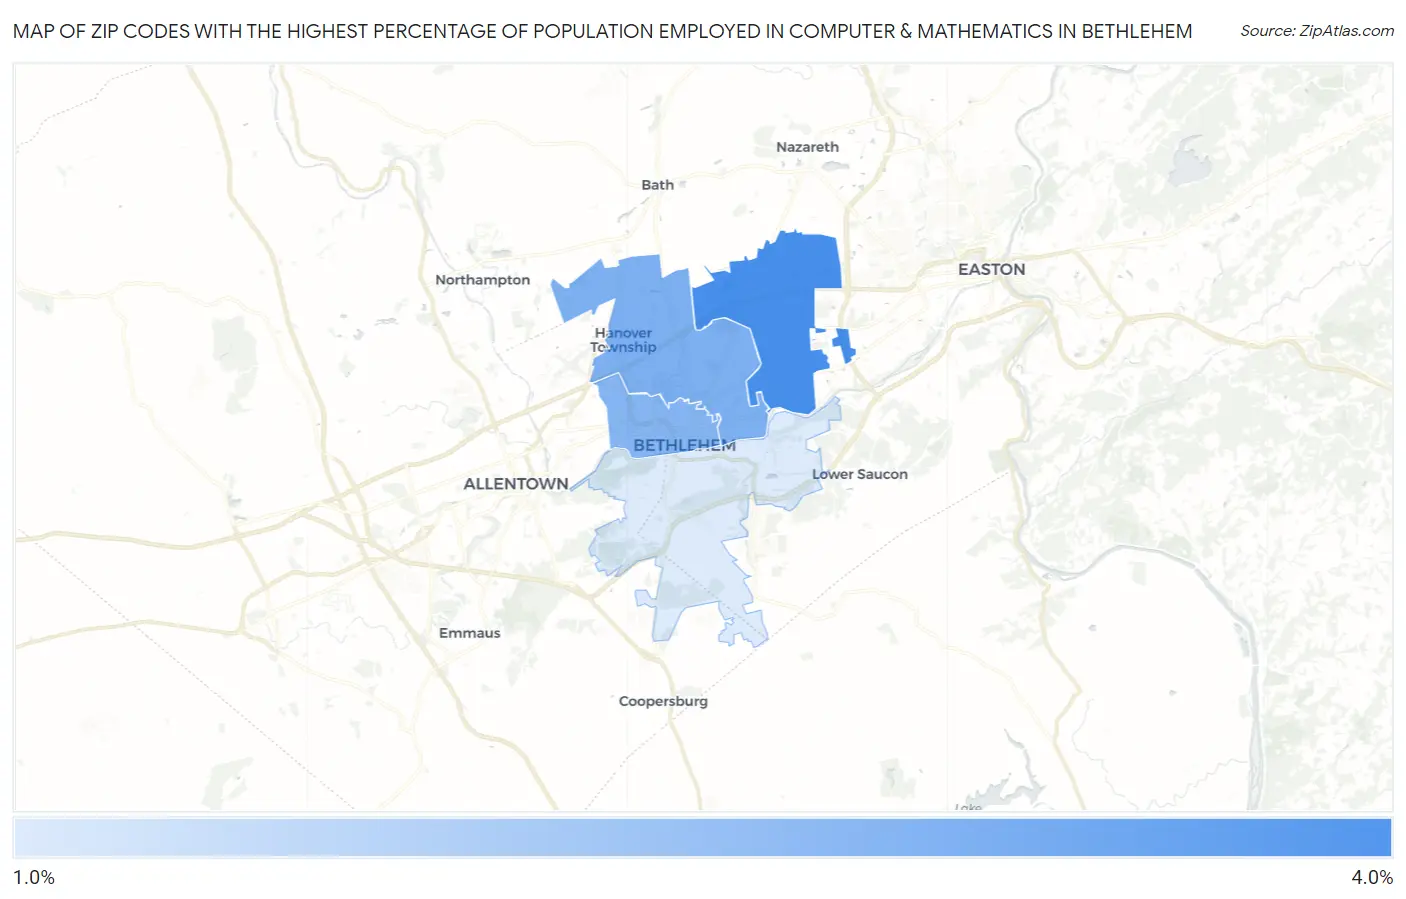
Map of Zip Codes with the Highest Percentage of Population Employed in Computer & Mathematics in Bethlehem
1.7%
3.3%
Zip Codes with the Highest Percentage of Population Employed in Computer & Mathematics in Bethlehem, PA
| Zip Code | % Employed | vs State | vs National | |
| 1. | 18020 | 3.3% | 3.3%(+0.030)#373 | 3.5%(-0.218)#6,755 |
| 2. | 18017 | 2.7% | 3.3%(-0.535)#480 | 3.5%(-0.783)#8,666 |
| 3. | 18018 | 2.6% | 3.3%(-0.642)#504 | 3.5%(-0.891)#9,087 |
| 4. | 18015 | 1.7% | 3.3%(-1.58)#727 | 3.5%(-1.82)#13,244 |
1
Common Questions
What are the Top 3 Zip Codes with the Highest Percentage of Population Employed in Computer & Mathematics in Bethlehem, PA?
Top 3 Zip Codes with the Highest Percentage of Population Employed in Computer & Mathematics in Bethlehem, PA are:
What zip code has the Highest Percentage of Population Employed in Computer & Mathematics in Bethlehem, PA?
18020 has the Highest Percentage of Population Employed in Computer & Mathematics in Bethlehem, PA with 3.3%.
What is the Percentage of Population Employed in Computer & Mathematics in Bethlehem, PA?
Percentage of Population Employed in Computer & Mathematics in Bethlehem is 2.5%.
What is the Percentage of Population Employed in Computer & Mathematics in Pennsylvania?
Percentage of Population Employed in Computer & Mathematics in Pennsylvania is 3.3%.
What is the Percentage of Population Employed in Computer & Mathematics in the United States?
Percentage of Population Employed in Computer & Mathematics in the United States is 3.5%.