Zip Codes with the Highest Percentage of Population Employed in Computer & Mathematics in Butler, PA
RELATED REPORTS & OPTIONS
Computer & Mathematics
Butler
Compare Zip Codes
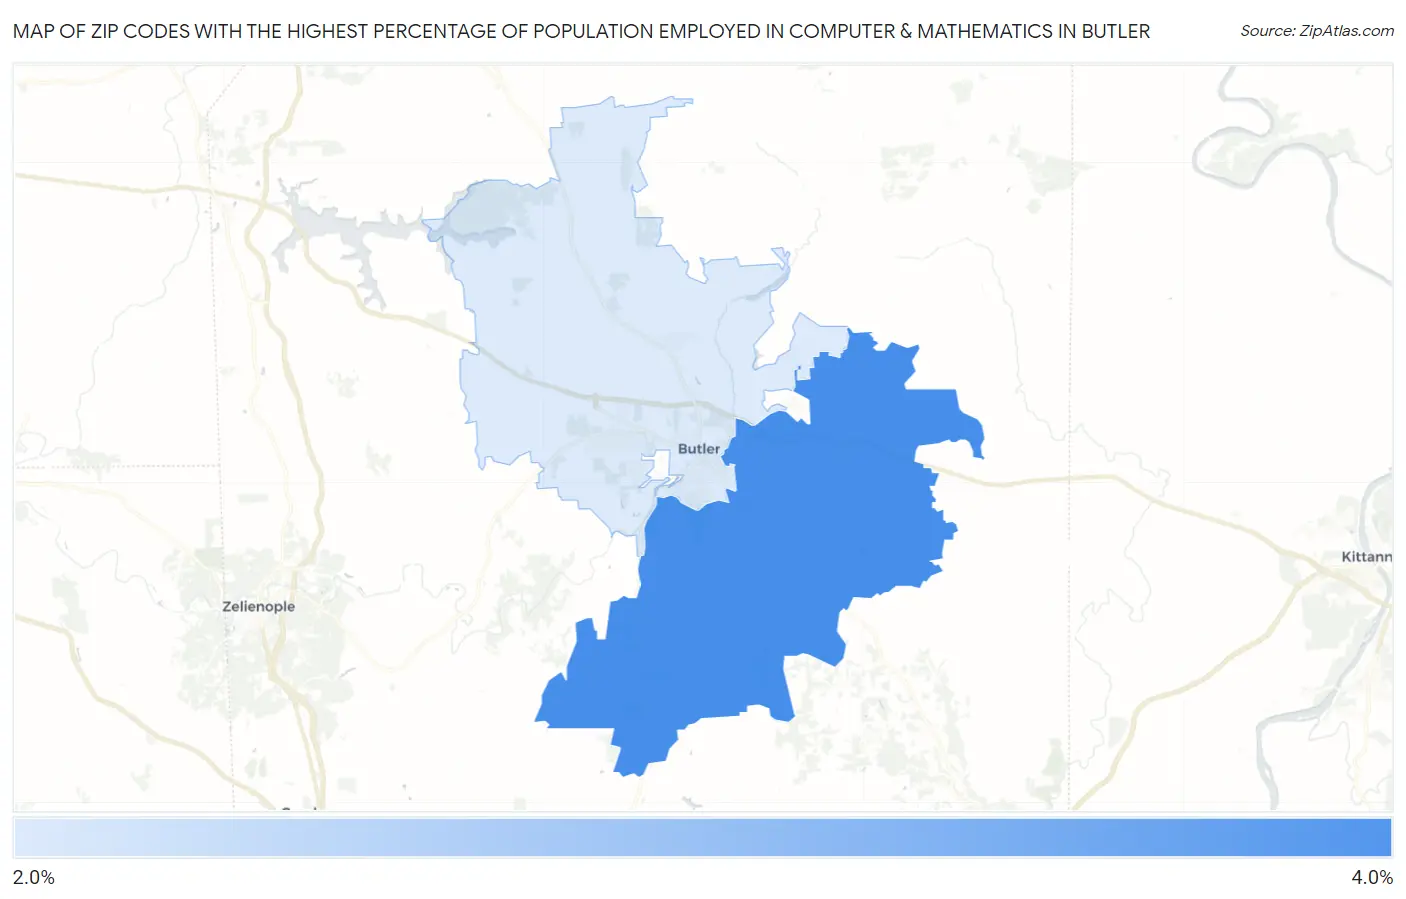
Map of Zip Codes with the Highest Percentage of Population Employed in Computer & Mathematics in Butler
2.9%
4.0%
Zip Codes with the Highest Percentage of Population Employed in Computer & Mathematics in Butler, PA
| Zip Code | % Employed | vs State | vs National | |
| 1. | 16002 | 4.0% | 3.3%(+0.675)#277 | 3.5%(+0.427)#5,150 |
| 2. | 16001 | 2.9% | 3.3%(-0.387)#444 | 3.5%(-0.636)#8,143 |
1
Common Questions
What are the Top Zip Codes with the Highest Percentage of Population Employed in Computer & Mathematics in Butler, PA?
Top Zip Codes with the Highest Percentage of Population Employed in Computer & Mathematics in Butler, PA are:
What zip code has the Highest Percentage of Population Employed in Computer & Mathematics in Butler, PA?
16002 has the Highest Percentage of Population Employed in Computer & Mathematics in Butler, PA with 4.0%.
What is the Percentage of Population Employed in Computer & Mathematics in Butler, PA?
Percentage of Population Employed in Computer & Mathematics in Butler is 1.5%.
What is the Percentage of Population Employed in Computer & Mathematics in Pennsylvania?
Percentage of Population Employed in Computer & Mathematics in Pennsylvania is 3.3%.
What is the Percentage of Population Employed in Computer & Mathematics in the United States?
Percentage of Population Employed in Computer & Mathematics in the United States is 3.5%.