Zip Codes with the Highest Percentage of Population Employed in Installation, Maintenance & Repair in Pottstown, PA
RELATED REPORTS & OPTIONS
Installation, Maintenance & Repair
Pottstown
Compare Zip Codes
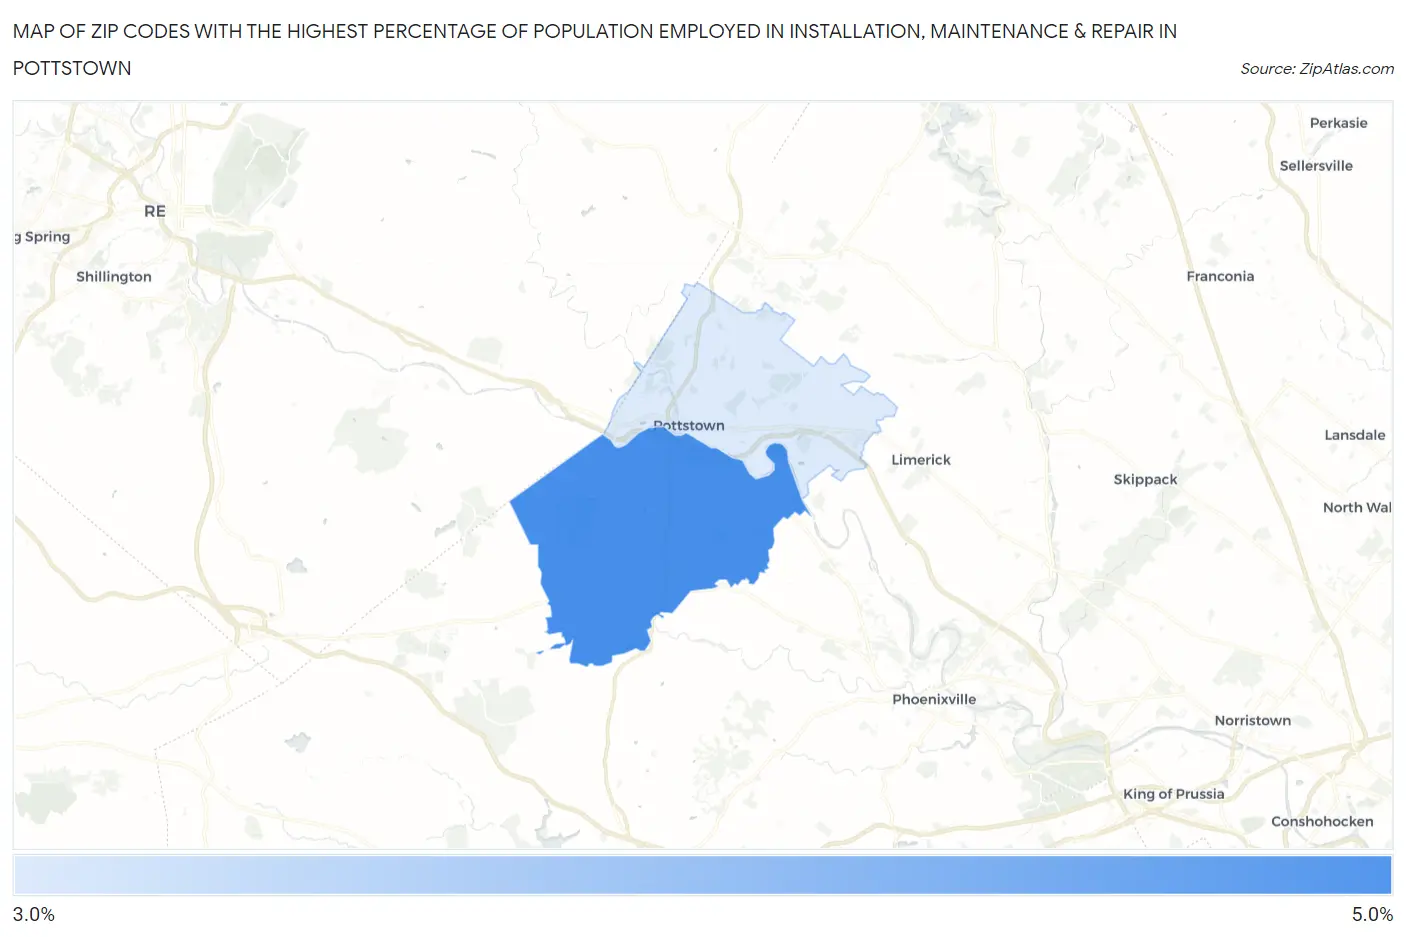
Map of Zip Codes with the Highest Percentage of Population Employed in Installation, Maintenance & Repair in Pottstown
3.4%
4.5%
Zip Codes with the Highest Percentage of Population Employed in Installation, Maintenance & Repair in Pottstown, PA
| Zip Code | % Employed | vs State | vs National | |
| 1. | 19465 | 4.5% | 3.1%(+1.38)#618 | 3.1%(+1.40)#10,539 |
| 2. | 19464 | 3.4% | 3.1%(+0.347)#897 | 3.1%(+0.371)#14,911 |
1
Common Questions
What are the Top Zip Codes with the Highest Percentage of Population Employed in Installation, Maintenance & Repair in Pottstown, PA?
Top Zip Codes with the Highest Percentage of Population Employed in Installation, Maintenance & Repair in Pottstown, PA are:
What zip code has the Highest Percentage of Population Employed in Installation, Maintenance & Repair in Pottstown, PA?
19465 has the Highest Percentage of Population Employed in Installation, Maintenance & Repair in Pottstown, PA with 4.5%.
What is the Percentage of Population Employed in Installation, Maintenance & Repair in Pennsylvania?
Percentage of Population Employed in Installation, Maintenance & Repair in Pennsylvania is 3.1%.
What is the Percentage of Population Employed in Installation, Maintenance & Repair in the United States?
Percentage of Population Employed in Installation, Maintenance & Repair in the United States is 3.1%.