Zip Codes with the Highest Percentage of Population Employed in Installation, Maintenance & Repair in Norristown, PA
RELATED REPORTS & OPTIONS
Installation, Maintenance & Repair
Norristown
Compare Zip Codes
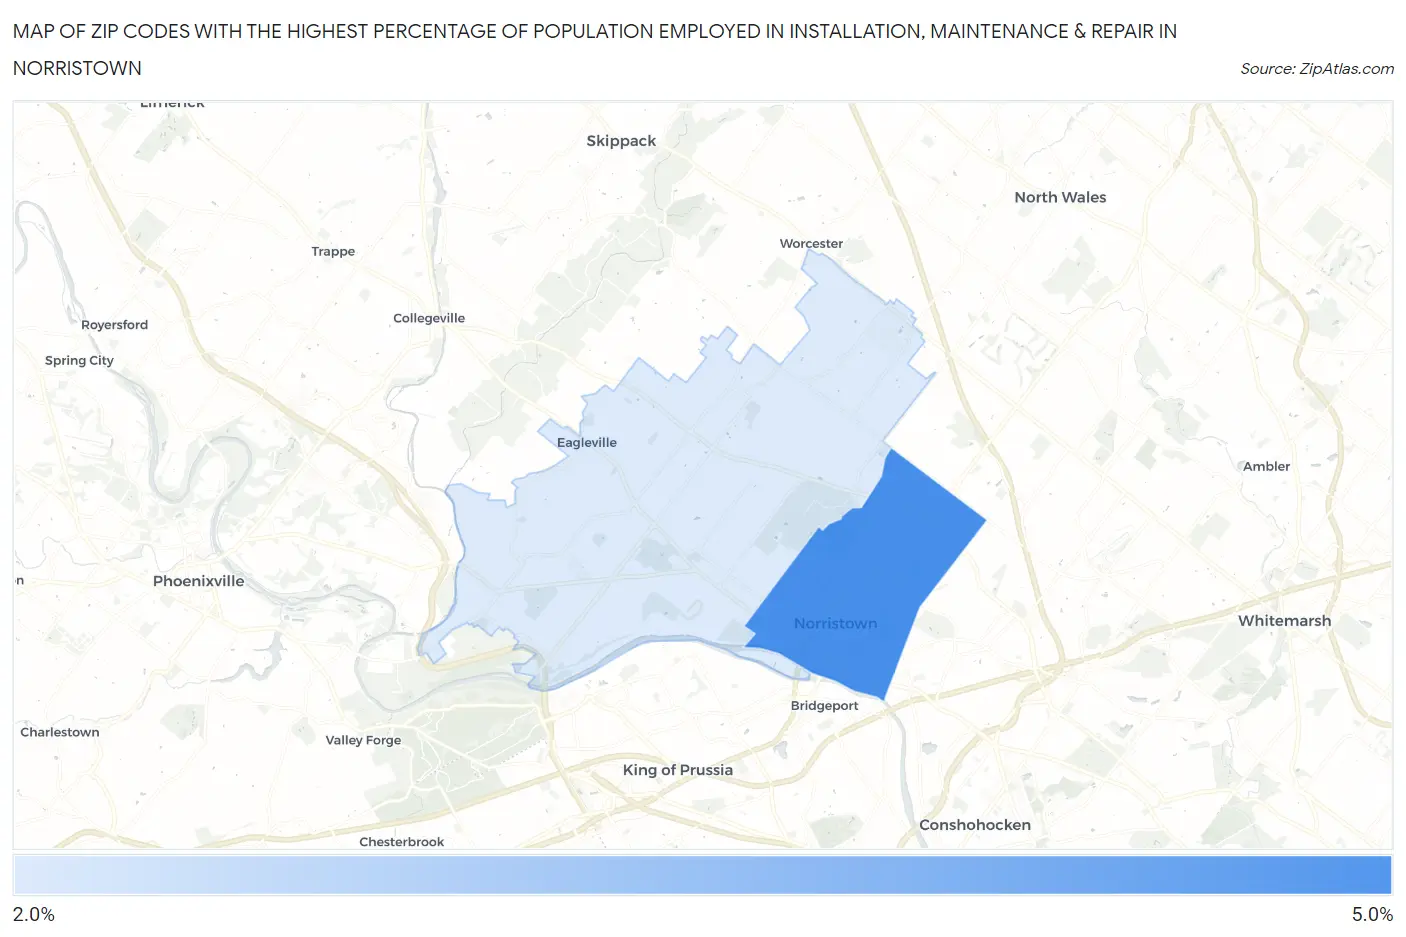
Map of Zip Codes with the Highest Percentage of Population Employed in Installation, Maintenance & Repair in Norristown
2.3%
4.3%
Zip Codes with the Highest Percentage of Population Employed in Installation, Maintenance & Repair in Norristown, PA
| Zip Code | % Employed | vs State | vs National | |
| 1. | 19401 | 4.3% | 3.1%(+1.25)#642 | 3.1%(+1.27)#11,008 |
| 2. | 19403 | 2.3% | 3.1%(-0.754)#1,151 | 3.1%(-0.729)#20,377 |
1
Common Questions
What are the Top Zip Codes with the Highest Percentage of Population Employed in Installation, Maintenance & Repair in Norristown, PA?
Top Zip Codes with the Highest Percentage of Population Employed in Installation, Maintenance & Repair in Norristown, PA are:
What zip code has the Highest Percentage of Population Employed in Installation, Maintenance & Repair in Norristown, PA?
19401 has the Highest Percentage of Population Employed in Installation, Maintenance & Repair in Norristown, PA with 4.3%.
What is the Percentage of Population Employed in Installation, Maintenance & Repair in Pennsylvania?
Percentage of Population Employed in Installation, Maintenance & Repair in Pennsylvania is 3.1%.
What is the Percentage of Population Employed in Installation, Maintenance & Repair in the United States?
Percentage of Population Employed in Installation, Maintenance & Repair in the United States is 3.1%.