Zip Codes with the Highest Percentage of Population Employed in Installation, Maintenance & Repair in West Chester, PA
RELATED REPORTS & OPTIONS
Installation, Maintenance & Repair
West Chester
Compare Zip Codes
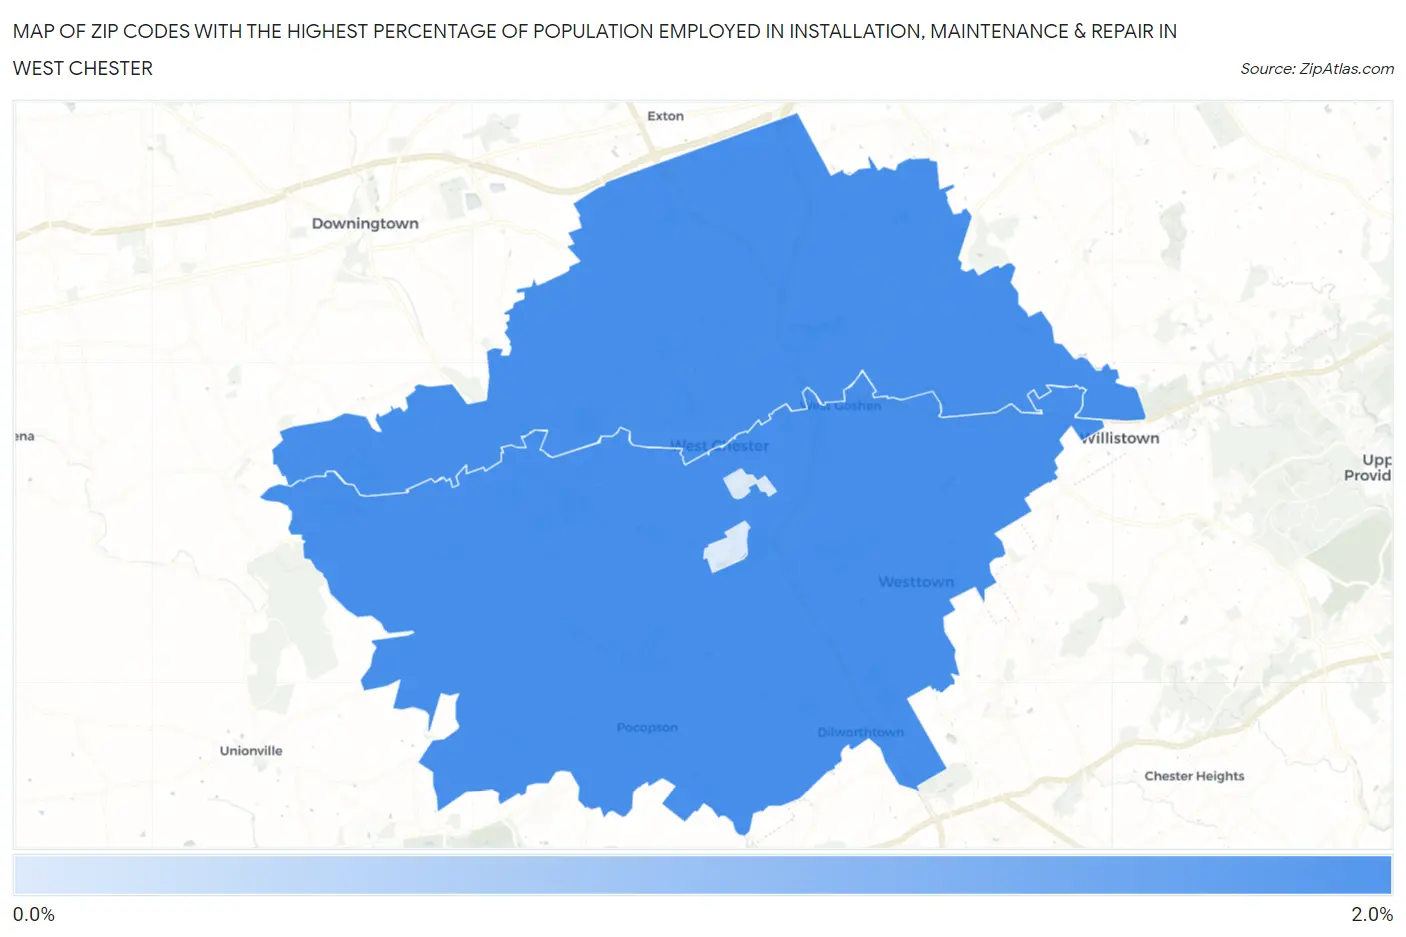
Map of Zip Codes with the Highest Percentage of Population Employed in Installation, Maintenance & Repair in West Chester
0.62%
1.8%
Zip Codes with the Highest Percentage of Population Employed in Installation, Maintenance & Repair in West Chester, PA
| Zip Code | % Employed | vs State | vs National | |
| 1. | 19382 | 1.8% | 3.1%(-1.28)#1,263 | 3.1%(-1.25)#22,820 |
| 2. | 19380 | 1.8% | 3.1%(-1.28)#1,265 | 3.1%(-1.25)#22,835 |
| 3. | 19383 | 0.62% | 3.1%(-2.47)#1,465 | 3.1%(-2.45)#26,962 |
1
Common Questions
What are the Top Zip Codes with the Highest Percentage of Population Employed in Installation, Maintenance & Repair in West Chester, PA?
Top Zip Codes with the Highest Percentage of Population Employed in Installation, Maintenance & Repair in West Chester, PA are:
What zip code has the Highest Percentage of Population Employed in Installation, Maintenance & Repair in West Chester, PA?
19382 has the Highest Percentage of Population Employed in Installation, Maintenance & Repair in West Chester, PA with 1.8%.
What is the Percentage of Population Employed in Installation, Maintenance & Repair in Pennsylvania?
Percentage of Population Employed in Installation, Maintenance & Repair in Pennsylvania is 3.1%.
What is the Percentage of Population Employed in Installation, Maintenance & Repair in the United States?
Percentage of Population Employed in Installation, Maintenance & Repair in the United States is 3.1%.