Zip Codes with the Highest Percentage of Population Employed in Computer, Engineering & Science in Delaware
RELATED REPORTS & OPTIONS
Computer, Engineering & Science
Delaware
Compare Zip Codes
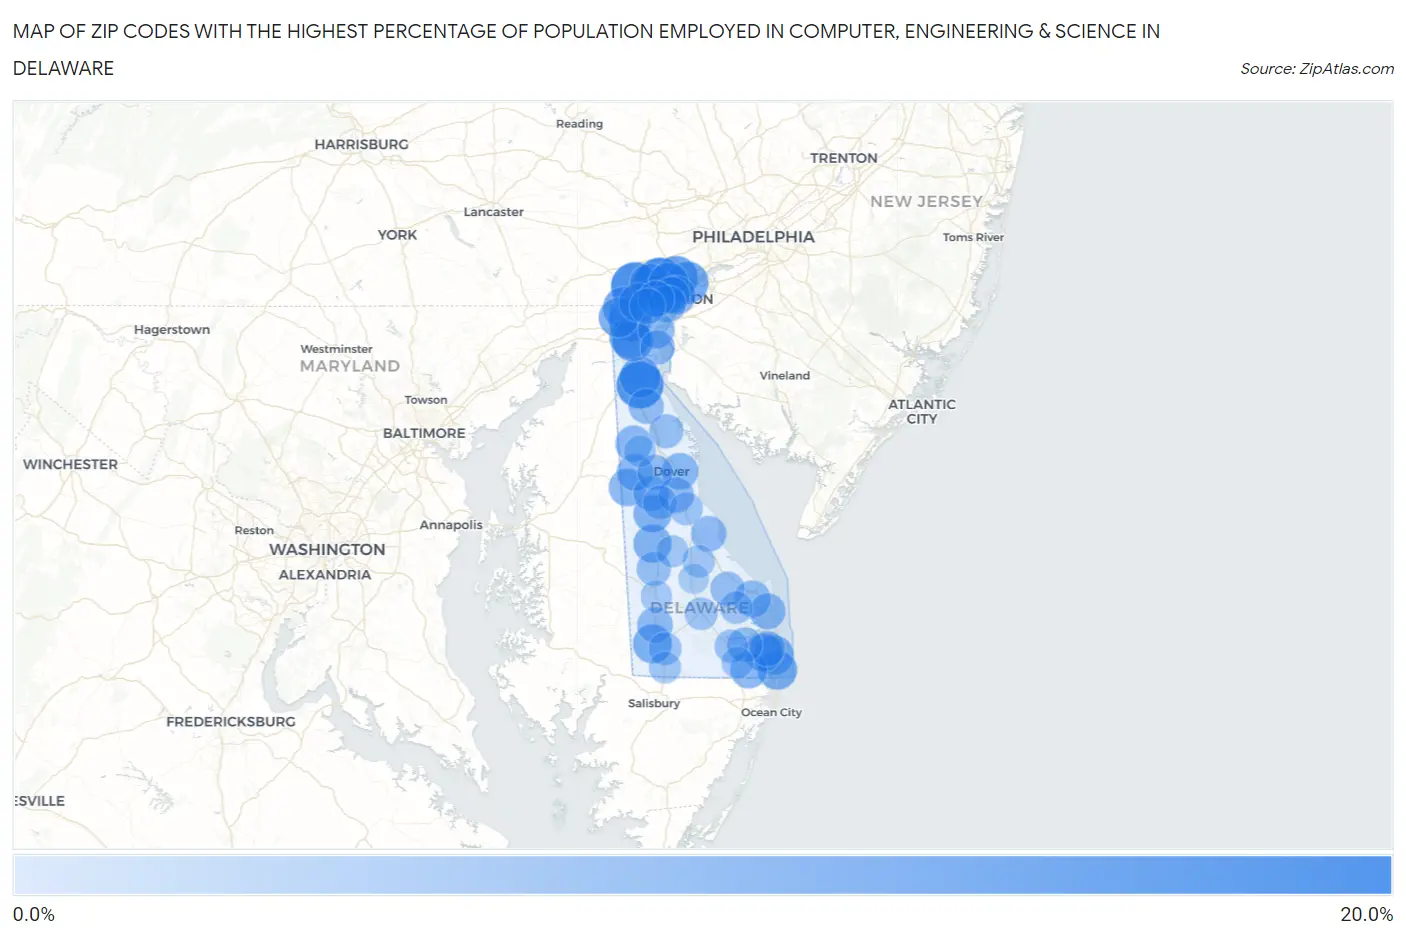
Map of Zip Codes with the Highest Percentage of Population Employed in Computer, Engineering & Science in Delaware
0.0%
20.0%
Zip Codes with the Highest Percentage of Population Employed in Computer, Engineering & Science in Delaware
| Zip Code | % Employed | vs State | vs National | |
| 1. | 19732 | 16.8% | 6.6%(+10.2)#1 | 6.8%(+10.0)#841 |
| 2. | 19707 | 15.3% | 6.6%(+8.75)#2 | 6.8%(+8.57)#1,064 |
| 3. | 19730 | 14.5% | 6.6%(+7.91)#3 | 6.8%(+7.74)#1,221 |
| 4. | 19810 | 11.0% | 6.6%(+4.45)#4 | 6.8%(+4.28)#2,545 |
| 5. | 19713 | 10.4% | 6.6%(+3.81)#5 | 6.8%(+3.64)#2,927 |
| 6. | 19703 | 10.1% | 6.6%(+3.51)#6 | 6.8%(+3.34)#3,151 |
| 7. | 19806 | 9.8% | 6.6%(+3.23)#7 | 6.8%(+3.06)#3,355 |
| 8. | 19711 | 9.6% | 6.6%(+3.00)#8 | 6.8%(+2.82)#3,532 |
| 9. | 19702 | 9.3% | 6.6%(+2.73)#9 | 6.8%(+2.56)#3,763 |
| 10. | 19709 | 9.0% | 6.6%(+2.46)#10 | 6.8%(+2.29)#4,015 |
| 11. | 19701 | 8.9% | 6.6%(+2.36)#11 | 6.8%(+2.18)#4,121 |
| 12. | 19807 | 8.5% | 6.6%(+1.96)#12 | 6.8%(+1.78)#4,553 |
| 13. | 19717 | 8.4% | 6.6%(+1.80)#13 | 6.8%(+1.62)#4,726 |
| 14. | 19803 | 8.3% | 6.6%(+1.73)#14 | 6.8%(+1.55)#4,840 |
| 15. | 19930 | 8.1% | 6.6%(+1.55)#15 | 6.8%(+1.38)#5,070 |
| 16. | 19944 | 7.9% | 6.6%(+1.34)#16 | 6.8%(+1.16)#5,372 |
| 17. | 19808 | 7.9% | 6.6%(+1.33)#17 | 6.8%(+1.16)#5,381 |
| 18. | 19931 | 7.6% | 6.6%(+0.973)#18 | 6.8%(+0.798)#5,894 |
| 19. | 19809 | 7.4% | 6.6%(+0.839)#19 | 6.8%(+0.664)#6,114 |
| 20. | 19952 | 6.9% | 6.6%(+0.263)#20 | 6.8%(+0.088)#7,060 |
| 21. | 19967 | 6.7% | 6.6%(+0.098)#21 | 6.8%(-0.077)#7,371 |
| 22. | 19943 | 6.7% | 6.6%(+0.096)#22 | 6.8%(-0.079)#7,374 |
| 23. | 19964 | 6.2% | 6.6%(-0.350)#23 | 6.8%(-0.524)#8,252 |
| 24. | 19802 | 5.8% | 6.6%(-0.798)#24 | 6.8%(-0.972)#9,313 |
| 25. | 19975 | 5.8% | 6.6%(-0.820)#25 | 6.8%(-0.995)#9,365 |
| 26. | 19801 | 5.7% | 6.6%(-0.877)#26 | 6.8%(-1.05)#9,526 |
| 27. | 19901 | 5.5% | 6.6%(-1.08)#27 | 6.8%(-1.26)#10,062 |
| 28. | 19953 | 5.5% | 6.6%(-1.09)#28 | 6.8%(-1.27)#10,075 |
| 29. | 19938 | 5.4% | 6.6%(-1.16)#29 | 6.8%(-1.34)#10,244 |
| 30. | 19958 | 5.4% | 6.6%(-1.17)#30 | 6.8%(-1.34)#10,267 |
| 31. | 19720 | 5.4% | 6.6%(-1.21)#31 | 6.8%(-1.39)#10,382 |
| 32. | 19805 | 5.2% | 6.6%(-1.40)#32 | 6.8%(-1.57)#10,837 |
| 33. | 19971 | 5.1% | 6.6%(-1.52)#33 | 6.8%(-1.70)#11,180 |
| 34. | 19804 | 5.0% | 6.6%(-1.60)#34 | 6.8%(-1.78)#11,418 |
| 35. | 19973 | 4.8% | 6.6%(-1.80)#35 | 6.8%(-1.97)#11,965 |
| 36. | 19934 | 4.7% | 6.6%(-1.92)#36 | 6.8%(-2.10)#12,304 |
| 37. | 19963 | 4.6% | 6.6%(-1.98)#37 | 6.8%(-2.16)#12,474 |
| 38. | 19962 | 4.6% | 6.6%(-2.04)#38 | 6.8%(-2.21)#12,657 |
| 39. | 19904 | 4.4% | 6.6%(-2.22)#39 | 6.8%(-2.40)#13,281 |
| 40. | 19734 | 4.3% | 6.6%(-2.30)#40 | 6.8%(-2.47)#13,521 |
| 41. | 19970 | 4.2% | 6.6%(-2.35)#41 | 6.8%(-2.52)#13,687 |
| 42. | 19939 | 4.1% | 6.6%(-2.44)#42 | 6.8%(-2.62)#14,025 |
| 43. | 19706 | 3.8% | 6.6%(-2.81)#43 | 6.8%(-2.98)#15,213 |
| 44. | 19950 | 3.5% | 6.6%(-3.07)#44 | 6.8%(-3.24)#16,188 |
| 45. | 19968 | 3.5% | 6.6%(-3.11)#45 | 6.8%(-3.29)#16,375 |
| 46. | 19979 | 3.4% | 6.6%(-3.19)#46 | 6.8%(-3.36)#16,637 |
| 47. | 19977 | 3.4% | 6.6%(-3.19)#47 | 6.8%(-3.37)#16,645 |
| 48. | 19966 | 2.8% | 6.6%(-3.81)#48 | 6.8%(-3.99)#18,955 |
| 49. | 19946 | 2.4% | 6.6%(-4.23)#49 | 6.8%(-4.40)#20,540 |
| 50. | 19956 | 2.3% | 6.6%(-4.28)#50 | 6.8%(-4.45)#20,710 |
| 51. | 19947 | 2.2% | 6.6%(-4.40)#51 | 6.8%(-4.57)#21,121 |
| 52. | 19951 | 2.1% | 6.6%(-4.48)#52 | 6.8%(-4.66)#21,446 |
| 53. | 19960 | 1.9% | 6.6%(-4.73)#53 | 6.8%(-4.91)#22,391 |
| 54. | 19954 | 1.6% | 6.6%(-4.95)#54 | 6.8%(-5.13)#23,146 |
| 55. | 19940 | 1.5% | 6.6%(-5.12)#55 | 6.8%(-5.29)#23,676 |
| 56. | 19945 | 1.4% | 6.6%(-5.16)#56 | 6.8%(-5.34)#23,820 |
| 57. | 19955 | 1.4% | 6.6%(-5.22)#57 | 6.8%(-5.39)#23,990 |
| 58. | 19933 | 1.2% | 6.6%(-5.40)#58 | 6.8%(-5.57)#24,523 |
| 59. | 19941 | 0.16% | 6.6%(-6.43)#59 | 6.8%(-6.61)#26,663 |
1
Common Questions
What are the Top 10 Zip Codes with the Highest Percentage of Population Employed in Computer, Engineering & Science in Delaware?
Top 10 Zip Codes with the Highest Percentage of Population Employed in Computer, Engineering & Science in Delaware are:
What zip code has the Highest Percentage of Population Employed in Computer, Engineering & Science in Delaware?
19732 has the Highest Percentage of Population Employed in Computer, Engineering & Science in Delaware with 16.8%.
What is the Percentage of Population Employed in Computer, Engineering & Science in the State of Delaware?
Percentage of Population Employed in Computer, Engineering & Science in Delaware is 6.6%.
What is the Percentage of Population Employed in Computer, Engineering & Science in the United States?
Percentage of Population Employed in Computer, Engineering & Science in the United States is 6.8%.