Zip Codes with the Highest Percentage of Population Employed in Computer, Engineering & Science in Mississippi
RELATED REPORTS & OPTIONS
Computer, Engineering & Science
Mississippi
Compare Zip Codes
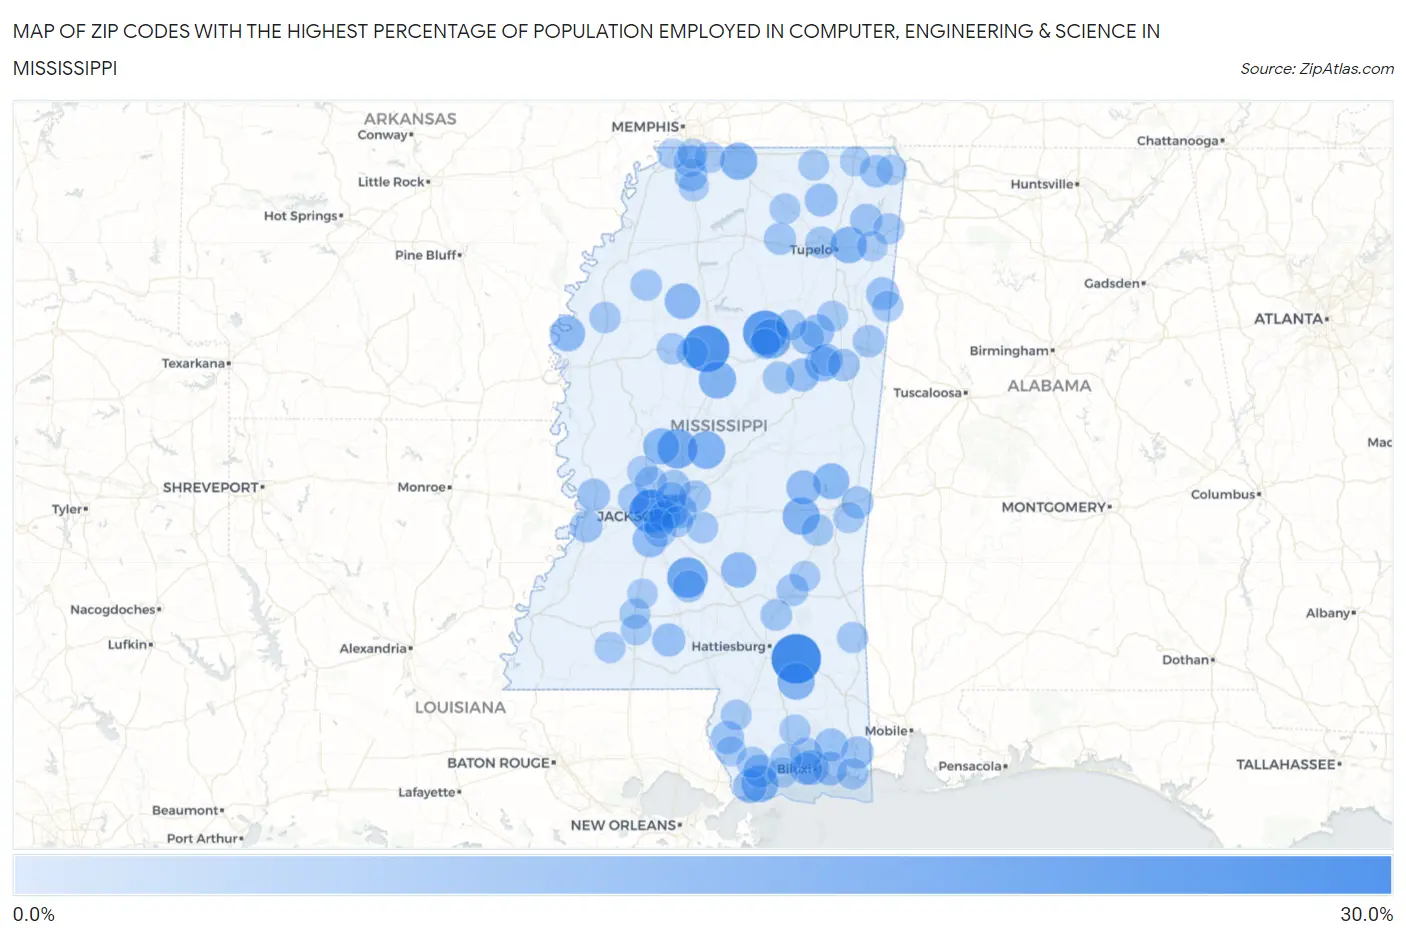
Map of Zip Codes with the Highest Percentage of Population Employed in Computer, Engineering & Science in Mississippi
0.0%
30.0%
Zip Codes with the Highest Percentage of Population Employed in Computer, Engineering & Science in Mississippi
| Zip Code | % Employed | vs State | vs National | |
| 1. | 39462 | 25.5% | 3.5%(+22.0)#1 | 6.8%(+18.8)#266 |
| 2. | 38943 | 22.1% | 3.5%(+18.6)#2 | 6.8%(+15.4)#385 |
| 3. | 39737 | 19.2% | 3.5%(+15.7)#3 | 6.8%(+12.5)#575 |
| 4. | 39058 | 18.6% | 3.5%(+15.0)#4 | 6.8%(+11.8)#630 |
| 5. | 39149 | 15.2% | 3.5%(+11.7)#5 | 6.8%(+8.45)#1,084 |
| 6. | 39179 | 14.2% | 3.5%(+10.6)#6 | 6.8%(+7.40)#1,295 |
| 7. | 39771 | 13.9% | 3.5%(+10.4)#7 | 6.8%(+7.12)#1,378 |
| 8. | 39045 | 12.1% | 3.5%(+8.52)#8 | 6.8%(+5.29)#2,016 |
| 9. | 39176 | 11.6% | 3.5%(+8.03)#9 | 6.8%(+4.80)#2,265 |
| 10. | 39332 | 11.5% | 3.5%(+7.99)#10 | 6.8%(+4.75)#2,290 |
| 11. | 38661 | 11.4% | 3.5%(+7.84)#11 | 6.8%(+4.61)#2,368 |
| 12. | 39425 | 11.2% | 3.5%(+7.66)#12 | 6.8%(+4.43)#2,461 |
| 13. | 39576 | 11.1% | 3.5%(+7.61)#13 | 6.8%(+4.37)#2,494 |
| 14. | 38857 | 10.5% | 3.5%(+6.96)#14 | 6.8%(+3.73)#2,873 |
| 15. | 39039 | 10.1% | 3.5%(+6.61)#15 | 6.8%(+3.38)#3,117 |
| 16. | 39320 | 10.0% | 3.5%(+6.47)#16 | 6.8%(+3.24)#3,213 |
| 17. | 38920 | 9.5% | 3.5%(+6.00)#17 | 6.8%(+2.76)#3,575 |
| 18. | 39116 | 9.4% | 3.5%(+5.85)#18 | 6.8%(+2.61)#3,699 |
| 19. | 38725 | 9.2% | 3.5%(+5.69)#19 | 6.8%(+2.46)#3,842 |
| 20. | 39759 | 9.1% | 3.5%(+5.55)#20 | 6.8%(+2.32)#3,988 |
| 21. | 39534 | 8.7% | 3.5%(+5.22)#21 | 6.8%(+1.99)#4,310 |
| 22. | 39170 | 8.5% | 3.5%(+4.96)#22 | 6.8%(+1.72)#4,616 |
| 23. | 39337 | 8.4% | 3.5%(+4.85)#23 | 6.8%(+1.61)#4,740 |
| 24. | 39564 | 7.6% | 3.5%(+4.03)#24 | 6.8%(+0.792)#5,904 |
| 25. | 39232 | 7.5% | 3.5%(+3.98)#25 | 6.8%(+0.743)#5,986 |
| 26. | 39216 | 7.5% | 3.5%(+3.98)#26 | 6.8%(+0.741)#5,989 |
| 27. | 39741 | 7.5% | 3.5%(+3.97)#27 | 6.8%(+0.735)#5,995 |
| 28. | 39520 | 7.4% | 3.5%(+3.85)#28 | 6.8%(+0.616)#6,213 |
| 29. | 39755 | 7.1% | 3.5%(+3.53)#29 | 6.8%(+0.294)#6,704 |
| 30. | 39769 | 7.1% | 3.5%(+3.53)#30 | 6.8%(+0.289)#6,710 |
| 31. | 39641 | 7.0% | 3.5%(+3.45)#31 | 6.8%(+0.213)#6,837 |
| 32. | 39525 | 7.0% | 3.5%(+3.44)#32 | 6.8%(+0.209)#6,851 |
| 33. | 38625 | 6.9% | 3.5%(+3.36)#33 | 6.8%(+0.120)#7,003 |
| 34. | 39565 | 6.8% | 3.5%(+3.31)#34 | 6.8%(+0.077)#7,082 |
| 35. | 39426 | 6.8% | 3.5%(+3.27)#35 | 6.8%(+0.032)#7,154 |
| 36. | 38848 | 6.6% | 3.5%(+3.11)#36 | 6.8%(-0.131)#7,481 |
| 37. | 39183 | 6.4% | 3.5%(+2.83)#37 | 6.8%(-0.403)#8,007 |
| 38. | 39110 | 6.3% | 3.5%(+2.81)#38 | 6.8%(-0.430)#8,064 |
| 39. | 39762 | 6.3% | 3.5%(+2.76)#39 | 6.8%(-0.477)#8,157 |
| 40. | 38632 | 6.2% | 3.5%(+2.70)#40 | 6.8%(-0.540)#8,284 |
| 41. | 38833 | 6.2% | 3.5%(+2.69)#41 | 6.8%(-0.549)#8,306 |
| 42. | 39056 | 6.2% | 3.5%(+2.67)#42 | 6.8%(-0.568)#8,348 |
| 43. | 38856 | 6.1% | 3.5%(+2.58)#43 | 6.8%(-0.652)#8,559 |
| 44. | 39180 | 6.0% | 3.5%(+2.48)#44 | 6.8%(-0.756)#8,815 |
| 45. | 39562 | 6.0% | 3.5%(+2.48)#45 | 6.8%(-0.760)#8,829 |
| 46. | 39736 | 5.9% | 3.5%(+2.40)#46 | 6.8%(-0.833)#8,987 |
| 47. | 38871 | 5.9% | 3.5%(+2.40)#47 | 6.8%(-0.839)#9,012 |
| 48. | 39272 | 5.9% | 3.5%(+2.35)#48 | 6.8%(-0.883)#9,121 |
| 49. | 39140 | 5.9% | 3.5%(+2.34)#49 | 6.8%(-0.894)#9,144 |
| 50. | 39531 | 5.8% | 3.5%(+2.29)#50 | 6.8%(-0.942)#9,253 |
| 51. | 39705 | 5.8% | 3.5%(+2.28)#51 | 6.8%(-0.959)#9,289 |
| 52. | 39532 | 5.7% | 3.5%(+2.20)#52 | 6.8%(-1.04)#9,494 |
| 53. | 39047 | 5.7% | 3.5%(+2.17)#53 | 6.8%(-1.07)#9,551 |
| 54. | 39364 | 5.7% | 3.5%(+2.16)#54 | 6.8%(-1.08)#9,587 |
| 55. | 38651 | 5.7% | 3.5%(+2.14)#55 | 6.8%(-1.10)#9,623 |
| 56. | 39071 | 5.7% | 3.5%(+2.13)#56 | 6.8%(-1.10)#9,645 |
| 57. | 39443 | 5.6% | 3.5%(+2.08)#57 | 6.8%(-1.16)#9,794 |
| 58. | 39735 | 5.6% | 3.5%(+2.03)#58 | 6.8%(-1.21)#9,915 |
| 59. | 39330 | 5.5% | 3.5%(+1.99)#59 | 6.8%(-1.24)#10,004 |
| 60. | 38826 | 5.4% | 3.5%(+1.84)#60 | 6.8%(-1.40)#10,410 |
| 61. | 39217 | 5.3% | 3.5%(+1.77)#61 | 6.8%(-1.46)#10,564 |
| 62. | 39437 | 5.3% | 3.5%(+1.73)#62 | 6.8%(-1.51)#10,680 |
| 63. | 39556 | 5.1% | 3.5%(+1.57)#63 | 6.8%(-1.66)#11,087 |
| 64. | 39041 | 5.0% | 3.5%(+1.49)#64 | 6.8%(-1.75)#11,315 |
| 65. | 38957 | 5.0% | 3.5%(+1.49)#65 | 6.8%(-1.75)#11,319 |
| 66. | 39567 | 5.0% | 3.5%(+1.48)#66 | 6.8%(-1.76)#11,365 |
| 67. | 38732 | 4.9% | 3.5%(+1.42)#67 | 6.8%(-1.82)#11,525 |
| 68. | 38917 | 4.9% | 3.5%(+1.38)#68 | 6.8%(-1.86)#11,645 |
| 69. | 39042 | 4.8% | 3.5%(+1.30)#69 | 6.8%(-1.94)#11,867 |
| 70. | 38844 | 4.8% | 3.5%(+1.27)#70 | 6.8%(-1.96)#11,946 |
| 71. | 38930 | 4.8% | 3.5%(+1.26)#71 | 6.8%(-1.98)#11,978 |
| 72. | 39362 | 4.8% | 3.5%(+1.23)#72 | 6.8%(-2.01)#12,069 |
| 73. | 38847 | 4.7% | 3.5%(+1.15)#73 | 6.8%(-2.08)#12,259 |
| 74. | 39573 | 4.7% | 3.5%(+1.14)#74 | 6.8%(-2.10)#12,300 |
| 75. | 39301 | 4.6% | 3.5%(+1.07)#75 | 6.8%(-2.17)#12,507 |
| 76. | 39157 | 4.6% | 3.5%(+1.05)#76 | 6.8%(-2.19)#12,583 |
| 77. | 38674 | 4.5% | 3.5%(+1.00)#77 | 6.8%(-2.23)#12,725 |
| 78. | 39208 | 4.4% | 3.5%(+0.890)#78 | 6.8%(-2.35)#13,104 |
| 79. | 39756 | 4.4% | 3.5%(+0.877)#79 | 6.8%(-2.36)#13,145 |
| 80. | 39503 | 4.4% | 3.5%(+0.870)#80 | 6.8%(-2.37)#13,175 |
| 81. | 39664 | 4.4% | 3.5%(+0.853)#81 | 6.8%(-2.38)#13,241 |
| 82. | 39470 | 4.3% | 3.5%(+0.795)#82 | 6.8%(-2.44)#13,412 |
| 83. | 39629 | 4.3% | 3.5%(+0.772)#83 | 6.8%(-2.46)#13,500 |
| 84. | 39601 | 4.3% | 3.5%(+0.728)#84 | 6.8%(-2.51)#13,649 |
| 85. | 38650 | 4.3% | 3.5%(+0.726)#85 | 6.8%(-2.51)#13,660 |
| 86. | 38654 | 4.2% | 3.5%(+0.696)#86 | 6.8%(-2.54)#13,760 |
| 87. | 39439 | 4.1% | 3.5%(+0.607)#87 | 6.8%(-2.63)#14,058 |
| 88. | 39040 | 4.1% | 3.5%(+0.599)#88 | 6.8%(-2.64)#14,076 |
| 89. | 39560 | 4.0% | 3.5%(+0.510)#89 | 6.8%(-2.73)#14,369 |
| 90. | 38843 | 3.9% | 3.5%(+0.408)#90 | 6.8%(-2.83)#14,683 |
| 91. | 39751 | 3.9% | 3.5%(+0.393)#91 | 6.8%(-2.84)#14,734 |
| 92. | 39744 | 3.9% | 3.5%(+0.351)#92 | 6.8%(-2.89)#14,889 |
| 93. | 39212 | 3.8% | 3.5%(+0.314)#93 | 6.8%(-2.92)#15,013 |
| 94. | 39191 | 3.8% | 3.5%(+0.295)#94 | 6.8%(-2.94)#15,079 |
| 95. | 38680 | 3.7% | 3.5%(+0.167)#95 | 6.8%(-3.07)#15,479 |
| 96. | 38672 | 3.7% | 3.5%(+0.160)#96 | 6.8%(-3.08)#15,513 |
| 97. | 38618 | 3.6% | 3.5%(+0.118)#97 | 6.8%(-3.12)#15,684 |
| 98. | 38852 | 3.6% | 3.5%(+0.108)#98 | 6.8%(-3.13)#15,729 |
| 99. | 38834 | 3.6% | 3.5%(+0.055)#99 | 6.8%(-3.18)#15,952 |
| 100. | 39466 | 3.6% | 3.5%(+0.054)#100 | 6.8%(-3.18)#15,956 |
Common Questions
What are the Top 10 Zip Codes with the Highest Percentage of Population Employed in Computer, Engineering & Science in Mississippi?
Top 10 Zip Codes with the Highest Percentage of Population Employed in Computer, Engineering & Science in Mississippi are:
What zip code has the Highest Percentage of Population Employed in Computer, Engineering & Science in Mississippi?
39462 has the Highest Percentage of Population Employed in Computer, Engineering & Science in Mississippi with 25.5%.
What is the Percentage of Population Employed in Computer, Engineering & Science in the State of Mississippi?
Percentage of Population Employed in Computer, Engineering & Science in Mississippi is 3.5%.
What is the Percentage of Population Employed in Computer, Engineering & Science in the United States?
Percentage of Population Employed in Computer, Engineering & Science in the United States is 6.8%.