Zip Codes with the Highest Poverty Level Among Children Under the Age of 5 in Philadelphia, PA

RELATED REPORTS & OPTIONS

Highest Poverty | Child 0-5
Population
Families and Households
Female Fertility
Female Fertility (Unmarried)
Race (Community Size)
Race (Percentage)
Ancestry (Community Size)
AfghanAfricanAlaska NativeAlaskan AthabascanAlbanianAmericanApacheArabArgentineanArmenianAustralianAustrianBahamianBangladeshiBarbadianBasqueBelgianBelizeanBermudanBhutaneseBlackfeetBolivianBrazilianBritishBritish West IndianBulgarianBurmeseCajunCambodianCanadianCape VerdeanCarpatho RusynCelticCentral AmericanCentral American IndianCherokeeChickasawChileanChippewaChoctawColombianCosta RicanCreekCroatianCubanCypriotCzechCzechoslovakianDanishDelawareDominicanDutchEastern EuropeanEcuadorianEgyptianEnglishEstonianEthiopianEuropeanFilipinoFinnishFrenchFrench American IndianFrench CanadianGermanGerman RussianGhanaianGreekGuamanian / ChamorroGuatemalanGuyaneseHaitianHonduranHungarianIcelanderIndian (Asian)IndonesianInupiatIranianIraqiIrishIroquoisIsraeliItalianJamaicanJapaneseJordanianKenyanKoreanLaotianLatvianLebaneseLiberianLithuanianLumbeeMacedonianMalaysianMexicanMexican American IndianMongolianMoroccanNative HawaiianNavajoNew ZealanderNicaraguanNigerianNorthern EuropeanNorwegianOkinawanPakistaniPalestinianPanamanianParaguayanPennsylvania GermanPeruvianPolishPortuguesePotawatomiPuerto RicanRomanianRussianSalvadoranSamoanScandinavianScotch-IrishScottishSeminoleSenegaleseSerbianShoshoneSierra LeoneanSiouxSlavicSlovakSloveneSomaliSouth AfricanSouth AmericanSouth American IndianSpaniardSpanishSpanish AmericanSri LankanSubsaharan AfricanSudaneseSwedishSwissSyrianThaiTrinidadian and TobagonianTurkishU.S. Virgin IslanderUgandanUkrainianUruguayanVenezuelanVietnameseWelshWest IndianYugoslavian
Ancestry (Percentage)
AfghanAfricanAlaska NativeAlaskan AthabascanAlbanianAmericanApacheArabArgentineanArmenianAustralianAustrianBahamianBangladeshiBarbadianBasqueBelgianBelizeanBermudanBhutaneseBlackfeetBolivianBrazilianBritishBritish West IndianBulgarianBurmeseCajunCambodianCanadianCape VerdeanCarpatho RusynCelticCentral AmericanCentral American IndianCherokeeChickasawChileanChippewaChoctawColombianCosta RicanCreekCroatianCubanCypriotCzechCzechoslovakianDanishDelawareDominicanDutchEastern EuropeanEcuadorianEgyptianEnglishEstonianEthiopianEuropeanFilipinoFinnishFrenchFrench American IndianFrench CanadianGermanGerman RussianGhanaianGreekGuamanian / ChamorroGuatemalanGuyaneseHaitianHonduranHungarianIcelanderIndian (Asian)IndonesianInupiatIranianIraqiIrishIroquoisIsraeliItalianJamaicanJapaneseJordanianKenyanKoreanLaotianLatvianLebaneseLiberianLithuanianLumbeeMacedonianMalaysianMexicanMexican American IndianMongolianMoroccanNative HawaiianNavajoNew ZealanderNicaraguanNigerianNorthern EuropeanNorwegianOkinawanPakistaniPalestinianPanamanianParaguayanPennsylvania GermanPeruvianPolishPortuguesePotawatomiPuerto RicanRomanianRussianSalvadoranSamoanScandinavianScotch-IrishScottishSeminoleSenegaleseSerbianShoshoneSierra LeoneanSiouxSlavicSlovakSloveneSomaliSouth AfricanSouth AmericanSouth American IndianSpaniardSpanishSpanish AmericanSri LankanSubsaharan AfricanSudaneseSwedishSwissSyrianThaiTrinidadian and TobagonianTurkishU.S. Virgin IslanderUgandanUkrainianUruguayanVenezuelanVietnameseWelshWest IndianYugoslavian
Immigrant Origin (Total)
AfghanistanAfricaAlbaniaArgentinaArmeniaAsiaAustraliaAustriaBangladeshBarbadosBelarusBelgiumBelizeBoliviaBosnia and HerzegovinaBrazilBulgariaBurma / MyanmarCambodiaCameroonCanadaCaribbeanCentral AmericaChileChinaColombiaCongoCosta RicaCroatiaCubaCzechoslovakiaDenmarkDominicaDominican RepublicEastern AfricaEastern AsiaEastern EuropeEcuadorEgyptEl SalvadorEnglandEritreaEthiopiaEuropeFranceGermanyGhanaGreeceGrenadaGuatemalaGuyanaHaitiHondurasHong KongHungaryIndiaIndonesiaIranIraqIrelandIsraelItalyJamaicaJapanJordanKazakhstanKenyaKoreaKuwaitLaosLatin AmericaLatviaLebanonLiberiaLithuaniaMalaysiaMexicoMiddle AfricaMoldovaMoroccoNepalNetherlandsNicaraguaNigeriaNorth MacedoniaNorthern AfricaNorthern EuropeNorwayOceaniaPakistanPanamaPeruPhilippinesPolandPortugalRomaniaRussiaSaudi ArabiaScotlandSenegalSerbiaSierra LeoneSingaporeSouth AfricaSouth AmericaSouth Central AsiaSouth Eastern AsiaSouthern EuropeSpainSri LankaSt. Vincent and the GrenadinesSudanSwedenSwitzerlandSyriaTaiwanThailandTrinidad and TobagoTurkeyUkraineUruguayUzbekistanVenezuelaVietnamWest IndiesWestern AfricaWestern AsiaWestern EuropeZaireZimbabwe
Immigrant Origin (Percentage)
AfghanistanAfricaAlbaniaArgentinaArmeniaAsiaAustraliaAustriaBangladeshBarbadosBelarusBelgiumBelizeBoliviaBosnia and HerzegovinaBrazilBulgariaBurma / MyanmarCambodiaCameroonCanadaCaribbeanCentral AmericaChileChinaColombiaCongoCosta RicaCroatiaCubaCzechoslovakiaDenmarkDominicaDominican RepublicEastern AfricaEastern AsiaEastern EuropeEcuadorEgyptEl SalvadorEnglandEritreaEthiopiaEuropeFranceGermanyGhanaGreeceGrenadaGuatemalaGuyanaHaitiHondurasHong KongHungaryIndiaIndonesiaIranIraqIrelandIsraelItalyJamaicaJapanJordanKazakhstanKenyaKoreaKuwaitLaosLatin AmericaLatviaLebanonLiberiaLithuaniaMalaysiaMexicoMiddle AfricaMoldovaMoroccoNepalNetherlandsNicaraguaNigeriaNorth MacedoniaNorthern AfricaNorthern EuropeNorwayOceaniaPakistanPanamaPeruPhilippinesPolandPortugalRomaniaRussiaSaudi ArabiaScotlandSenegalSerbiaSierra LeoneSingaporeSouth AfricaSouth AmericaSouth Central AsiaSouth Eastern AsiaSouthern EuropeSpainSri LankaSt. Vincent and the GrenadinesSudanSwedenSwitzerlandSyriaTaiwanThailandTrinidad and TobagoTurkeyUkraineUruguayUzbekistanVenezuelaVietnamWest IndiesWestern AfricaWestern AsiaWestern EuropeZaireZimbabwe
Income
Income (Families)
Income (Households)
Poverty
Poverty (Families)
Unemployment
Employment Occupations
Employment Industries
Employer Class
Commute Time
Commute Means
School Enrollment
Education by Degree Field
Occupancy
Finances
Physical Characteristics
Philadelphia
Compare Zip Codes
Comparison Subject

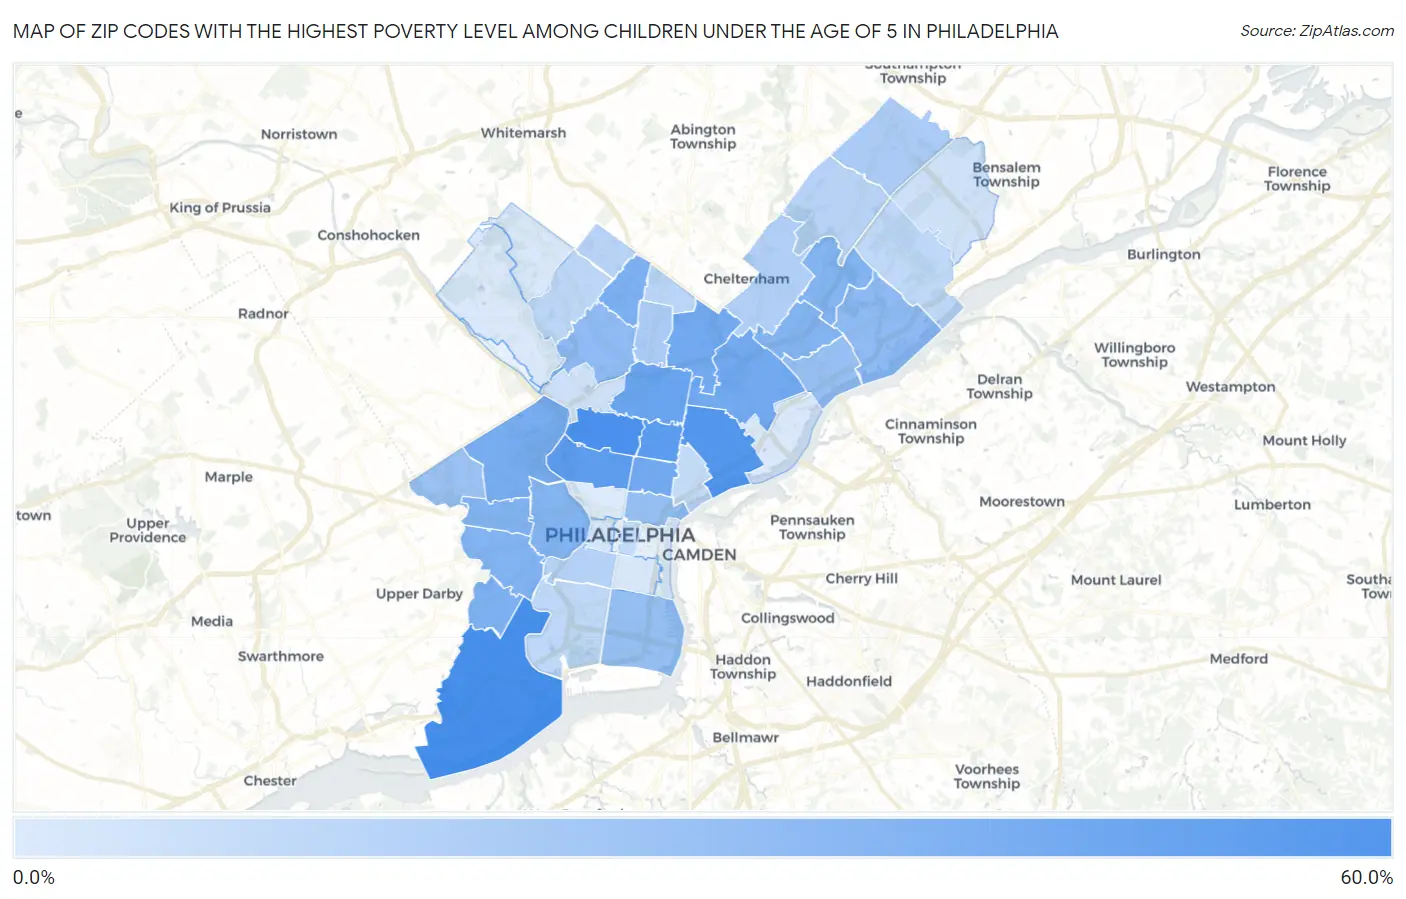
Map of Zip Codes with the Highest Poverty Level Among Children Under the Age of 5 in Philadelphia

0.0%
60.0%
Zip Codes with the Highest Poverty Level Among Children Under the Age of 5 in Philadelphia Map

Zip Codes with the Highest Poverty Level Among Children Under the Age of 5 in Philadelphia, PA

Zip Code Child Poverty vs State vs National
1.1915358.2%17.3%(+40.9)#7618.1%(+40.1)#1,814
2.1913257.5%17.3%(+40.2)#7918.1%(+39.4)#1,866
3.1913452.6%17.3%(+35.3)#9218.1%(+34.5)#2,290
4.1913348.3%17.3%(+31.1)#10818.1%(+30.3)#2,779
5.1912147.7%17.3%(+30.4)#11018.1%(+29.6)#2,844
6.1914043.3%17.3%(+26.0)#13818.1%(+25.2)#3,443
7.1912239.3%17.3%(+22.1)#17118.1%(+21.3)#4,146
8.1912439.3%17.3%(+22.0)#17218.1%(+21.2)#4,158
9.1912039.3%17.3%(+22.0)#17318.1%(+21.2)#4,162
10.1913137.3%17.3%(+20.0)#18918.1%(+19.2)#4,542
11.1913835.5%17.3%(+18.3)#21118.1%(+17.5)#4,944
12.1914234.7%17.3%(+17.5)#22018.1%(+16.7)#5,136
13.1913933.3%17.3%(+16.1)#24318.1%(+15.3)#5,534
14.1914333.1%17.3%(+15.9)#24518.1%(+15.1)#5,563
15.1910432.8%17.3%(+15.5)#25218.1%(+14.7)#5,645
16.1914932.4%17.3%(+15.1)#25918.1%(+14.3)#5,741
17.1915232.3%17.3%(+15.1)#26118.1%(+14.3)#5,759
18.1914428.5%17.3%(+11.2)#31718.1%(+10.4)#6,816
19.1913627.8%17.3%(+10.5)#32718.1%(+9.69)#7,048
20.1914825.9%17.3%(+8.65)#35218.1%(+7.85)#7,671
21.1912325.3%17.3%(+8.04)#36518.1%(+7.24)#7,877
22.1913524.9%17.3%(+7.64)#37418.1%(+6.84)#8,062
23.1915123.9%17.3%(+6.65)#39418.1%(+5.84)#8,391
24.1911618.2%17.3%(+0.971)#49718.1%(+0.170)#10,837
25.1914118.1%17.3%(+0.829)#50118.1%(+0.027)#10,924
26.1911115.5%17.3%(-1.76)#57618.1%(-2.56)#12,169
27.1914614.2%17.3%(-3.07)#61618.1%(-3.87)#12,936
28.1911513.7%17.3%(-3.53)#62818.1%(-4.33)#13,198
29.1915013.4%17.3%(-3.89)#63618.1%(-4.69)#13,396
30.1912612.3%17.3%(-4.96)#67318.1%(-5.77)#14,041
31.1911912.1%17.3%(-5.17)#68118.1%(-5.97)#14,152
32.1911411.2%17.3%(-6.03)#70518.1%(-6.83)#14,677
33.1914511.0%17.3%(-6.25)#71618.1%(-7.05)#14,822
34.191259.7%17.3%(-7.56)#75118.1%(-8.36)#15,594
35.191079.5%17.3%(-7.74)#75718.1%(-8.54)#15,689
36.191295.8%17.3%(-11.4)#89118.1%(-12.2)#18,209
37.191545.7%17.3%(-11.5)#89718.1%(-12.4)#18,275
38.191033.7%17.3%(-13.6)#97718.1%(-14.4)#19,728
39.191472.9%17.3%(-14.3)#99718.1%(-15.1)#20,217
40.191182.9%17.3%(-14.3)#99818.1%(-15.1)#20,221
41.191372.7%17.3%(-14.6)#1,00818.1%(-15.4)#20,368
42.191282.2%17.3%(-15.1)#1,04118.1%(-15.9)#20,733
43.191301.7%17.3%(-15.5)#1,05618.1%(-16.3)#21,013

Common Questions

What are the Top 10 Zip Codes with the Highest Poverty Level Among Children Under the Age of 5 in Philadelphia, PA?
Top 10 Zip Codes with the Highest Poverty Level Among Children Under the Age of 5 in Philadelphia, PA are:
#1
58.2%
#2
57.5%
#3
52.6%
#4
48.3%
#5
47.7%
#6
43.3%
#7
39.3%
#8
39.3%
#9
39.3%
#10
37.3%
What zip code has the Highest Poverty Level Among Children Under the Age of 5 in Philadelphia, PA?
19153 has the Highest Poverty Level Among Children Under the Age of 5 in Philadelphia, PA with 58.2%.
What is the Poverty Level Among Children Under the Age of 5 in Philadelphia, PA?
Poverty Level Among Children Under the Age of 5 in Philadelphia is 27.6%.
What is the Poverty Level Among Children Under the Age of 5 in Pennsylvania?
Poverty Level Among Children Under the Age of 5 in Pennsylvania is 17.3%.
What is the Poverty Level Among Children Under the Age of 5 in the United States?
Poverty Level Among Children Under the Age of 5 in the United States is 18.1%.