Hopwood, PA Map & Demographics
Hopwood Map
Hopwood Overview
$46,382
PER CAPITA INCOME
$103,750
AVG FAMILY INCOME
$49,125
AVG HOUSEHOLD INCOME
43.1%
WAGE / INCOME GAP [ % ]
56.9¢/ $1
WAGE / INCOME GAP [ $ ]
0.56
INEQUALITY / GINI INDEX
1,611
TOTAL POPULATION
797
MALE POPULATION
814
FEMALE POPULATION
97.91
MALES / 100 FEMALES
102.13
FEMALES / 100 MALES
58.8
MEDIAN AGE
2.6
AVG FAMILY SIZE
1.9
AVG HOUSEHOLD SIZE
756
LABOR FORCE [ PEOPLE ]
51.4%
PERCENT IN LABOR FORCE
9.1%
UNEMPLOYMENT RATE
Hopwood Zip Codes
Income in Hopwood
Income Overview in Hopwood
Per Capita Income in Hopwood is $46,382, while median incomes of families and households are $103,750 and $49,125 respectively.
| Characteristic | Number | Measure |
| Per Capita Income | 1,611 | $46,382 |
| Median Family Income | 454 | $103,750 |
| Mean Family Income | 454 | $142,997 |
| Median Household Income | 828 | $49,125 |
| Mean Household Income | 828 | $92,263 |
| Income Deficit | 454 | $0 |
| Wage / Income Gap (%) | 1,611 | 43.12% |
| Wage / Income Gap ($) | 1,611 | 56.88¢ per $1 |
| Gini / Inequality Index | 1,611 | 0.56 |
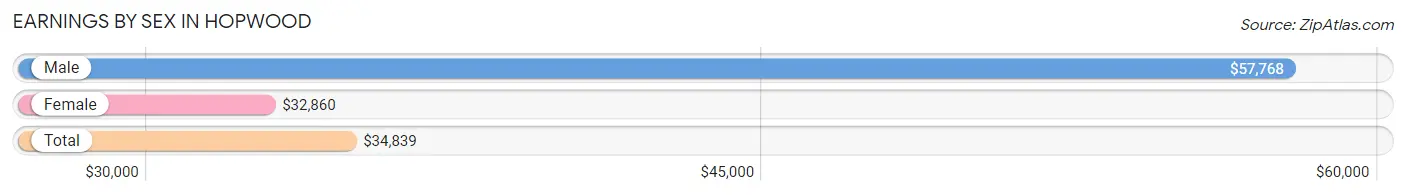
Earnings by Sex in Hopwood
Average Earnings in Hopwood are $34,839, $57,768 for men and $32,860 for women, a difference of 43.1%.
| Sex | Number | Average Earnings |
| Male | 378 (49.9%) | $57,768 |
| Female | 379 (50.1%) | $32,860 |
| Total | 757 (100.0%) | $34,839 |
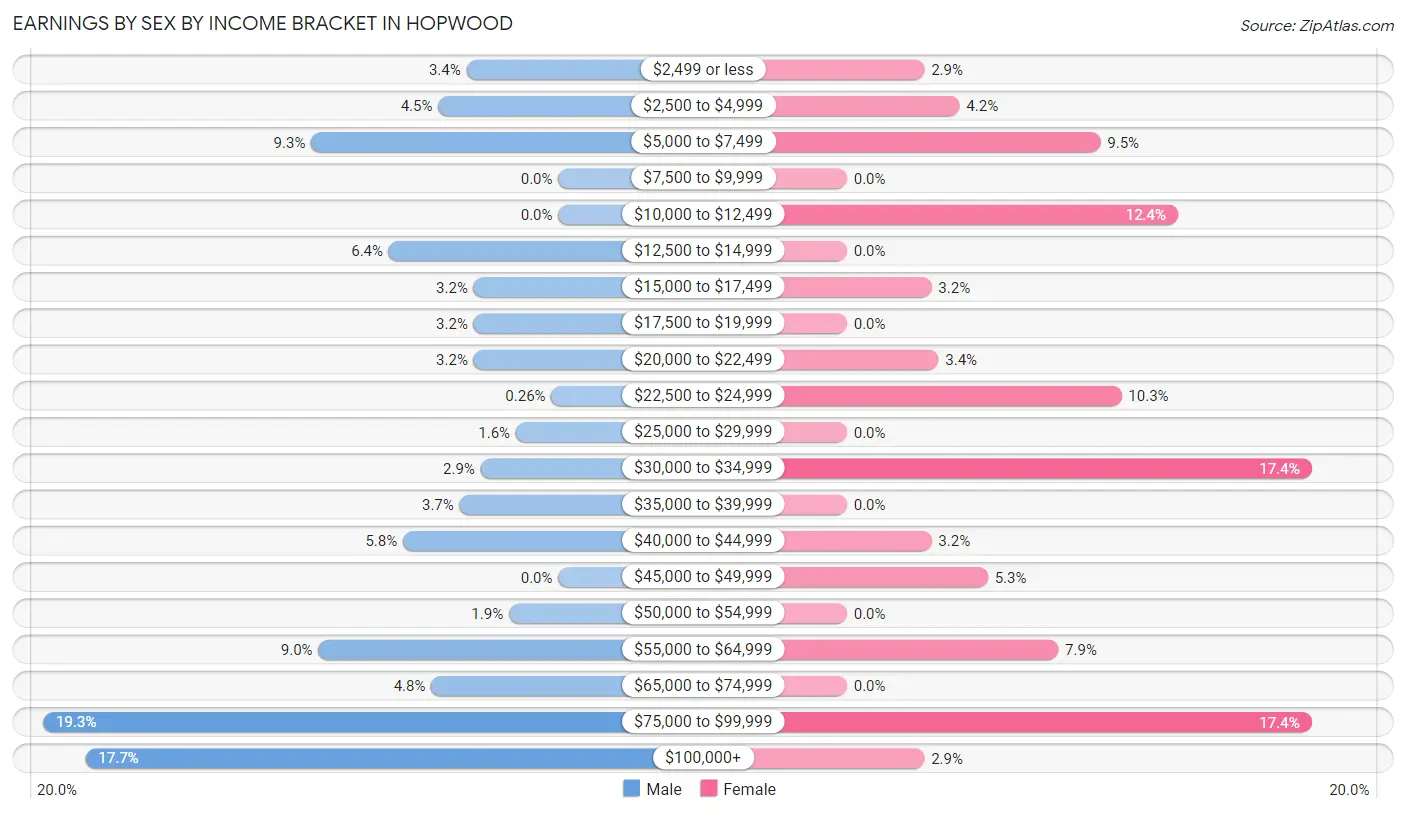
Earnings by Sex by Income Bracket in Hopwood
The most common earnings brackets in Hopwood are $75,000 to $99,999 for men (73 | 19.3%) and $30,000 to $34,999 for women (66 | 17.4%).
| Income | Male | Female |
| $2,499 or less | 13 (3.4%) | 11 (2.9%) |
| $2,500 to $4,999 | 17 (4.5%) | 16 (4.2%) |
| $5,000 to $7,499 | 35 (9.3%) | 36 (9.5%) |
| $7,500 to $9,999 | 0 (0.0%) | 0 (0.0%) |
| $10,000 to $12,499 | 0 (0.0%) | 47 (12.4%) |
| $12,500 to $14,999 | 24 (6.4%) | 0 (0.0%) |
| $15,000 to $17,499 | 12 (3.2%) | 12 (3.2%) |
| $17,500 to $19,999 | 12 (3.2%) | 0 (0.0%) |
| $20,000 to $22,499 | 12 (3.2%) | 13 (3.4%) |
| $22,500 to $24,999 | 1 (0.3%) | 39 (10.3%) |
| $25,000 to $29,999 | 6 (1.6%) | 0 (0.0%) |
| $30,000 to $34,999 | 11 (2.9%) | 66 (17.4%) |
| $35,000 to $39,999 | 14 (3.7%) | 0 (0.0%) |
| $40,000 to $44,999 | 22 (5.8%) | 12 (3.2%) |
| $45,000 to $49,999 | 0 (0.0%) | 20 (5.3%) |
| $50,000 to $54,999 | 7 (1.8%) | 0 (0.0%) |
| $55,000 to $64,999 | 34 (9.0%) | 30 (7.9%) |
| $65,000 to $74,999 | 18 (4.8%) | 0 (0.0%) |
| $75,000 to $99,999 | 73 (19.3%) | 66 (17.4%) |
| $100,000+ | 67 (17.7%) | 11 (2.9%) |
| Total | 378 (100.0%) | 379 (100.0%) |
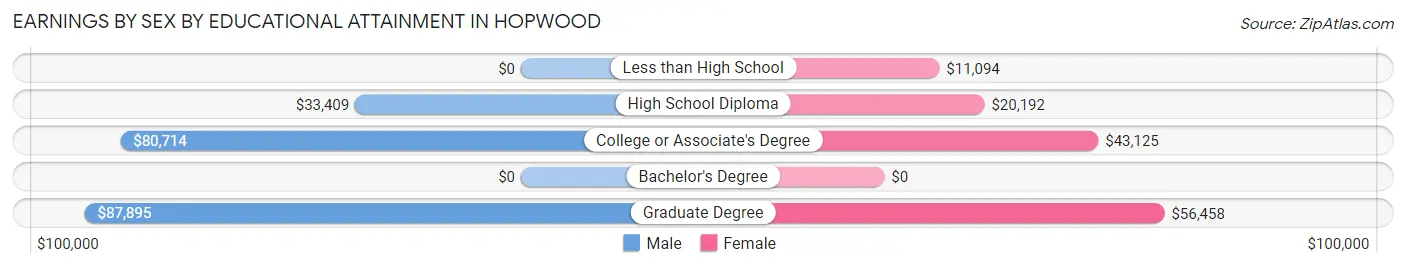
Earnings by Sex by Educational Attainment in Hopwood
Average earnings in Hopwood are $59,911 for men and $33,623 for women, a difference of 43.9%. Men with an educational attainment of graduate degree enjoy the highest average annual earnings of $87,895, while those with high school diploma education earn the least with $33,409. Women with an educational attainment of graduate degree earn the most with the average annual earnings of $56,458, while those with less than high school education have the smallest earnings of $11,094.
| Educational Attainment | Male Income | Female Income |
| Less than High School | - | - |
| High School Diploma | $33,409 | $20,192 |
| College or Associate's Degree | $80,714 | $43,125 |
| Bachelor's Degree | - | - |
| Graduate Degree | $87,895 | $56,458 |
| Total | $59,911 | $33,623 |
Family Income in Hopwood
Family Income Brackets in Hopwood
According to the Hopwood family income data, there are 127 families falling into the $100,000 to $149,999 income range, which is the most common income bracket and makes up 28.0% of all families.
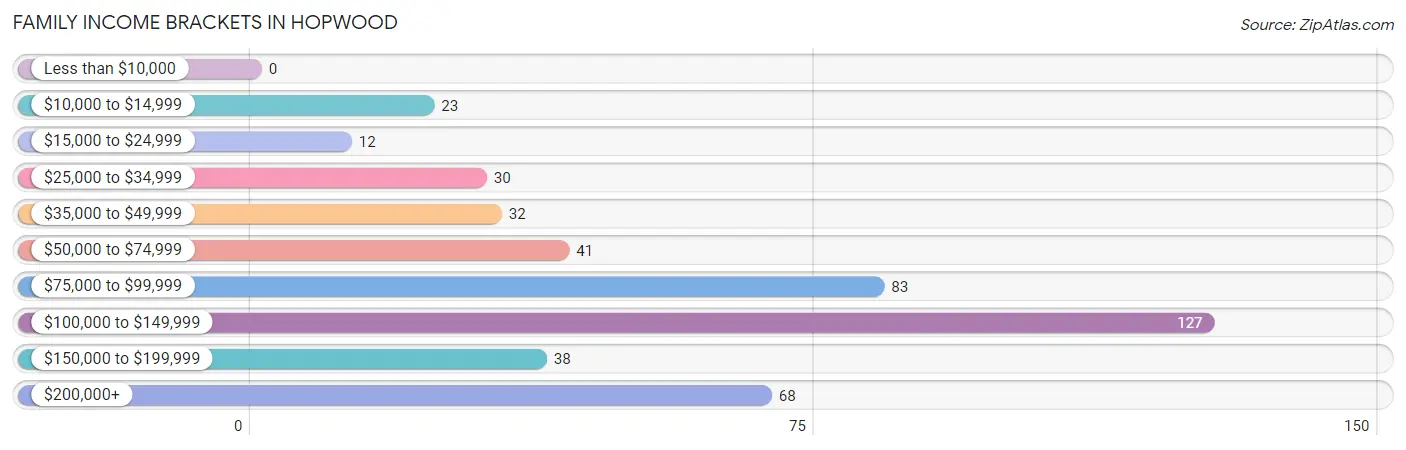
| Income Bracket | # Families | % Families |
| Less than $10,000 | 0 | 0.0% |
| $10,000 to $14,999 | 23 | 5.1% |
| $15,000 to $24,999 | 12 | 2.6% |
| $25,000 to $34,999 | 30 | 6.6% |
| $35,000 to $49,999 | 32 | 7.0% |
| $50,000 to $74,999 | 41 | 9.0% |
| $75,000 to $99,999 | 83 | 18.3% |
| $100,000 to $149,999 | 127 | 28.0% |
| $150,000 to $199,999 | 38 | 8.4% |
| $200,000+ | 68 | 15.0% |
Family Income by Famaliy Size in Hopwood
4-person families (95 | 20.9%) account for the highest median family income in Hopwood with $133,229 per family, while 2-person families (237 | 52.2%) have the highest median income of $39,754 per family member.
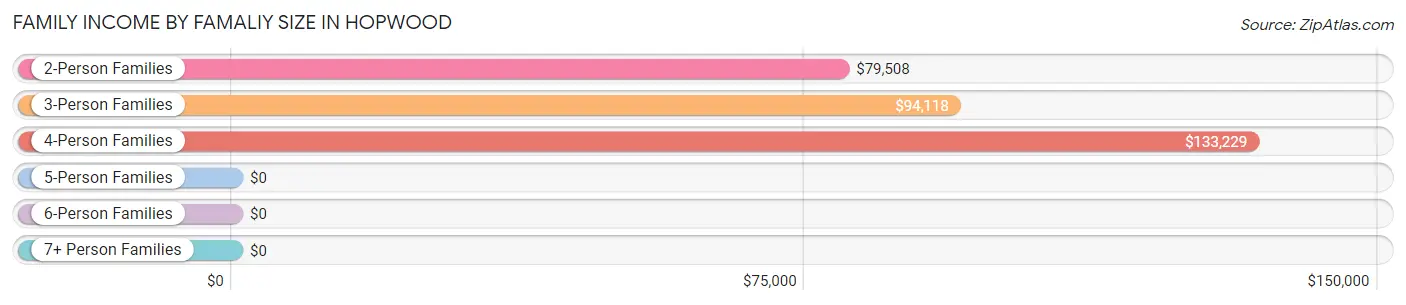
| Income Bracket | # Families | Median Income |
| 2-Person Families | 237 (52.2%) | $79,508 |
| 3-Person Families | 122 (26.9%) | $94,118 |
| 4-Person Families | 95 (20.9%) | $133,229 |
| 5-Person Families | 0 (0.0%) | $0 |
| 6-Person Families | 0 (0.0%) | $0 |
| 7+ Person Families | 0 (0.0%) | $0 |
| Total | 454 (100.0%) | $103,750 |
Family Income by Number of Earners in Hopwood
The median family income in Hopwood is $103,750, with families comprising 3+ earners (44) having the highest median family income of $144,423, while families with no earners (88) have the lowest median family income of $77,250, accounting for 9.7% and 19.4% of families, respectively.
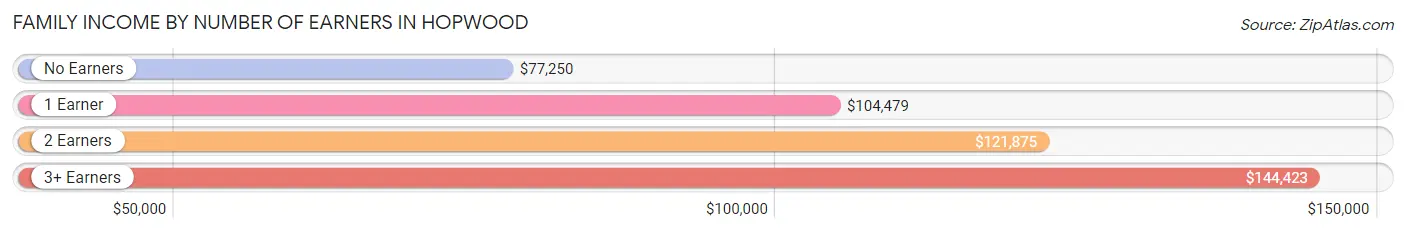
| Number of Earners | # Families | Median Income |
| No Earners | 88 (19.4%) | $77,250 |
| 1 Earner | 185 (40.7%) | $104,479 |
| 2 Earners | 137 (30.2%) | $121,875 |
| 3+ Earners | 44 (9.7%) | $144,423 |
| Total | 454 (100.0%) | $103,750 |
Household Income in Hopwood
Household Income Brackets in Hopwood
With 129 households falling in the category, the $35,000 to $49,999 income range is the most frequent in Hopwood, accounting for 15.6% of all households. In contrast, only 13 households (1.6%) fall into the less than $10,000 income bracket, making it the least populous group.
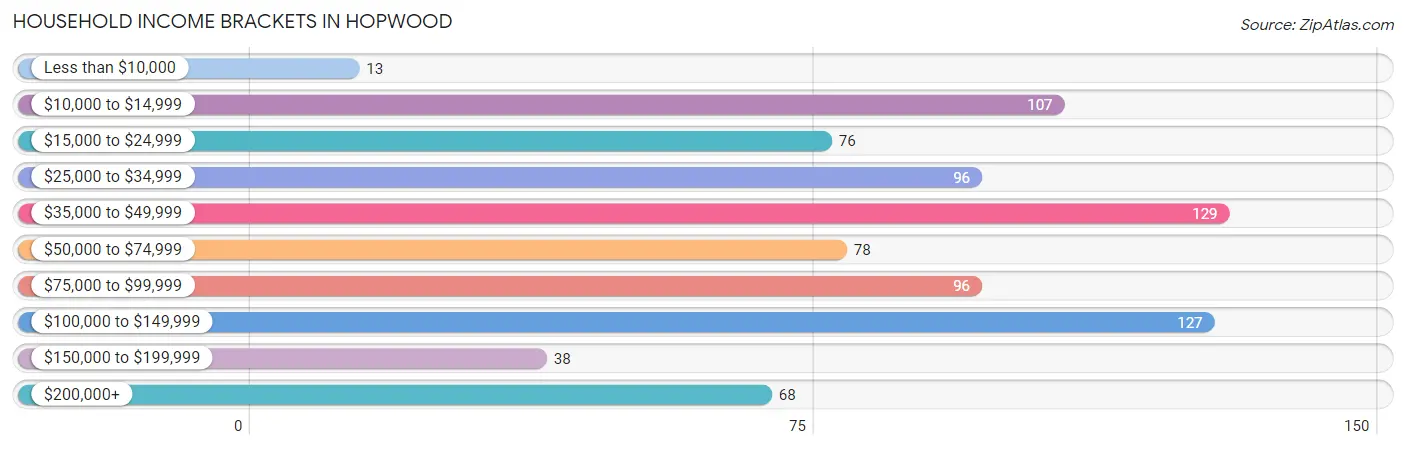
| Income Bracket | # Households | % Households |
| Less than $10,000 | 13 | 1.6% |
| $10,000 to $14,999 | 107 | 12.9% |
| $15,000 to $24,999 | 76 | 9.2% |
| $25,000 to $34,999 | 96 | 11.6% |
| $35,000 to $49,999 | 129 | 15.6% |
| $50,000 to $74,999 | 78 | 9.4% |
| $75,000 to $99,999 | 96 | 11.6% |
| $100,000 to $149,999 | 127 | 15.3% |
| $150,000 to $199,999 | 38 | 4.6% |
| $200,000+ | 68 | 8.2% |
Household Income by Householder Age in Hopwood
The median household income in Hopwood is $49,125, with the highest median household income of $92,656 found in the 45 to 64 years age bracket for the primary householder. A total of 367 households (44.3%) fall into this category.
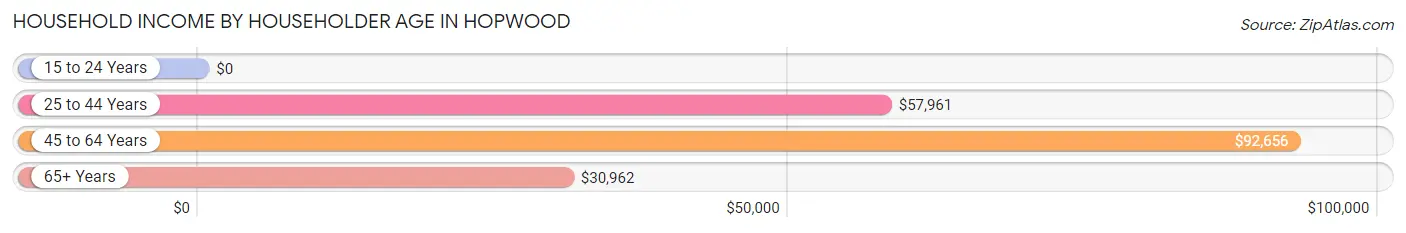
| Income Bracket | # Households | Median Income |
| 15 to 24 Years | 0 (0.0%) | $0 |
| 25 to 44 Years | 87 (10.5%) | $57,961 |
| 45 to 64 Years | 367 (44.3%) | $92,656 |
| 65+ Years | 374 (45.2%) | $30,962 |
| Total | 828 (100.0%) | $49,125 |
Poverty in Hopwood
Income Below Poverty by Sex and Age in Hopwood
With 6.7% poverty level for males and 16.0% for females among the residents of Hopwood, under 5 year old males and 6 to 11 year old females are the most vulnerable to poverty, with 16 males (100.0%) and 16 females (72.7%) in their respective age groups living below the poverty level.
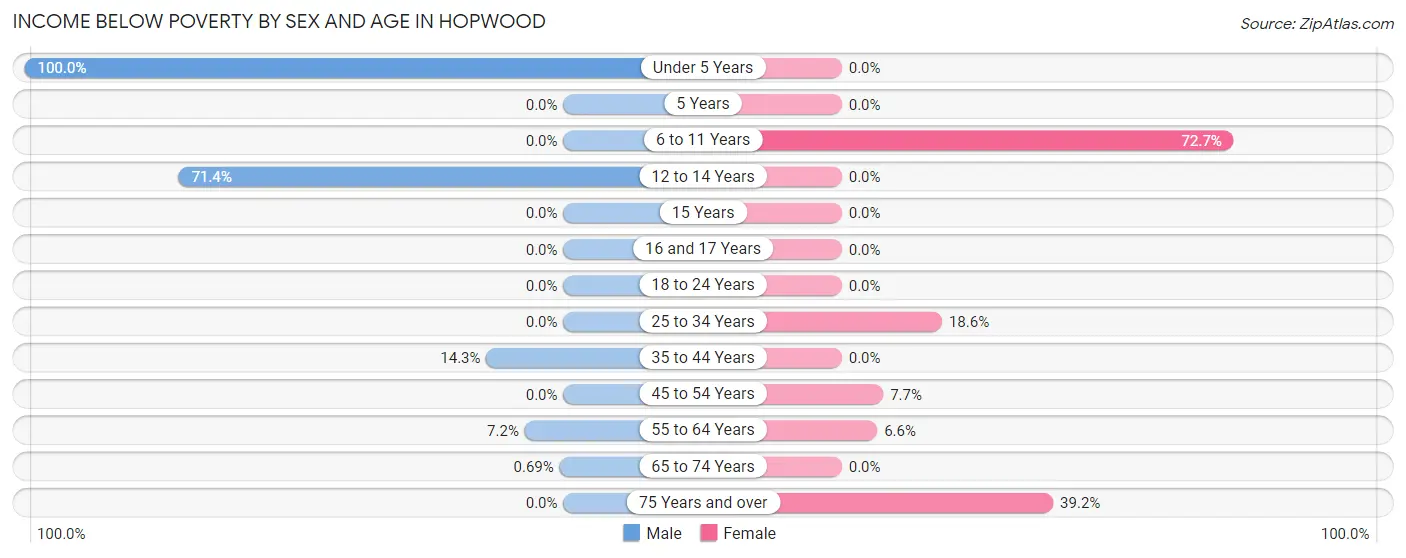
| Age Bracket | Male | Female |
| Under 5 Years | 16 (100.0%) | 0 (0.0%) |
| 5 Years | 0 (0.0%) | 0 (0.0%) |
| 6 to 11 Years | 0 (0.0%) | 16 (72.7%) |
| 12 to 14 Years | 15 (71.4%) | 0 (0.0%) |
| 15 Years | 0 (0.0%) | 0 (0.0%) |
| 16 and 17 Years | 0 (0.0%) | 0 (0.0%) |
| 18 to 24 Years | 0 (0.0%) | 0 (0.0%) |
| 25 to 34 Years | 0 (0.0%) | 16 (18.6%) |
| 35 to 44 Years | 5 (14.3%) | 0 (0.0%) |
| 45 to 54 Years | 0 (0.0%) | 7 (7.7%) |
| 55 to 64 Years | 16 (7.2%) | 9 (6.6%) |
| 65 to 74 Years | 1 (0.7%) | 0 (0.0%) |
| 75 Years and over | 0 (0.0%) | 82 (39.2%) |
| Total | 53 (6.7%) | 130 (16.0%) |
Income Above Poverty by Sex and Age in Hopwood
According to the poverty statistics in Hopwood, males aged 6 to 11 years and females aged under 5 years are the age groups that are most secure financially, with 100.0% of males and 100.0% of females in these age groups living above the poverty line.
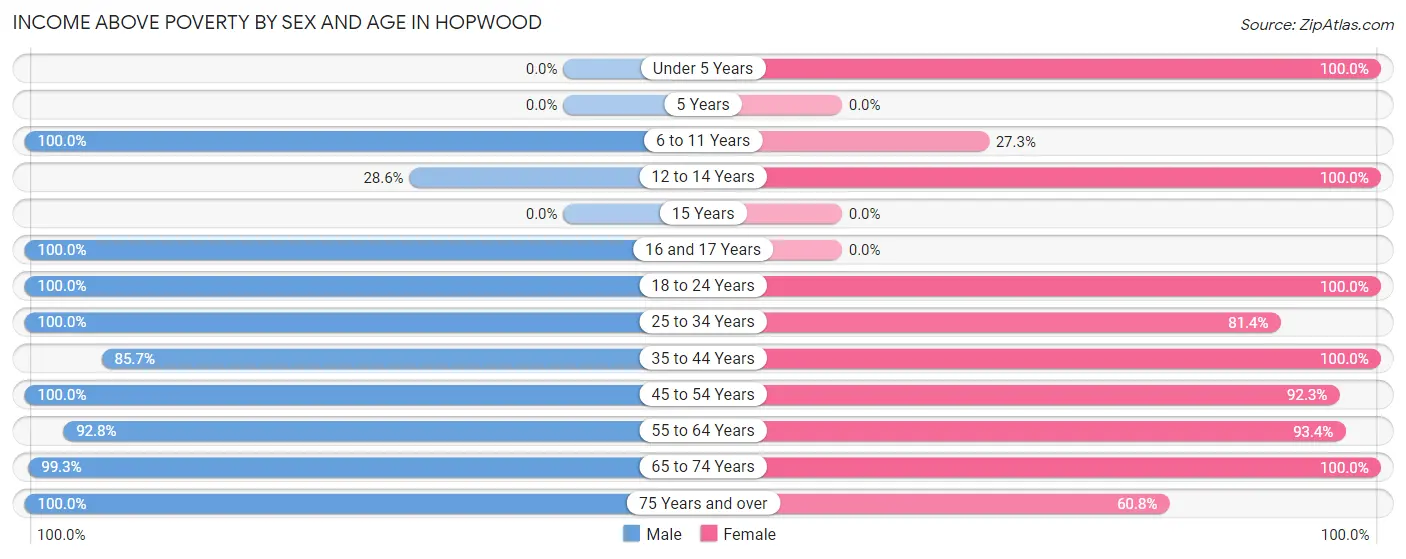
| Age Bracket | Male | Female |
| Under 5 Years | 0 (0.0%) | 10 (100.0%) |
| 5 Years | 0 (0.0%) | 0 (0.0%) |
| 6 to 11 Years | 32 (100.0%) | 6 (27.3%) |
| 12 to 14 Years | 6 (28.6%) | 40 (100.0%) |
| 15 Years | 0 (0.0%) | 0 (0.0%) |
| 16 and 17 Years | 38 (100.0%) | 0 (0.0%) |
| 18 to 24 Years | 25 (100.0%) | 36 (100.0%) |
| 25 to 34 Years | 66 (100.0%) | 70 (81.4%) |
| 35 to 44 Years | 30 (85.7%) | 84 (100.0%) |
| 45 to 54 Years | 86 (100.0%) | 84 (92.3%) |
| 55 to 64 Years | 207 (92.8%) | 128 (93.4%) |
| 65 to 74 Years | 143 (99.3%) | 99 (100.0%) |
| 75 Years and over | 111 (100.0%) | 127 (60.8%) |
| Total | 744 (93.3%) | 684 (84.0%) |
Income Below Poverty Among Married-Couple Families in Hopwood
The poverty statistics for married-couple families in Hopwood show that 2.0% or 7 of the total 350 families live below the poverty line. Families with no children have the highest poverty rate of 2.6%, comprising of 7 families. On the other hand, families with 1 or 2 children have the lowest poverty rate of 0.0%, which includes 0 families.
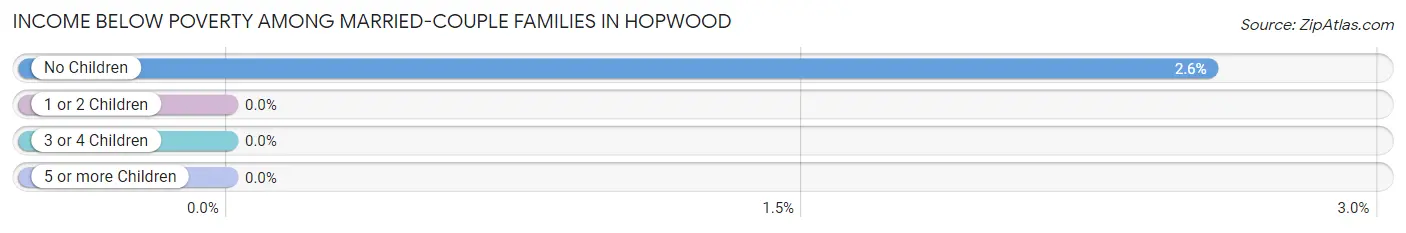
| Children | Above Poverty | Below Poverty |
| No Children | 266 (97.4%) | 7 (2.6%) |
| 1 or 2 Children | 77 (100.0%) | 0 (0.0%) |
| 3 or 4 Children | 0 (0.0%) | 0 (0.0%) |
| 5 or more Children | 0 (0.0%) | 0 (0.0%) |
| Total | 343 (98.0%) | 7 (2.0%) |
Income Below Poverty Among Single-Parent Households in Hopwood
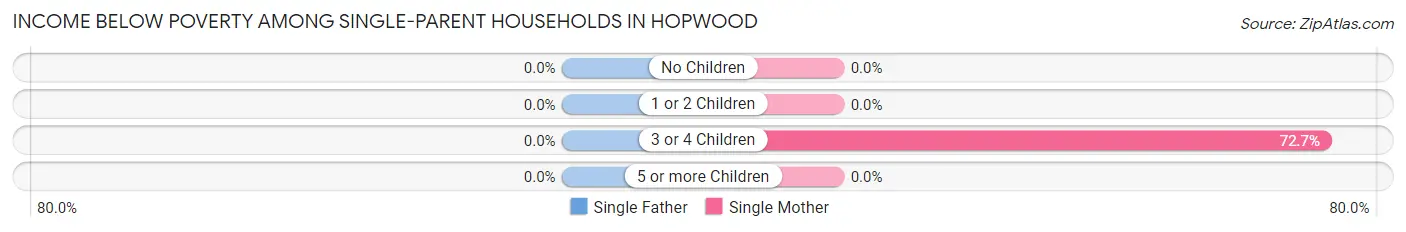
| Children | Single Father | Single Mother |
| No Children | 0 (0.0%) | 0 (0.0%) |
| 1 or 2 Children | 0 (0.0%) | 0 (0.0%) |
| 3 or 4 Children | 0 (0.0%) | 16 (72.7%) |
| 5 or more Children | 0 (0.0%) | 0 (0.0%) |
| Total | 0 (0.0%) | 16 (25.8%) |
Income Below Poverty Among Married-Couple vs Single-Parent Households in Hopwood
The poverty data for Hopwood shows that 7 of the married-couple family households (2.0%) and 16 of the single-parent households (15.4%) are living below the poverty level. Within the married-couple family households, those with no children have the highest poverty rate, with 7 households (2.6%) falling below the poverty line. Among the single-parent households, those with 3 or 4 children have the highest poverty rate, with 16 household (72.7%) living below poverty.
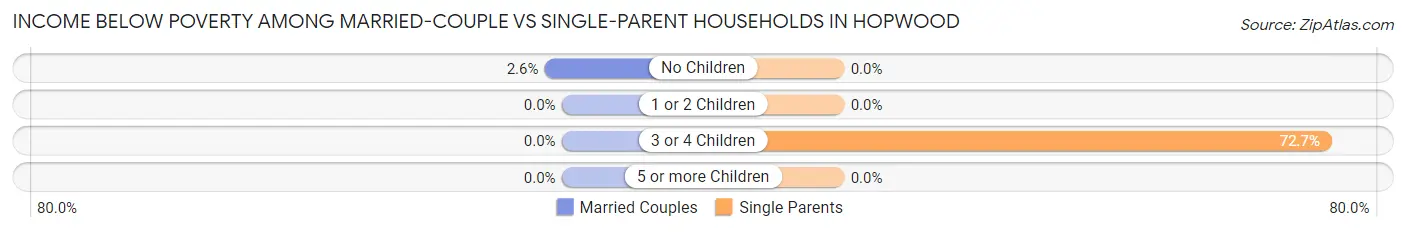
| Children | Married-Couple Families | Single-Parent Households |
| No Children | 7 (2.6%) | 0 (0.0%) |
| 1 or 2 Children | 0 (0.0%) | 0 (0.0%) |
| 3 or 4 Children | 0 (0.0%) | 16 (72.7%) |
| 5 or more Children | 0 (0.0%) | 0 (0.0%) |
| Total | 7 (2.0%) | 16 (15.4%) |
Race in Hopwood
The most populous races in Hopwood are White / Caucasian (1,594 | 98.9%), Asian (9 | 0.6%), and Two or more Races (8 | 0.5%).
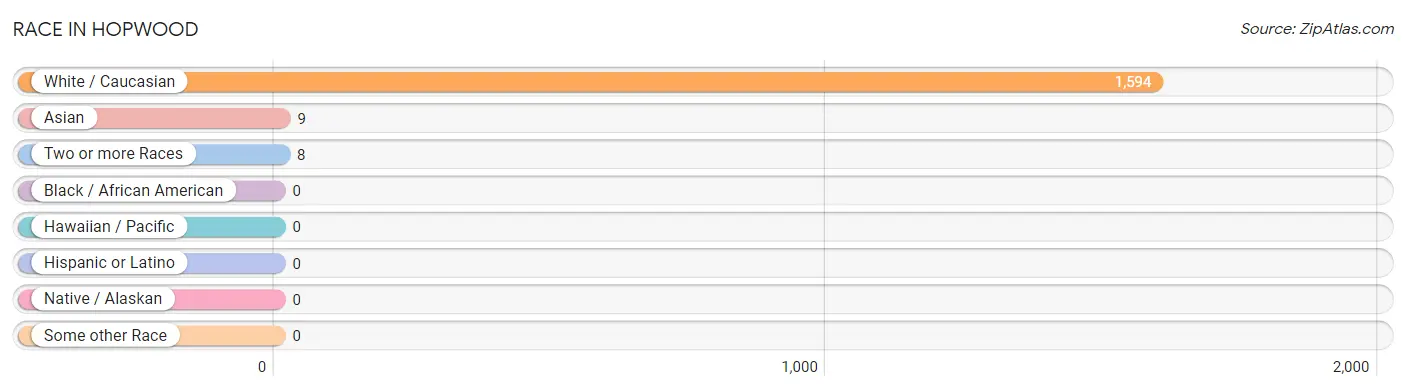
| Race | # Population | % Population |
| Asian | 9 | 0.6% |
| Black / African American | 0 | 0.0% |
| Hawaiian / Pacific | 0 | 0.0% |
| Hispanic or Latino | 0 | 0.0% |
| Native / Alaskan | 0 | 0.0% |
| White / Caucasian | 1,594 | 98.9% |
| Two or more Races | 8 | 0.5% |
| Some other Race | 0 | 0.0% |
| Total | 1,611 | 100.0% |
Ancestry in Hopwood
The most populous ancestries reported in Hopwood are English (285 | 17.7%), Italian (269 | 16.7%), Irish (250 | 15.5%), German (172 | 10.7%), and Slovak (152 | 9.4%), together accounting for 70.0% of all Hopwood residents.
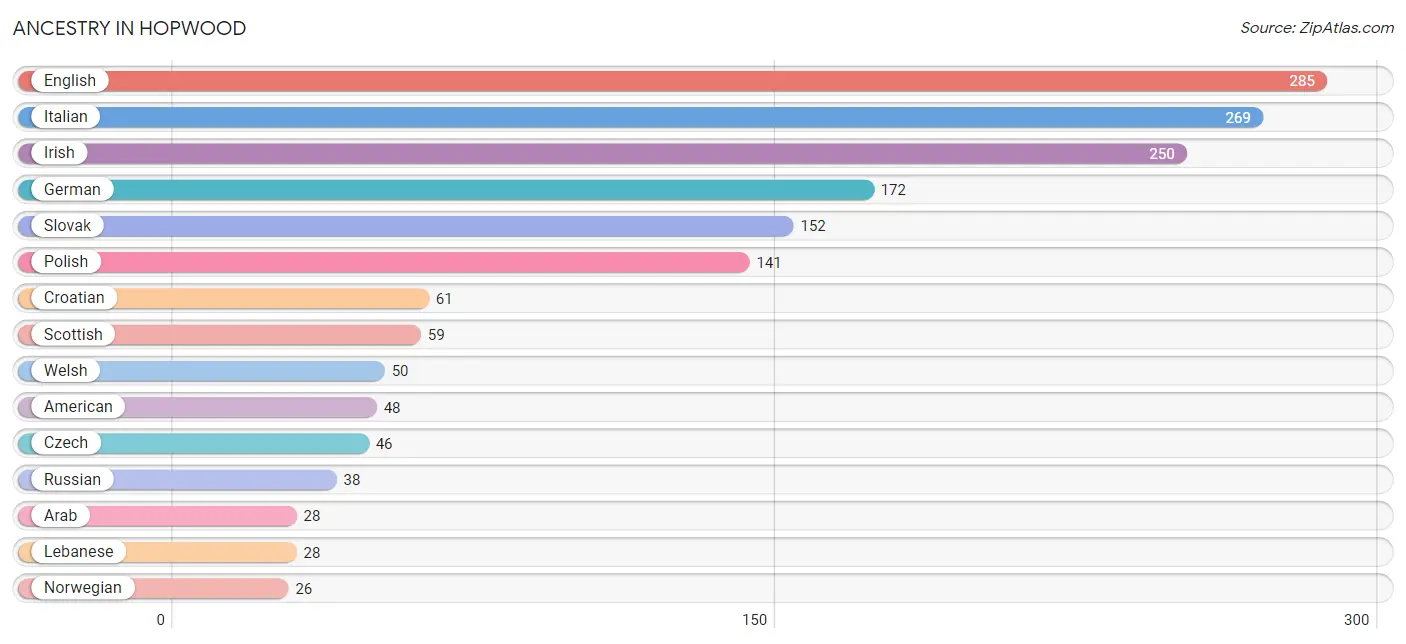
| Ancestry | # Population | % Population |
| American | 48 | 3.0% |
| Arab | 28 | 1.7% |
| Austrian | 12 | 0.7% |
| Croatian | 61 | 3.8% |
| Czech | 46 | 2.9% |
| Czechoslovakian | 6 | 0.4% |
| Dutch | 6 | 0.4% |
| English | 285 | 17.7% |
| European | 12 | 0.7% |
| French | 5 | 0.3% |
| German | 172 | 10.7% |
| Hungarian | 24 | 1.5% |
| Irish | 250 | 15.5% |
| Italian | 269 | 16.7% |
| Korean | 9 | 0.6% |
| Lebanese | 28 | 1.7% |
| Norwegian | 26 | 1.6% |
| Pennsylvania German | 1 | 0.1% |
| Polish | 141 | 8.7% |
| Russian | 38 | 2.4% |
| Scotch-Irish | 8 | 0.5% |
| Scottish | 59 | 3.7% |
| Slovak | 152 | 9.4% |
| Slovene | 12 | 0.7% |
| Welsh | 50 | 3.1% | View All 25 Rows |
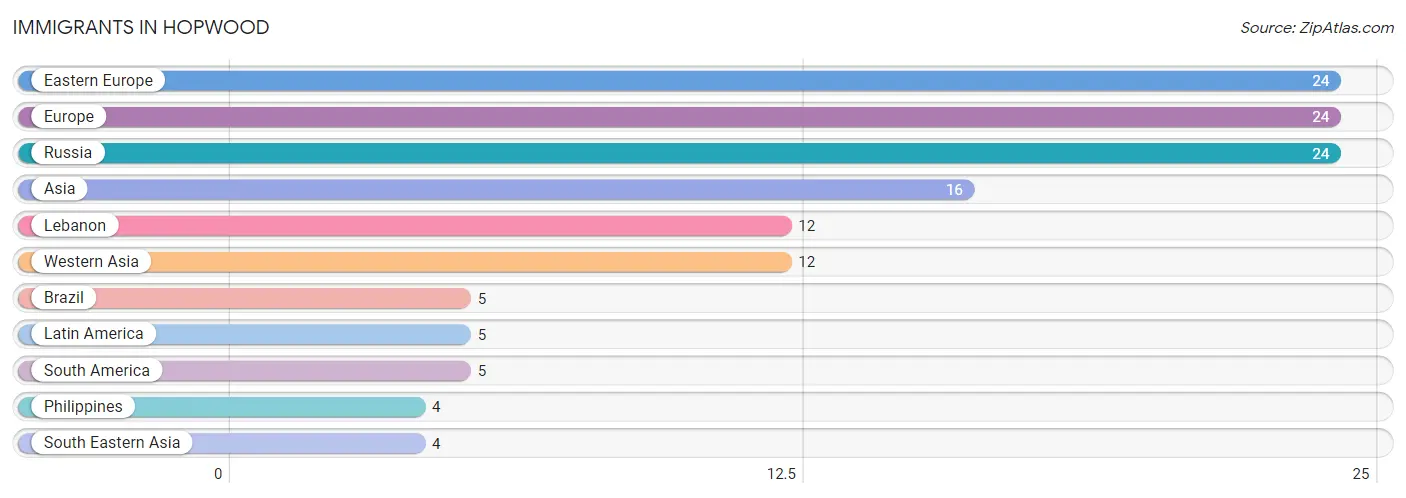
Immigrants in Hopwood
The most numerous immigrant groups reported in Hopwood came from Eastern Europe (24 | 1.5%), Europe (24 | 1.5%), Russia (24 | 1.5%), Asia (16 | 1.0%), and Lebanon (12 | 0.7%), together accounting for 6.2% of all Hopwood residents.
| Immigration Origin | # Population | % Population |
| Asia | 16 | 1.0% |
| Brazil | 5 | 0.3% |
| Eastern Europe | 24 | 1.5% |
| Europe | 24 | 1.5% |
| Latin America | 5 | 0.3% |
| Lebanon | 12 | 0.7% |
| Philippines | 4 | 0.3% |
| Russia | 24 | 1.5% |
| South America | 5 | 0.3% |
| South Eastern Asia | 4 | 0.3% |
| Western Asia | 12 | 0.7% | View All 11 Rows |
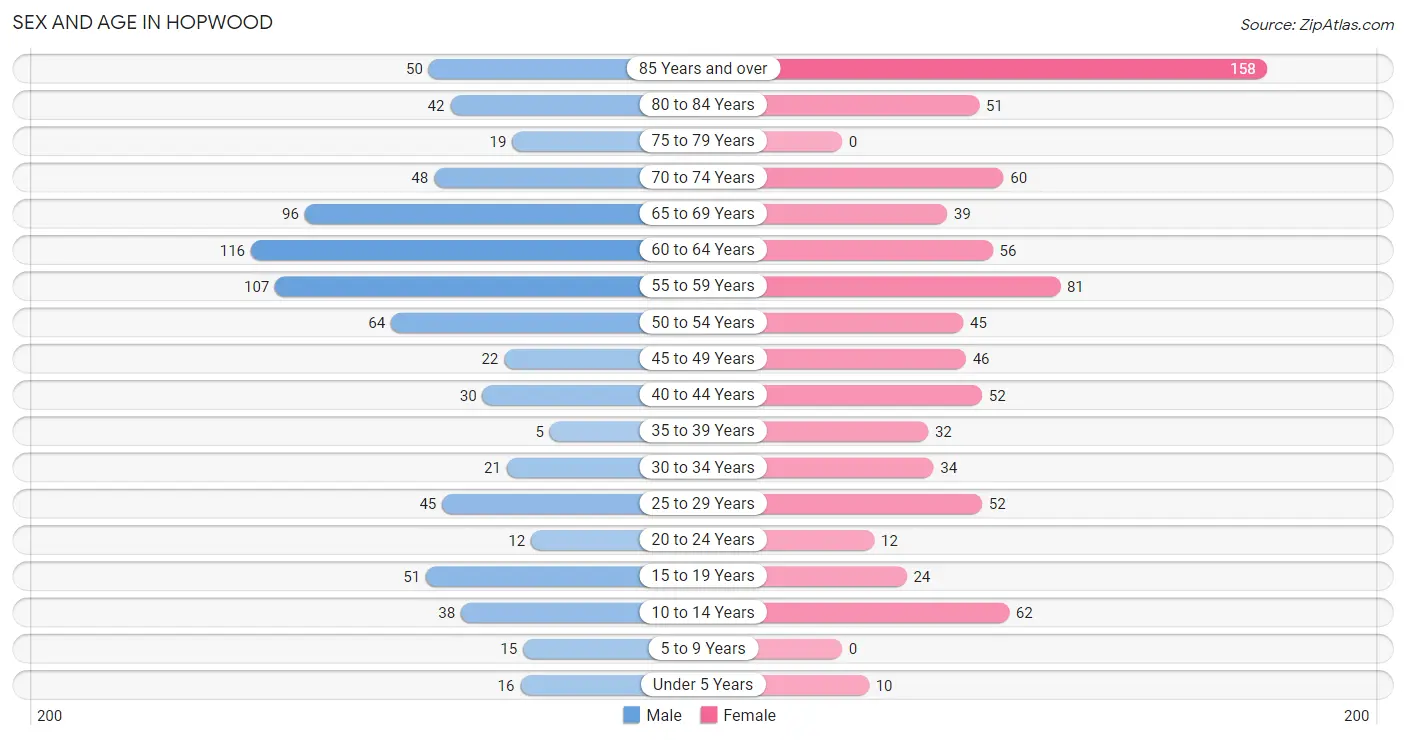
Sex and Age in Hopwood
Sex and Age in Hopwood
The most populous age groups in Hopwood are 60 to 64 Years (116 | 14.5%) for men and 85 Years and over (158 | 19.4%) for women.
| Age Bracket | Male | Female |
| Under 5 Years | 16 (2.0%) | 10 (1.2%) |
| 5 to 9 Years | 15 (1.9%) | 0 (0.0%) |
| 10 to 14 Years | 38 (4.8%) | 62 (7.6%) |
| 15 to 19 Years | 51 (6.4%) | 24 (2.9%) |
| 20 to 24 Years | 12 (1.5%) | 12 (1.5%) |
| 25 to 29 Years | 45 (5.7%) | 52 (6.4%) |
| 30 to 34 Years | 21 (2.6%) | 34 (4.2%) |
| 35 to 39 Years | 5 (0.6%) | 32 (3.9%) |
| 40 to 44 Years | 30 (3.8%) | 52 (6.4%) |
| 45 to 49 Years | 22 (2.8%) | 46 (5.7%) |
| 50 to 54 Years | 64 (8.0%) | 45 (5.5%) |
| 55 to 59 Years | 107 (13.4%) | 81 (10.0%) |
| 60 to 64 Years | 116 (14.5%) | 56 (6.9%) |
| 65 to 69 Years | 96 (12.0%) | 39 (4.8%) |
| 70 to 74 Years | 48 (6.0%) | 60 (7.4%) |
| 75 to 79 Years | 19 (2.4%) | 0 (0.0%) |
| 80 to 84 Years | 42 (5.3%) | 51 (6.3%) |
| 85 Years and over | 50 (6.3%) | 158 (19.4%) |
| Total | 797 (100.0%) | 814 (100.0%) |
Families and Households in Hopwood
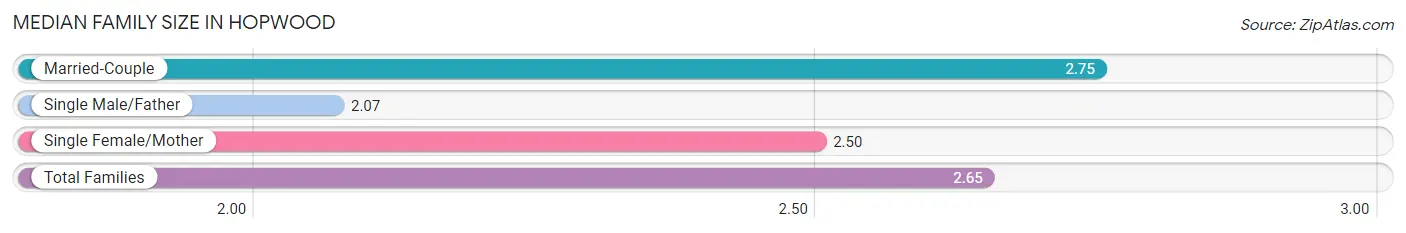
Median Family Size in Hopwood
The median family size in Hopwood is 2.65 persons per family, with married-couple families (350 | 77.1%) accounting for the largest median family size of 2.75 persons per family. On the other hand, single male/father families (42 | 9.2%) represent the smallest median family size with 2.07 persons per family.
| Family Type | # Families | Family Size |
| Married-Couple | 350 (77.1%) | 2.75 |
| Single Male/Father | 42 (9.2%) | 2.07 |
| Single Female/Mother | 62 (13.7%) | 2.50 |
| Total Families | 454 (100.0%) | 2.65 |
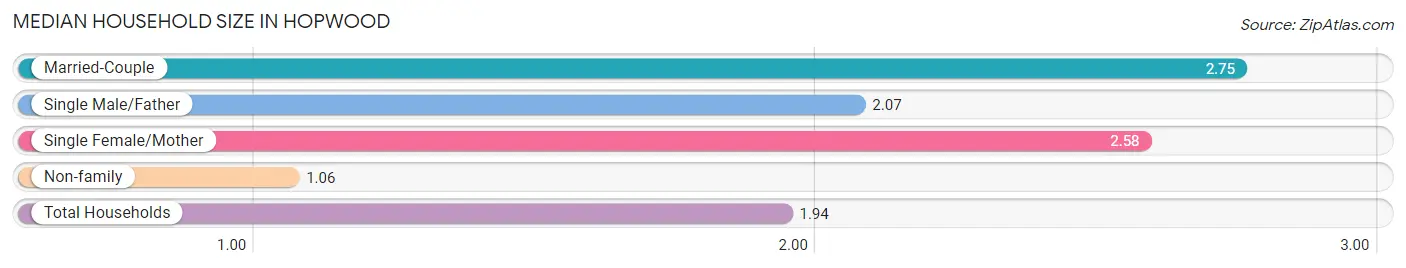
Median Household Size in Hopwood
The median household size in Hopwood is 1.94 persons per household, with married-couple households (350 | 42.3%) accounting for the largest median household size of 2.75 persons per household. non-family households (374 | 45.2%) represent the smallest median household size with 1.06 persons per household.
| Household Type | # Households | Household Size |
| Married-Couple | 350 (42.3%) | 2.75 |
| Single Male/Father | 42 (5.1%) | 2.07 |
| Single Female/Mother | 62 (7.5%) | 2.58 |
| Non-family | 374 (45.2%) | 1.06 |
| Total Households | 828 (100.0%) | 1.94 |
Household Size by Marriage Status in Hopwood
Out of a total of 828 households in Hopwood, 454 (54.8%) are family households, while 374 (45.2%) are nonfamily households. The most numerous type of family households are 2-person households, comprising 237, and the most common type of nonfamily households are 1-person households, comprising 348.
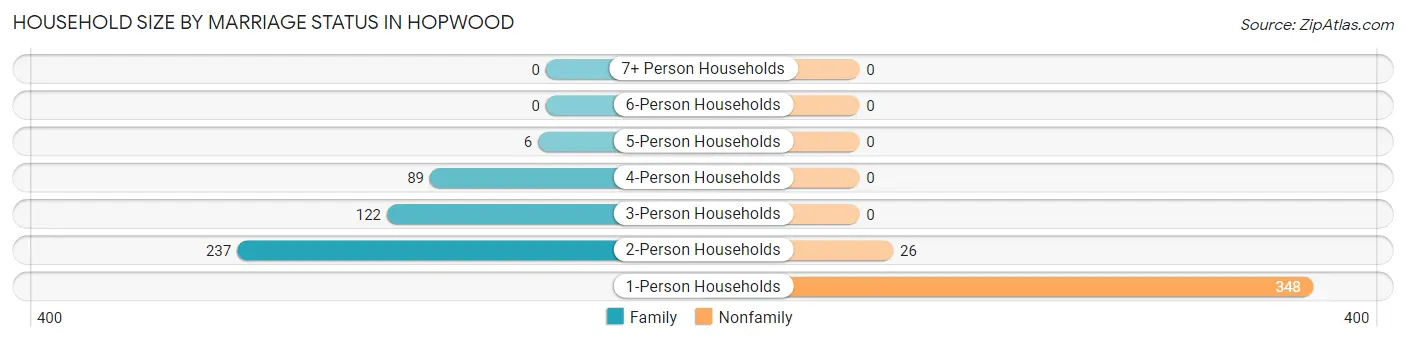
| Household Size | Family Households | Nonfamily Households |
| 1-Person Households | - | 348 (42.0%) |
| 2-Person Households | 237 (28.6%) | 26 (3.1%) |
| 3-Person Households | 122 (14.7%) | 0 (0.0%) |
| 4-Person Households | 89 (10.7%) | 0 (0.0%) |
| 5-Person Households | 6 (0.7%) | 0 (0.0%) |
| 6-Person Households | 0 (0.0%) | 0 (0.0%) |
| 7+ Person Households | 0 (0.0%) | 0 (0.0%) |
| Total | 454 (54.8%) | 374 (45.2%) |
Female Fertility in Hopwood
Fertility by Age in Hopwood
Average fertility rate in Hopwood is 36.0 births per 1,000 women. Women in the age bracket of 35 to 50 years have the highest fertility rate with 69.0 births per 1,000 women. Women in the age bracket of 35 to 50 years acount for 100.0% of all women with births.
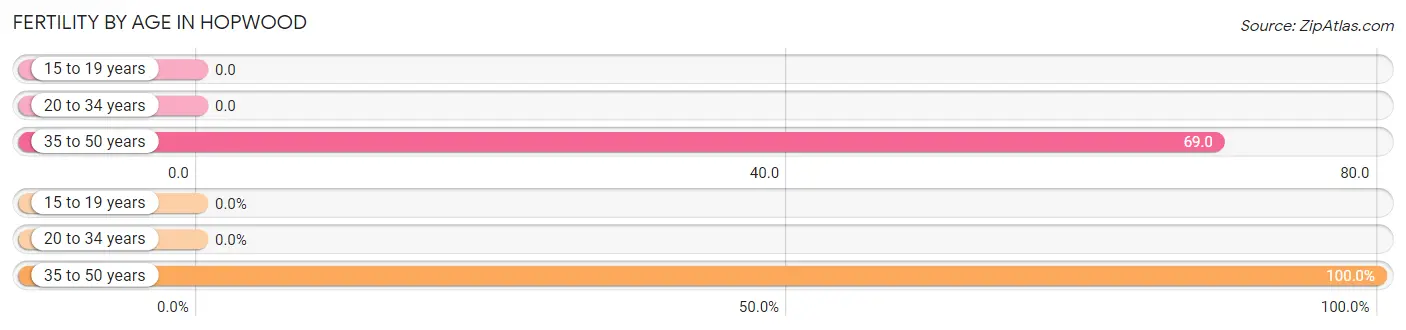
| Age Bracket | Women with Births | Births / 1,000 Women |
| 15 to 19 years | 0 (0.0%) | 0.0 |
| 20 to 34 years | 0 (0.0%) | 0.0 |
| 35 to 50 years | 9 (100.0%) | 69.0 |
| Total | 9 (100.0%) | 36.0 |
Fertility by Age by Marriage Status in Hopwood
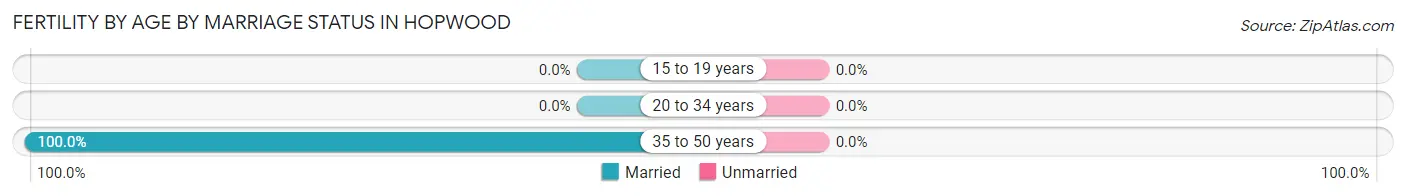
| Age Bracket | Married | Unmarried |
| 15 to 19 years | 0 (0.0%) | 0 (0.0%) |
| 20 to 34 years | 0 (0.0%) | 0 (0.0%) |
| 35 to 50 years | 9 (100.0%) | 0 (0.0%) |
| Total | 9 (100.0%) | 0 (0.0%) |
Fertility by Education in Hopwood
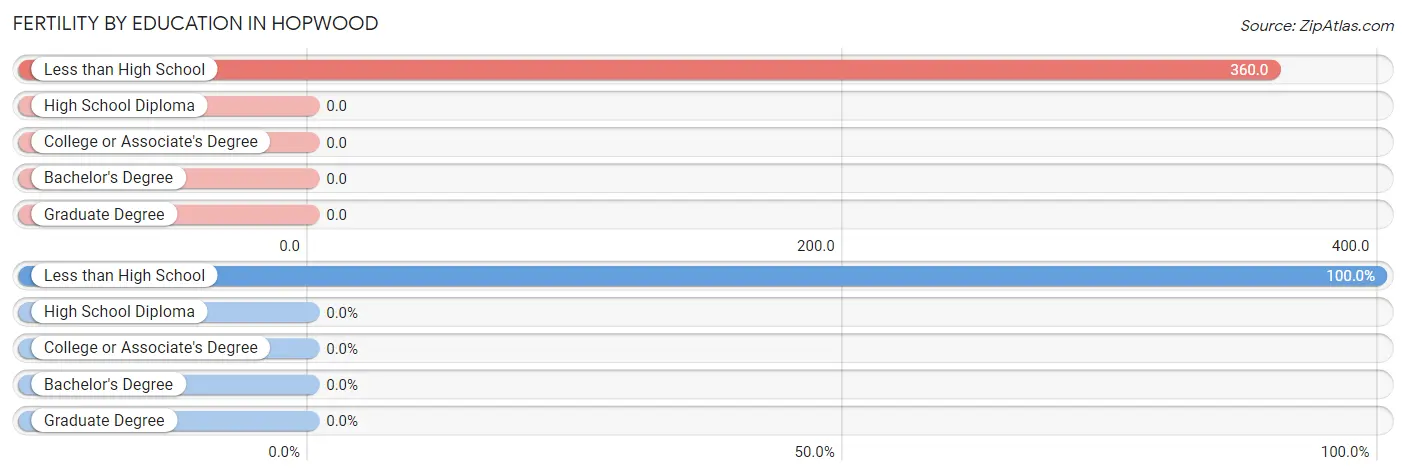
| Educational Attainment | Women with Births | Births / 1,000 Women |
| Less than High School | 9 (100.0%) | 360.0 |
| High School Diploma | 0 (0.0%) | 0.0 |
| College or Associate's Degree | 0 (0.0%) | 0.0 |
| Bachelor's Degree | 0 (0.0%) | 0.0 |
| Graduate Degree | 0 (0.0%) | 0.0 |
| Total | 9 (100.0%) | 36.0 |
Fertility by Education by Marriage Status in Hopwood
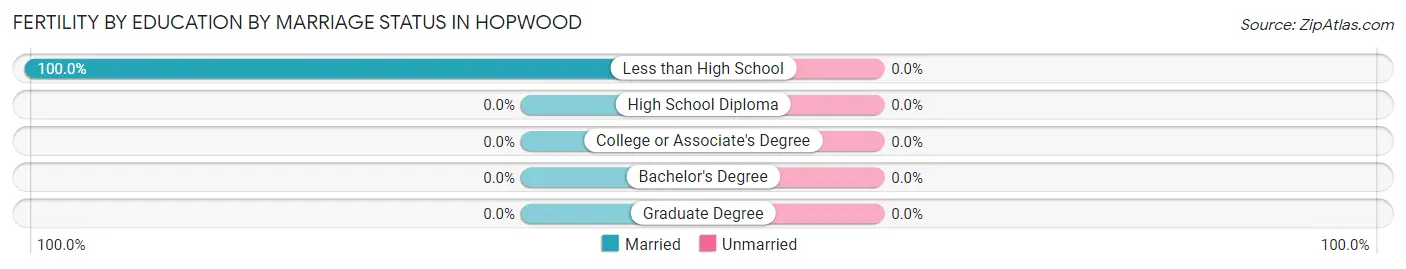
| Educational Attainment | Married | Unmarried |
| Less than High School | 9 (100.0%) | 0 (0.0%) |
| High School Diploma | 0 (0.0%) | 0 (0.0%) |
| College or Associate's Degree | 0 (0.0%) | 0 (0.0%) |
| Bachelor's Degree | 0 (0.0%) | 0 (0.0%) |
| Graduate Degree | 0 (0.0%) | 0 (0.0%) |
| Total | 9 (100.0%) | 0 (0.0%) |
Employment Characteristics in Hopwood
Employment by Class of Employer in Hopwood
Among the 685 employed individuals in Hopwood, private company employees (319 | 46.6%), local government employees (101 | 14.7%), and not-for-profit organizations (84 | 12.3%) make up the most common classes of employment.
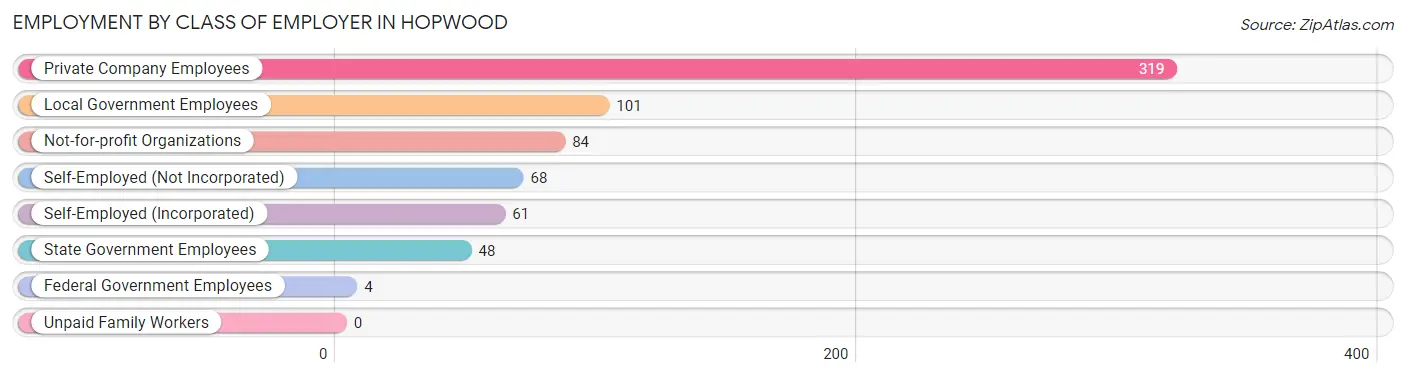
| Employer Class | # Employees | % Employees |
| Private Company Employees | 319 | 46.6% |
| Self-Employed (Incorporated) | 61 | 8.9% |
| Self-Employed (Not Incorporated) | 68 | 9.9% |
| Not-for-profit Organizations | 84 | 12.3% |
| Local Government Employees | 101 | 14.7% |
| State Government Employees | 48 | 7.0% |
| Federal Government Employees | 4 | 0.6% |
| Unpaid Family Workers | 0 | 0.0% |
| Total | 685 | 100.0% |
Employment Status by Age in Hopwood
According to the labor force statistics for Hopwood, out of the total population over 16 years of age (1,470), 51.4% or 756 individuals are in the labor force, with 9.1% or 69 of them unemployed. The age group with the highest labor force participation rate is 20 to 24 years, with 100.0% or 24 individuals in the labor force. Within the labor force, the 30 to 34 years age range has the highest percentage of unemployed individuals, with 22.0% or 11 of them being unemployed.
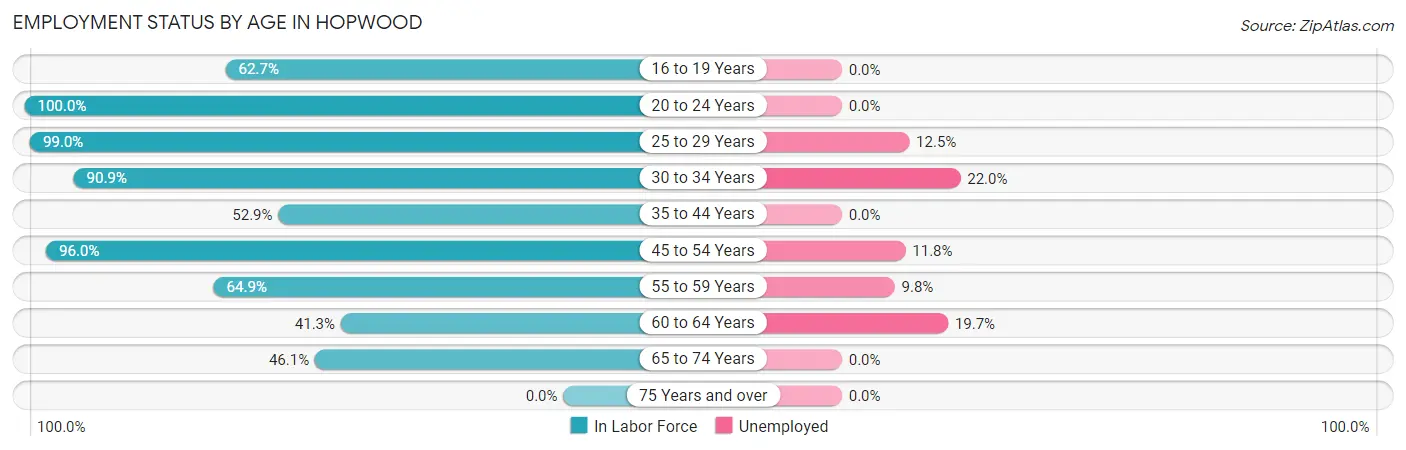
| Age Bracket | In Labor Force | Unemployed |
| 16 to 19 Years | 47 (62.7%) | 0 (0.0%) |
| 20 to 24 Years | 24 (100.0%) | 0 (0.0%) |
| 25 to 29 Years | 96 (99.0%) | 12 (12.5%) |
| 30 to 34 Years | 50 (90.9%) | 11 (22.0%) |
| 35 to 44 Years | 63 (52.9%) | 0 (0.0%) |
| 45 to 54 Years | 170 (96.0%) | 20 (11.8%) |
| 55 to 59 Years | 122 (64.9%) | 12 (9.8%) |
| 60 to 64 Years | 71 (41.3%) | 14 (19.7%) |
| 65 to 74 Years | 112 (46.1%) | 0 (0.0%) |
| 75 Years and over | 0 (0.0%) | 0 (0.0%) |
| Total | 756 (51.4%) | 69 (9.1%) |
Employment Status by Educational Attainment in Hopwood
According to labor force statistics for Hopwood, 70.8% of individuals (572) out of the total population between 25 and 64 years of age (808) are in the labor force, with 12.1% or 69 of them being unemployed. The group with the highest labor force participation rate are those with the educational attainment of bachelor's degree or higher, with 85.1% or 211 individuals in the labor force. Within the labor force, individuals with college / associate degree education have the highest percentage of unemployment, with 28.3% or 49 of them being unemployed.
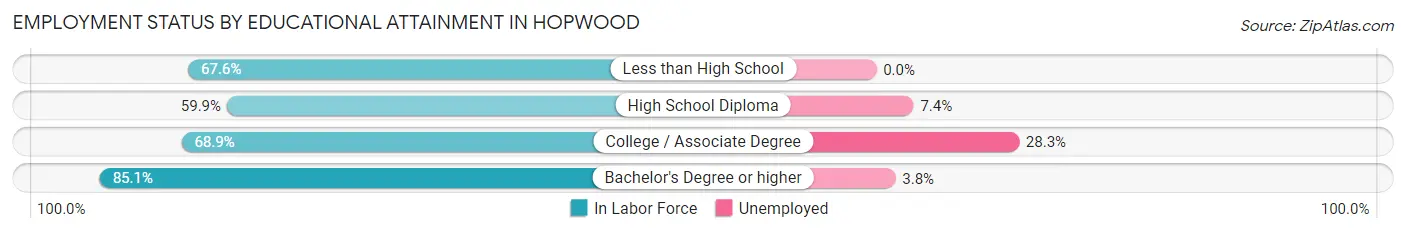
| Educational Attainment | In Labor Force | Unemployed |
| Less than High School | 25 (67.6%) | 0 (0.0%) |
| High School Diploma | 163 (59.9%) | 20 (7.4%) |
| College / Associate Degree | 173 (68.9%) | 71 (28.3%) |
| Bachelor's Degree or higher | 211 (85.1%) | 9 (3.8%) |
| Total | 572 (70.8%) | 98 (12.1%) |
Employment Occupations by Sex in Hopwood
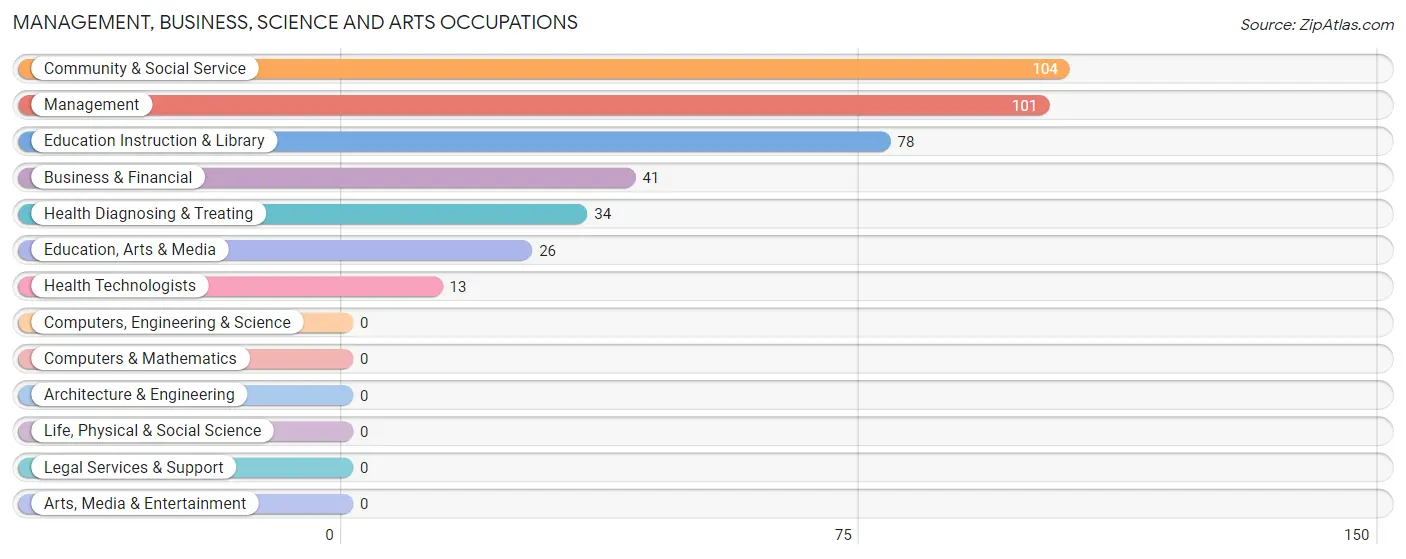
Management, Business, Science and Arts Occupations
The most common Management, Business, Science and Arts occupations in Hopwood are Community & Social Service (104 | 15.2%), Management (101 | 14.7%), Education Instruction & Library (78 | 11.4%), Business & Financial (41 | 6.0%), and Health Diagnosing & Treating (34 | 5.0%).
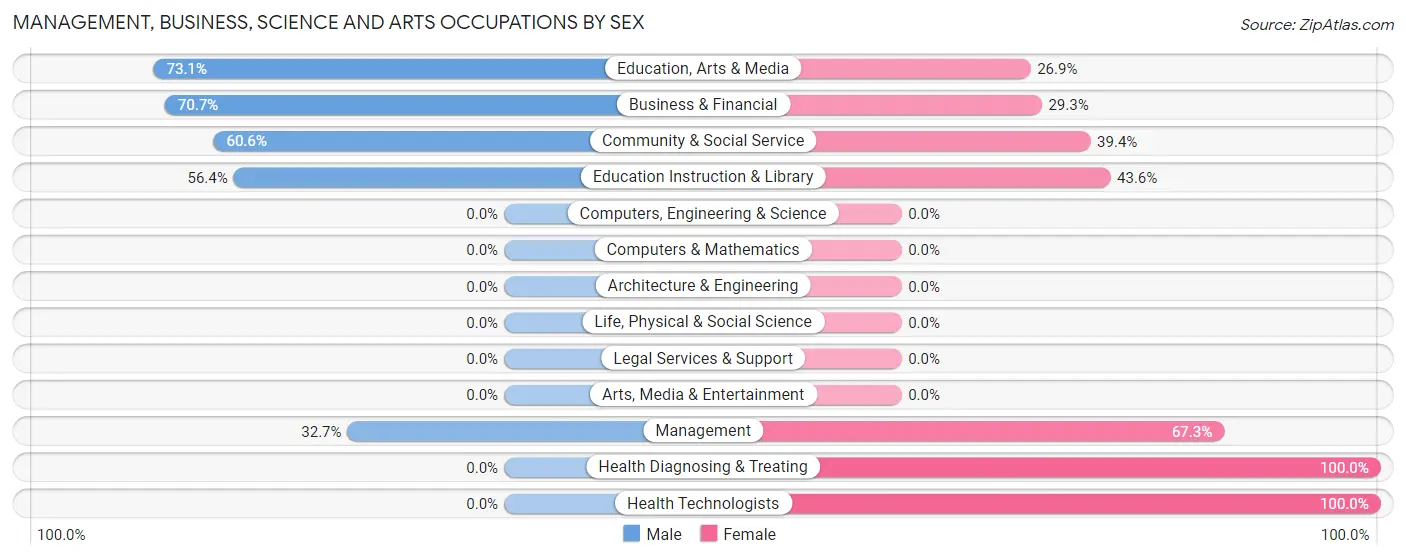
Management, Business, Science and Arts Occupations by Sex
Within the Management, Business, Science and Arts occupations in Hopwood, the most male-oriented occupations are Education, Arts & Media (73.1%), Business & Financial (70.7%), and Community & Social Service (60.6%), while the most female-oriented occupations are Health Diagnosing & Treating (100.0%), Health Technologists (100.0%), and Management (67.3%).
| Occupation | Male | Female |
| Management | 33 (32.7%) | 68 (67.3%) |
| Business & Financial | 29 (70.7%) | 12 (29.3%) |
| Computers, Engineering & Science | 0 (0.0%) | 0 (0.0%) |
| Computers & Mathematics | 0 (0.0%) | 0 (0.0%) |
| Architecture & Engineering | 0 (0.0%) | 0 (0.0%) |
| Life, Physical & Social Science | 0 (0.0%) | 0 (0.0%) |
| Community & Social Service | 63 (60.6%) | 41 (39.4%) |
| Education, Arts & Media | 19 (73.1%) | 7 (26.9%) |
| Legal Services & Support | 0 (0.0%) | 0 (0.0%) |
| Education Instruction & Library | 44 (56.4%) | 34 (43.6%) |
| Arts, Media & Entertainment | 0 (0.0%) | 0 (0.0%) |
| Health Diagnosing & Treating | 0 (0.0%) | 34 (100.0%) |
| Health Technologists | 0 (0.0%) | 13 (100.0%) |
| Total (Category) | 125 (44.6%) | 155 (55.4%) |
| Total (Overall) | 326 (47.5%) | 360 (52.5%) |
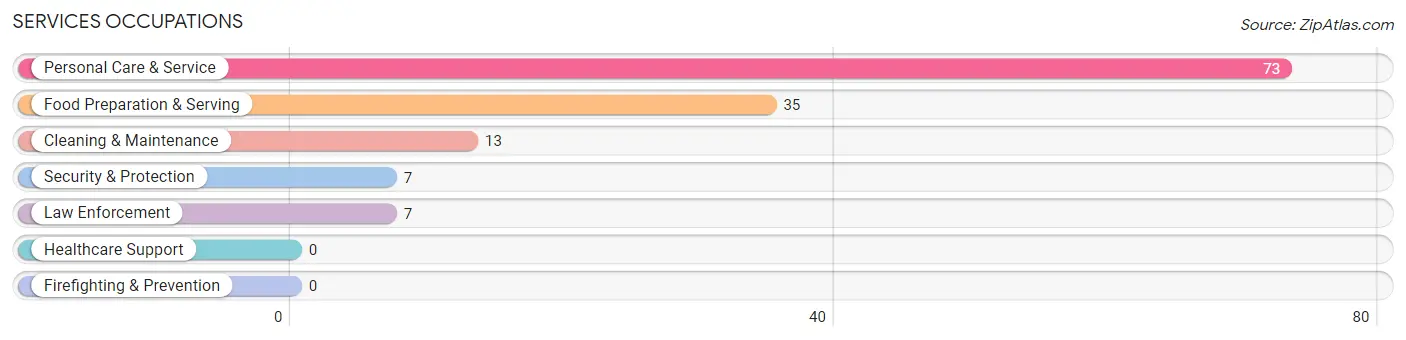
Services Occupations
The most common Services occupations in Hopwood are Personal Care & Service (73 | 10.6%), Food Preparation & Serving (35 | 5.1%), Cleaning & Maintenance (13 | 1.9%), Security & Protection (7 | 1.0%), and Law Enforcement (7 | 1.0%).
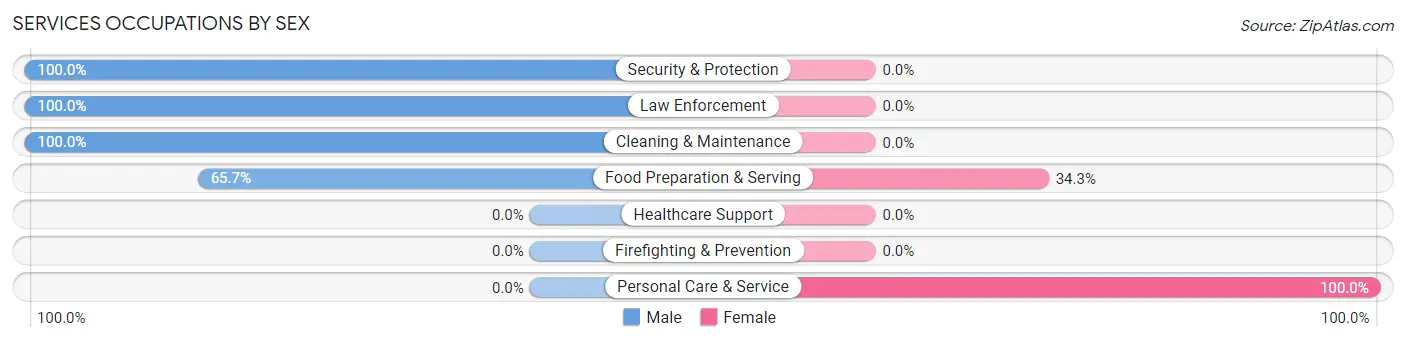
Services Occupations by Sex
Within the Services occupations in Hopwood, the most male-oriented occupations are Security & Protection (100.0%), Law Enforcement (100.0%), and Cleaning & Maintenance (100.0%), while the most female-oriented occupations are Personal Care & Service (100.0%), and Food Preparation & Serving (34.3%).
| Occupation | Male | Female |
| Healthcare Support | 0 (0.0%) | 0 (0.0%) |
| Security & Protection | 7 (100.0%) | 0 (0.0%) |
| Firefighting & Prevention | 0 (0.0%) | 0 (0.0%) |
| Law Enforcement | 7 (100.0%) | 0 (0.0%) |
| Food Preparation & Serving | 23 (65.7%) | 12 (34.3%) |
| Cleaning & Maintenance | 13 (100.0%) | 0 (0.0%) |
| Personal Care & Service | 0 (0.0%) | 73 (100.0%) |
| Total (Category) | 43 (33.6%) | 85 (66.4%) |
| Total (Overall) | 326 (47.5%) | 360 (52.5%) |
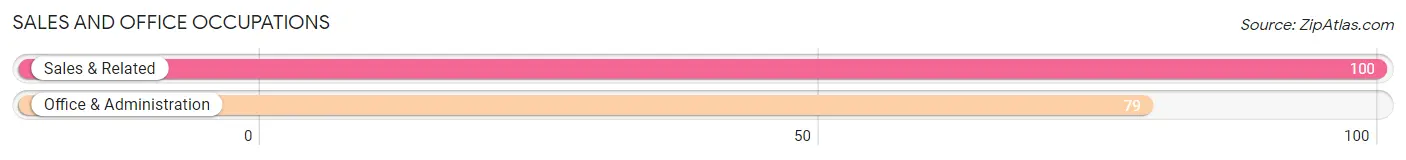
Sales and Office Occupations
The most common Sales and Office occupations in Hopwood are Sales & Related (100 | 14.6%), and Office & Administration (79 | 11.5%).
Sales and Office Occupations by Sex
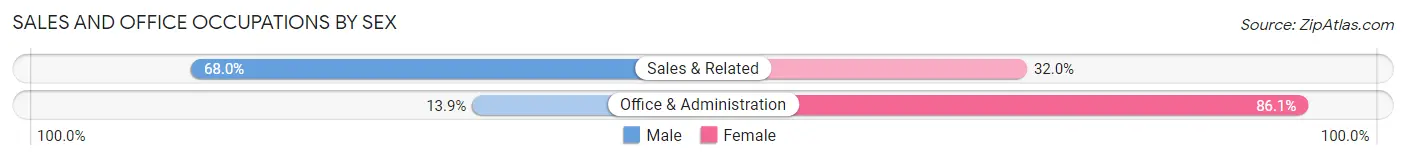
| Occupation | Male | Female |
| Sales & Related | 68 (68.0%) | 32 (32.0%) |
| Office & Administration | 11 (13.9%) | 68 (86.1%) |
| Total (Category) | 79 (44.1%) | 100 (55.9%) |
| Total (Overall) | 326 (47.5%) | 360 (52.5%) |
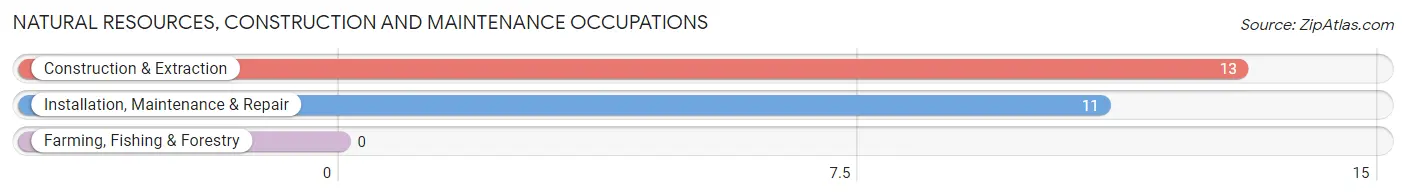
Natural Resources, Construction and Maintenance Occupations
The most common Natural Resources, Construction and Maintenance occupations in Hopwood are Construction & Extraction (13 | 1.9%), and Installation, Maintenance & Repair (11 | 1.6%).
Natural Resources, Construction and Maintenance Occupations by Sex
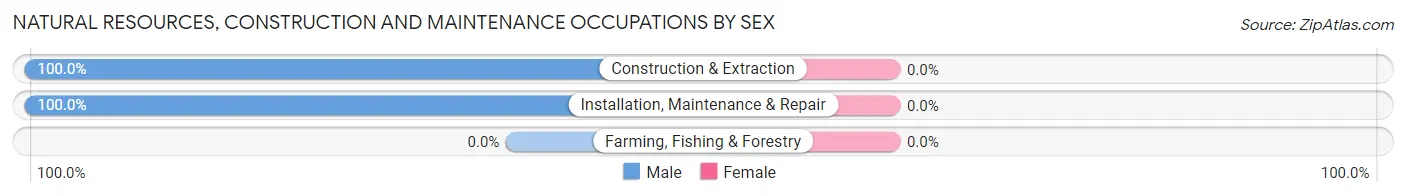
| Occupation | Male | Female |
| Farming, Fishing & Forestry | 0 (0.0%) | 0 (0.0%) |
| Construction & Extraction | 13 (100.0%) | 0 (0.0%) |
| Installation, Maintenance & Repair | 11 (100.0%) | 0 (0.0%) |
| Total (Category) | 24 (100.0%) | 0 (0.0%) |
| Total (Overall) | 326 (47.5%) | 360 (52.5%) |
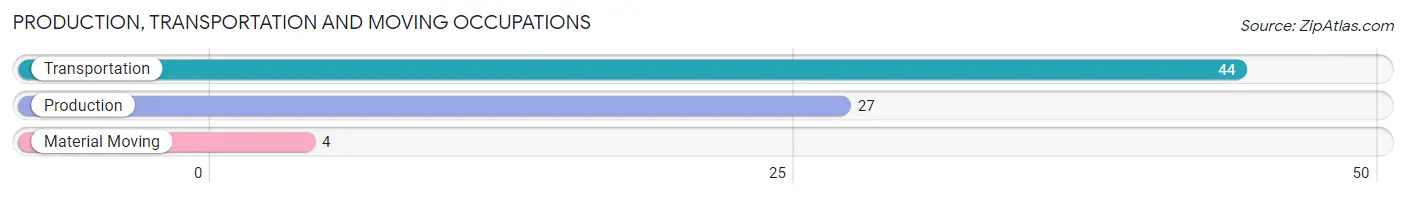
Production, Transportation and Moving Occupations
The most common Production, Transportation and Moving occupations in Hopwood are Transportation (44 | 6.4%), Production (27 | 3.9%), and Material Moving (4 | 0.6%).
Production, Transportation and Moving Occupations by Sex
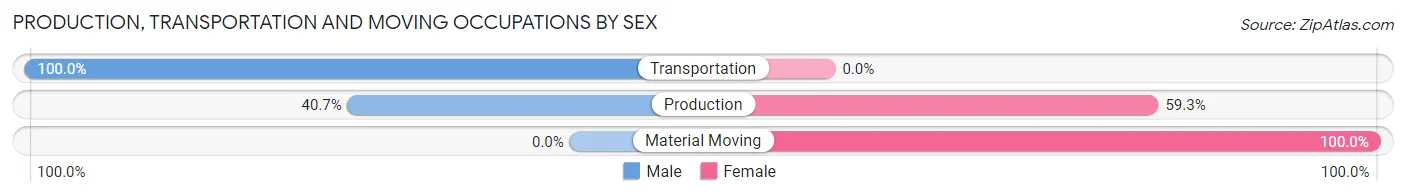
| Occupation | Male | Female |
| Production | 11 (40.7%) | 16 (59.3%) |
| Transportation | 44 (100.0%) | 0 (0.0%) |
| Material Moving | 0 (0.0%) | 4 (100.0%) |
| Total (Category) | 55 (73.3%) | 20 (26.7%) |
| Total (Overall) | 326 (47.5%) | 360 (52.5%) |
Employment Industries by Sex in Hopwood
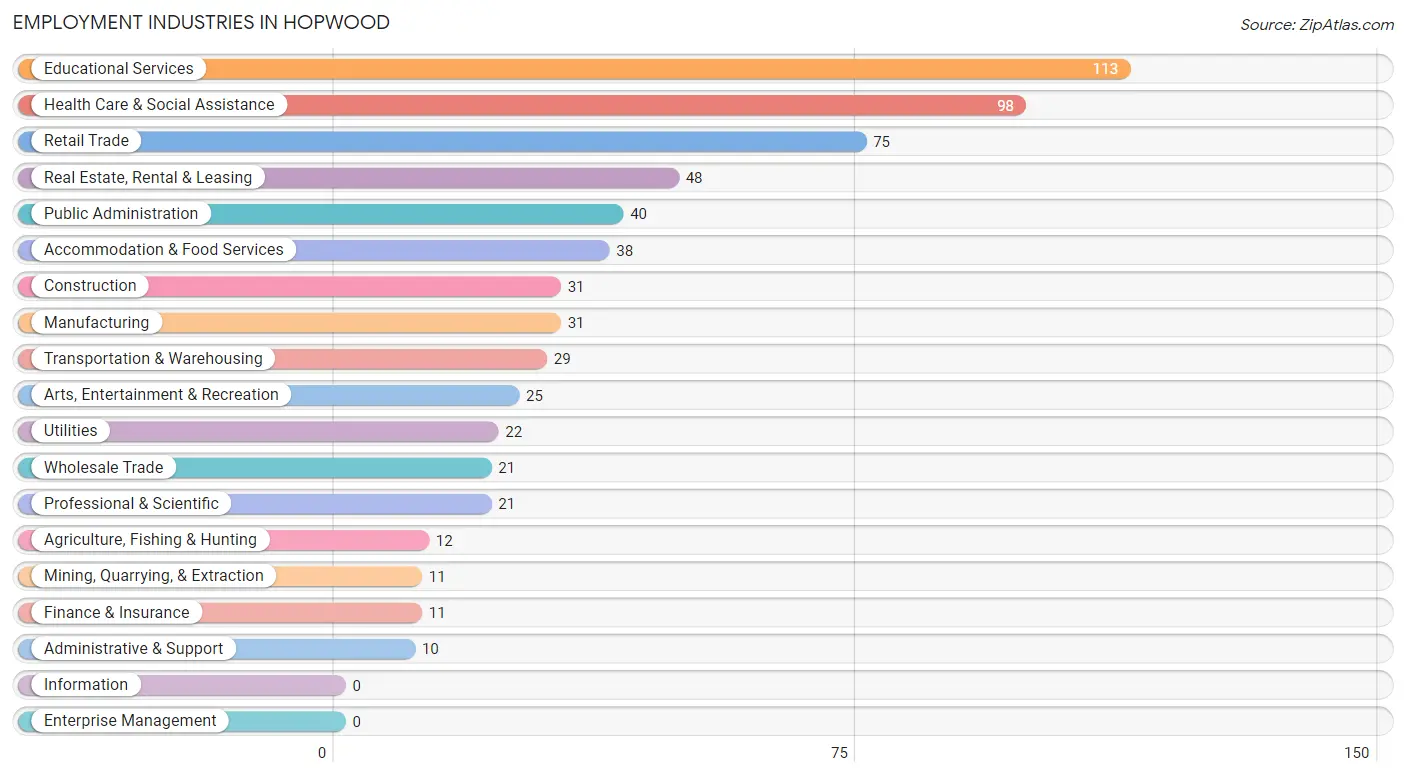
Employment Industries in Hopwood
The major employment industries in Hopwood include Educational Services (113 | 16.5%), Health Care & Social Assistance (98 | 14.3%), Retail Trade (75 | 10.9%), Real Estate, Rental & Leasing (48 | 7.0%), and Public Administration (40 | 5.8%).
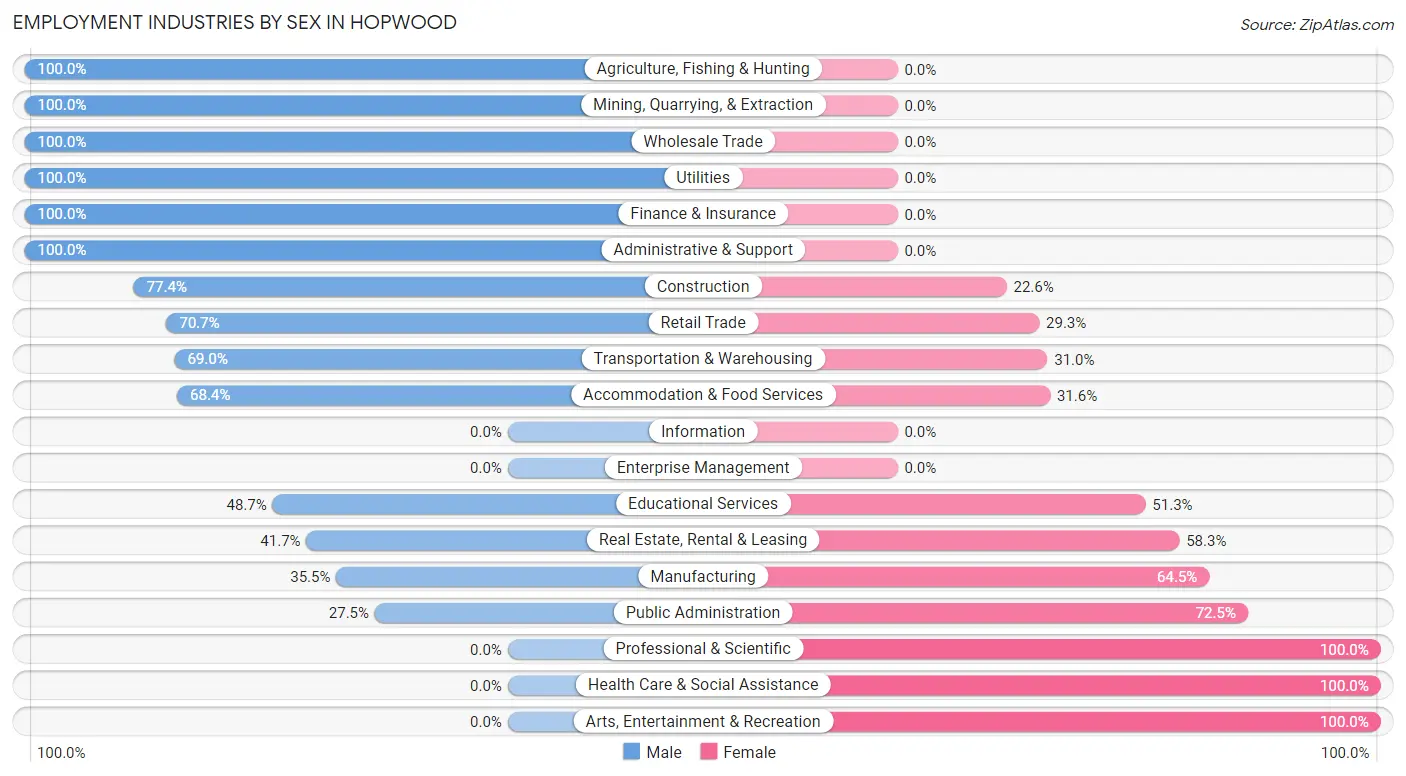
Employment Industries by Sex in Hopwood
The Hopwood industries that see more men than women are Agriculture, Fishing & Hunting (100.0%), Mining, Quarrying, & Extraction (100.0%), and Wholesale Trade (100.0%), whereas the industries that tend to have a higher number of women are Professional & Scientific (100.0%), Health Care & Social Assistance (100.0%), and Arts, Entertainment & Recreation (100.0%).
| Industry | Male | Female |
| Agriculture, Fishing & Hunting | 12 (100.0%) | 0 (0.0%) |
| Mining, Quarrying, & Extraction | 11 (100.0%) | 0 (0.0%) |
| Construction | 24 (77.4%) | 7 (22.6%) |
| Manufacturing | 11 (35.5%) | 20 (64.5%) |
| Wholesale Trade | 21 (100.0%) | 0 (0.0%) |
| Retail Trade | 53 (70.7%) | 22 (29.3%) |
| Transportation & Warehousing | 20 (69.0%) | 9 (31.0%) |
| Utilities | 22 (100.0%) | 0 (0.0%) |
| Information | 0 (0.0%) | 0 (0.0%) |
| Finance & Insurance | 11 (100.0%) | 0 (0.0%) |
| Real Estate, Rental & Leasing | 20 (41.7%) | 28 (58.3%) |
| Professional & Scientific | 0 (0.0%) | 21 (100.0%) |
| Enterprise Management | 0 (0.0%) | 0 (0.0%) |
| Administrative & Support | 10 (100.0%) | 0 (0.0%) |
| Educational Services | 55 (48.7%) | 58 (51.3%) |
| Health Care & Social Assistance | 0 (0.0%) | 98 (100.0%) |
| Arts, Entertainment & Recreation | 0 (0.0%) | 25 (100.0%) |
| Accommodation & Food Services | 26 (68.4%) | 12 (31.6%) |
| Public Administration | 11 (27.5%) | 29 (72.5%) |
| Total | 326 (47.5%) | 360 (52.5%) |
Education in Hopwood
School Enrollment in Hopwood
The most common levels of schooling among the 186 students in Hopwood are high school (63 | 33.9%), elementary school (43 | 23.1%), and middle school (42 | 22.6%).
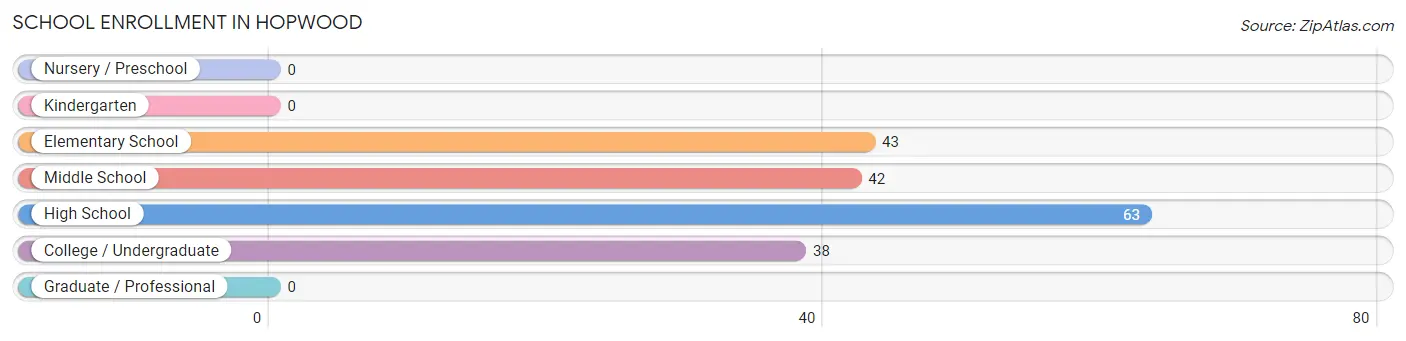
| School Level | # Students | % Students |
| Nursery / Preschool | 0 | 0.0% |
| Kindergarten | 0 | 0.0% |
| Elementary School | 43 | 23.1% |
| Middle School | 42 | 22.6% |
| High School | 63 | 33.9% |
| College / Undergraduate | 38 | 20.4% |
| Graduate / Professional | 0 | 0.0% |
| Total | 186 | 100.0% |
School Enrollment by Age by Funding Source in Hopwood
Out of a total of 186 students who are enrolled in schools in Hopwood, 10 (5.4%) attend a private institution, while the remaining 176 (94.6%) are enrolled in public schools. The age group of 5 to 9 year old has the highest likelihood of being enrolled in private schools, with 10 (100.0% in the age bracket) enrolled. Conversely, the age group of 10 to 14 year olds has the lowest likelihood of being enrolled in a private school, with 100 (100.0% in the age bracket) attending a public institution.
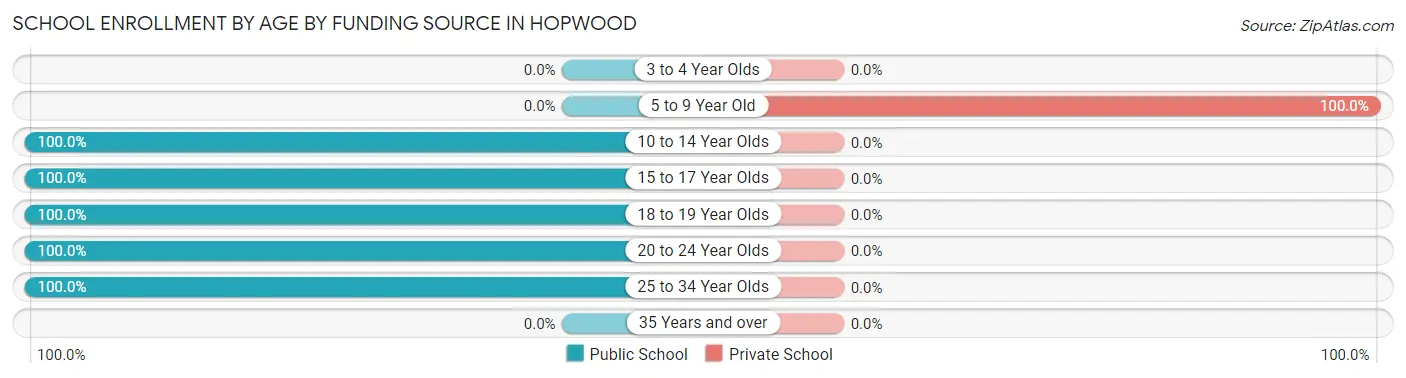
| Age Bracket | Public School | Private School |
| 3 to 4 Year Olds | 0 (0.0%) | 0 (0.0%) |
| 5 to 9 Year Old | 0 (0.0%) | 10 (100.0%) |
| 10 to 14 Year Olds | 100 (100.0%) | 0 (0.0%) |
| 15 to 17 Year Olds | 38 (100.0%) | 0 (0.0%) |
| 18 to 19 Year Olds | 13 (100.0%) | 0 (0.0%) |
| 20 to 24 Year Olds | 12 (100.0%) | 0 (0.0%) |
| 25 to 34 Year Olds | 13 (100.0%) | 0 (0.0%) |
| 35 Years and over | 0 (0.0%) | 0 (0.0%) |
| Total | 176 (94.6%) | 10 (5.4%) |
Educational Attainment by Field of Study in Hopwood
Education (141 | 39.0%), science & technology (39 | 10.8%), bio, nature & agricultural (26 | 7.2%), arts & humanities (26 | 7.2%), and business (19 | 5.2%) are the most common fields of study among 362 individuals in Hopwood who have obtained a bachelor's degree or higher.
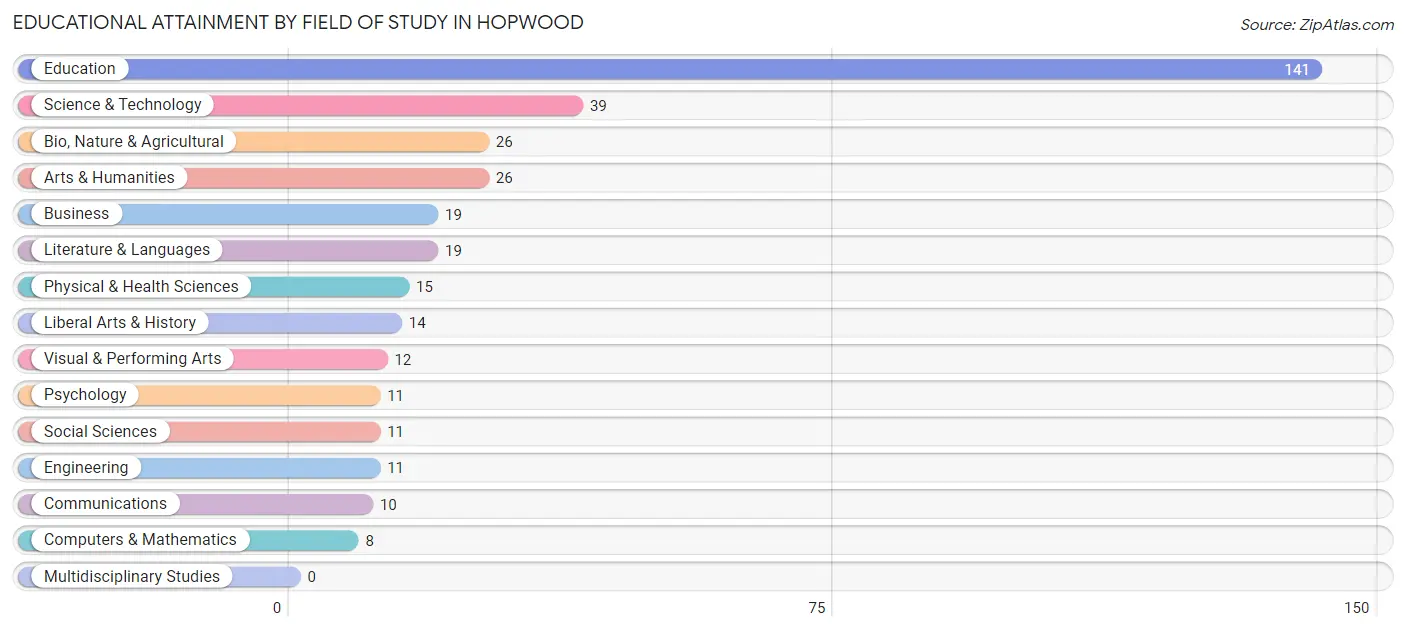
| Field of Study | # Graduates | % Graduates |
| Computers & Mathematics | 8 | 2.2% |
| Bio, Nature & Agricultural | 26 | 7.2% |
| Physical & Health Sciences | 15 | 4.1% |
| Psychology | 11 | 3.0% |
| Social Sciences | 11 | 3.0% |
| Engineering | 11 | 3.0% |
| Multidisciplinary Studies | 0 | 0.0% |
| Science & Technology | 39 | 10.8% |
| Business | 19 | 5.2% |
| Education | 141 | 39.0% |
| Literature & Languages | 19 | 5.2% |
| Liberal Arts & History | 14 | 3.9% |
| Visual & Performing Arts | 12 | 3.3% |
| Communications | 10 | 2.8% |
| Arts & Humanities | 26 | 7.2% |
| Total | 362 | 100.0% |
Transportation & Commute in Hopwood
Vehicle Availability by Sex in Hopwood
The most prevalent vehicle ownership categories in Hopwood are males with 3 vehicles (87, accounting for 26.9%) and females with 3 vehicles (91, making up 24.2%).
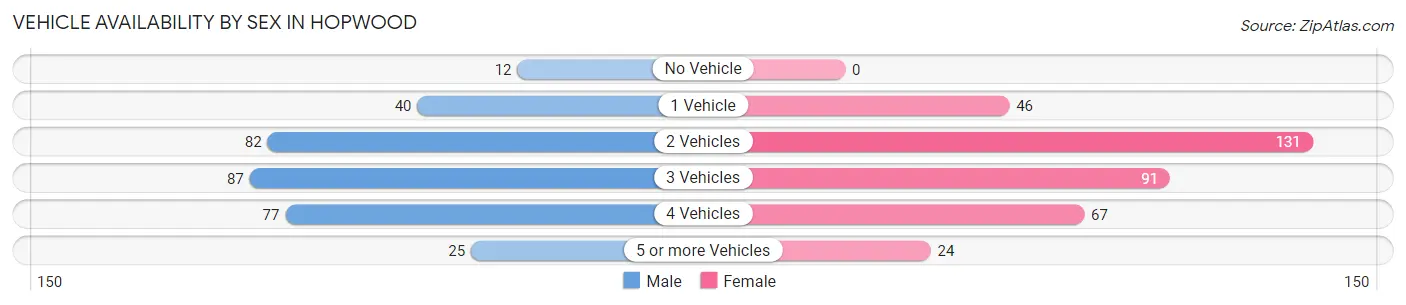
| Vehicles Available | Male | Female |
| No Vehicle | 12 (3.7%) | 0 (0.0%) |
| 1 Vehicle | 40 (12.4%) | 46 (12.8%) |
| 2 Vehicles | 82 (25.4%) | 131 (36.5%) |
| 3 Vehicles | 87 (26.9%) | 91 (25.4%) |
| 4 Vehicles | 77 (23.8%) | 67 (18.7%) |
| 5 or more Vehicles | 25 (7.7%) | 24 (6.7%) |
| Total | 323 (100.0%) | 359 (100.0%) |
Commute Time in Hopwood
The most frequently occuring commute durations in Hopwood are 10 to 14 minutes (208 commuters, 33.7%), 30 to 34 minutes (83 commuters, 13.5%), and 5 to 9 minutes (77 commuters, 12.5%).
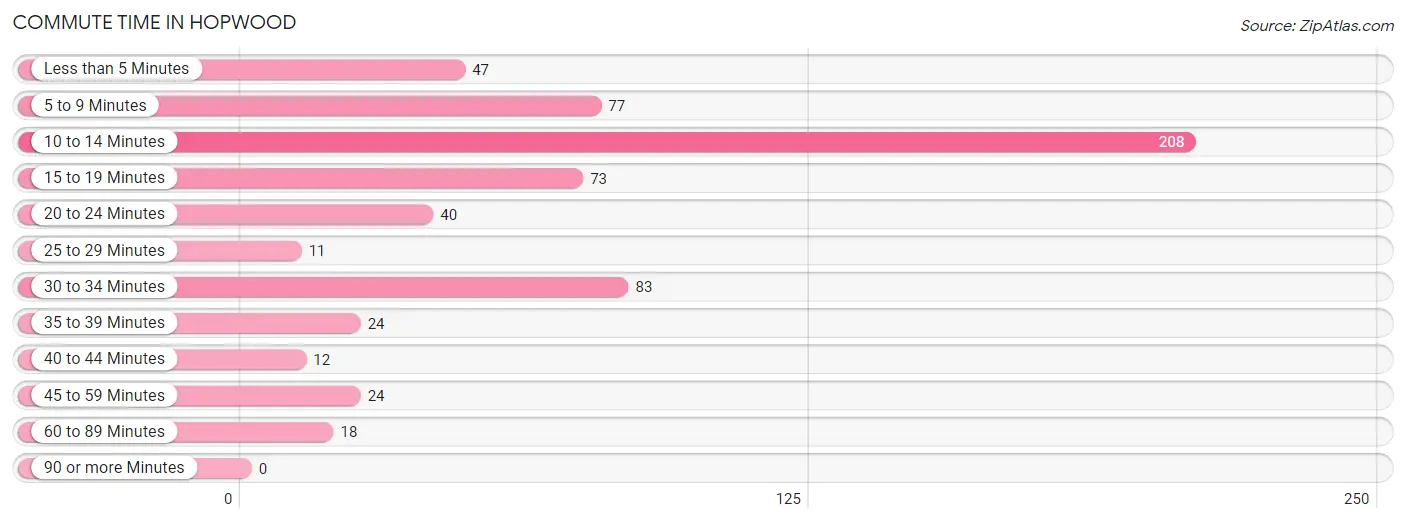
| Commute Time | # Commuters | % Commuters |
| Less than 5 Minutes | 47 | 7.6% |
| 5 to 9 Minutes | 77 | 12.5% |
| 10 to 14 Minutes | 208 | 33.7% |
| 15 to 19 Minutes | 73 | 11.8% |
| 20 to 24 Minutes | 40 | 6.5% |
| 25 to 29 Minutes | 11 | 1.8% |
| 30 to 34 Minutes | 83 | 13.5% |
| 35 to 39 Minutes | 24 | 3.9% |
| 40 to 44 Minutes | 12 | 1.9% |
| 45 to 59 Minutes | 24 | 3.9% |
| 60 to 89 Minutes | 18 | 2.9% |
| 90 or more Minutes | 0 | 0.0% |
Commute Time by Sex in Hopwood
The most common commute times in Hopwood are 10 to 14 minutes (124 commuters, 41.6%) for males and 10 to 14 minutes (84 commuters, 26.3%) for females.
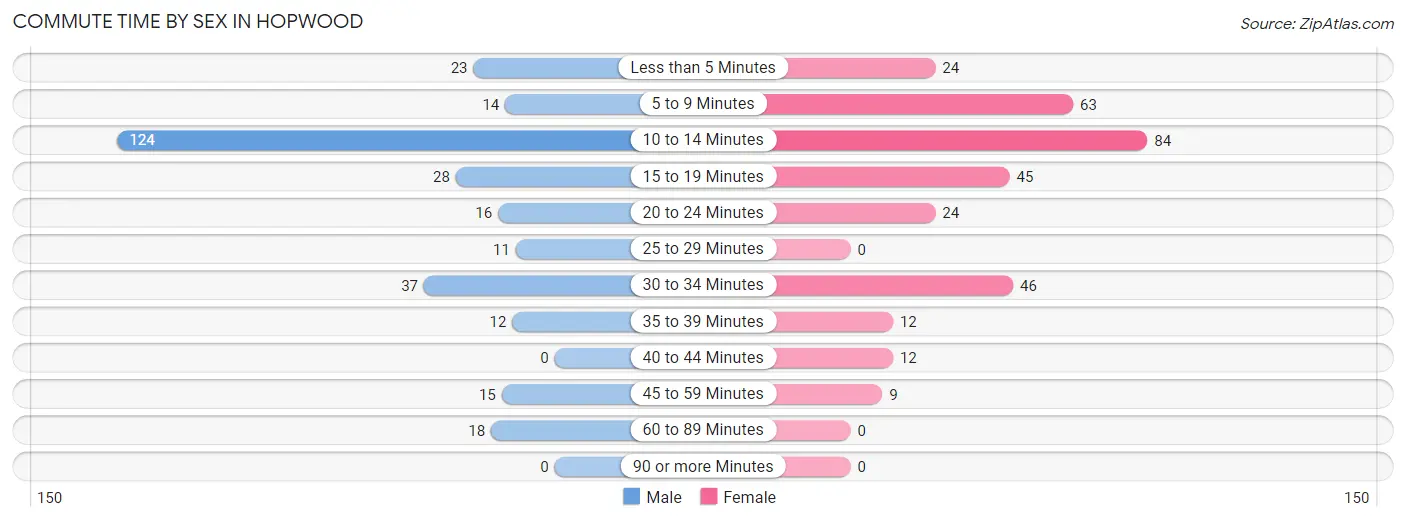
| Commute Time | Male | Female |
| Less than 5 Minutes | 23 (7.7%) | 24 (7.5%) |
| 5 to 9 Minutes | 14 (4.7%) | 63 (19.8%) |
| 10 to 14 Minutes | 124 (41.6%) | 84 (26.3%) |
| 15 to 19 Minutes | 28 (9.4%) | 45 (14.1%) |
| 20 to 24 Minutes | 16 (5.4%) | 24 (7.5%) |
| 25 to 29 Minutes | 11 (3.7%) | 0 (0.0%) |
| 30 to 34 Minutes | 37 (12.4%) | 46 (14.4%) |
| 35 to 39 Minutes | 12 (4.0%) | 12 (3.8%) |
| 40 to 44 Minutes | 0 (0.0%) | 12 (3.8%) |
| 45 to 59 Minutes | 15 (5.0%) | 9 (2.8%) |
| 60 to 89 Minutes | 18 (6.0%) | 0 (0.0%) |
| 90 or more Minutes | 0 (0.0%) | 0 (0.0%) |
Time of Departure to Work by Sex in Hopwood
The most frequent times of departure to work in Hopwood are 8:30 AM to 8:59 AM (62, 20.8%) for males and 7:30 AM to 7:59 AM (96, 30.1%) for females.
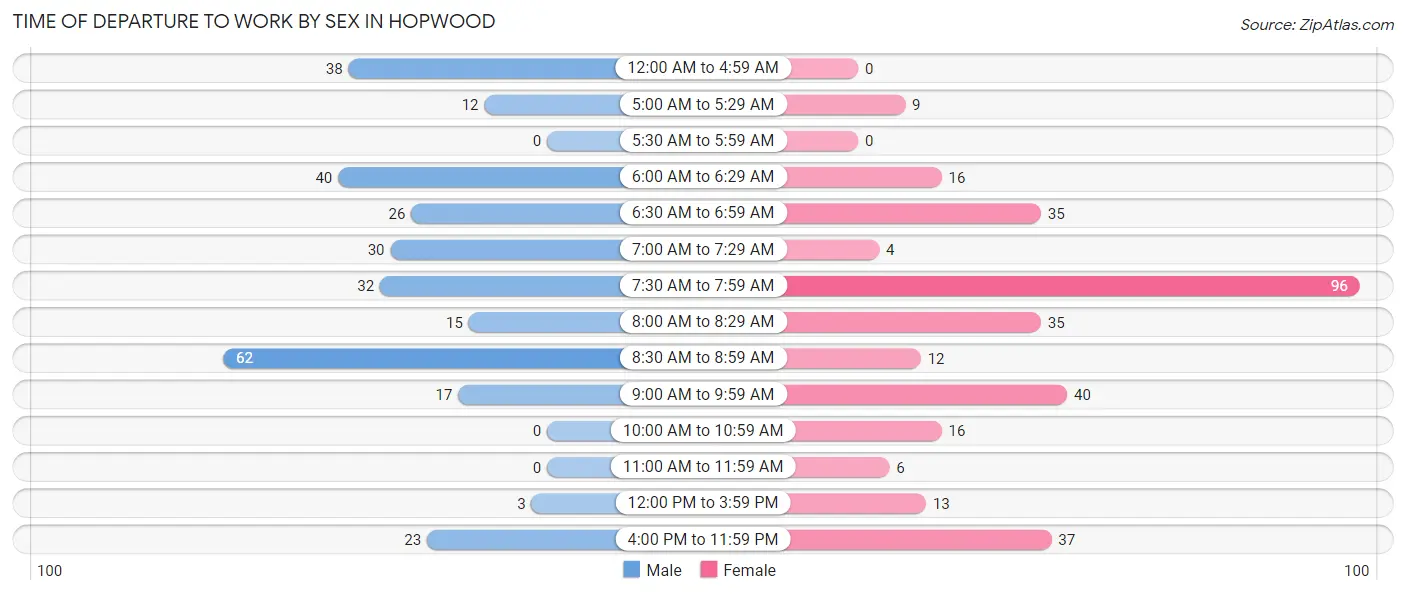
| Time of Departure | Male | Female |
| 12:00 AM to 4:59 AM | 38 (12.8%) | 0 (0.0%) |
| 5:00 AM to 5:29 AM | 12 (4.0%) | 9 (2.8%) |
| 5:30 AM to 5:59 AM | 0 (0.0%) | 0 (0.0%) |
| 6:00 AM to 6:29 AM | 40 (13.4%) | 16 (5.0%) |
| 6:30 AM to 6:59 AM | 26 (8.7%) | 35 (11.0%) |
| 7:00 AM to 7:29 AM | 30 (10.1%) | 4 (1.3%) |
| 7:30 AM to 7:59 AM | 32 (10.7%) | 96 (30.1%) |
| 8:00 AM to 8:29 AM | 15 (5.0%) | 35 (11.0%) |
| 8:30 AM to 8:59 AM | 62 (20.8%) | 12 (3.8%) |
| 9:00 AM to 9:59 AM | 17 (5.7%) | 40 (12.5%) |
| 10:00 AM to 10:59 AM | 0 (0.0%) | 16 (5.0%) |
| 11:00 AM to 11:59 AM | 0 (0.0%) | 6 (1.9%) |
| 12:00 PM to 3:59 PM | 3 (1.0%) | 13 (4.1%) |
| 4:00 PM to 11:59 PM | 23 (7.7%) | 37 (11.6%) |
| Total | 298 (100.0%) | 319 (100.0%) |
Housing Occupancy in Hopwood
Occupancy by Ownership in Hopwood
Of the total 828 dwellings in Hopwood, owner-occupied units account for 713 (86.1%), while renter-occupied units make up 115 (13.9%).
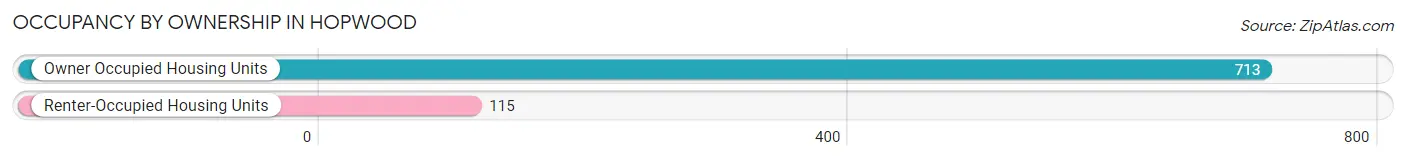
| Occupancy | # Housing Units | % Housing Units |
| Owner Occupied Housing Units | 713 | 86.1% |
| Renter-Occupied Housing Units | 115 | 13.9% |
| Total Occupied Housing Units | 828 | 100.0% |
Occupancy by Household Size in Hopwood
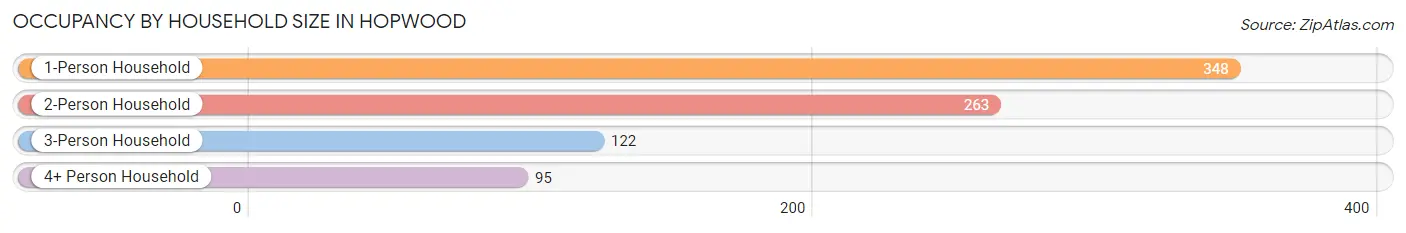
| Household Size | # Housing Units | % Housing Units |
| 1-Person Household | 348 | 42.0% |
| 2-Person Household | 263 | 31.8% |
| 3-Person Household | 122 | 14.7% |
| 4+ Person Household | 95 | 11.5% |
| Total Housing Units | 828 | 100.0% |
Occupancy by Ownership by Household Size in Hopwood
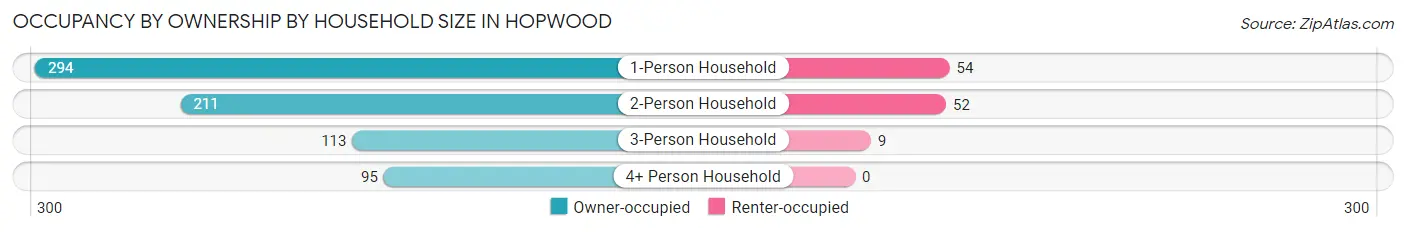
| Household Size | Owner-occupied | Renter-occupied |
| 1-Person Household | 294 (84.5%) | 54 (15.5%) |
| 2-Person Household | 211 (80.2%) | 52 (19.8%) |
| 3-Person Household | 113 (92.6%) | 9 (7.4%) |
| 4+ Person Household | 95 (100.0%) | 0 (0.0%) |
| Total Housing Units | 713 (86.1%) | 115 (13.9%) |
Occupancy by Educational Attainment in Hopwood
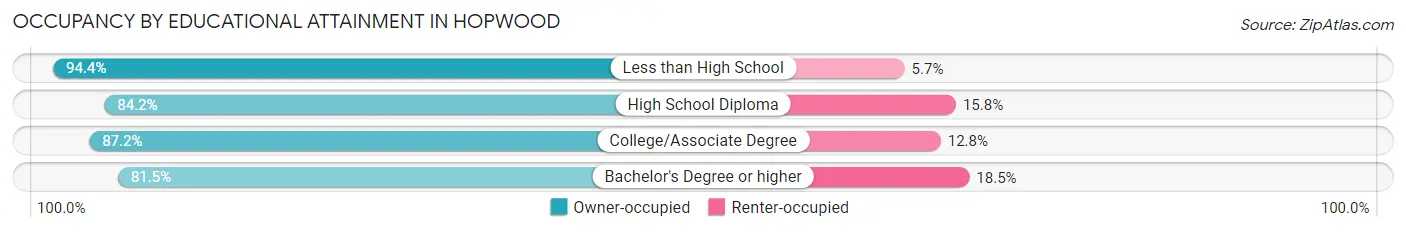
| Household Size | Owner-occupied | Renter-occupied |
| Less than High School | 117 (94.4%) | 7 (5.7%) |
| High School Diploma | 266 (84.2%) | 50 (15.8%) |
| College/Associate Degree | 211 (87.2%) | 31 (12.8%) |
| Bachelor's Degree or higher | 119 (81.5%) | 27 (18.5%) |
Occupancy by Age of Householder in Hopwood
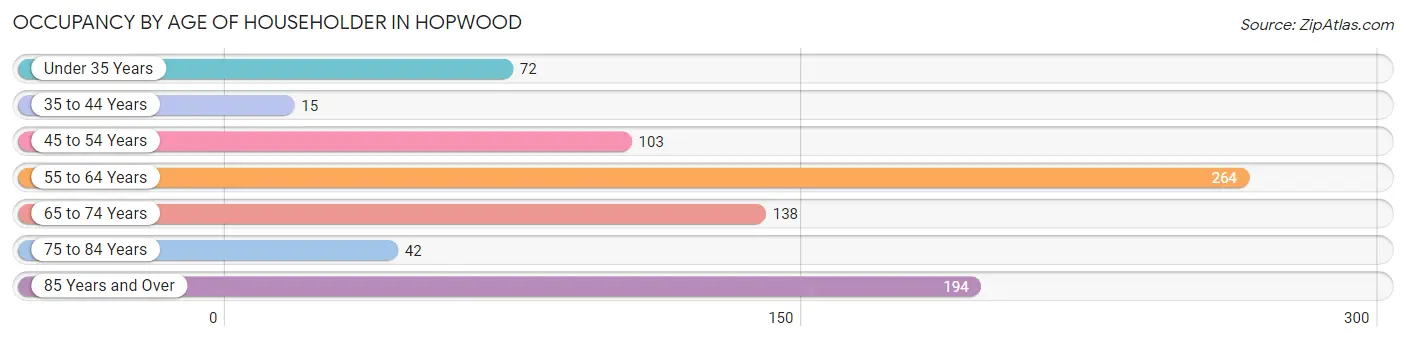
| Age Bracket | # Households | % Households |
| Under 35 Years | 72 | 8.7% |
| 35 to 44 Years | 15 | 1.8% |
| 45 to 54 Years | 103 | 12.4% |
| 55 to 64 Years | 264 | 31.9% |
| 65 to 74 Years | 138 | 16.7% |
| 75 to 84 Years | 42 | 5.1% |
| 85 Years and Over | 194 | 23.4% |
| Total | 828 | 100.0% |
Housing Finances in Hopwood
Median Income by Occupancy in Hopwood
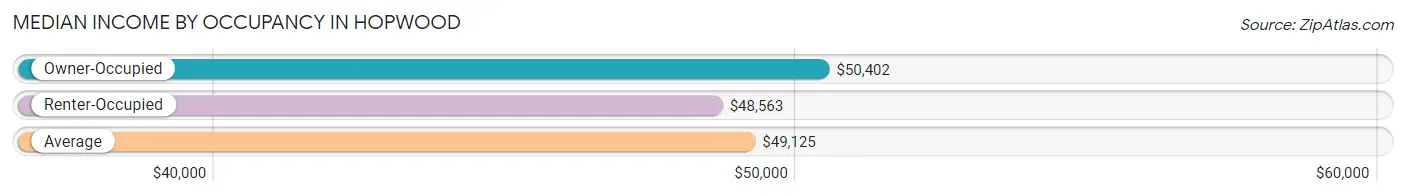
| Occupancy Type | # Households | Median Income |
| Owner-Occupied | 713 (86.1%) | $50,402 |
| Renter-Occupied | 115 (13.9%) | $48,563 |
| Average | 828 (100.0%) | $49,125 |
Occupancy by Householder Income Bracket in Hopwood
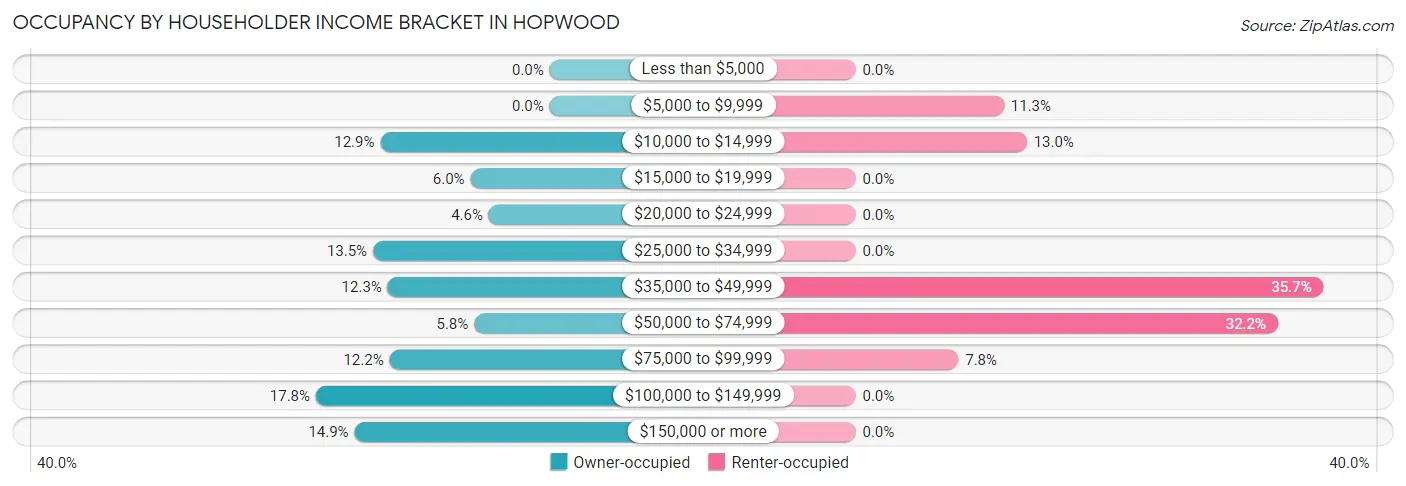
| Income Bracket | Owner-occupied | Renter-occupied |
| Less than $5,000 | 0 (0.0%) | 0 (0.0%) |
| $5,000 to $9,999 | 0 (0.0%) | 13 (11.3%) |
| $10,000 to $14,999 | 92 (12.9%) | 15 (13.0%) |
| $15,000 to $19,999 | 43 (6.0%) | 0 (0.0%) |
| $20,000 to $24,999 | 33 (4.6%) | 0 (0.0%) |
| $25,000 to $34,999 | 96 (13.5%) | 0 (0.0%) |
| $35,000 to $49,999 | 88 (12.3%) | 41 (35.6%) |
| $50,000 to $74,999 | 41 (5.8%) | 37 (32.2%) |
| $75,000 to $99,999 | 87 (12.2%) | 9 (7.8%) |
| $100,000 to $149,999 | 127 (17.8%) | 0 (0.0%) |
| $150,000 or more | 106 (14.9%) | 0 (0.0%) |
| Total | 713 (100.0%) | 115 (100.0%) |
Monthly Housing Cost Tiers in Hopwood
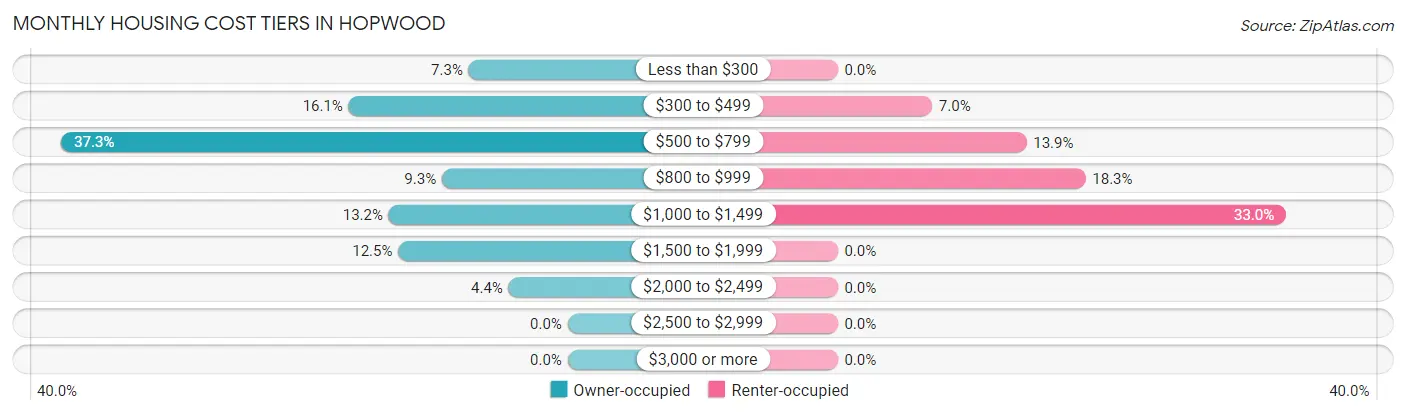
| Monthly Cost | Owner-occupied | Renter-occupied |
| Less than $300 | 52 (7.3%) | 0 (0.0%) |
| $300 to $499 | 115 (16.1%) | 8 (7.0%) |
| $500 to $799 | 266 (37.3%) | 16 (13.9%) |
| $800 to $999 | 66 (9.3%) | 21 (18.3%) |
| $1,000 to $1,499 | 94 (13.2%) | 38 (33.0%) |
| $1,500 to $1,999 | 89 (12.5%) | 0 (0.0%) |
| $2,000 to $2,499 | 31 (4.3%) | 0 (0.0%) |
| $2,500 to $2,999 | 0 (0.0%) | 0 (0.0%) |
| $3,000 or more | 0 (0.0%) | 0 (0.0%) |
| Total | 713 (100.0%) | 115 (100.0%) |
Physical Housing Characteristics in Hopwood
Housing Structures in Hopwood
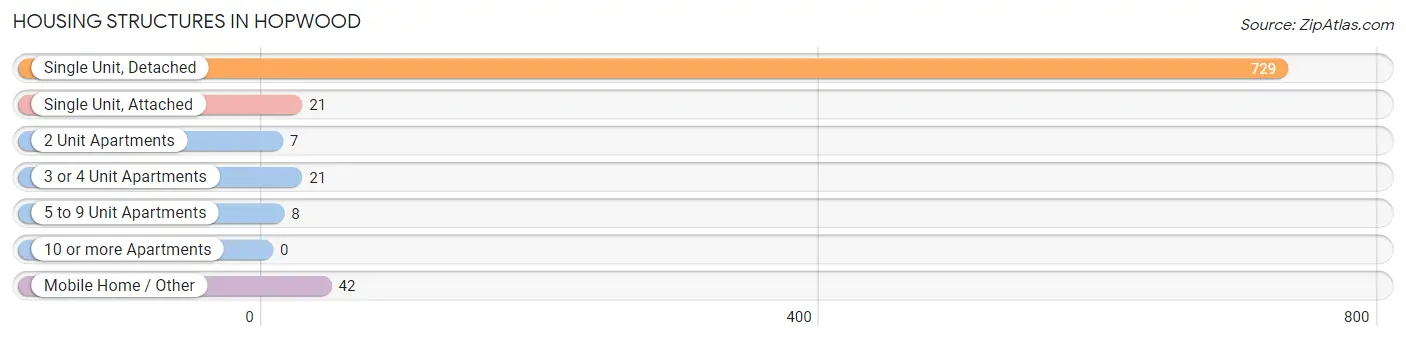
| Structure Type | # Housing Units | % Housing Units |
| Single Unit, Detached | 729 | 88.0% |
| Single Unit, Attached | 21 | 2.5% |
| 2 Unit Apartments | 7 | 0.9% |
| 3 or 4 Unit Apartments | 21 | 2.5% |
| 5 to 9 Unit Apartments | 8 | 1.0% |
| 10 or more Apartments | 0 | 0.0% |
| Mobile Home / Other | 42 | 5.1% |
| Total | 828 | 100.0% |
Housing Structures by Occupancy in Hopwood
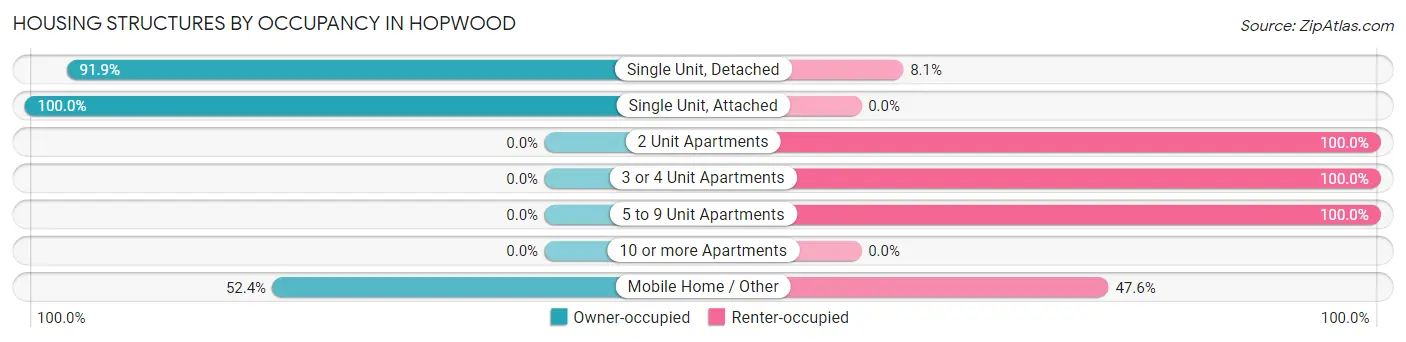
| Structure Type | Owner-occupied | Renter-occupied |
| Single Unit, Detached | 670 (91.9%) | 59 (8.1%) |
| Single Unit, Attached | 21 (100.0%) | 0 (0.0%) |
| 2 Unit Apartments | 0 (0.0%) | 7 (100.0%) |
| 3 or 4 Unit Apartments | 0 (0.0%) | 21 (100.0%) |
| 5 to 9 Unit Apartments | 0 (0.0%) | 8 (100.0%) |
| 10 or more Apartments | 0 (0.0%) | 0 (0.0%) |
| Mobile Home / Other | 22 (52.4%) | 20 (47.6%) |
| Total | 713 (86.1%) | 115 (13.9%) |
Housing Structures by Number of Rooms in Hopwood
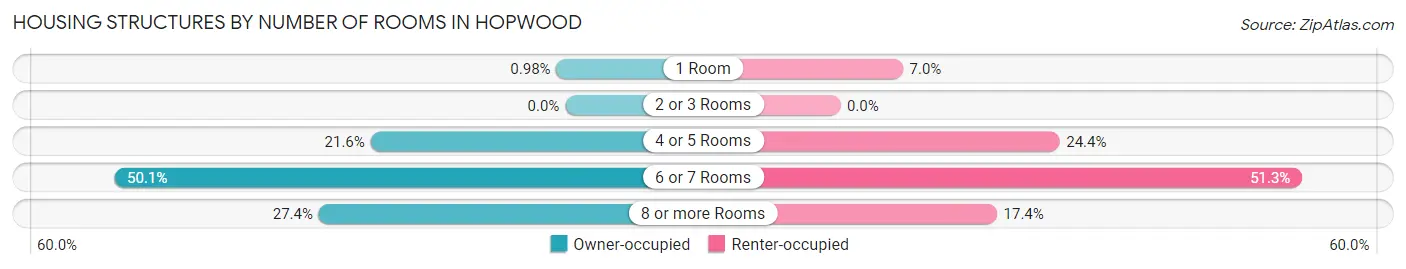
| Number of Rooms | Owner-occupied | Renter-occupied |
| 1 Room | 7 (1.0%) | 8 (7.0%) |
| 2 or 3 Rooms | 0 (0.0%) | 0 (0.0%) |
| 4 or 5 Rooms | 154 (21.6%) | 28 (24.3%) |
| 6 or 7 Rooms | 357 (50.1%) | 59 (51.3%) |
| 8 or more Rooms | 195 (27.4%) | 20 (17.4%) |
| Total | 713 (100.0%) | 115 (100.0%) |
Housing Structure by Heating Type in Hopwood
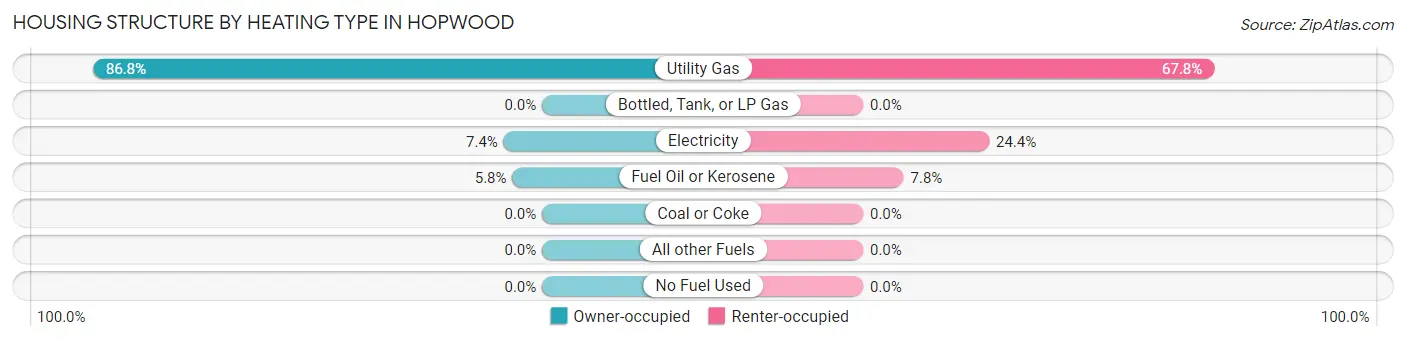
| Heating Type | Owner-occupied | Renter-occupied |
| Utility Gas | 619 (86.8%) | 78 (67.8%) |
| Bottled, Tank, or LP Gas | 0 (0.0%) | 0 (0.0%) |
| Electricity | 53 (7.4%) | 28 (24.3%) |
| Fuel Oil or Kerosene | 41 (5.8%) | 9 (7.8%) |
| Coal or Coke | 0 (0.0%) | 0 (0.0%) |
| All other Fuels | 0 (0.0%) | 0 (0.0%) |
| No Fuel Used | 0 (0.0%) | 0 (0.0%) |
| Total | 713 (100.0%) | 115 (100.0%) |
Household Vehicle Usage in Hopwood
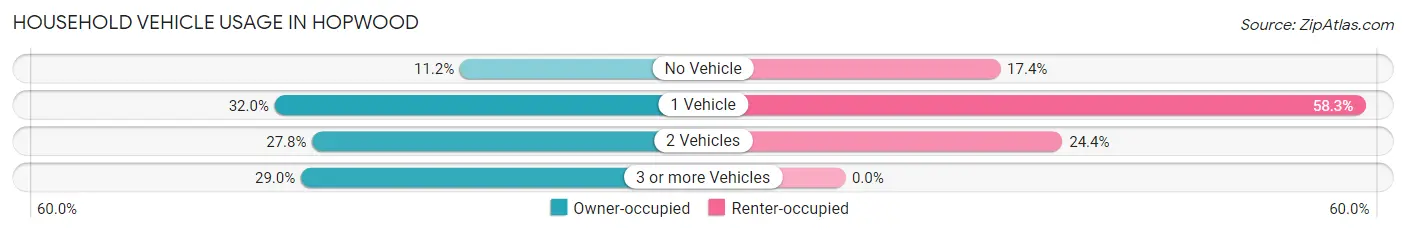
| Vehicles per Household | Owner-occupied | Renter-occupied |
| No Vehicle | 80 (11.2%) | 20 (17.4%) |
| 1 Vehicle | 228 (32.0%) | 67 (58.3%) |
| 2 Vehicles | 198 (27.8%) | 28 (24.3%) |
| 3 or more Vehicles | 207 (29.0%) | 0 (0.0%) |
| Total | 713 (100.0%) | 115 (100.0%) |
Real Estate & Mortgages in Hopwood
Real Estate and Mortgage Overview in Hopwood
| Characteristic | Without Mortgage | With Mortgage |
| Housing Units | 432 | 281 |
| Median Property Value | $146,900 | $197,300 |
| Median Household Income | $31,458 | $74 |
| Monthly Housing Costs | $588 | $0 |
| Real Estate Taxes | $1,929 | $12 |
Property Value by Mortgage Status in Hopwood
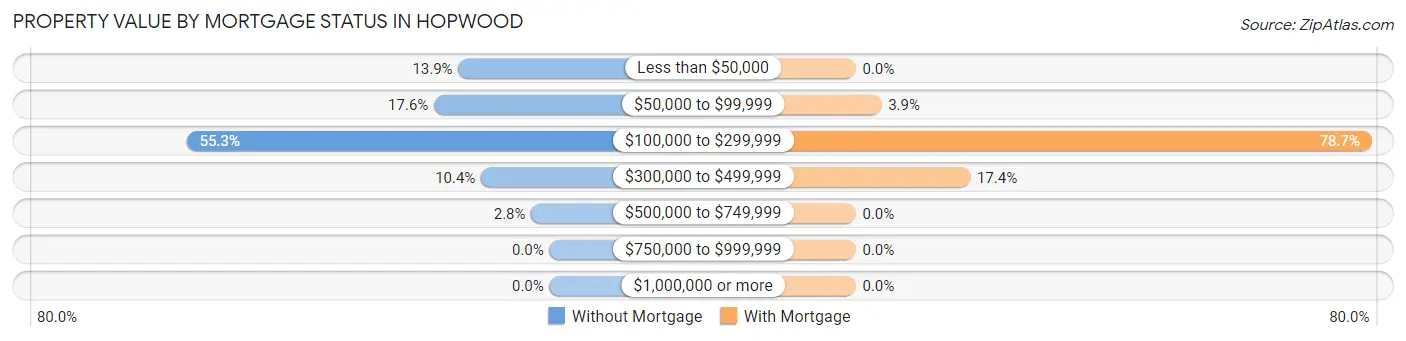
| Property Value | Without Mortgage | With Mortgage |
| Less than $50,000 | 60 (13.9%) | 0 (0.0%) |
| $50,000 to $99,999 | 76 (17.6%) | 11 (3.9%) |
| $100,000 to $299,999 | 239 (55.3%) | 221 (78.6%) |
| $300,000 to $499,999 | 45 (10.4%) | 49 (17.4%) |
| $500,000 to $749,999 | 12 (2.8%) | 0 (0.0%) |
| $750,000 to $999,999 | 0 (0.0%) | 0 (0.0%) |
| $1,000,000 or more | 0 (0.0%) | 0 (0.0%) |
| Total | 432 (100.0%) | 281 (100.0%) |
Household Income by Mortgage Status in Hopwood
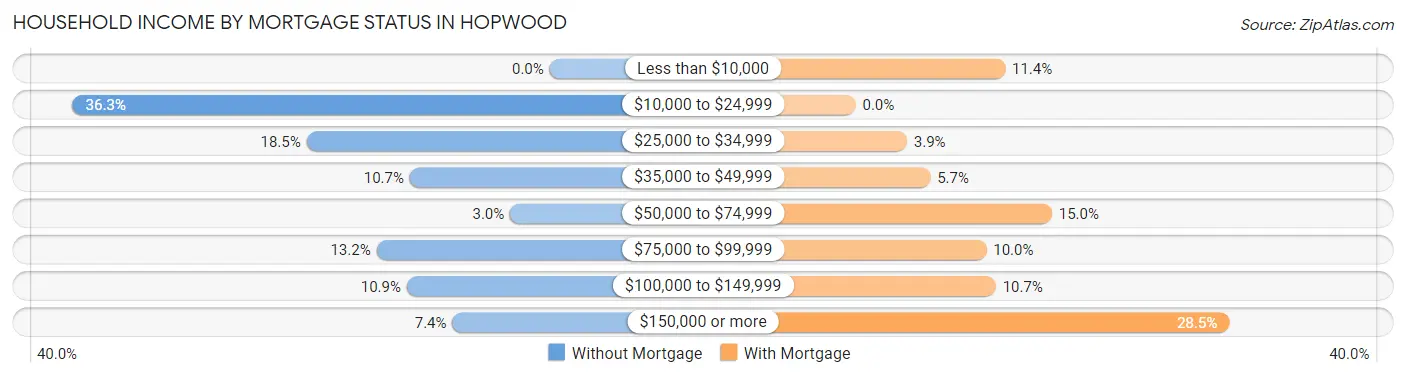
| Household Income | Without Mortgage | With Mortgage |
| Less than $10,000 | 0 (0.0%) | 32 (11.4%) |
| $10,000 to $24,999 | 157 (36.3%) | 0 (0.0%) |
| $25,000 to $34,999 | 80 (18.5%) | 11 (3.9%) |
| $35,000 to $49,999 | 46 (10.6%) | 16 (5.7%) |
| $50,000 to $74,999 | 13 (3.0%) | 42 (14.9%) |
| $75,000 to $99,999 | 57 (13.2%) | 28 (10.0%) |
| $100,000 to $149,999 | 47 (10.9%) | 30 (10.7%) |
| $150,000 or more | 32 (7.4%) | 80 (28.5%) |
| Total | 432 (100.0%) | 281 (100.0%) |
Property Value to Household Income Ratio in Hopwood
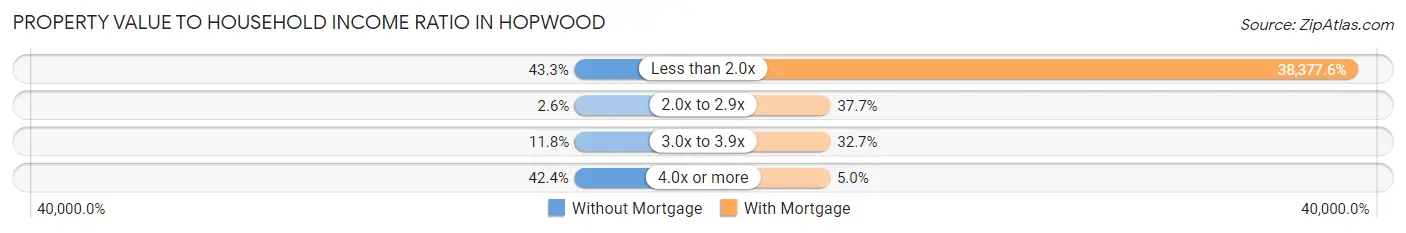
| Value-to-Income Ratio | Without Mortgage | With Mortgage |
| Less than 2.0x | 187 (43.3%) | 107,841 (38,377.6%) |
| 2.0x to 2.9x | 11 (2.5%) | 106 (37.7%) |
| 3.0x to 3.9x | 51 (11.8%) | 92 (32.7%) |
| 4.0x or more | 183 (42.4%) | 14 (5.0%) |
| Total | 432 (100.0%) | 281 (100.0%) |
Real Estate Taxes by Mortgage Status in Hopwood
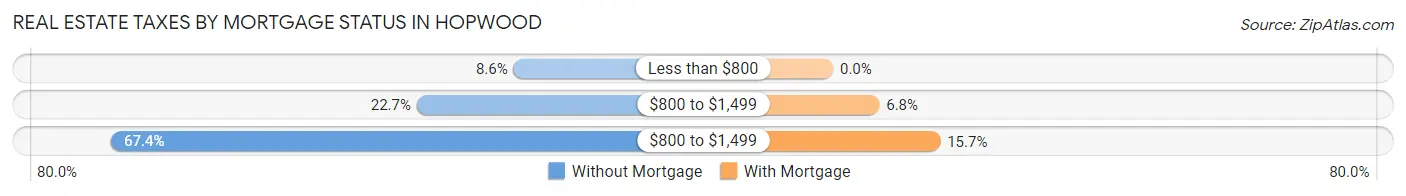
| Property Taxes | Without Mortgage | With Mortgage |
| Less than $800 | 37 (8.6%) | 0 (0.0%) |
| $800 to $1,499 | 98 (22.7%) | 19 (6.8%) |
| $800 to $1,499 | 291 (67.4%) | 44 (15.7%) |
| Total | 432 (100.0%) | 281 (100.0%) |
Health & Disability in Hopwood
Health Insurance Coverage by Age in Hopwood
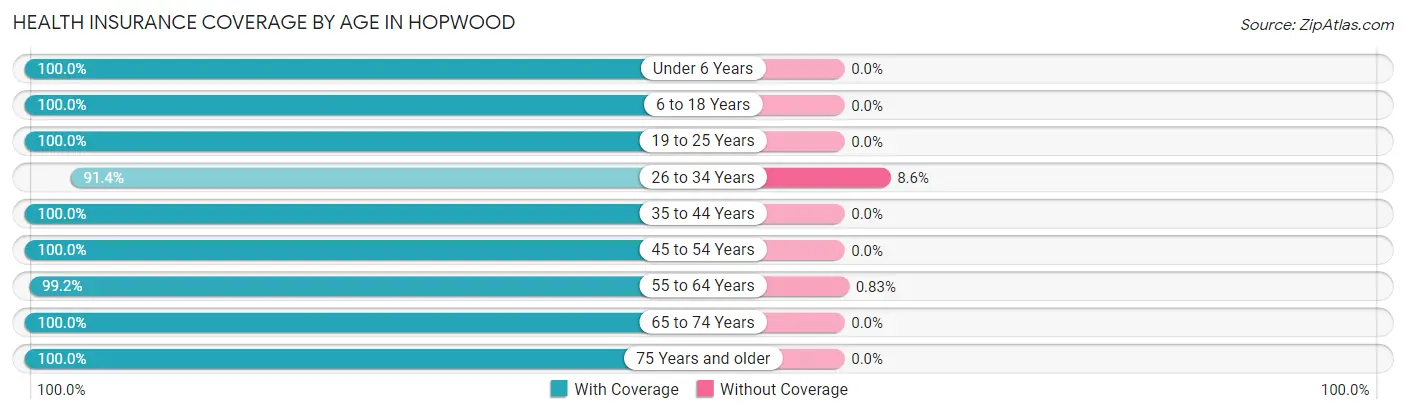
| Age Bracket | With Coverage | Without Coverage |
| Under 6 Years | 26 (100.0%) | 0 (0.0%) |
| 6 to 18 Years | 190 (100.0%) | 0 (0.0%) |
| 19 to 25 Years | 36 (100.0%) | 0 (0.0%) |
| 26 to 34 Years | 128 (91.4%) | 12 (8.6%) |
| 35 to 44 Years | 119 (100.0%) | 0 (0.0%) |
| 45 to 54 Years | 177 (100.0%) | 0 (0.0%) |
| 55 to 64 Years | 357 (99.2%) | 3 (0.8%) |
| 65 to 74 Years | 243 (100.0%) | 0 (0.0%) |
| 75 Years and older | 320 (100.0%) | 0 (0.0%) |
| Total | 1,596 (99.1%) | 15 (0.9%) |
Health Insurance Coverage by Citizenship Status in Hopwood
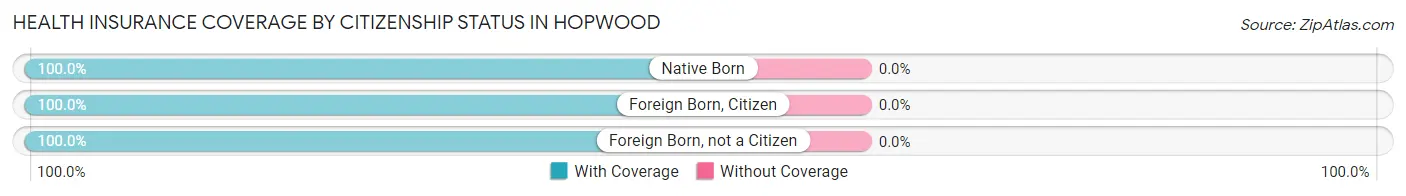
| Citizenship Status | With Coverage | Without Coverage |
| Native Born | 26 (100.0%) | 0 (0.0%) |
| Foreign Born, Citizen | 190 (100.0%) | 0 (0.0%) |
| Foreign Born, not a Citizen | 36 (100.0%) | 0 (0.0%) |
Health Insurance Coverage by Household Income in Hopwood
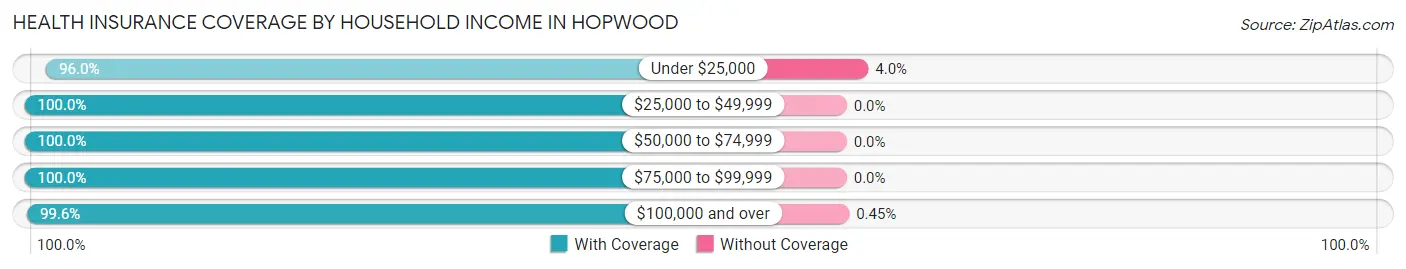
| Household Income | With Coverage | Without Coverage |
| Under $25,000 | 261 (96.0%) | 11 (4.0%) |
| $25,000 to $49,999 | 292 (100.0%) | 0 (0.0%) |
| $50,000 to $74,999 | 151 (100.0%) | 0 (0.0%) |
| $75,000 to $99,999 | 219 (100.0%) | 0 (0.0%) |
| $100,000 and over | 668 (99.6%) | 3 (0.4%) |
Public vs Private Health Insurance Coverage by Age in Hopwood
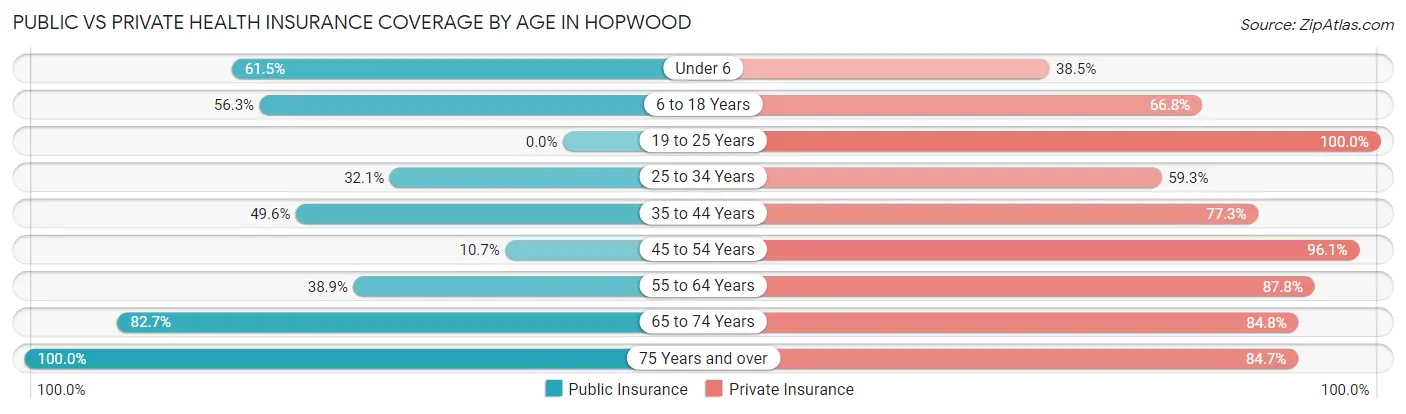
| Age Bracket | Public Insurance | Private Insurance |
| Under 6 | 16 (61.5%) | 10 (38.5%) |
| 6 to 18 Years | 107 (56.3%) | 127 (66.8%) |
| 19 to 25 Years | 0 (0.0%) | 36 (100.0%) |
| 25 to 34 Years | 45 (32.1%) | 83 (59.3%) |
| 35 to 44 Years | 59 (49.6%) | 92 (77.3%) |
| 45 to 54 Years | 19 (10.7%) | 170 (96.1%) |
| 55 to 64 Years | 140 (38.9%) | 316 (87.8%) |
| 65 to 74 Years | 201 (82.7%) | 206 (84.8%) |
| 75 Years and over | 320 (100.0%) | 271 (84.7%) |
| Total | 907 (56.3%) | 1,311 (81.4%) |
Disability Status by Sex by Age in Hopwood
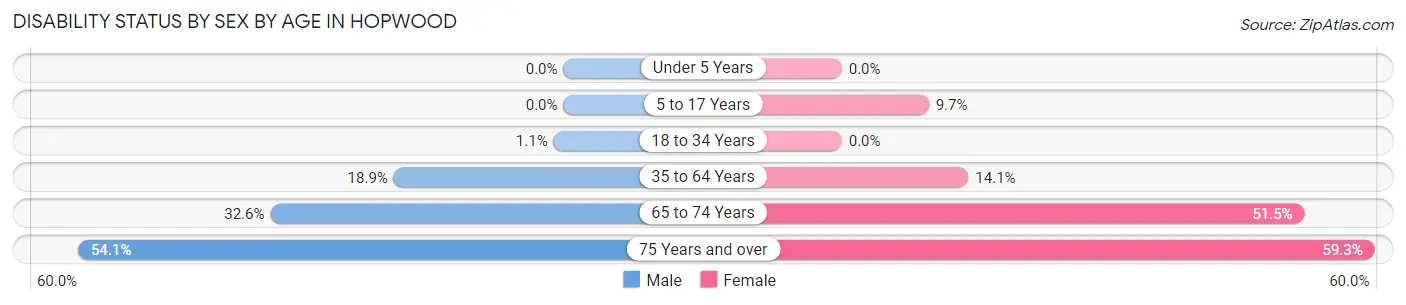
| Age Bracket | Male | Female |
| Under 5 Years | 0 (0.0%) | 0 (0.0%) |
| 5 to 17 Years | 0 (0.0%) | 6 (9.7%) |
| 18 to 34 Years | 1 (1.1%) | 0 (0.0%) |
| 35 to 64 Years | 65 (18.9%) | 44 (14.1%) |
| 65 to 74 Years | 47 (32.6%) | 51 (51.5%) |
| 75 Years and over | 60 (54.0%) | 124 (59.3%) |
Disability Class by Sex by Age in Hopwood
Disability Class: Hearing Difficulty
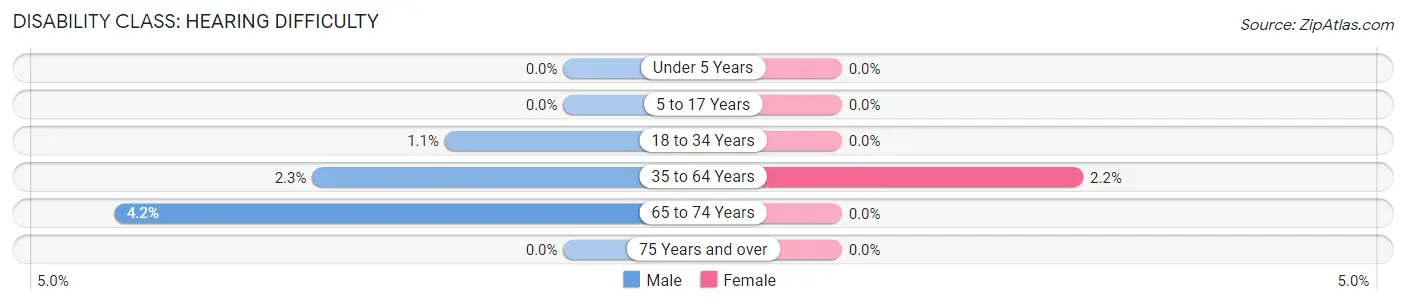
| Age Bracket | Male | Female |
| Under 5 Years | 0 (0.0%) | 0 (0.0%) |
| 5 to 17 Years | 0 (0.0%) | 0 (0.0%) |
| 18 to 34 Years | 1 (1.1%) | 0 (0.0%) |
| 35 to 64 Years | 8 (2.3%) | 7 (2.2%) |
| 65 to 74 Years | 6 (4.2%) | 0 (0.0%) |
| 75 Years and over | 0 (0.0%) | 0 (0.0%) |
Disability Class: Vision Difficulty
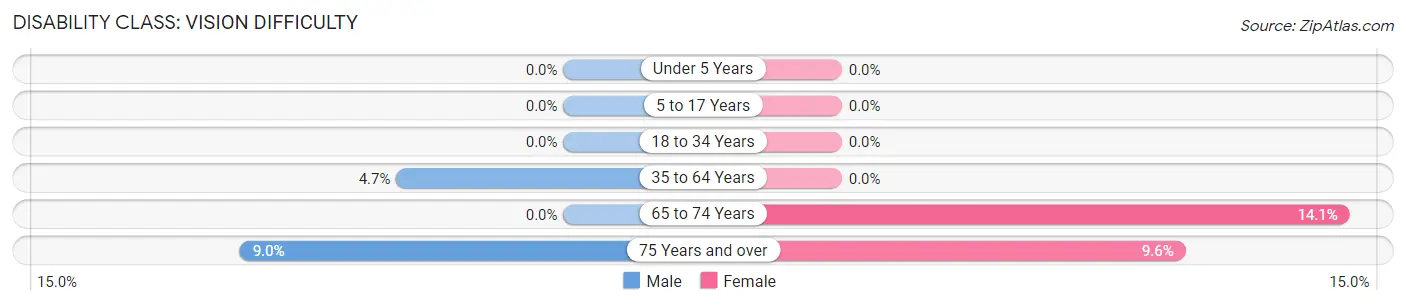
| Age Bracket | Male | Female |
| Under 5 Years | 0 (0.0%) | 0 (0.0%) |
| 5 to 17 Years | 0 (0.0%) | 0 (0.0%) |
| 18 to 34 Years | 0 (0.0%) | 0 (0.0%) |
| 35 to 64 Years | 16 (4.6%) | 0 (0.0%) |
| 65 to 74 Years | 0 (0.0%) | 14 (14.1%) |
| 75 Years and over | 10 (9.0%) | 20 (9.6%) |
Disability Class: Cognitive Difficulty
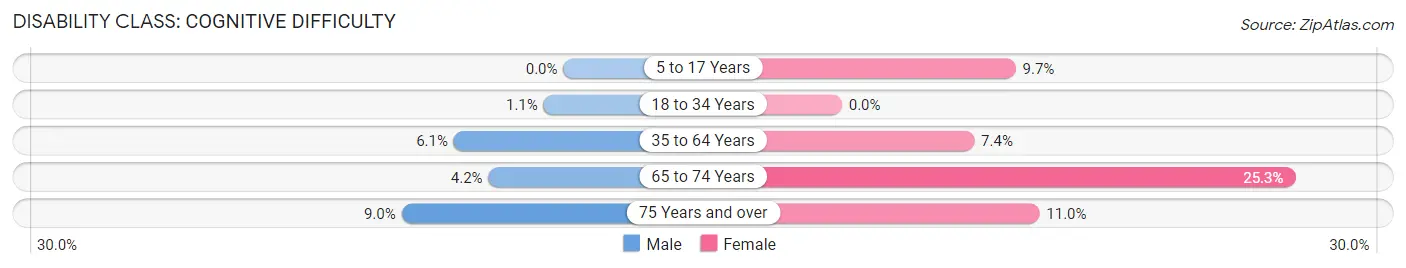
| Age Bracket | Male | Female |
| 5 to 17 Years | 0 (0.0%) | 6 (9.7%) |
| 18 to 34 Years | 1 (1.1%) | 0 (0.0%) |
| 35 to 64 Years | 21 (6.1%) | 23 (7.4%) |
| 65 to 74 Years | 6 (4.2%) | 25 (25.3%) |
| 75 Years and over | 10 (9.0%) | 23 (11.0%) |
Disability Class: Ambulatory Difficulty
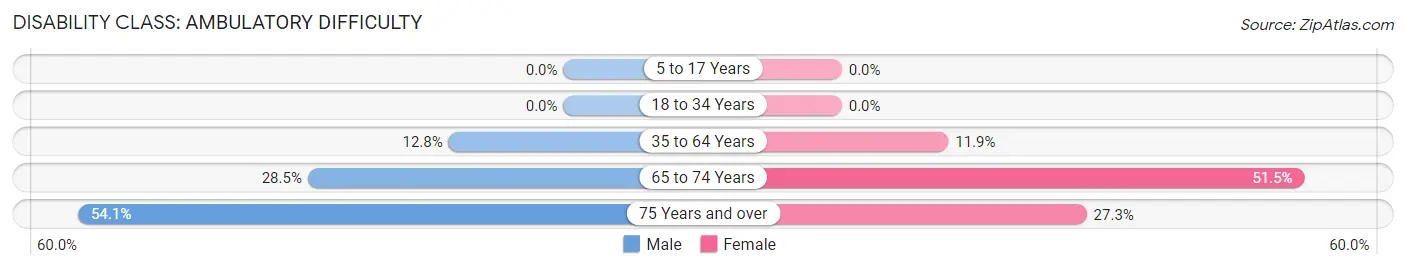
| Age Bracket | Male | Female |
| 5 to 17 Years | 0 (0.0%) | 0 (0.0%) |
| 18 to 34 Years | 0 (0.0%) | 0 (0.0%) |
| 35 to 64 Years | 44 (12.8%) | 37 (11.9%) |
| 65 to 74 Years | 41 (28.5%) | 51 (51.5%) |
| 75 Years and over | 60 (54.0%) | 57 (27.3%) |
Disability Class: Self-Care Difficulty

| Age Bracket | Male | Female |
| 5 to 17 Years | 0 (0.0%) | 6 (9.7%) |
| 18 to 34 Years | 0 (0.0%) | 0 (0.0%) |
| 35 to 64 Years | 28 (8.1%) | 0 (0.0%) |
| 65 to 74 Years | 6 (4.2%) | 25 (25.3%) |
| 75 Years and over | 10 (9.0%) | 23 (11.0%) |
Technology Access in Hopwood
Computing Device Access in Hopwood
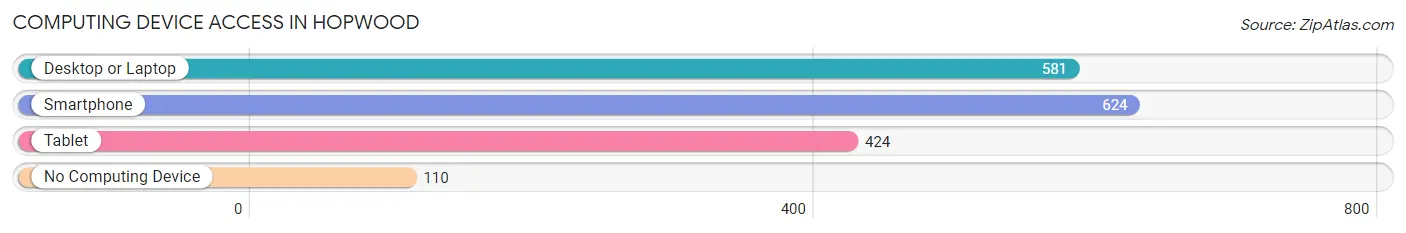
| Device Type | # Households | % Households |
| Desktop or Laptop | 581 | 70.2% |
| Smartphone | 624 | 75.4% |
| Tablet | 424 | 51.2% |
| No Computing Device | 110 | 13.3% |
| Total | 828 | 100.0% |
Internet Access in Hopwood
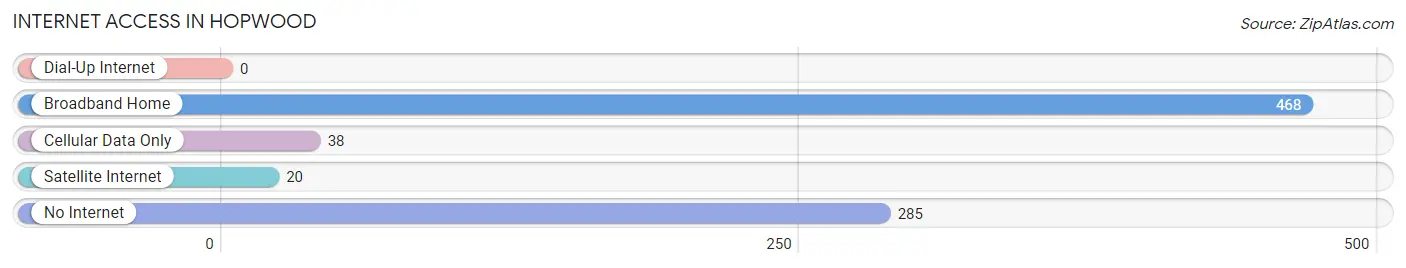
| Internet Type | # Households | % Households |
| Dial-Up Internet | 0 | 0.0% |
| Broadband Home | 468 | 56.5% |
| Cellular Data Only | 38 | 4.6% |
| Satellite Internet | 20 | 2.4% |
| No Internet | 285 | 34.4% |
| Total | 828 | 100.0% |
Hopwood Summary
Hopwood is a small borough located in Fayette County, Pennsylvania. It is situated in the southwestern part of the state, approximately 40 miles south of Pittsburgh. The borough was founded in 1876 and is home to a population of approximately 1,000 people.
Geography
Hopwood is located in the southwestern part of Fayette County, Pennsylvania. It is situated in the Monongahela River Valley, which is part of the Appalachian Plateau. The borough is bordered by the townships of Wharton, Redstone, and German. The borough is located at an elevation of 1,000 feet above sea level. The total area of the borough is 0.6 square miles, all of which is land.
The climate in Hopwood is classified as humid continental, with hot summers and cold winters. The average annual temperature is 52 degrees Fahrenheit, with an average high of 79 degrees in the summer and an average low of 25 degrees in the winter. The average annual precipitation is 40 inches, with an average of 3 inches of snowfall per year.
Economy
The economy of Hopwood is largely based on the coal mining industry. The borough is home to several coal mines, including the Hopwood Mine, which is the largest in the area. The coal industry has been in decline in recent years, however, due to the increasing cost of production and the availability of cheaper natural gas.
In addition to the coal industry, Hopwood is home to several small businesses, including restaurants, retail stores, and service providers. The borough is also home to a number of small manufacturing companies, which produce a variety of products, including furniture, clothing, and electronics.
Demographics
As of the 2010 census, the population of Hopwood was 1,000 people. The racial makeup of the borough was 97.2% White, 0.7% African American, 0.3% Native American, 0.2% Asian, and 1.6% from other races. The median household income was $37,500, and the median family income was $45,000.
The population of Hopwood is largely composed of people of European descent. The largest ethnic group is German, followed by Irish, Italian, and Polish. The borough is also home to a small population of Native Americans, primarily from the Seneca Nation.
Conclusion
Hopwood is a small borough located in Fayette County, Pennsylvania. It is situated in the Monongahela River Valley, which is part of the Appalachian Plateau. The borough was founded in 1876 and is home to a population of approximately 1,000 people. The economy of Hopwood is largely based on the coal mining industry, although it is also home to several small businesses and manufacturing companies. The population of Hopwood is largely composed of people of European descent, with the largest ethnic group being German.
Common Questions
What is Per Capita Income in Hopwood?
Per Capita income in Hopwood is $46,382.
What is the Median Family Income in Hopwood?
Median Family Income in Hopwood is $103,750.
What is the Median Household income in Hopwood?
Median Household Income in Hopwood is $49,125.
What is Income or Wage Gap in Hopwood?
Income or Wage Gap in Hopwood is 43.1%.
Women in Hopwood earn 56.9 cents for every dollar earned by a man.
What is Inequality or Gini Index in Hopwood?
Inequality or Gini Index in Hopwood is 0.56.
What is the Total Population of Hopwood?
Total Population of Hopwood is 1,611.
What is the Total Male Population of Hopwood?
Total Male Population of Hopwood is 797.
What is the Total Female Population of Hopwood?
Total Female Population of Hopwood is 814.
What is the Ratio of Males per 100 Females in Hopwood?
There are 97.91 Males per 100 Females in Hopwood.
What is the Ratio of Females per 100 Males in Hopwood?
There are 102.13 Females per 100 Males in Hopwood.
What is the Median Population Age in Hopwood?
Median Population Age in Hopwood is 58.8 Years.
What is the Average Family Size in Hopwood
Average Family Size in Hopwood is 2.6 People.
What is the Average Household Size in Hopwood
Average Household Size in Hopwood is 1.9 People.
How Large is the Labor Force in Hopwood?
There are 756 People in the Labor Forcein in Hopwood.
What is the Percentage of People in the Labor Force in Hopwood?
51.4% of People are in the Labor Force in Hopwood.
What is the Unemployment Rate in Hopwood?
Unemployment Rate in Hopwood is 9.1%.