West Alexander, PA Map & Demographics
West Alexander Map
West Alexander Overview
$36,977
PER CAPITA INCOME
$69,904
AVG FAMILY INCOME
$68,264
AVG HOUSEHOLD INCOME
41.8%
WAGE / INCOME GAP [ % ]
58.2¢/ $1
WAGE / INCOME GAP [ $ ]
0.33
INEQUALITY / GINI INDEX
420
TOTAL POPULATION
210
MALE POPULATION
210
FEMALE POPULATION
100.00
MALES / 100 FEMALES
100.00
FEMALES / 100 MALES
49.4
MEDIAN AGE
3.0
AVG FAMILY SIZE
2.4
AVG HOUSEHOLD SIZE
250
LABOR FORCE [ PEOPLE ]
67.4%
PERCENT IN LABOR FORCE
West Alexander Zip Codes
West Alexander Area Codes
Income in West Alexander
Income Overview in West Alexander
Per Capita Income in West Alexander is $36,977, while median incomes of families and households are $69,904 and $68,264 respectively.
| Characteristic | Number | Measure |
| Per Capita Income | 420 | $36,977 |
| Median Family Income | 123 | $69,904 |
| Mean Family Income | 123 | $101,117 |
| Median Household Income | 173 | $68,264 |
| Mean Household Income | 173 | $88,668 |
| Income Deficit | 123 | $0 |
| Wage / Income Gap (%) | 420 | 41.78% |
| Wage / Income Gap ($) | 420 | 58.22¢ per $1 |
| Gini / Inequality Index | 420 | 0.33 |
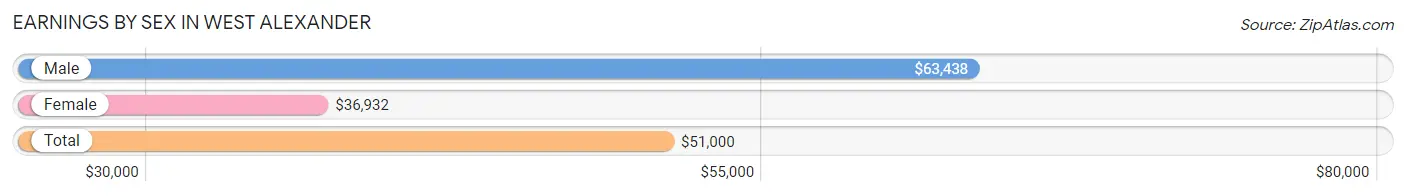
Earnings by Sex in West Alexander
Average Earnings in West Alexander are $51,000, $63,438 for men and $36,932 for women, a difference of 41.8%.
| Sex | Number | Average Earnings |
| Male | 105 (42.0%) | $63,438 |
| Female | 145 (58.0%) | $36,932 |
| Total | 250 (100.0%) | $51,000 |
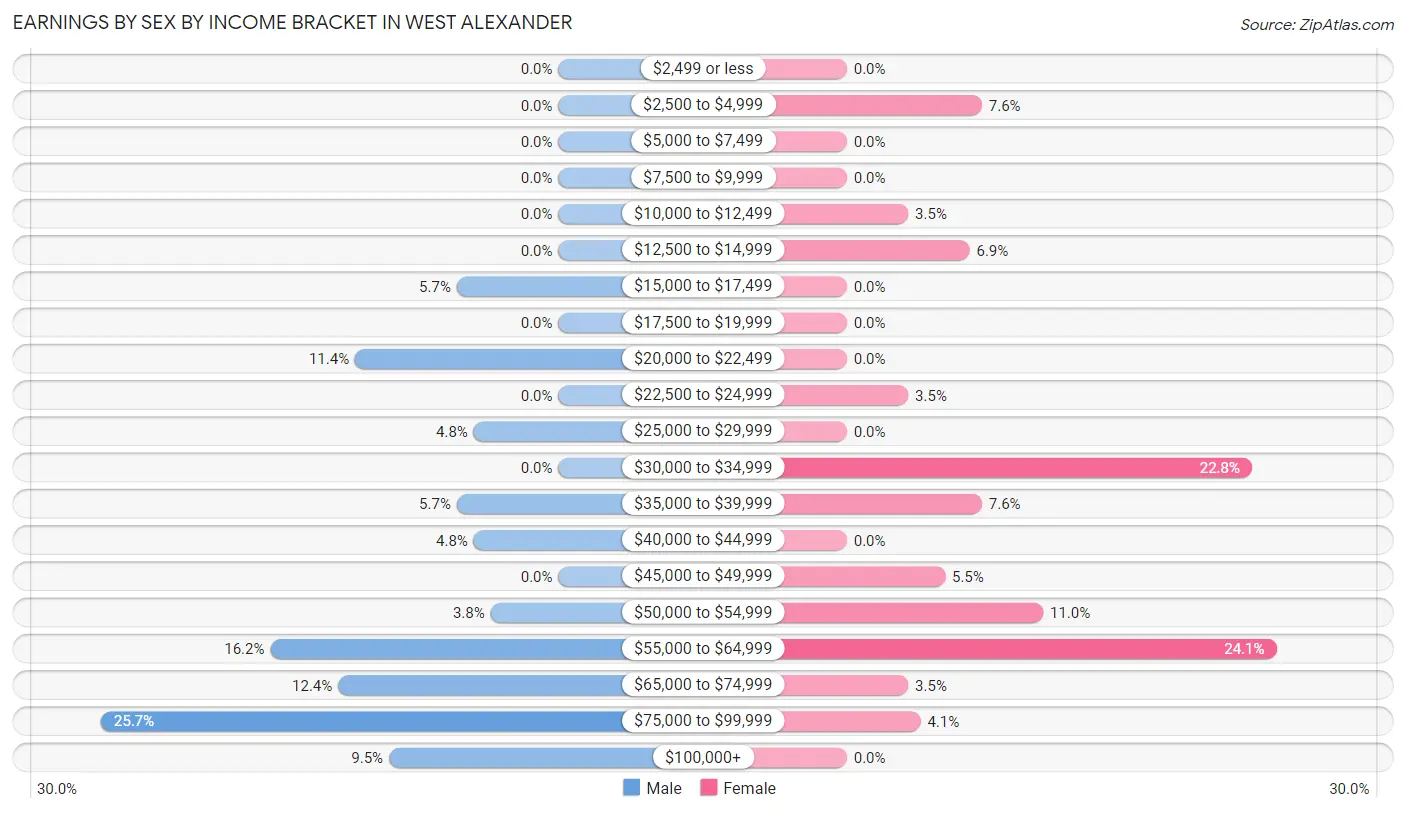
Earnings by Sex by Income Bracket in West Alexander
The most common earnings brackets in West Alexander are $75,000 to $99,999 for men (27 | 25.7%) and $55,000 to $64,999 for women (35 | 24.1%).
| Income | Male | Female |
| $2,499 or less | 0 (0.0%) | 0 (0.0%) |
| $2,500 to $4,999 | 0 (0.0%) | 11 (7.6%) |
| $5,000 to $7,499 | 0 (0.0%) | 0 (0.0%) |
| $7,500 to $9,999 | 0 (0.0%) | 0 (0.0%) |
| $10,000 to $12,499 | 0 (0.0%) | 5 (3.5%) |
| $12,500 to $14,999 | 0 (0.0%) | 10 (6.9%) |
| $15,000 to $17,499 | 6 (5.7%) | 0 (0.0%) |
| $17,500 to $19,999 | 0 (0.0%) | 0 (0.0%) |
| $20,000 to $22,499 | 12 (11.4%) | 0 (0.0%) |
| $22,500 to $24,999 | 0 (0.0%) | 5 (3.5%) |
| $25,000 to $29,999 | 5 (4.8%) | 0 (0.0%) |
| $30,000 to $34,999 | 0 (0.0%) | 33 (22.8%) |
| $35,000 to $39,999 | 6 (5.7%) | 11 (7.6%) |
| $40,000 to $44,999 | 5 (4.8%) | 0 (0.0%) |
| $45,000 to $49,999 | 0 (0.0%) | 8 (5.5%) |
| $50,000 to $54,999 | 4 (3.8%) | 16 (11.0%) |
| $55,000 to $64,999 | 17 (16.2%) | 35 (24.1%) |
| $65,000 to $74,999 | 13 (12.4%) | 5 (3.5%) |
| $75,000 to $99,999 | 27 (25.7%) | 6 (4.1%) |
| $100,000+ | 10 (9.5%) | 0 (0.0%) |
| Total | 105 (100.0%) | 145 (100.0%) |
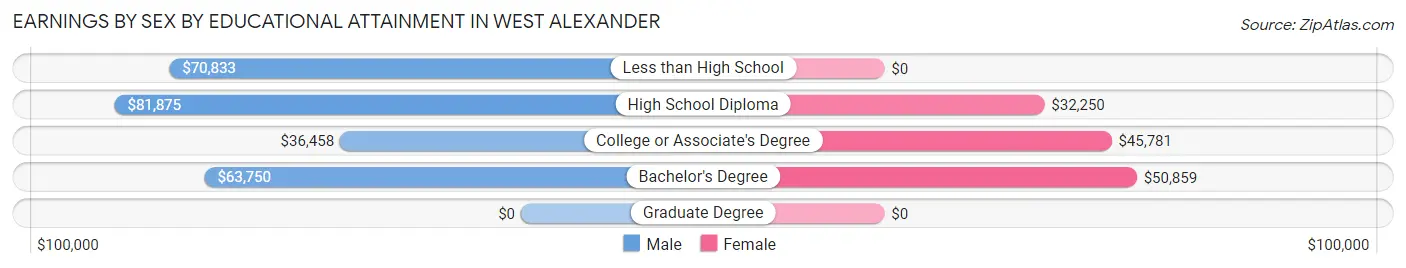
Earnings by Sex by Educational Attainment in West Alexander
Average earnings in West Alexander are $63,438 for men and $46,094 for women, a difference of 27.3%. Men with an educational attainment of high school diploma enjoy the highest average annual earnings of $81,875, while those with college or associate's degree education earn the least with $36,458. Women with an educational attainment of bachelor's degree earn the most with the average annual earnings of $50,859, while those with high school diploma education have the smallest earnings of $32,250.
| Educational Attainment | Male Income | Female Income |
| Less than High School | $70,833 | $0 |
| High School Diploma | $81,875 | $32,250 |
| College or Associate's Degree | $36,458 | $45,781 |
| Bachelor's Degree | $63,750 | $50,859 |
| Graduate Degree | - | - |
| Total | $63,438 | $46,094 |
Family Income in West Alexander
Family Income Brackets in West Alexander
According to the West Alexander family income data, there are 46 families falling into the $50,000 to $74,999 income range, which is the most common income bracket and makes up 37.4% of all families.
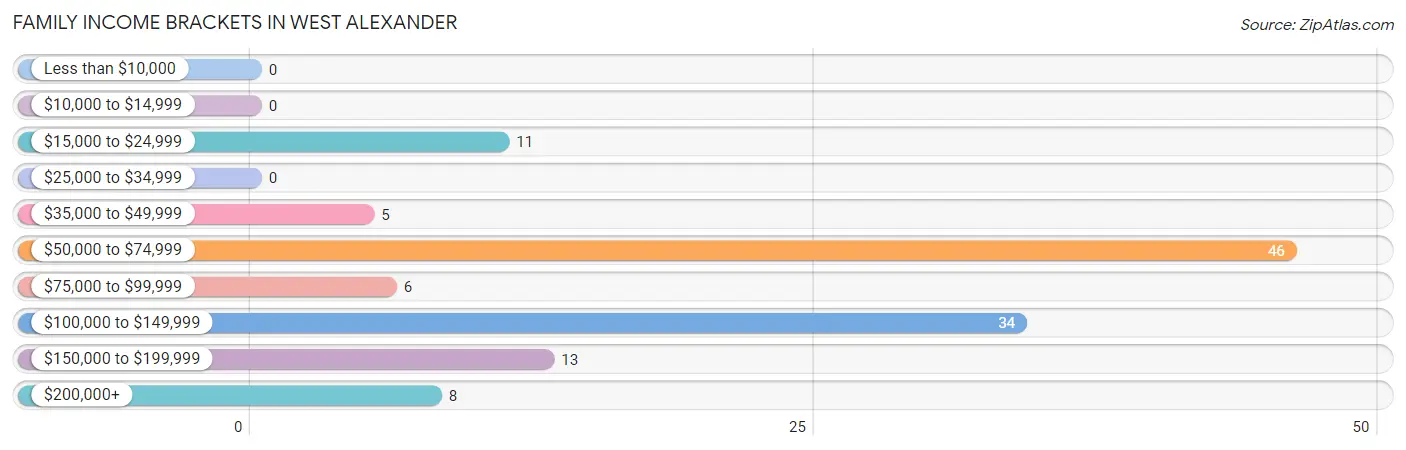
| Income Bracket | # Families | % Families |
| Less than $10,000 | 0 | 0.0% |
| $10,000 to $14,999 | 0 | 0.0% |
| $15,000 to $24,999 | 11 | 8.9% |
| $25,000 to $34,999 | 0 | 0.0% |
| $35,000 to $49,999 | 5 | 4.1% |
| $50,000 to $74,999 | 46 | 37.4% |
| $75,000 to $99,999 | 6 | 4.9% |
| $100,000 to $149,999 | 34 | 27.6% |
| $150,000 to $199,999 | 13 | 10.6% |
| $200,000+ | 8 | 6.5% |
Family Income by Famaliy Size in West Alexander
3-person families (26 | 21.1%) account for the highest median family income in West Alexander with $129,375 per family, while 3-person families (26 | 21.1%) have the highest median income of $43,125 per family member.
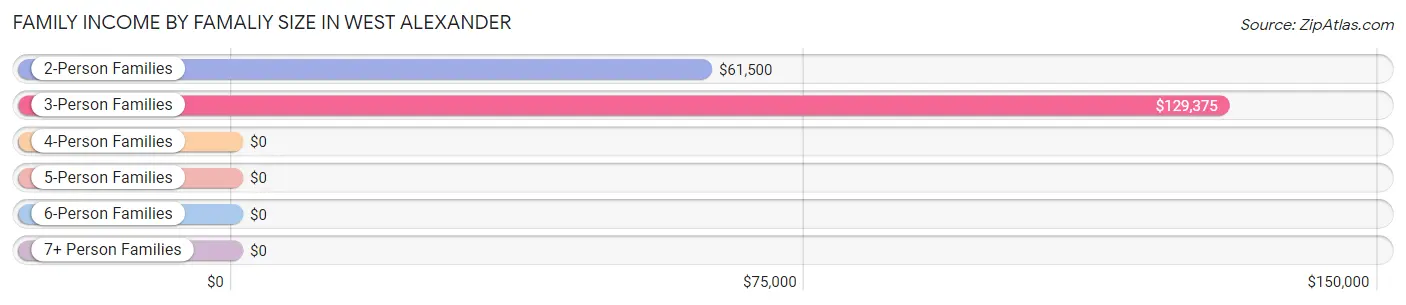
| Income Bracket | # Families | Median Income |
| 2-Person Families | 74 (60.2%) | $61,500 |
| 3-Person Families | 26 (21.1%) | $129,375 |
| 4-Person Families | 8 (6.5%) | $0 |
| 5-Person Families | 0 (0.0%) | $0 |
| 6-Person Families | 15 (12.2%) | $0 |
| 7+ Person Families | 0 (0.0%) | $0 |
| Total | 123 (100.0%) | $69,904 |
Family Income by Number of Earners in West Alexander
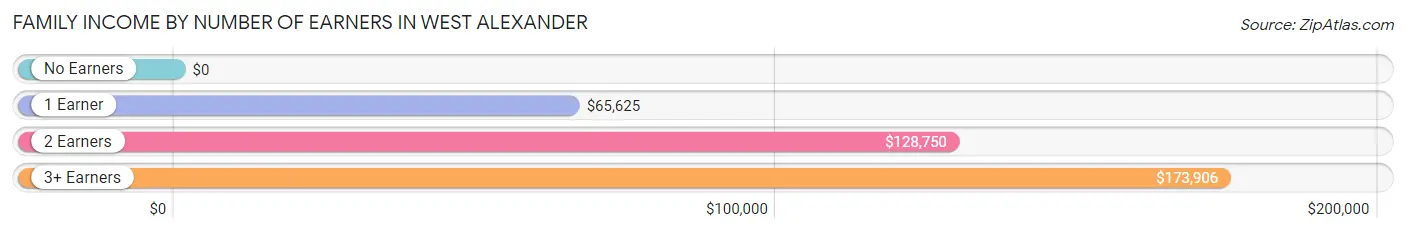
| Number of Earners | # Families | Median Income |
| No Earners | 11 (8.9%) | $0 |
| 1 Earner | 58 (47.1%) | $65,625 |
| 2 Earners | 31 (25.2%) | $128,750 |
| 3+ Earners | 23 (18.7%) | $173,906 |
| Total | 123 (100.0%) | $69,904 |
Household Income in West Alexander
Household Income Brackets in West Alexander
With 72 households falling in the category, the $50,000 to $74,999 income range is the most frequent in West Alexander, accounting for 41.6% of all households.
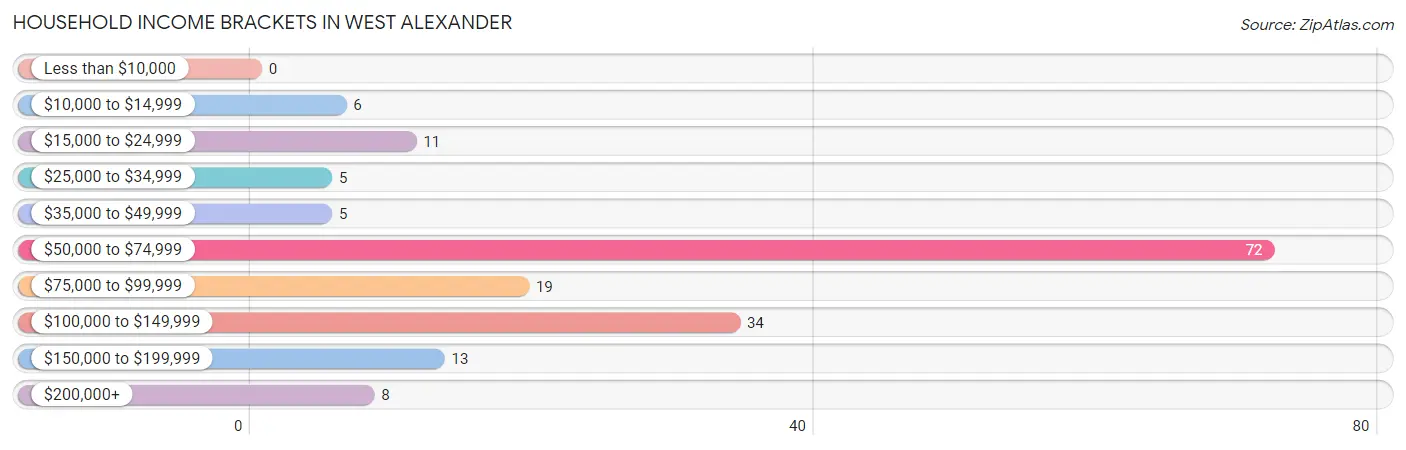
| Income Bracket | # Households | % Households |
| Less than $10,000 | 0 | 0.0% |
| $10,000 to $14,999 | 6 | 3.5% |
| $15,000 to $24,999 | 11 | 6.4% |
| $25,000 to $34,999 | 5 | 2.9% |
| $35,000 to $49,999 | 5 | 2.9% |
| $50,000 to $74,999 | 72 | 41.6% |
| $75,000 to $99,999 | 19 | 11.0% |
| $100,000 to $149,999 | 34 | 19.7% |
| $150,000 to $199,999 | 13 | 7.5% |
| $200,000+ | 8 | 4.6% |
Household Income by Householder Age in West Alexander
The median household income in West Alexander is $68,264, with the highest median household income of $144,375 found in the 25 to 44 years age bracket for the primary householder. A total of 49 households (28.3%) fall into this category. Meanwhile, the 15 to 24 years age bracket for the primary householder has the lowest median household income of $0, with 9 households (5.2%) in this group.
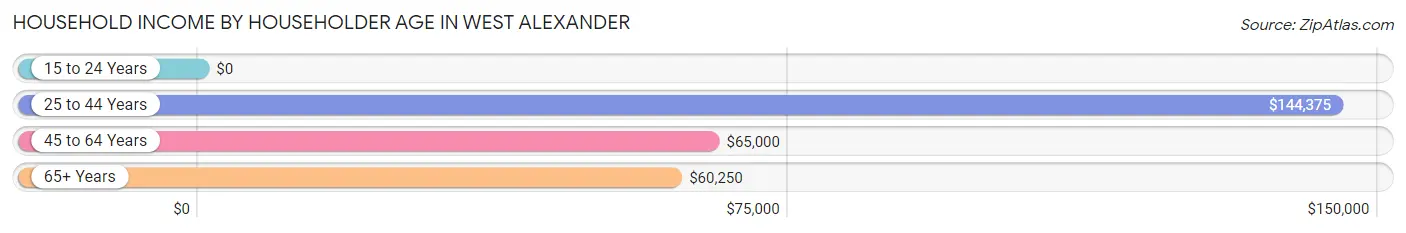
| Income Bracket | # Households | Median Income |
| 15 to 24 Years | 9 (5.2%) | $0 |
| 25 to 44 Years | 49 (28.3%) | $144,375 |
| 45 to 64 Years | 70 (40.5%) | $65,000 |
| 65+ Years | 45 (26.0%) | $60,250 |
| Total | 173 (100.0%) | $68,264 |
Poverty in West Alexander
Income Below Poverty by Sex and Age in West Alexander
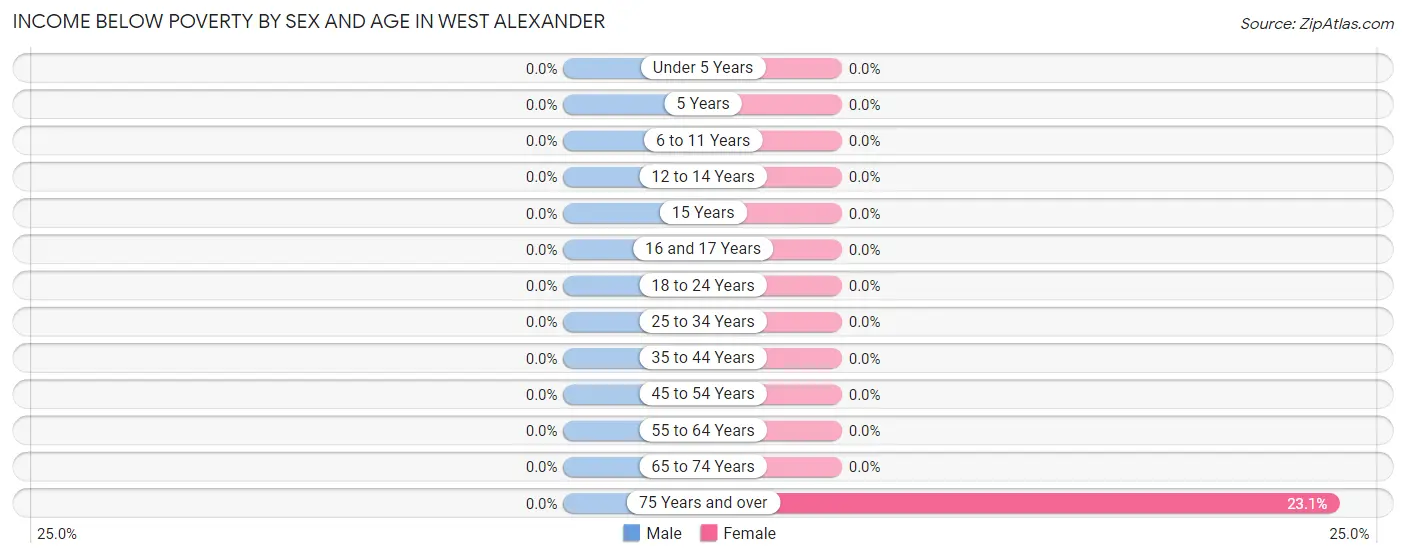
| Age Bracket | Male | Female |
| Under 5 Years | 0 (0.0%) | 0 (0.0%) |
| 5 Years | 0 (0.0%) | 0 (0.0%) |
| 6 to 11 Years | 0 (0.0%) | 0 (0.0%) |
| 12 to 14 Years | 0 (0.0%) | 0 (0.0%) |
| 15 Years | 0 (0.0%) | 0 (0.0%) |
| 16 and 17 Years | 0 (0.0%) | 0 (0.0%) |
| 18 to 24 Years | 0 (0.0%) | 0 (0.0%) |
| 25 to 34 Years | 0 (0.0%) | 0 (0.0%) |
| 35 to 44 Years | 0 (0.0%) | 0 (0.0%) |
| 45 to 54 Years | 0 (0.0%) | 0 (0.0%) |
| 55 to 64 Years | 0 (0.0%) | 0 (0.0%) |
| 65 to 74 Years | 0 (0.0%) | 0 (0.0%) |
| 75 Years and over | 0 (0.0%) | 6 (23.1%) |
| Total | 0 (0.0%) | 6 (2.9%) |
Income Above Poverty by Sex and Age in West Alexander
According to the poverty statistics in West Alexander, males aged under 5 years and females aged 6 to 11 years are the age groups that are most secure financially, with 100.0% of males and 100.0% of females in these age groups living above the poverty line.
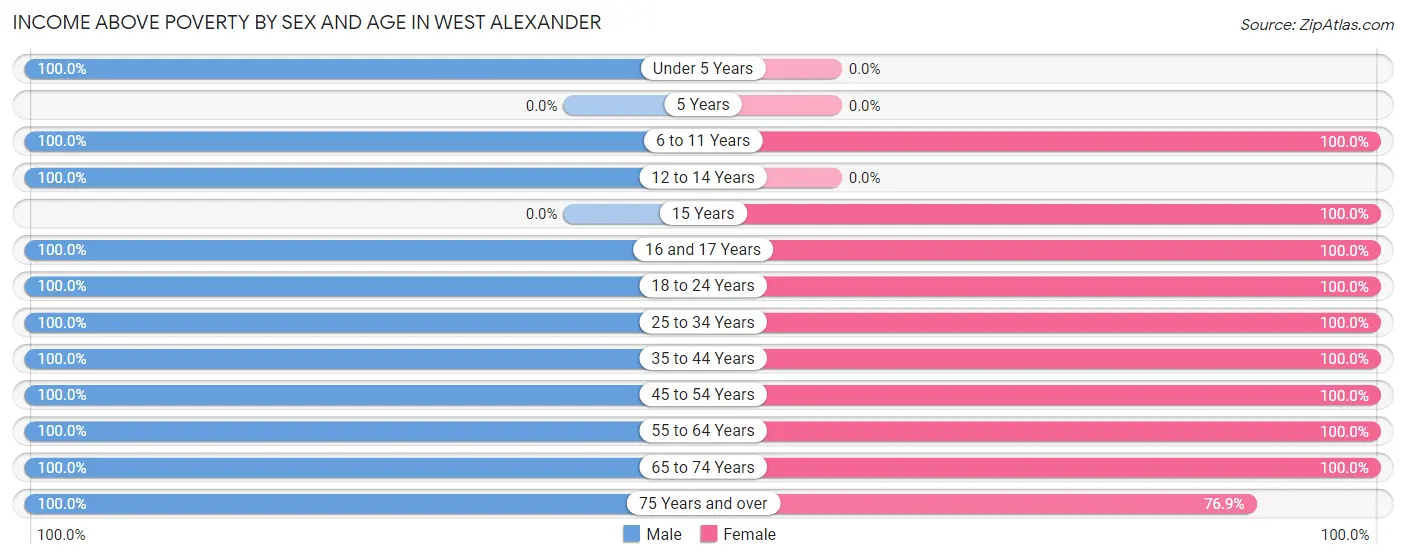
| Age Bracket | Male | Female |
| Under 5 Years | 7 (100.0%) | 0 (0.0%) |
| 5 Years | 0 (0.0%) | 0 (0.0%) |
| 6 to 11 Years | 14 (100.0%) | 18 (100.0%) |
| 12 to 14 Years | 4 (100.0%) | 0 (0.0%) |
| 15 Years | 0 (0.0%) | 6 (100.0%) |
| 16 and 17 Years | 20 (100.0%) | 11 (100.0%) |
| 18 to 24 Years | 7 (100.0%) | 19 (100.0%) |
| 25 to 34 Years | 35 (100.0%) | 8 (100.0%) |
| 35 to 44 Years | 17 (100.0%) | 30 (100.0%) |
| 45 to 54 Years | 45 (100.0%) | 27 (100.0%) |
| 55 to 64 Years | 28 (100.0%) | 49 (100.0%) |
| 65 to 74 Years | 22 (100.0%) | 16 (100.0%) |
| 75 Years and over | 11 (100.0%) | 20 (76.9%) |
| Total | 210 (100.0%) | 204 (97.1%) |
Income Below Poverty Among Married-Couple Families in West Alexander
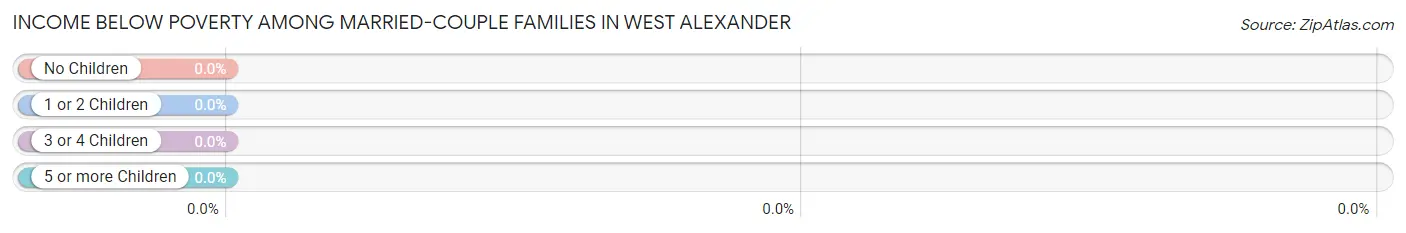
| Children | Above Poverty | Below Poverty |
| No Children | 44 (100.0%) | 0 (0.0%) |
| 1 or 2 Children | 18 (100.0%) | 0 (0.0%) |
| 3 or 4 Children | 7 (100.0%) | 0 (0.0%) |
| 5 or more Children | 0 (0.0%) | 0 (0.0%) |
| Total | 69 (100.0%) | 0 (0.0%) |
Income Below Poverty Among Single-Parent Households in West Alexander
| Children | Single Father | Single Mother |
| No Children | 0 (0.0%) | 0 (0.0%) |
| 1 or 2 Children | 0 (0.0%) | 0 (0.0%) |
| 3 or 4 Children | 0 (0.0%) | 0 (0.0%) |
| 5 or more Children | 0 (0.0%) | 0 (0.0%) |
| Total | 0 (0.0%) | 0 (0.0%) |
Income Below Poverty Among Married-Couple vs Single-Parent Households in West Alexander
| Children | Married-Couple Families | Single-Parent Households |
| No Children | 0 (0.0%) | 0 (0.0%) |
| 1 or 2 Children | 0 (0.0%) | 0 (0.0%) |
| 3 or 4 Children | 0 (0.0%) | 0 (0.0%) |
| 5 or more Children | 0 (0.0%) | 0 (0.0%) |
| Total | 0 (0.0%) | 0 (0.0%) |
Race in West Alexander
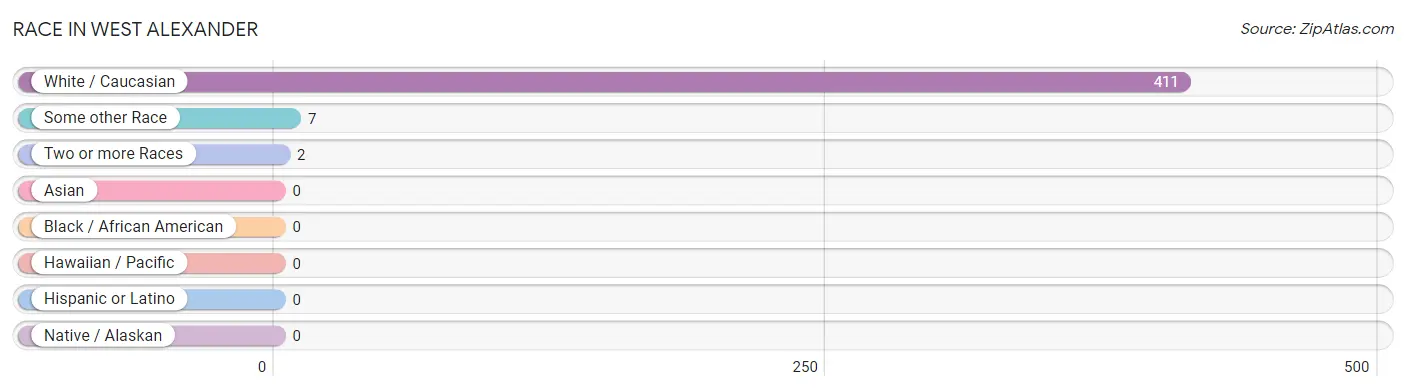
The most populous races in West Alexander are White / Caucasian (411 | 97.9%), Some other Race (7 | 1.7%), and Two or more Races (2 | 0.5%).
| Race | # Population | % Population |
| Asian | 0 | 0.0% |
| Black / African American | 0 | 0.0% |
| Hawaiian / Pacific | 0 | 0.0% |
| Hispanic or Latino | 0 | 0.0% |
| Native / Alaskan | 0 | 0.0% |
| White / Caucasian | 411 | 97.9% |
| Two or more Races | 2 | 0.5% |
| Some other Race | 7 | 1.7% |
| Total | 420 | 100.0% |
Ancestry in West Alexander
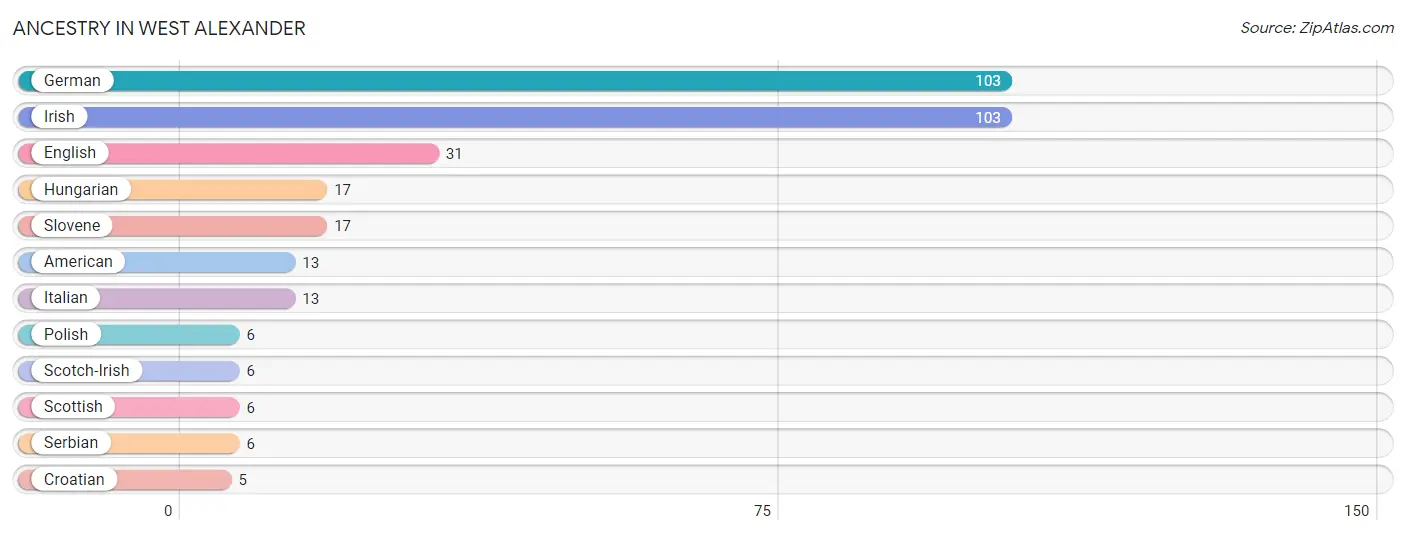
The most populous ancestries reported in West Alexander are German (103 | 24.5%), Irish (103 | 24.5%), English (31 | 7.4%), Hungarian (17 | 4.1%), and Slovene (17 | 4.1%), together accounting for 64.5% of all West Alexander residents.
| Ancestry | # Population | % Population |
| American | 13 | 3.1% |
| Croatian | 5 | 1.2% |
| English | 31 | 7.4% |
| German | 103 | 24.5% |
| Hungarian | 17 | 4.1% |
| Irish | 103 | 24.5% |
| Italian | 13 | 3.1% |
| Polish | 6 | 1.4% |
| Scotch-Irish | 6 | 1.4% |
| Scottish | 6 | 1.4% |
| Serbian | 6 | 1.4% |
| Slovene | 17 | 4.1% | View All 12 Rows |
Immigrants in West Alexander
The most numerous immigrant groups reported in West Alexander came from Europe (6 | 1.4%), Germany (6 | 1.4%), and Western Europe (6 | 1.4%), together accounting for 4.3% of all West Alexander residents.
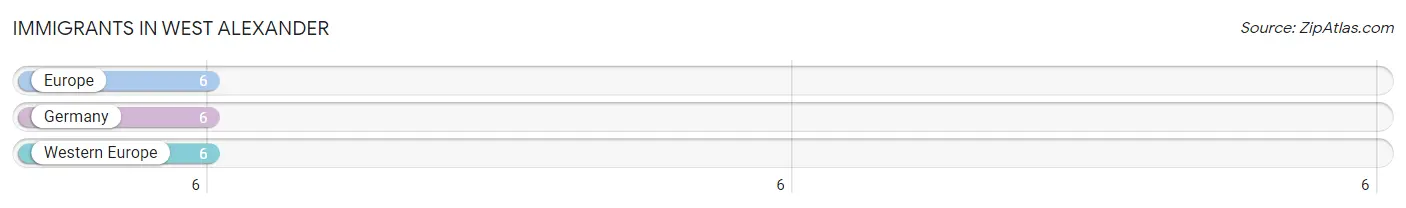
| Immigration Origin | # Population | % Population |
| Europe | 6 | 1.4% |
| Germany | 6 | 1.4% |
| Western Europe | 6 | 1.4% | View All 3 Rows |
Sex and Age in West Alexander
Sex and Age in West Alexander
The most populous age groups in West Alexander are 15 to 19 Years (27 | 12.9%) for men and 55 to 59 Years (49 | 23.3%) for women.
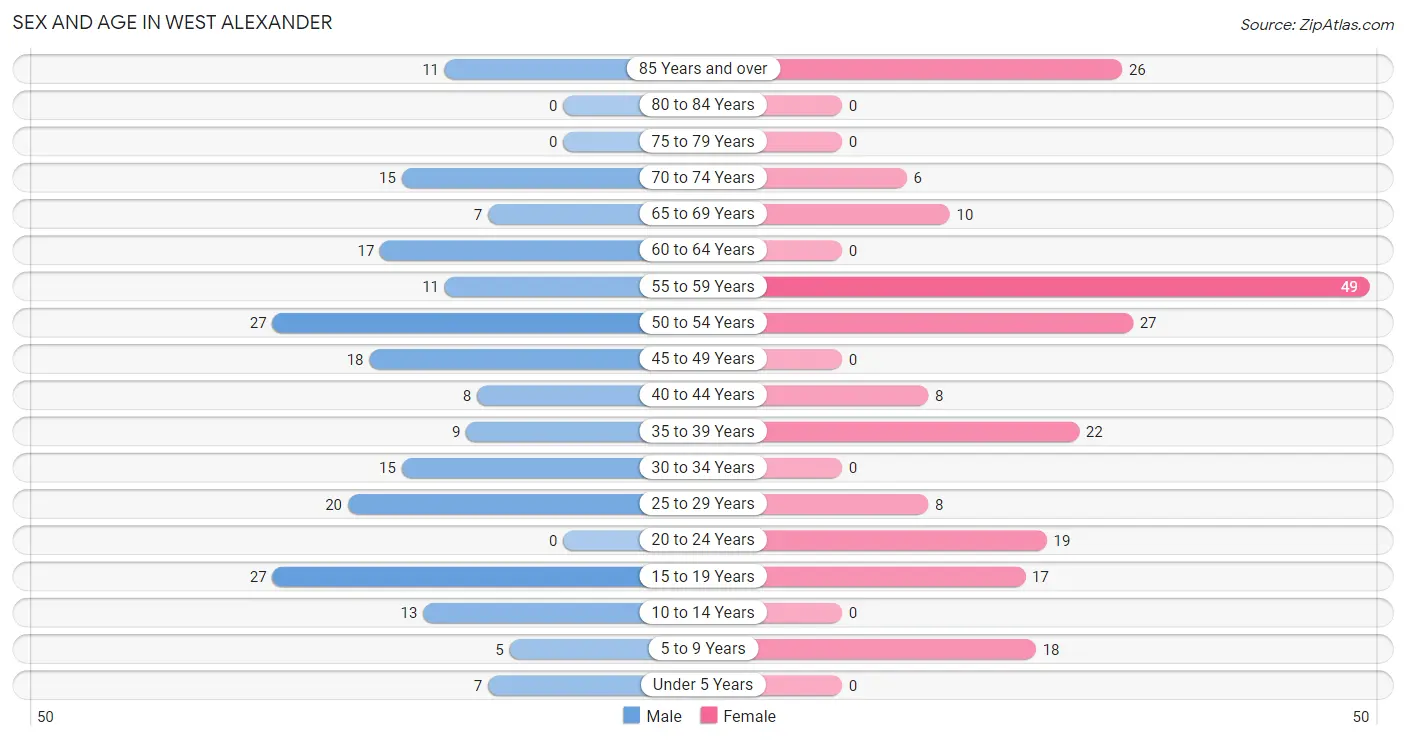
| Age Bracket | Male | Female |
| Under 5 Years | 7 (3.3%) | 0 (0.0%) |
| 5 to 9 Years | 5 (2.4%) | 18 (8.6%) |
| 10 to 14 Years | 13 (6.2%) | 0 (0.0%) |
| 15 to 19 Years | 27 (12.9%) | 17 (8.1%) |
| 20 to 24 Years | 0 (0.0%) | 19 (9.0%) |
| 25 to 29 Years | 20 (9.5%) | 8 (3.8%) |
| 30 to 34 Years | 15 (7.1%) | 0 (0.0%) |
| 35 to 39 Years | 9 (4.3%) | 22 (10.5%) |
| 40 to 44 Years | 8 (3.8%) | 8 (3.8%) |
| 45 to 49 Years | 18 (8.6%) | 0 (0.0%) |
| 50 to 54 Years | 27 (12.9%) | 27 (12.9%) |
| 55 to 59 Years | 11 (5.2%) | 49 (23.3%) |
| 60 to 64 Years | 17 (8.1%) | 0 (0.0%) |
| 65 to 69 Years | 7 (3.3%) | 10 (4.8%) |
| 70 to 74 Years | 15 (7.1%) | 6 (2.9%) |
| 75 to 79 Years | 0 (0.0%) | 0 (0.0%) |
| 80 to 84 Years | 0 (0.0%) | 0 (0.0%) |
| 85 Years and over | 11 (5.2%) | 26 (12.4%) |
| Total | 210 (100.0%) | 210 (100.0%) |
Families and Households in West Alexander
Median Family Size in West Alexander
The median family size in West Alexander is 3.01 persons per family, with married-couple families (69 | 56.1%) accounting for the largest median family size of 3.55 persons per family. On the other hand, single male/father families (25 | 20.3%) represent the smallest median family size with 2.16 persons per family.
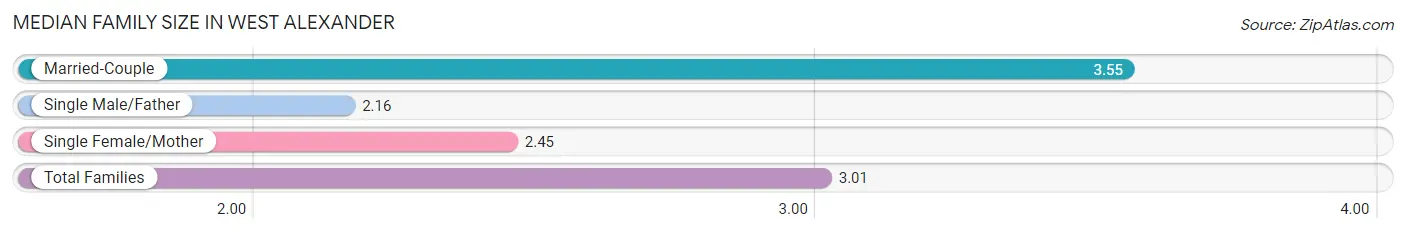
| Family Type | # Families | Family Size |
| Married-Couple | 69 (56.1%) | 3.55 |
| Single Male/Father | 25 (20.3%) | 2.16 |
| Single Female/Mother | 29 (23.6%) | 2.45 |
| Total Families | 123 (100.0%) | 3.01 |
Median Household Size in West Alexander
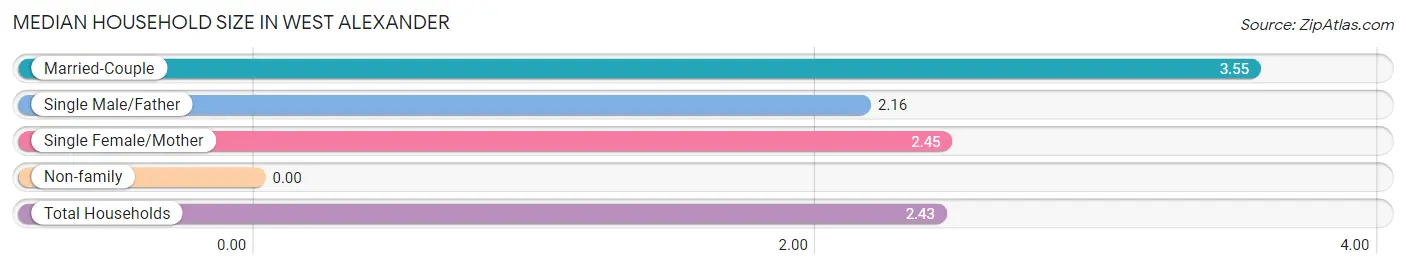
| Household Type | # Households | Household Size |
| Married-Couple | 69 (39.9%) | 3.55 |
| Single Male/Father | 25 (14.4%) | 2.16 |
| Single Female/Mother | 29 (16.8%) | 2.45 |
| Non-family | 50 (28.9%) | - |
| Total Households | 173 (100.0%) | 2.43 |
Household Size by Marriage Status in West Alexander
Out of a total of 173 households in West Alexander, 123 (71.1%) are family households, while 50 (28.9%) are nonfamily households. The most numerous type of family households are 2-person households, comprising 74, and the most common type of nonfamily households are 1-person households, comprising 50.
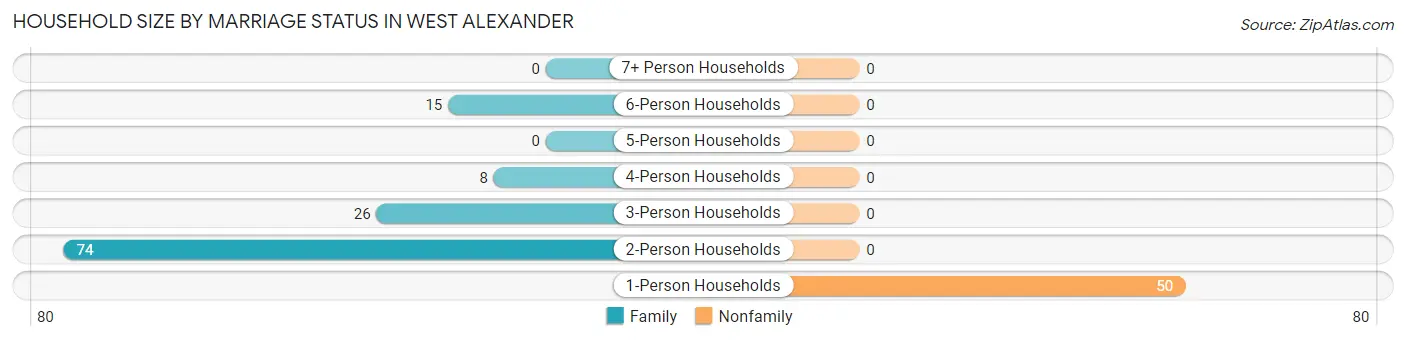
| Household Size | Family Households | Nonfamily Households |
| 1-Person Households | - | 50 (28.9%) |
| 2-Person Households | 74 (42.8%) | 0 (0.0%) |
| 3-Person Households | 26 (15.0%) | 0 (0.0%) |
| 4-Person Households | 8 (4.6%) | 0 (0.0%) |
| 5-Person Households | 0 (0.0%) | 0 (0.0%) |
| 6-Person Households | 15 (8.7%) | 0 (0.0%) |
| 7+ Person Households | 0 (0.0%) | 0 (0.0%) |
| Total | 123 (71.1%) | 50 (28.9%) |
Female Fertility in West Alexander
Fertility by Age in West Alexander
Average fertility rate in West Alexander is 96.0 births per 1,000 women. Women in the age bracket of 20 to 34 years have the highest fertility rate with 296.0 births per 1,000 women. Women in the age bracket of 20 to 34 years acount for 100.0% of all women with births.
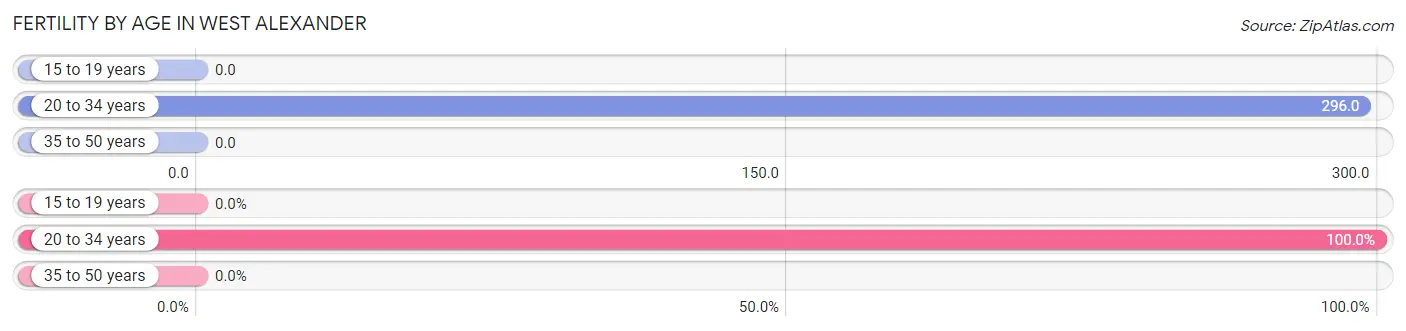
| Age Bracket | Women with Births | Births / 1,000 Women |
| 15 to 19 years | 0 (0.0%) | 0.0 |
| 20 to 34 years | 8 (100.0%) | 296.0 |
| 35 to 50 years | 0 (0.0%) | 0.0 |
| Total | 8 (100.0%) | 96.0 |
Fertility by Age by Marriage Status in West Alexander
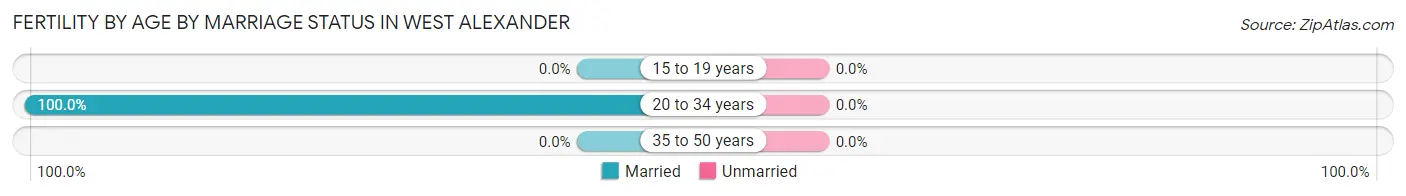
| Age Bracket | Married | Unmarried |
| 15 to 19 years | 0 (0.0%) | 0 (0.0%) |
| 20 to 34 years | 8 (100.0%) | 0 (0.0%) |
| 35 to 50 years | 0 (0.0%) | 0 (0.0%) |
| Total | 8 (100.0%) | 0 (0.0%) |
Fertility by Education in West Alexander
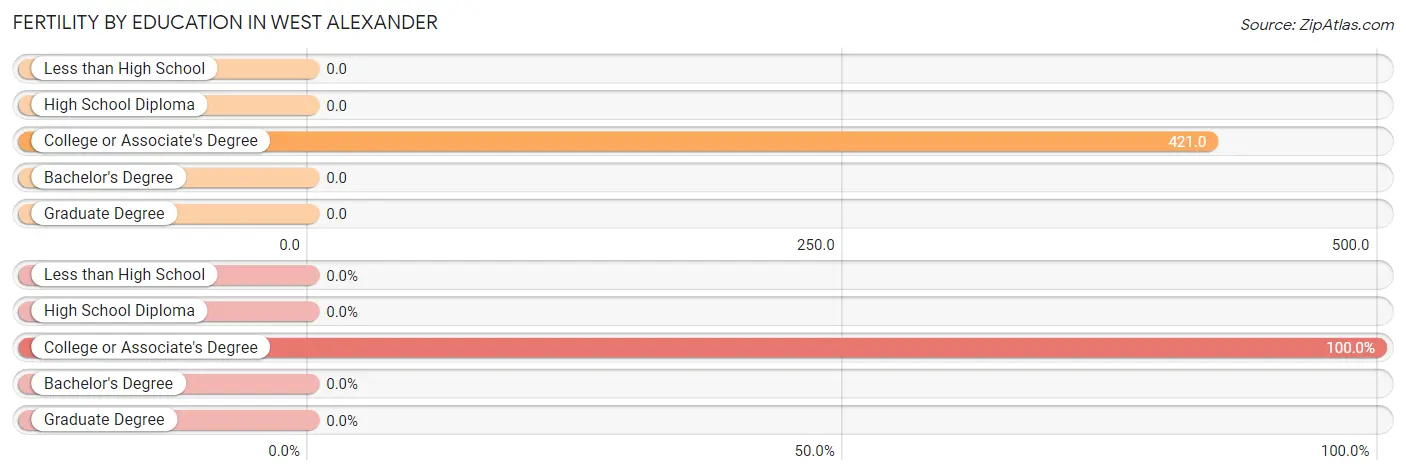
| Educational Attainment | Women with Births | Births / 1,000 Women |
| Less than High School | 0 (0.0%) | 0.0 |
| High School Diploma | 0 (0.0%) | 0.0 |
| College or Associate's Degree | 8 (100.0%) | 421.0 |
| Bachelor's Degree | 0 (0.0%) | 0.0 |
| Graduate Degree | 0 (0.0%) | 0.0 |
| Total | 8 (100.0%) | 96.0 |
Fertility by Education by Marriage Status in West Alexander
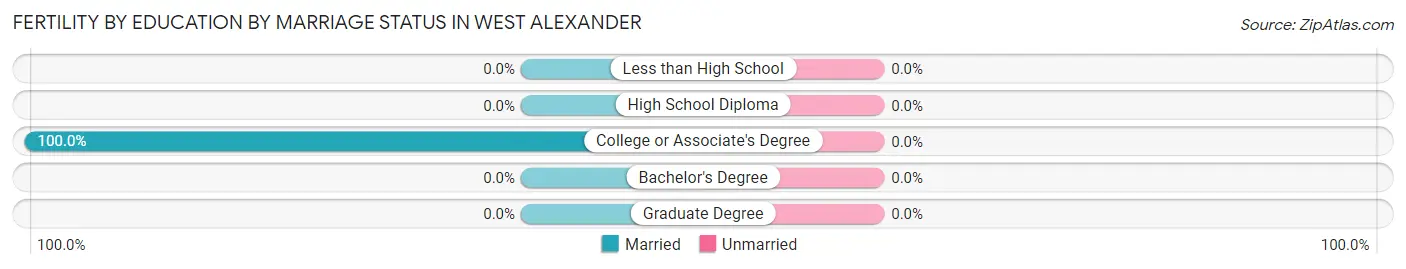
| Educational Attainment | Married | Unmarried |
| Less than High School | 0 (0.0%) | 0 (0.0%) |
| High School Diploma | 0 (0.0%) | 0 (0.0%) |
| College or Associate's Degree | 8 (100.0%) | 0 (0.0%) |
| Bachelor's Degree | 0 (0.0%) | 0 (0.0%) |
| Graduate Degree | 0 (0.0%) | 0 (0.0%) |
| Total | 8 (100.0%) | 0 (0.0%) |
Employment Characteristics in West Alexander
Employment by Class of Employer in West Alexander
Among the 248 employed individuals in West Alexander, private company employees (202 | 81.5%), not-for-profit organizations (20 | 8.1%), and self-employed (not incorporated) (10 | 4.0%) make up the most common classes of employment.
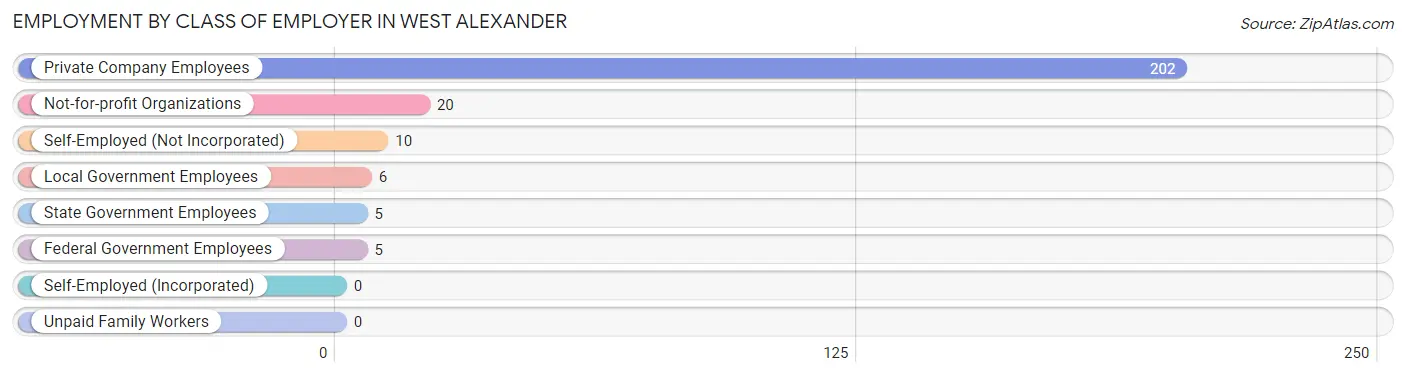
| Employer Class | # Employees | % Employees |
| Private Company Employees | 202 | 81.5% |
| Self-Employed (Incorporated) | 0 | 0.0% |
| Self-Employed (Not Incorporated) | 10 | 4.0% |
| Not-for-profit Organizations | 20 | 8.1% |
| Local Government Employees | 6 | 2.4% |
| State Government Employees | 5 | 2.0% |
| Federal Government Employees | 5 | 2.0% |
| Unpaid Family Workers | 0 | 0.0% |
| Total | 248 | 100.0% |
Employment Status by Age in West Alexander
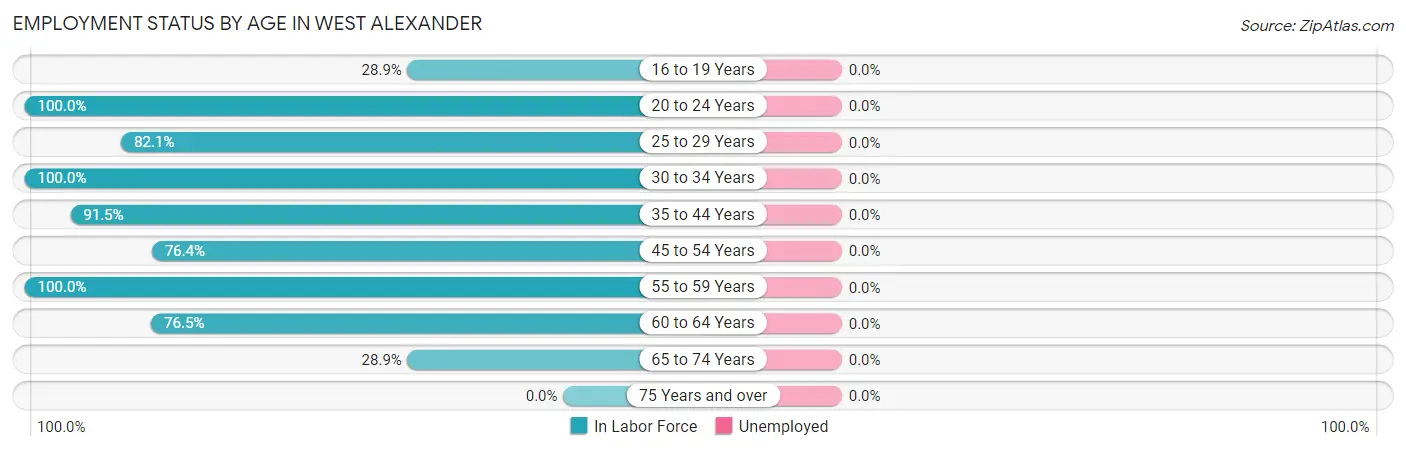
| Age Bracket | In Labor Force | Unemployed |
| 16 to 19 Years | 11 (28.9%) | 0 (0.0%) |
| 20 to 24 Years | 19 (100.0%) | 0 (0.0%) |
| 25 to 29 Years | 23 (82.1%) | 0 (0.0%) |
| 30 to 34 Years | 15 (100.0%) | 0 (0.0%) |
| 35 to 44 Years | 43 (91.5%) | 0 (0.0%) |
| 45 to 54 Years | 55 (76.4%) | 0 (0.0%) |
| 55 to 59 Years | 60 (100.0%) | 0 (0.0%) |
| 60 to 64 Years | 13 (76.5%) | 0 (0.0%) |
| 65 to 74 Years | 11 (28.9%) | 0 (0.0%) |
| 75 Years and over | 0 (0.0%) | 0 (0.0%) |
| Total | 250 (67.4%) | 0 (0.0%) |
Employment Status by Educational Attainment in West Alexander
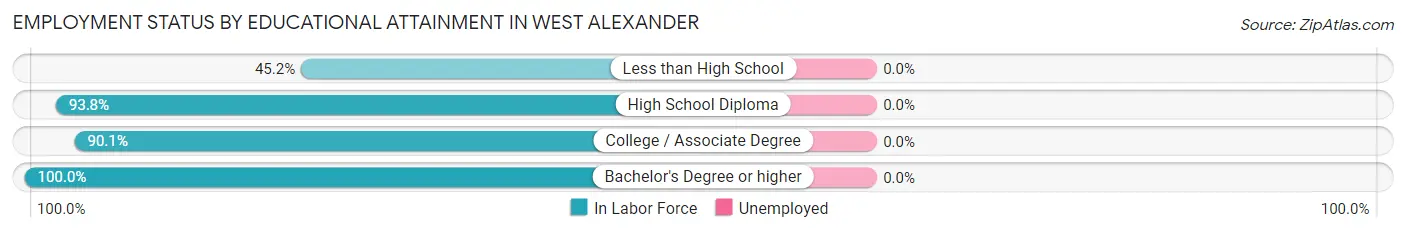
| Educational Attainment | In Labor Force | Unemployed |
| Less than High School | 14 (45.2%) | 0 (0.0%) |
| High School Diploma | 61 (93.8%) | 0 (0.0%) |
| College / Associate Degree | 82 (90.1%) | 0 (0.0%) |
| Bachelor's Degree or higher | 52 (100.0%) | 0 (0.0%) |
| Total | 209 (87.4%) | 0 (0.0%) |
Employment Occupations by Sex in West Alexander
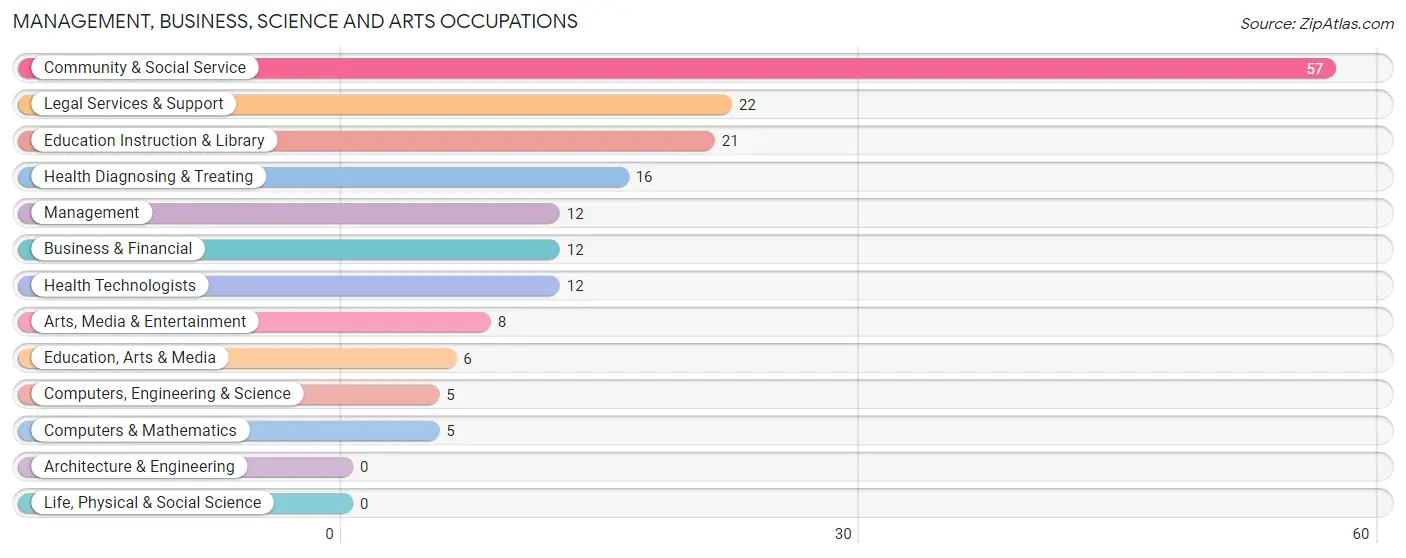
Management, Business, Science and Arts Occupations
The most common Management, Business, Science and Arts occupations in West Alexander are Community & Social Service (57 | 22.8%), Legal Services & Support (22 | 8.8%), Education Instruction & Library (21 | 8.4%), Health Diagnosing & Treating (16 | 6.4%), and Management (12 | 4.8%).
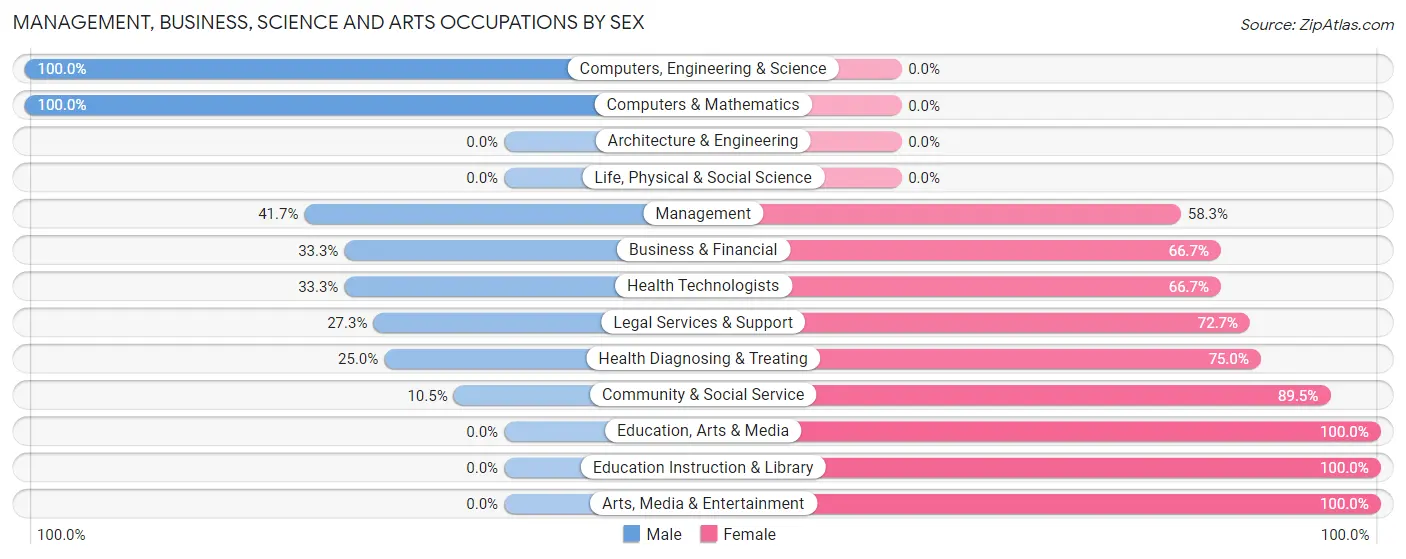
Management, Business, Science and Arts Occupations by Sex
Within the Management, Business, Science and Arts occupations in West Alexander, the most male-oriented occupations are Computers, Engineering & Science (100.0%), Computers & Mathematics (100.0%), and Management (41.7%), while the most female-oriented occupations are Education, Arts & Media (100.0%), Education Instruction & Library (100.0%), and Arts, Media & Entertainment (100.0%).
| Occupation | Male | Female |
| Management | 5 (41.7%) | 7 (58.3%) |
| Business & Financial | 4 (33.3%) | 8 (66.7%) |
| Computers, Engineering & Science | 5 (100.0%) | 0 (0.0%) |
| Computers & Mathematics | 5 (100.0%) | 0 (0.0%) |
| Architecture & Engineering | 0 (0.0%) | 0 (0.0%) |
| Life, Physical & Social Science | 0 (0.0%) | 0 (0.0%) |
| Community & Social Service | 6 (10.5%) | 51 (89.5%) |
| Education, Arts & Media | 0 (0.0%) | 6 (100.0%) |
| Legal Services & Support | 6 (27.3%) | 16 (72.7%) |
| Education Instruction & Library | 0 (0.0%) | 21 (100.0%) |
| Arts, Media & Entertainment | 0 (0.0%) | 8 (100.0%) |
| Health Diagnosing & Treating | 4 (25.0%) | 12 (75.0%) |
| Health Technologists | 4 (33.3%) | 8 (66.7%) |
| Total (Category) | 24 (23.5%) | 78 (76.5%) |
| Total (Overall) | 105 (42.0%) | 145 (58.0%) |
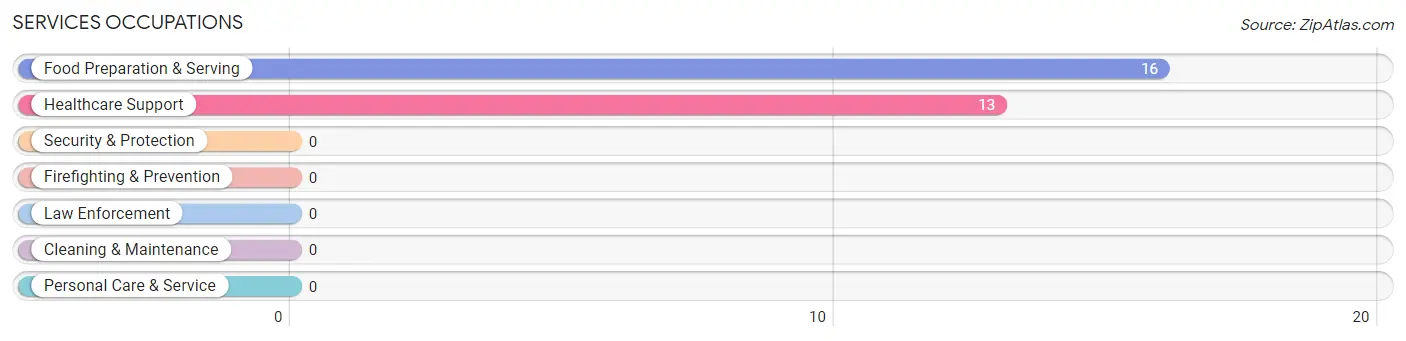
Services Occupations
The most common Services occupations in West Alexander are Food Preparation & Serving (16 | 6.4%), and Healthcare Support (13 | 5.2%).
Services Occupations by Sex
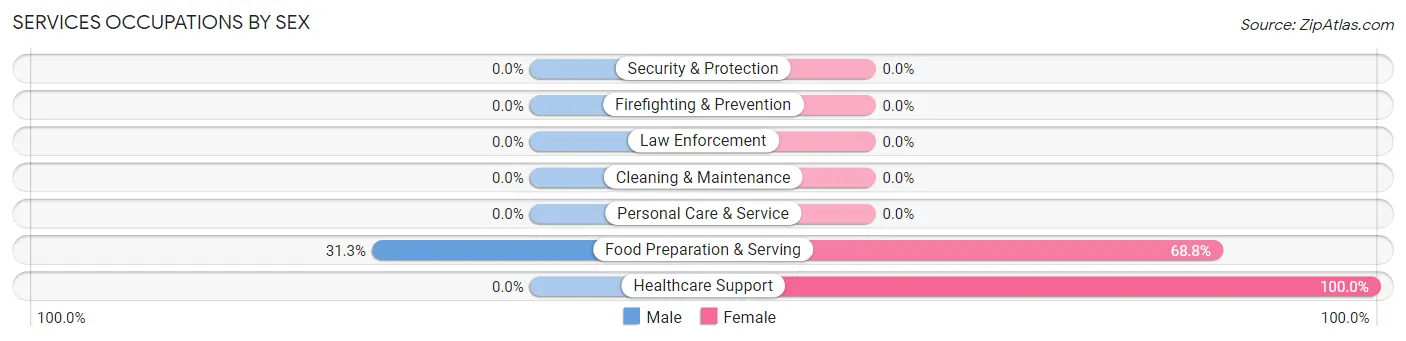
| Occupation | Male | Female |
| Healthcare Support | 0 (0.0%) | 13 (100.0%) |
| Security & Protection | 0 (0.0%) | 0 (0.0%) |
| Firefighting & Prevention | 0 (0.0%) | 0 (0.0%) |
| Law Enforcement | 0 (0.0%) | 0 (0.0%) |
| Food Preparation & Serving | 5 (31.2%) | 11 (68.8%) |
| Cleaning & Maintenance | 0 (0.0%) | 0 (0.0%) |
| Personal Care & Service | 0 (0.0%) | 0 (0.0%) |
| Total (Category) | 5 (17.2%) | 24 (82.8%) |
| Total (Overall) | 105 (42.0%) | 145 (58.0%) |
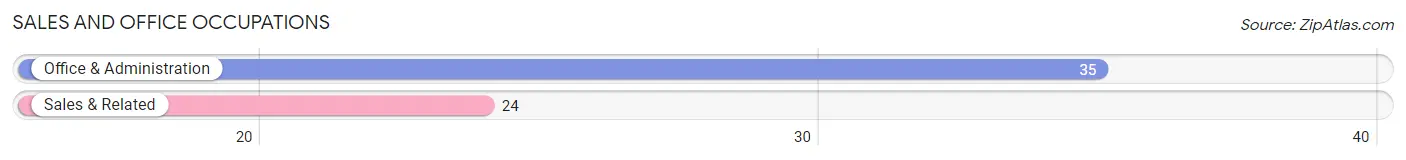
Sales and Office Occupations
The most common Sales and Office occupations in West Alexander are Office & Administration (35 | 14.0%), and Sales & Related (24 | 9.6%).
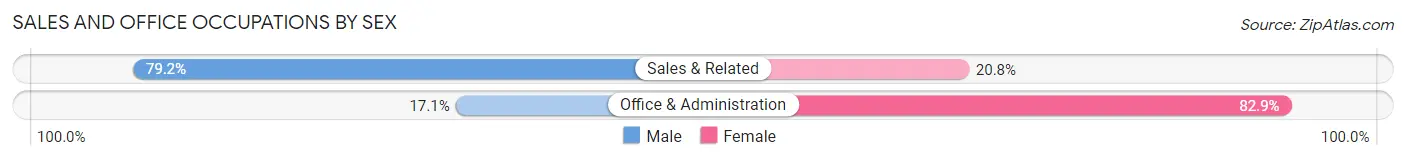
Sales and Office Occupations by Sex
| Occupation | Male | Female |
| Sales & Related | 19 (79.2%) | 5 (20.8%) |
| Office & Administration | 6 (17.1%) | 29 (82.9%) |
| Total (Category) | 25 (42.4%) | 34 (57.6%) |
| Total (Overall) | 105 (42.0%) | 145 (58.0%) |
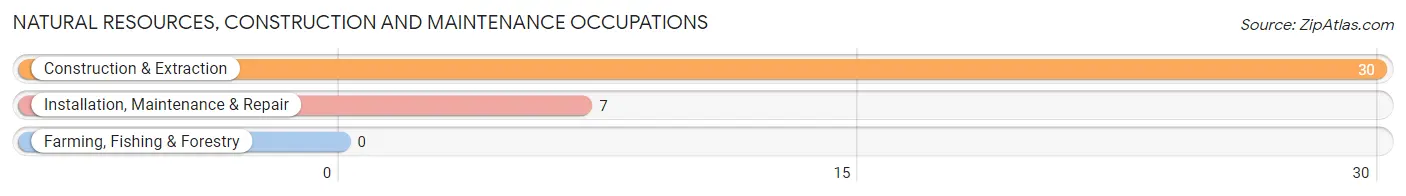
Natural Resources, Construction and Maintenance Occupations
The most common Natural Resources, Construction and Maintenance occupations in West Alexander are Construction & Extraction (30 | 12.0%), and Installation, Maintenance & Repair (7 | 2.8%).
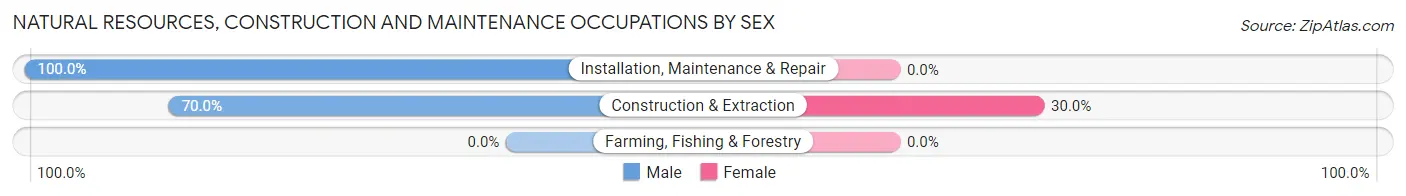
Natural Resources, Construction and Maintenance Occupations by Sex
| Occupation | Male | Female |
| Farming, Fishing & Forestry | 0 (0.0%) | 0 (0.0%) |
| Construction & Extraction | 21 (70.0%) | 9 (30.0%) |
| Installation, Maintenance & Repair | 7 (100.0%) | 0 (0.0%) |
| Total (Category) | 28 (75.7%) | 9 (24.3%) |
| Total (Overall) | 105 (42.0%) | 145 (58.0%) |
Production, Transportation and Moving Occupations
The most common Production, Transportation and Moving occupations in West Alexander are Material Moving (16 | 6.4%), and Transportation (7 | 2.8%).
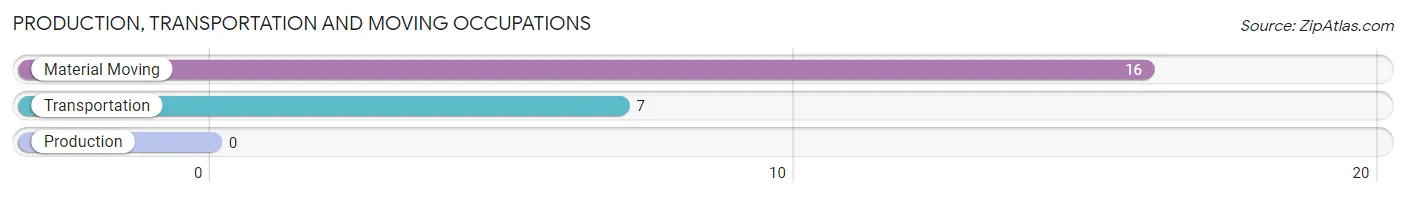
Production, Transportation and Moving Occupations by Sex
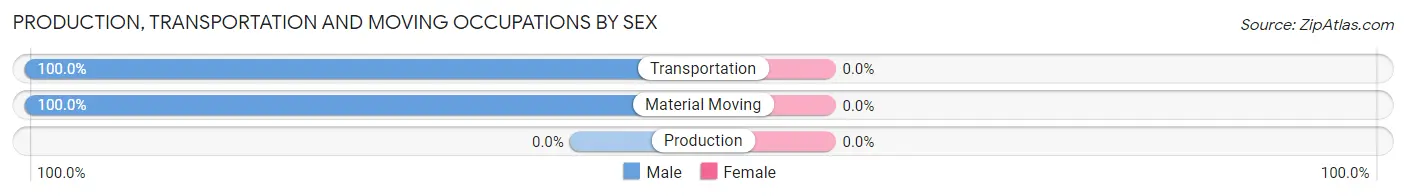
| Occupation | Male | Female |
| Production | 0 (0.0%) | 0 (0.0%) |
| Transportation | 7 (100.0%) | 0 (0.0%) |
| Material Moving | 16 (100.0%) | 0 (0.0%) |
| Total (Category) | 23 (100.0%) | 0 (0.0%) |
| Total (Overall) | 105 (42.0%) | 145 (58.0%) |
Employment Industries by Sex in West Alexander
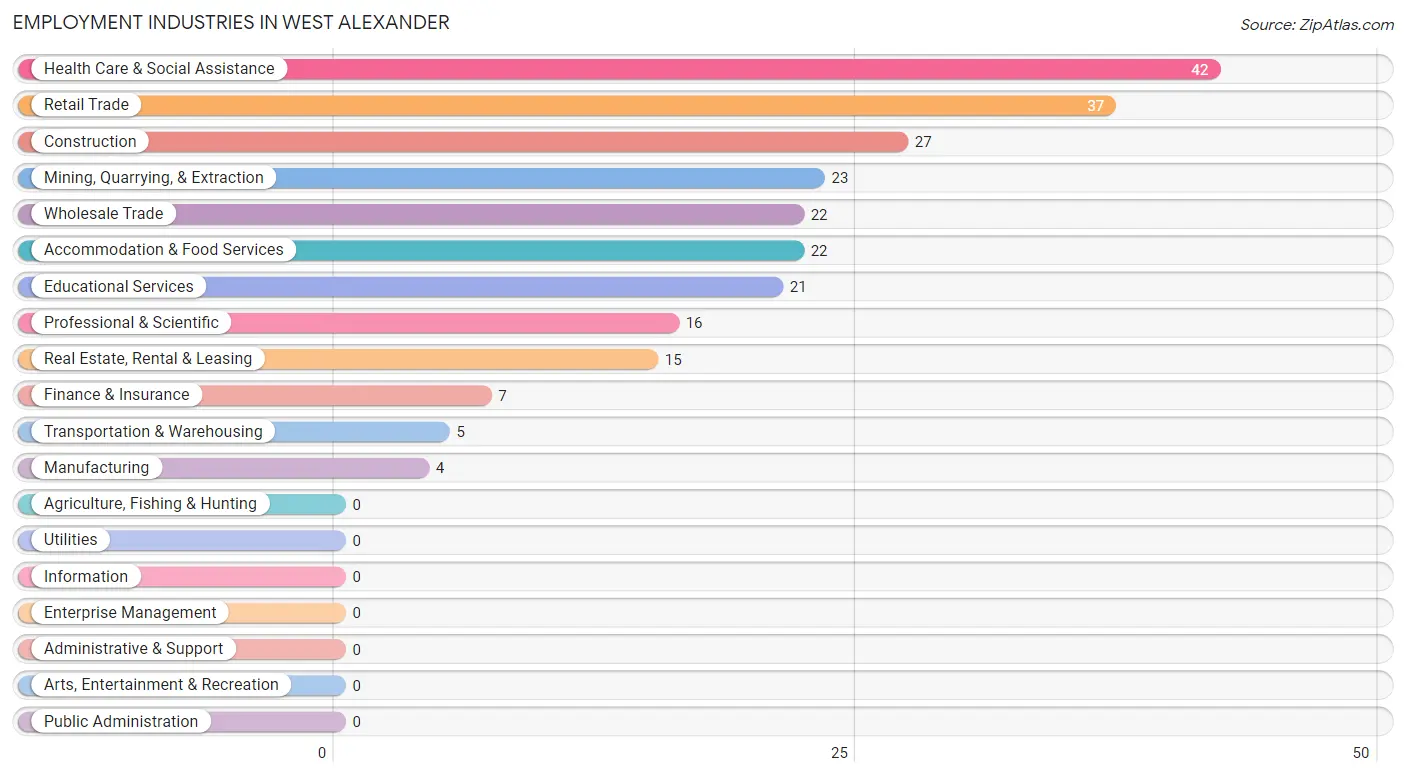
Employment Industries in West Alexander
The major employment industries in West Alexander include Health Care & Social Assistance (42 | 16.8%), Retail Trade (37 | 14.8%), Construction (27 | 10.8%), Mining, Quarrying, & Extraction (23 | 9.2%), and Wholesale Trade (22 | 8.8%).
Employment Industries by Sex in West Alexander
The West Alexander industries that see more men than women are Manufacturing (100.0%), Wholesale Trade (86.4%), and Construction (70.4%), whereas the industries that tend to have a higher number of women are Transportation & Warehousing (100.0%), Finance & Insurance (100.0%), and Professional & Scientific (100.0%).
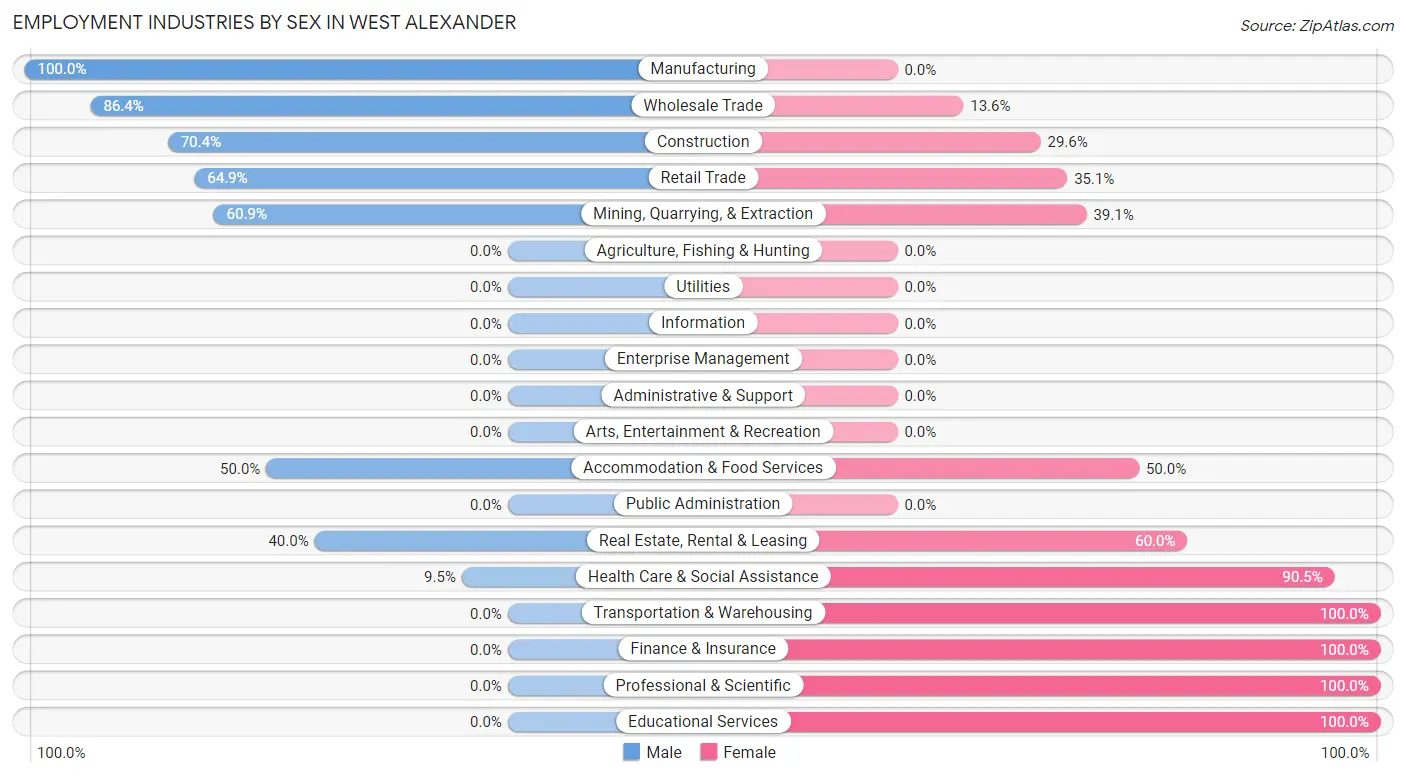
| Industry | Male | Female |
| Agriculture, Fishing & Hunting | 0 (0.0%) | 0 (0.0%) |
| Mining, Quarrying, & Extraction | 14 (60.9%) | 9 (39.1%) |
| Construction | 19 (70.4%) | 8 (29.6%) |
| Manufacturing | 4 (100.0%) | 0 (0.0%) |
| Wholesale Trade | 19 (86.4%) | 3 (13.6%) |
| Retail Trade | 24 (64.9%) | 13 (35.1%) |
| Transportation & Warehousing | 0 (0.0%) | 5 (100.0%) |
| Utilities | 0 (0.0%) | 0 (0.0%) |
| Information | 0 (0.0%) | 0 (0.0%) |
| Finance & Insurance | 0 (0.0%) | 7 (100.0%) |
| Real Estate, Rental & Leasing | 6 (40.0%) | 9 (60.0%) |
| Professional & Scientific | 0 (0.0%) | 16 (100.0%) |
| Enterprise Management | 0 (0.0%) | 0 (0.0%) |
| Administrative & Support | 0 (0.0%) | 0 (0.0%) |
| Educational Services | 0 (0.0%) | 21 (100.0%) |
| Health Care & Social Assistance | 4 (9.5%) | 38 (90.5%) |
| Arts, Entertainment & Recreation | 0 (0.0%) | 0 (0.0%) |
| Accommodation & Food Services | 11 (50.0%) | 11 (50.0%) |
| Public Administration | 0 (0.0%) | 0 (0.0%) |
| Total | 105 (42.0%) | 145 (58.0%) |
Education in West Alexander
School Enrollment in West Alexander
The most common levels of schooling among the 93 students in West Alexander are high school (37 | 39.8%), elementary school (21 | 22.6%), and graduate / professional (15 | 16.1%).
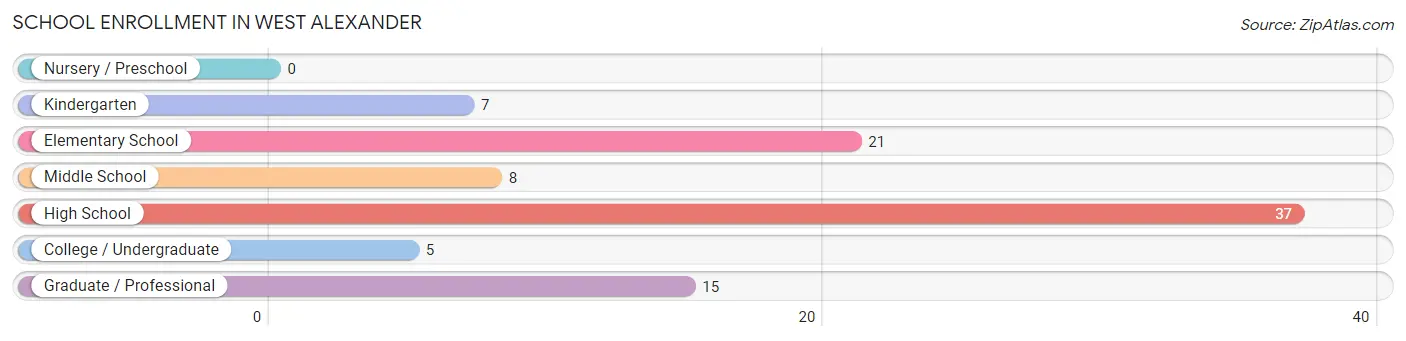
| School Level | # Students | % Students |
| Nursery / Preschool | 0 | 0.0% |
| Kindergarten | 7 | 7.5% |
| Elementary School | 21 | 22.6% |
| Middle School | 8 | 8.6% |
| High School | 37 | 39.8% |
| College / Undergraduate | 5 | 5.4% |
| Graduate / Professional | 15 | 16.1% |
| Total | 93 | 100.0% |
School Enrollment by Age by Funding Source in West Alexander
Out of a total of 93 students who are enrolled in schools in West Alexander, 4 (4.3%) attend a private institution, while the remaining 89 (95.7%) are enrolled in public schools. The age group of 5 to 9 year old has the highest likelihood of being enrolled in private schools, with 4 (17.4% in the age bracket) enrolled. Conversely, the age group of 10 to 14 year olds has the lowest likelihood of being enrolled in a private school, with 13 (100.0% in the age bracket) attending a public institution.
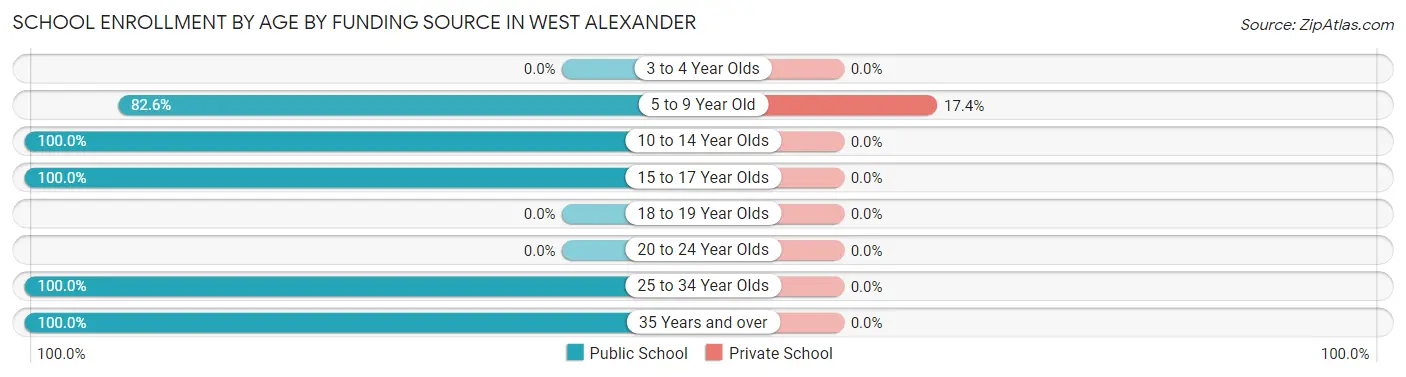
| Age Bracket | Public School | Private School |
| 3 to 4 Year Olds | 0 (0.0%) | 0 (0.0%) |
| 5 to 9 Year Old | 19 (82.6%) | 4 (17.4%) |
| 10 to 14 Year Olds | 13 (100.0%) | 0 (0.0%) |
| 15 to 17 Year Olds | 37 (100.0%) | 0 (0.0%) |
| 18 to 19 Year Olds | 0 (0.0%) | 0 (0.0%) |
| 20 to 24 Year Olds | 0 (0.0%) | 0 (0.0%) |
| 25 to 34 Year Olds | 13 (100.0%) | 0 (0.0%) |
| 35 Years and over | 7 (100.0%) | 0 (0.0%) |
| Total | 89 (95.7%) | 4 (4.3%) |
Educational Attainment by Field of Study in West Alexander
Business (16 | 23.5%), education (16 | 23.5%), visual & performing arts (16 | 23.5%), science & technology (9 | 13.2%), and psychology (6 | 8.8%) are the most common fields of study among 68 individuals in West Alexander who have obtained a bachelor's degree or higher.
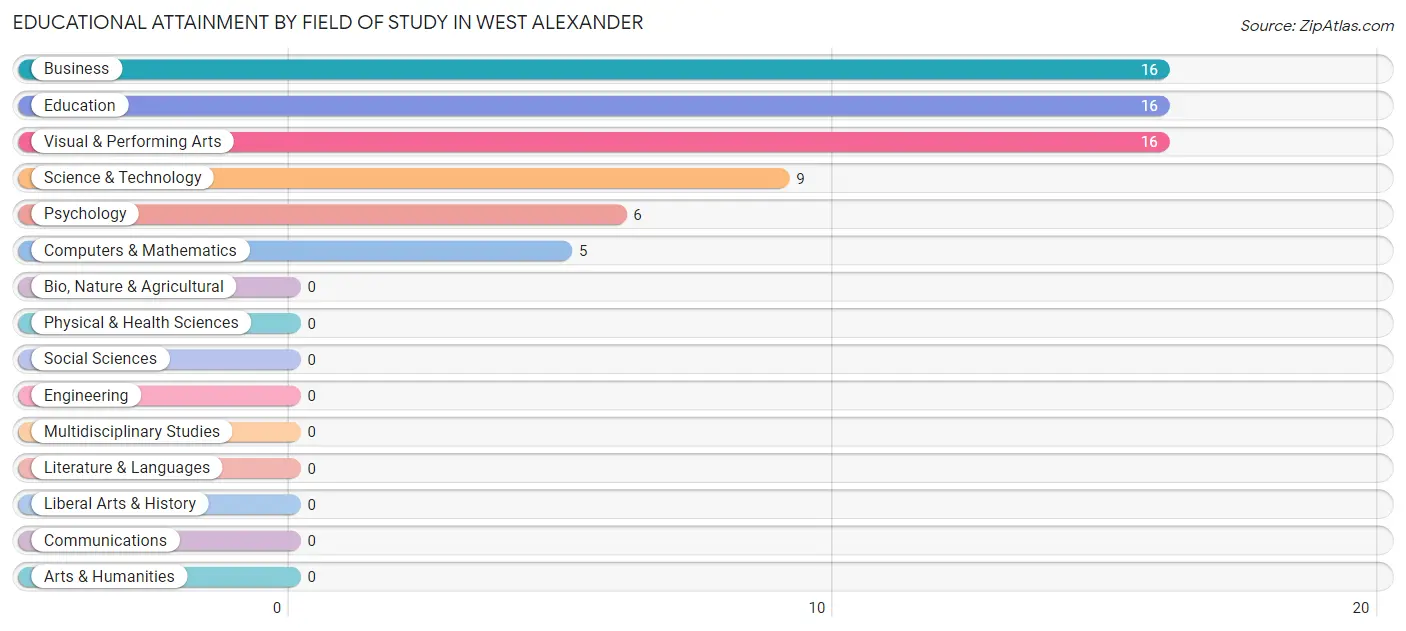
| Field of Study | # Graduates | % Graduates |
| Computers & Mathematics | 5 | 7.3% |
| Bio, Nature & Agricultural | 0 | 0.0% |
| Physical & Health Sciences | 0 | 0.0% |
| Psychology | 6 | 8.8% |
| Social Sciences | 0 | 0.0% |
| Engineering | 0 | 0.0% |
| Multidisciplinary Studies | 0 | 0.0% |
| Science & Technology | 9 | 13.2% |
| Business | 16 | 23.5% |
| Education | 16 | 23.5% |
| Literature & Languages | 0 | 0.0% |
| Liberal Arts & History | 0 | 0.0% |
| Visual & Performing Arts | 16 | 23.5% |
| Communications | 0 | 0.0% |
| Arts & Humanities | 0 | 0.0% |
| Total | 68 | 100.0% |
Transportation & Commute in West Alexander
Vehicle Availability by Sex in West Alexander
The most prevalent vehicle ownership categories in West Alexander are males with 2 vehicles (44, accounting for 41.9%) and females with 2 vehicles (44, making up 30.8%).
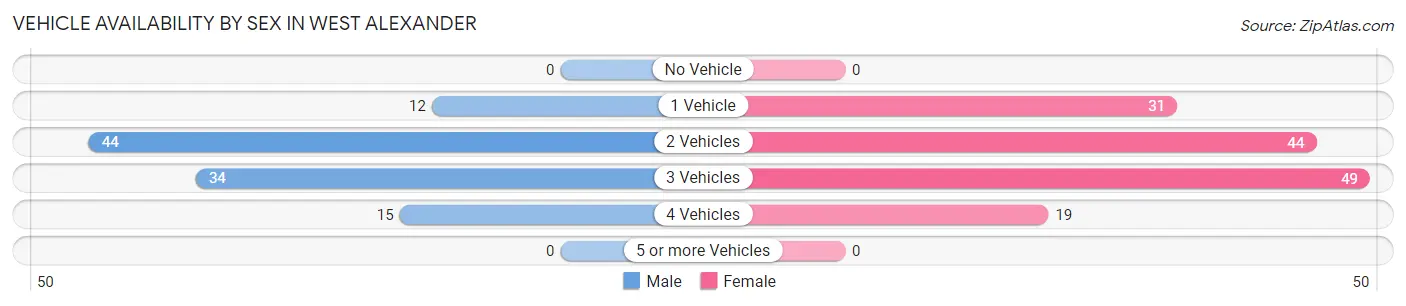
| Vehicles Available | Male | Female |
| No Vehicle | 0 (0.0%) | 0 (0.0%) |
| 1 Vehicle | 12 (11.4%) | 31 (21.7%) |
| 2 Vehicles | 44 (41.9%) | 44 (30.8%) |
| 3 Vehicles | 34 (32.4%) | 49 (34.3%) |
| 4 Vehicles | 15 (14.3%) | 19 (13.3%) |
| 5 or more Vehicles | 0 (0.0%) | 0 (0.0%) |
| Total | 105 (100.0%) | 143 (100.0%) |
Commute Time in West Alexander
The most frequently occuring commute durations in West Alexander are 20 to 24 minutes (55 commuters, 25.6%), 25 to 29 minutes (48 commuters, 22.3%), and 45 to 59 minutes (36 commuters, 16.7%).
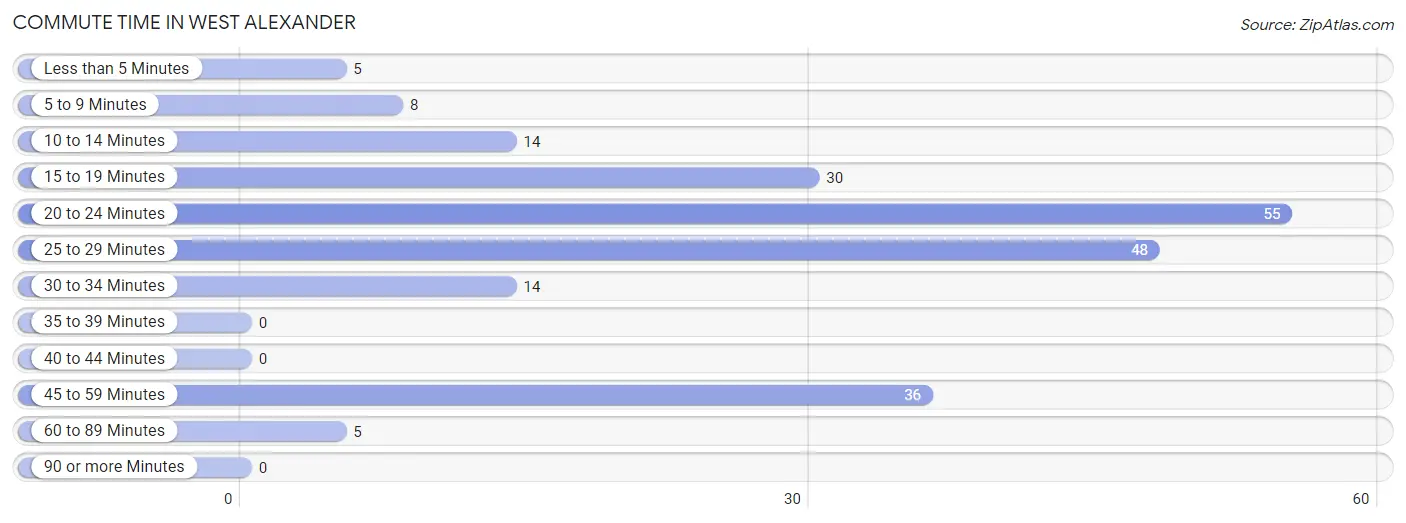
| Commute Time | # Commuters | % Commuters |
| Less than 5 Minutes | 5 | 2.3% |
| 5 to 9 Minutes | 8 | 3.7% |
| 10 to 14 Minutes | 14 | 6.5% |
| 15 to 19 Minutes | 30 | 14.0% |
| 20 to 24 Minutes | 55 | 25.6% |
| 25 to 29 Minutes | 48 | 22.3% |
| 30 to 34 Minutes | 14 | 6.5% |
| 35 to 39 Minutes | 0 | 0.0% |
| 40 to 44 Minutes | 0 | 0.0% |
| 45 to 59 Minutes | 36 | 16.7% |
| 60 to 89 Minutes | 5 | 2.3% |
| 90 or more Minutes | 0 | 0.0% |
Commute Time by Sex in West Alexander
The most common commute times in West Alexander are 45 to 59 minutes (33 commuters, 33.3%) for males and 20 to 24 minutes (37 commuters, 31.9%) for females.
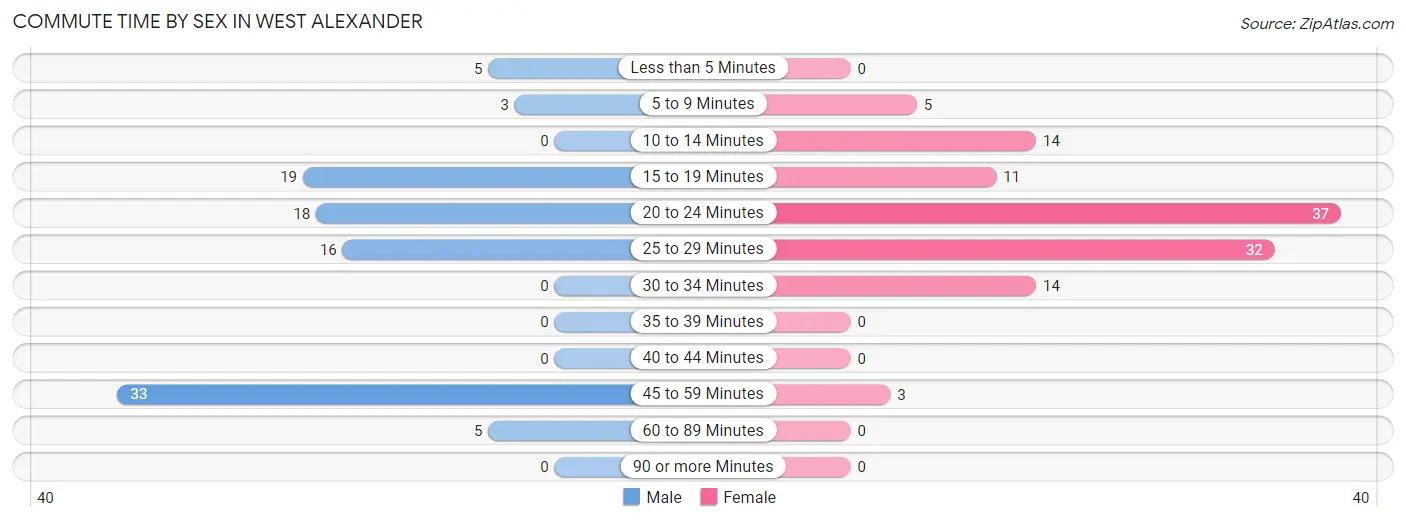
| Commute Time | Male | Female |
| Less than 5 Minutes | 5 (5.1%) | 0 (0.0%) |
| 5 to 9 Minutes | 3 (3.0%) | 5 (4.3%) |
| 10 to 14 Minutes | 0 (0.0%) | 14 (12.1%) |
| 15 to 19 Minutes | 19 (19.2%) | 11 (9.5%) |
| 20 to 24 Minutes | 18 (18.2%) | 37 (31.9%) |
| 25 to 29 Minutes | 16 (16.2%) | 32 (27.6%) |
| 30 to 34 Minutes | 0 (0.0%) | 14 (12.1%) |
| 35 to 39 Minutes | 0 (0.0%) | 0 (0.0%) |
| 40 to 44 Minutes | 0 (0.0%) | 0 (0.0%) |
| 45 to 59 Minutes | 33 (33.3%) | 3 (2.6%) |
| 60 to 89 Minutes | 5 (5.1%) | 0 (0.0%) |
| 90 or more Minutes | 0 (0.0%) | 0 (0.0%) |
Time of Departure to Work by Sex in West Alexander
The most frequent times of departure to work in West Alexander are 12:00 AM to 4:59 AM (24, 24.2%) for males and 10:00 AM to 10:59 AM (22, 19.0%) for females.
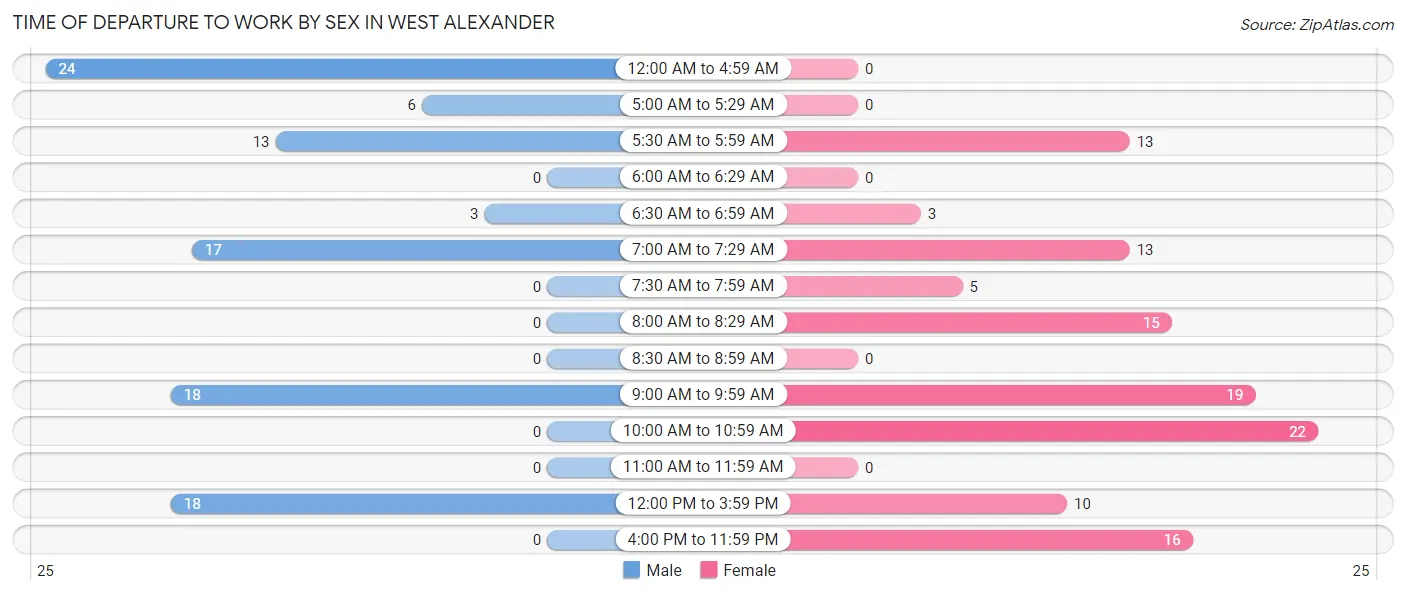
| Time of Departure | Male | Female |
| 12:00 AM to 4:59 AM | 24 (24.2%) | 0 (0.0%) |
| 5:00 AM to 5:29 AM | 6 (6.1%) | 0 (0.0%) |
| 5:30 AM to 5:59 AM | 13 (13.1%) | 13 (11.2%) |
| 6:00 AM to 6:29 AM | 0 (0.0%) | 0 (0.0%) |
| 6:30 AM to 6:59 AM | 3 (3.0%) | 3 (2.6%) |
| 7:00 AM to 7:29 AM | 17 (17.2%) | 13 (11.2%) |
| 7:30 AM to 7:59 AM | 0 (0.0%) | 5 (4.3%) |
| 8:00 AM to 8:29 AM | 0 (0.0%) | 15 (12.9%) |
| 8:30 AM to 8:59 AM | 0 (0.0%) | 0 (0.0%) |
| 9:00 AM to 9:59 AM | 18 (18.2%) | 19 (16.4%) |
| 10:00 AM to 10:59 AM | 0 (0.0%) | 22 (19.0%) |
| 11:00 AM to 11:59 AM | 0 (0.0%) | 0 (0.0%) |
| 12:00 PM to 3:59 PM | 18 (18.2%) | 10 (8.6%) |
| 4:00 PM to 11:59 PM | 0 (0.0%) | 16 (13.8%) |
| Total | 99 (100.0%) | 116 (100.0%) |
Housing Occupancy in West Alexander
Occupancy by Ownership in West Alexander
Of the total 173 dwellings in West Alexander, owner-occupied units account for 151 (87.3%), while renter-occupied units make up 22 (12.7%).
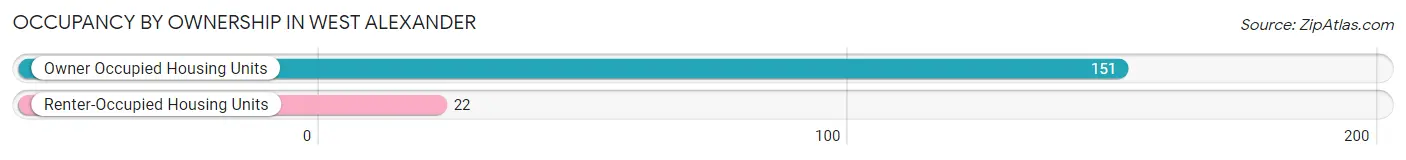
| Occupancy | # Housing Units | % Housing Units |
| Owner Occupied Housing Units | 151 | 87.3% |
| Renter-Occupied Housing Units | 22 | 12.7% |
| Total Occupied Housing Units | 173 | 100.0% |
Occupancy by Household Size in West Alexander
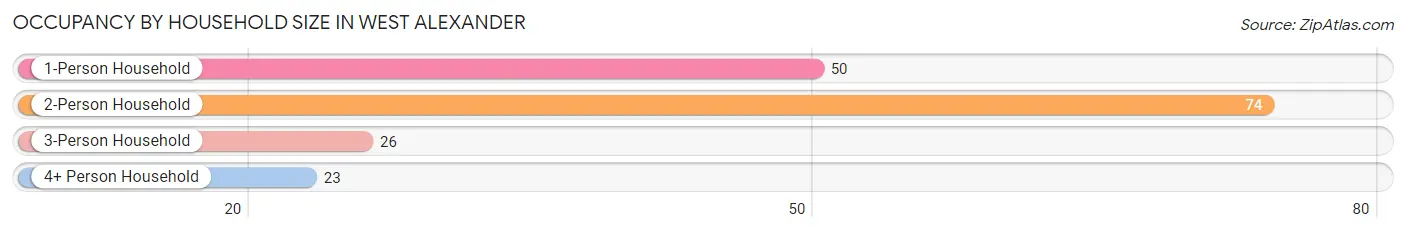
| Household Size | # Housing Units | % Housing Units |
| 1-Person Household | 50 | 28.9% |
| 2-Person Household | 74 | 42.8% |
| 3-Person Household | 26 | 15.0% |
| 4+ Person Household | 23 | 13.3% |
| Total Housing Units | 173 | 100.0% |
Occupancy by Ownership by Household Size in West Alexander
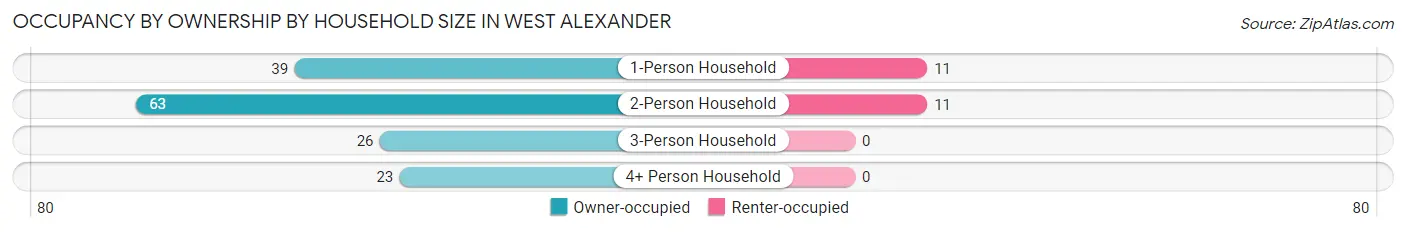
| Household Size | Owner-occupied | Renter-occupied |
| 1-Person Household | 39 (78.0%) | 11 (22.0%) |
| 2-Person Household | 63 (85.1%) | 11 (14.9%) |
| 3-Person Household | 26 (100.0%) | 0 (0.0%) |
| 4+ Person Household | 23 (100.0%) | 0 (0.0%) |
| Total Housing Units | 151 (87.3%) | 22 (12.7%) |
Occupancy by Educational Attainment in West Alexander
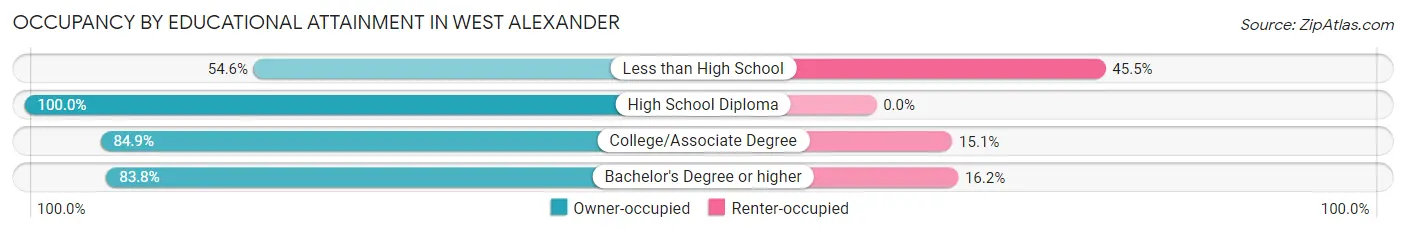
| Household Size | Owner-occupied | Renter-occupied |
| Less than High School | 6 (54.5%) | 5 (45.5%) |
| High School Diploma | 52 (100.0%) | 0 (0.0%) |
| College/Associate Degree | 62 (84.9%) | 11 (15.1%) |
| Bachelor's Degree or higher | 31 (83.8%) | 6 (16.2%) |
Occupancy by Age of Householder in West Alexander
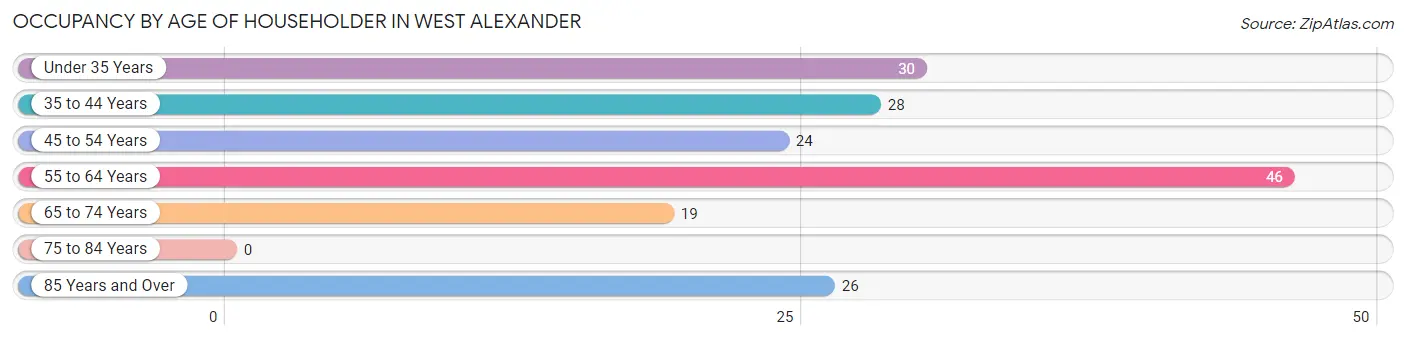
| Age Bracket | # Households | % Households |
| Under 35 Years | 30 | 17.3% |
| 35 to 44 Years | 28 | 16.2% |
| 45 to 54 Years | 24 | 13.9% |
| 55 to 64 Years | 46 | 26.6% |
| 65 to 74 Years | 19 | 11.0% |
| 75 to 84 Years | 0 | 0.0% |
| 85 Years and Over | 26 | 15.0% |
| Total | 173 | 100.0% |
Housing Finances in West Alexander
Median Income by Occupancy in West Alexander
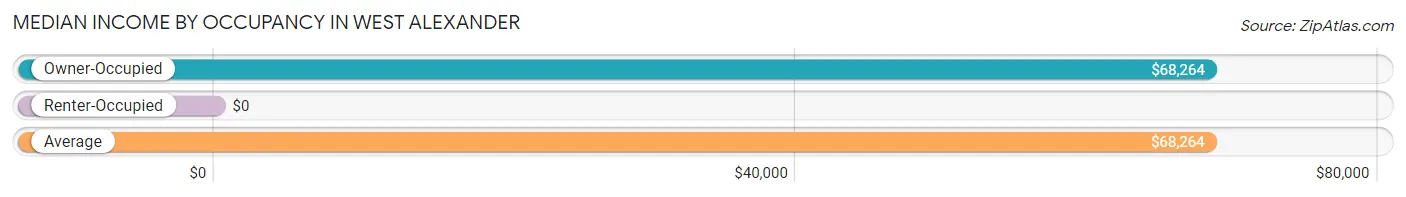
| Occupancy Type | # Households | Median Income |
| Owner-Occupied | 151 (87.3%) | $68,264 |
| Renter-Occupied | 22 (12.7%) | $0 |
| Average | 173 (100.0%) | $68,264 |
Occupancy by Householder Income Bracket in West Alexander
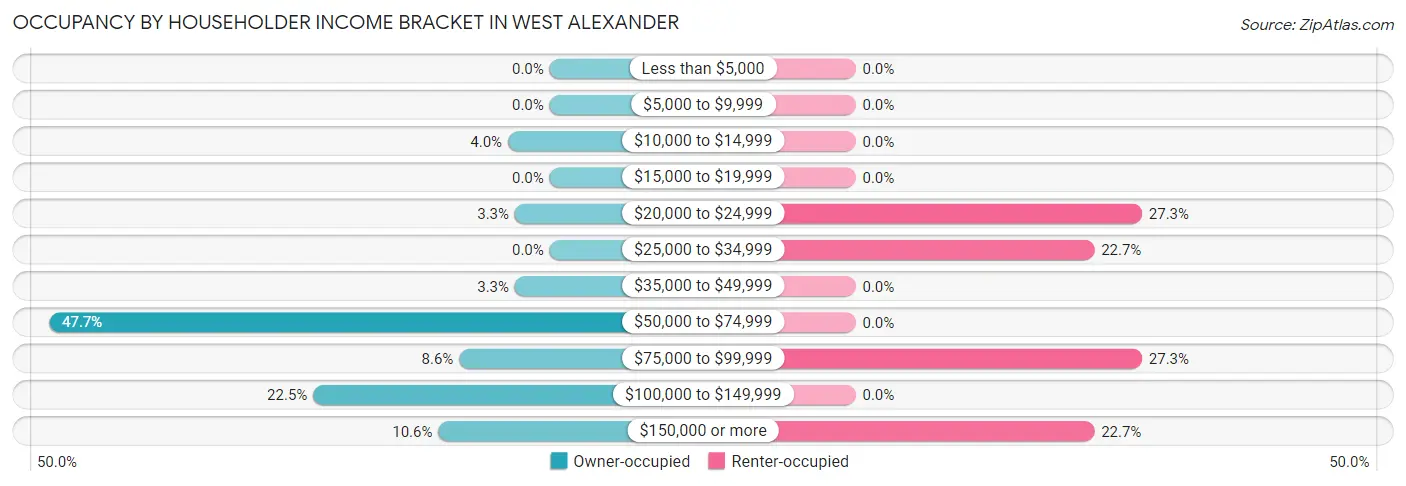
| Income Bracket | Owner-occupied | Renter-occupied |
| Less than $5,000 | 0 (0.0%) | 0 (0.0%) |
| $5,000 to $9,999 | 0 (0.0%) | 0 (0.0%) |
| $10,000 to $14,999 | 6 (4.0%) | 0 (0.0%) |
| $15,000 to $19,999 | 0 (0.0%) | 0 (0.0%) |
| $20,000 to $24,999 | 5 (3.3%) | 6 (27.3%) |
| $25,000 to $34,999 | 0 (0.0%) | 5 (22.7%) |
| $35,000 to $49,999 | 5 (3.3%) | 0 (0.0%) |
| $50,000 to $74,999 | 72 (47.7%) | 0 (0.0%) |
| $75,000 to $99,999 | 13 (8.6%) | 6 (27.3%) |
| $100,000 to $149,999 | 34 (22.5%) | 0 (0.0%) |
| $150,000 or more | 16 (10.6%) | 5 (22.7%) |
| Total | 151 (100.0%) | 22 (100.0%) |
Monthly Housing Cost Tiers in West Alexander
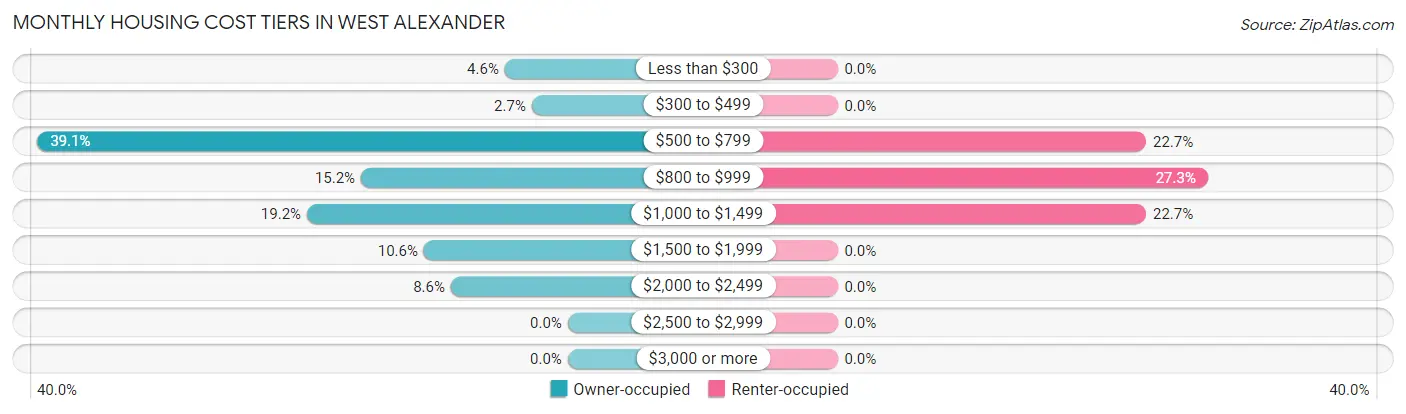
| Monthly Cost | Owner-occupied | Renter-occupied |
| Less than $300 | 7 (4.6%) | 0 (0.0%) |
| $300 to $499 | 4 (2.6%) | 0 (0.0%) |
| $500 to $799 | 59 (39.1%) | 5 (22.7%) |
| $800 to $999 | 23 (15.2%) | 6 (27.3%) |
| $1,000 to $1,499 | 29 (19.2%) | 5 (22.7%) |
| $1,500 to $1,999 | 16 (10.6%) | 0 (0.0%) |
| $2,000 to $2,499 | 13 (8.6%) | 0 (0.0%) |
| $2,500 to $2,999 | 0 (0.0%) | 0 (0.0%) |
| $3,000 or more | 0 (0.0%) | 0 (0.0%) |
| Total | 151 (100.0%) | 22 (100.0%) |
Physical Housing Characteristics in West Alexander
Housing Structures in West Alexander
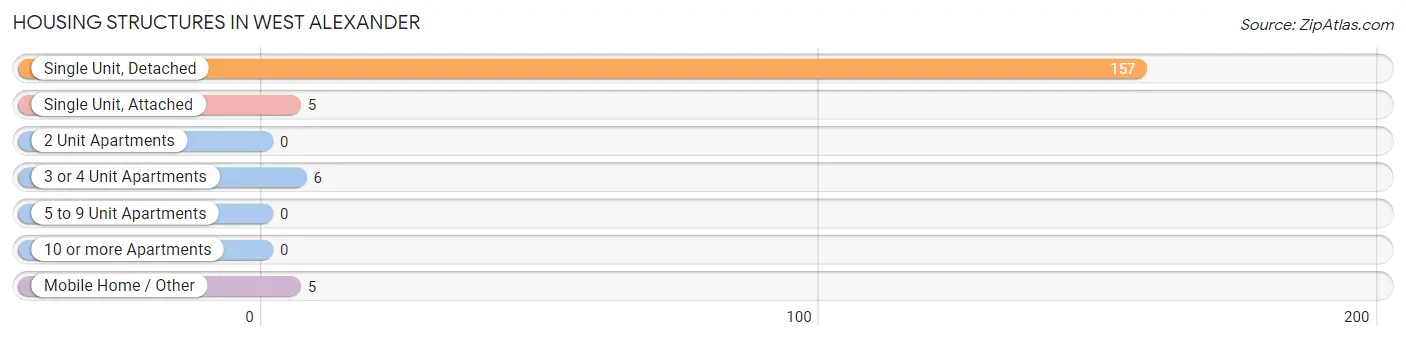
| Structure Type | # Housing Units | % Housing Units |
| Single Unit, Detached | 157 | 90.7% |
| Single Unit, Attached | 5 | 2.9% |
| 2 Unit Apartments | 0 | 0.0% |
| 3 or 4 Unit Apartments | 6 | 3.5% |
| 5 to 9 Unit Apartments | 0 | 0.0% |
| 10 or more Apartments | 0 | 0.0% |
| Mobile Home / Other | 5 | 2.9% |
| Total | 173 | 100.0% |
Housing Structures by Occupancy in West Alexander
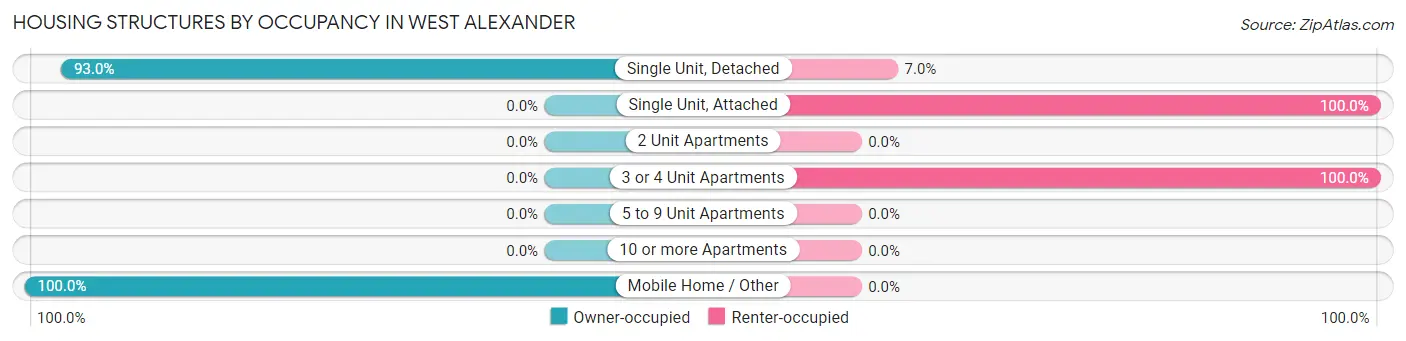
| Structure Type | Owner-occupied | Renter-occupied |
| Single Unit, Detached | 146 (93.0%) | 11 (7.0%) |
| Single Unit, Attached | 0 (0.0%) | 5 (100.0%) |
| 2 Unit Apartments | 0 (0.0%) | 0 (0.0%) |
| 3 or 4 Unit Apartments | 0 (0.0%) | 6 (100.0%) |
| 5 to 9 Unit Apartments | 0 (0.0%) | 0 (0.0%) |
| 10 or more Apartments | 0 (0.0%) | 0 (0.0%) |
| Mobile Home / Other | 5 (100.0%) | 0 (0.0%) |
| Total | 151 (87.3%) | 22 (12.7%) |
Housing Structures by Number of Rooms in West Alexander
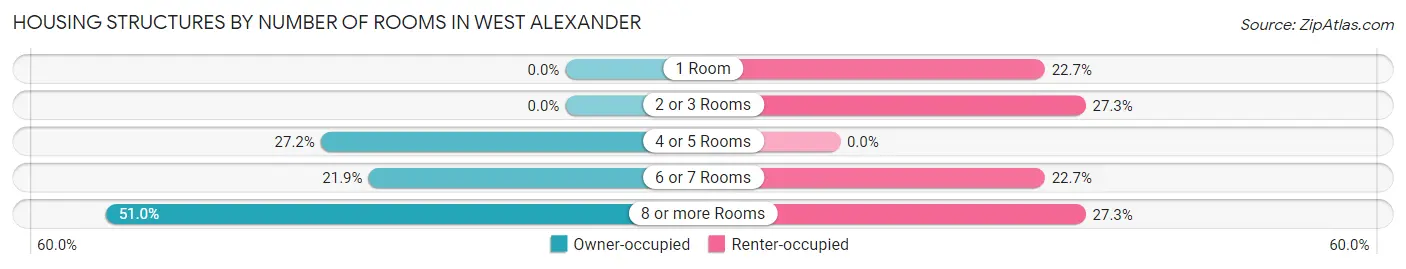
| Number of Rooms | Owner-occupied | Renter-occupied |
| 1 Room | 0 (0.0%) | 5 (22.7%) |
| 2 or 3 Rooms | 0 (0.0%) | 6 (27.3%) |
| 4 or 5 Rooms | 41 (27.2%) | 0 (0.0%) |
| 6 or 7 Rooms | 33 (21.8%) | 5 (22.7%) |
| 8 or more Rooms | 77 (51.0%) | 6 (27.3%) |
| Total | 151 (100.0%) | 22 (100.0%) |
Housing Structure by Heating Type in West Alexander
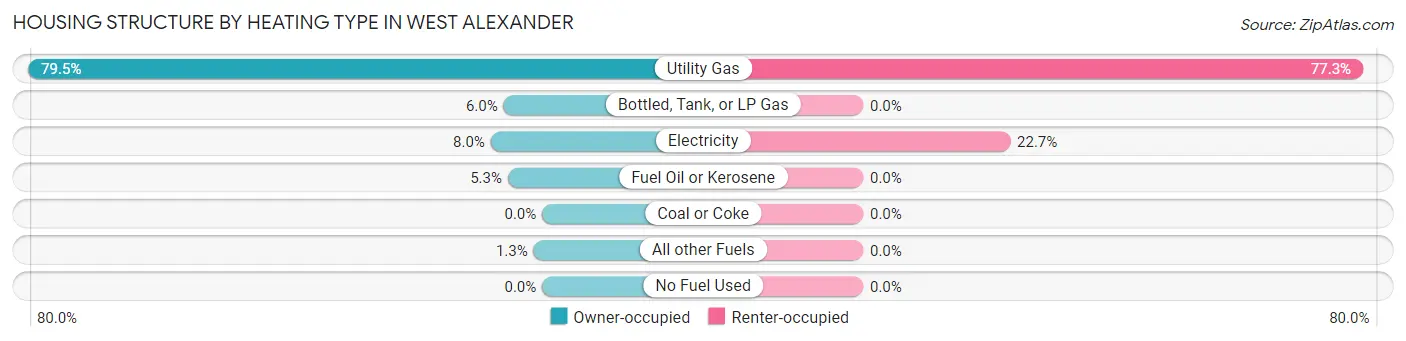
| Heating Type | Owner-occupied | Renter-occupied |
| Utility Gas | 120 (79.5%) | 17 (77.3%) |
| Bottled, Tank, or LP Gas | 9 (6.0%) | 0 (0.0%) |
| Electricity | 12 (8.0%) | 5 (22.7%) |
| Fuel Oil or Kerosene | 8 (5.3%) | 0 (0.0%) |
| Coal or Coke | 0 (0.0%) | 0 (0.0%) |
| All other Fuels | 2 (1.3%) | 0 (0.0%) |
| No Fuel Used | 0 (0.0%) | 0 (0.0%) |
| Total | 151 (100.0%) | 22 (100.0%) |
Household Vehicle Usage in West Alexander
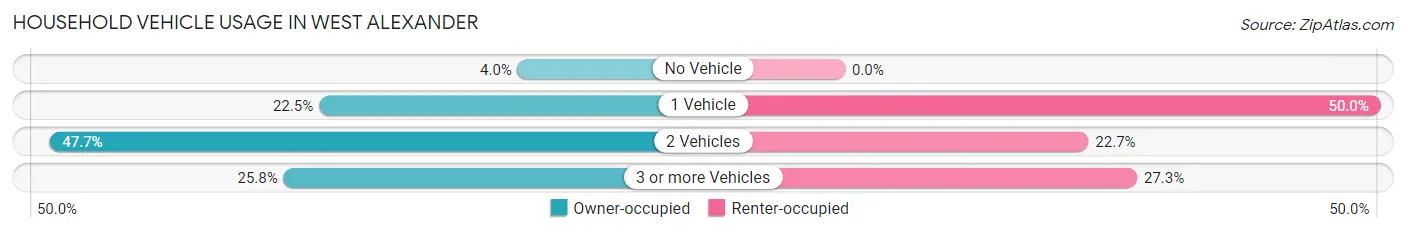
| Vehicles per Household | Owner-occupied | Renter-occupied |
| No Vehicle | 6 (4.0%) | 0 (0.0%) |
| 1 Vehicle | 34 (22.5%) | 11 (50.0%) |
| 2 Vehicles | 72 (47.7%) | 5 (22.7%) |
| 3 or more Vehicles | 39 (25.8%) | 6 (27.3%) |
| Total | 151 (100.0%) | 22 (100.0%) |
Real Estate & Mortgages in West Alexander
Real Estate and Mortgage Overview in West Alexander
| Characteristic | Without Mortgage | With Mortgage |
| Housing Units | 64 | 87 |
| Median Property Value | $120,400 | $144,100 |
| Median Household Income | $60,278 | $16 |
| Monthly Housing Costs | $560 | $0 |
| Real Estate Taxes | - | - |
Property Value by Mortgage Status in West Alexander
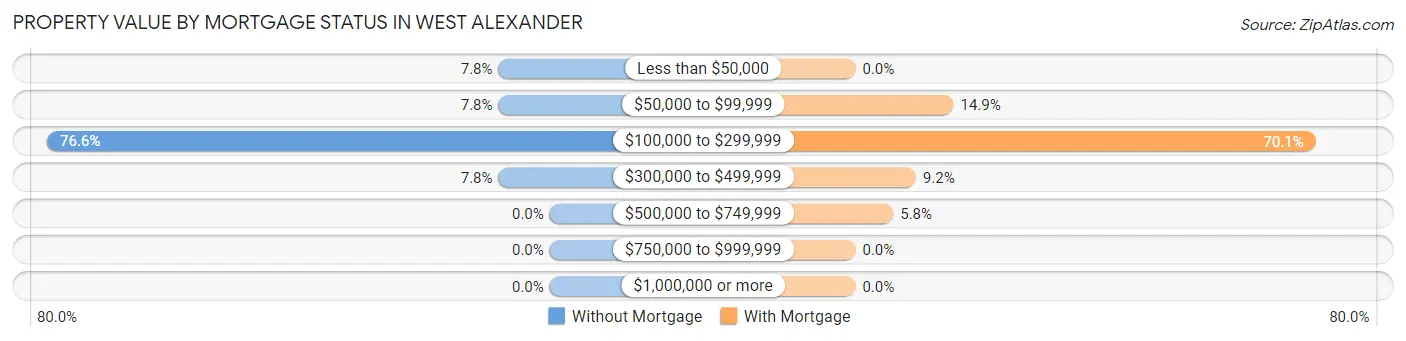
| Property Value | Without Mortgage | With Mortgage |
| Less than $50,000 | 5 (7.8%) | 0 (0.0%) |
| $50,000 to $99,999 | 5 (7.8%) | 13 (14.9%) |
| $100,000 to $299,999 | 49 (76.6%) | 61 (70.1%) |
| $300,000 to $499,999 | 5 (7.8%) | 8 (9.2%) |
| $500,000 to $749,999 | 0 (0.0%) | 5 (5.8%) |
| $750,000 to $999,999 | 0 (0.0%) | 0 (0.0%) |
| $1,000,000 or more | 0 (0.0%) | 0 (0.0%) |
| Total | 64 (100.0%) | 87 (100.0%) |
Household Income by Mortgage Status in West Alexander
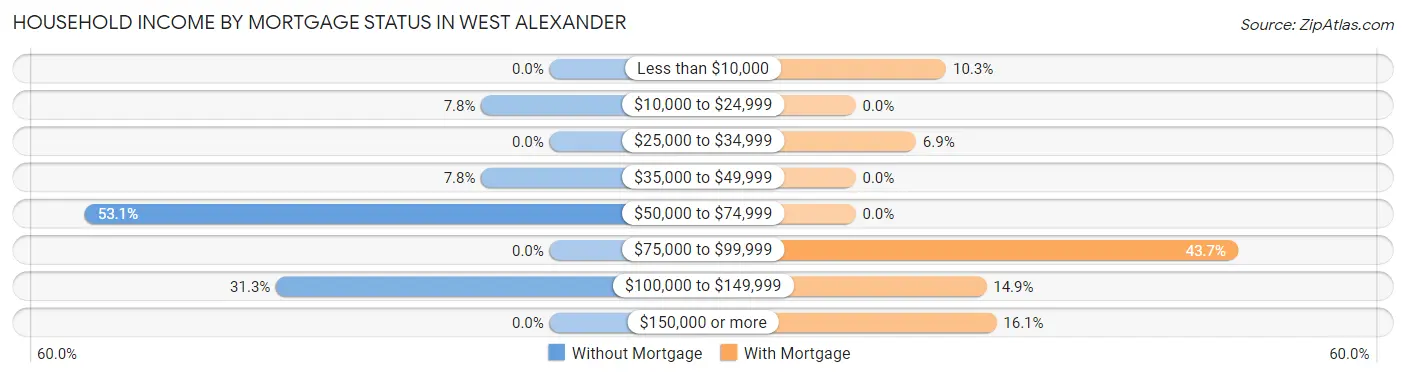
| Household Income | Without Mortgage | With Mortgage |
| Less than $10,000 | 0 (0.0%) | 9 (10.3%) |
| $10,000 to $24,999 | 5 (7.8%) | 0 (0.0%) |
| $25,000 to $34,999 | 0 (0.0%) | 6 (6.9%) |
| $35,000 to $49,999 | 5 (7.8%) | 0 (0.0%) |
| $50,000 to $74,999 | 34 (53.1%) | 0 (0.0%) |
| $75,000 to $99,999 | 0 (0.0%) | 38 (43.7%) |
| $100,000 to $149,999 | 20 (31.2%) | 13 (14.9%) |
| $150,000 or more | 0 (0.0%) | 14 (16.1%) |
| Total | 64 (100.0%) | 87 (100.0%) |
Property Value to Household Income Ratio in West Alexander
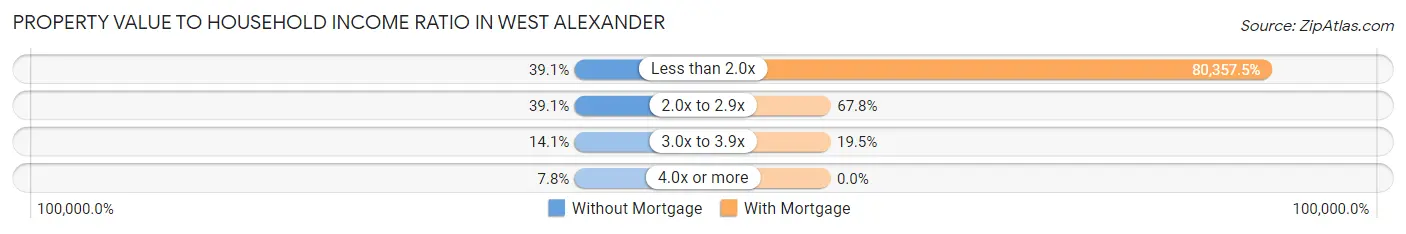
| Value-to-Income Ratio | Without Mortgage | With Mortgage |
| Less than 2.0x | 25 (39.1%) | 69,911 (80,357.5%) |
| 2.0x to 2.9x | 25 (39.1%) | 59 (67.8%) |
| 3.0x to 3.9x | 9 (14.1%) | 17 (19.5%) |
| 4.0x or more | 5 (7.8%) | 0 (0.0%) |
| Total | 64 (100.0%) | 87 (100.0%) |
Real Estate Taxes by Mortgage Status in West Alexander
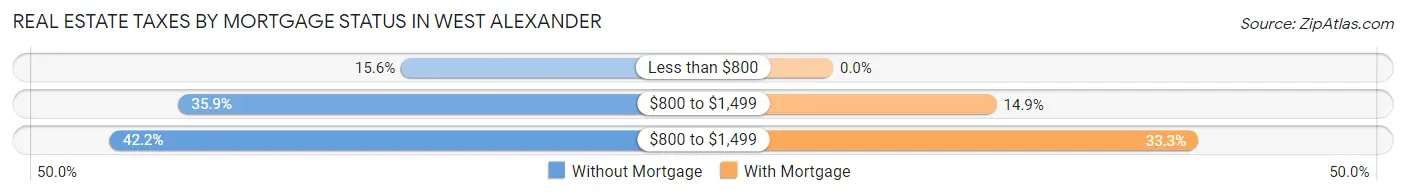
| Property Taxes | Without Mortgage | With Mortgage |
| Less than $800 | 10 (15.6%) | 0 (0.0%) |
| $800 to $1,499 | 23 (35.9%) | 13 (14.9%) |
| $800 to $1,499 | 27 (42.2%) | 29 (33.3%) |
| Total | 64 (100.0%) | 87 (100.0%) |
Health & Disability in West Alexander
Health Insurance Coverage by Age in West Alexander
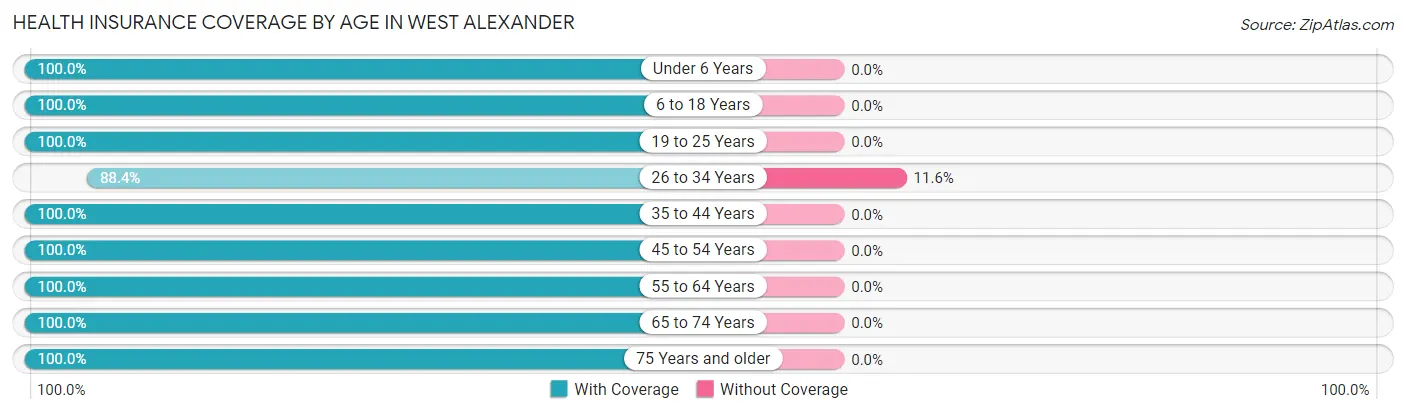
| Age Bracket | With Coverage | Without Coverage |
| Under 6 Years | 7 (100.0%) | 0 (0.0%) |
| 6 to 18 Years | 80 (100.0%) | 0 (0.0%) |
| 19 to 25 Years | 19 (100.0%) | 0 (0.0%) |
| 26 to 34 Years | 38 (88.4%) | 5 (11.6%) |
| 35 to 44 Years | 47 (100.0%) | 0 (0.0%) |
| 45 to 54 Years | 72 (100.0%) | 0 (0.0%) |
| 55 to 64 Years | 77 (100.0%) | 0 (0.0%) |
| 65 to 74 Years | 38 (100.0%) | 0 (0.0%) |
| 75 Years and older | 37 (100.0%) | 0 (0.0%) |
| Total | 415 (98.8%) | 5 (1.2%) |
Health Insurance Coverage by Citizenship Status in West Alexander
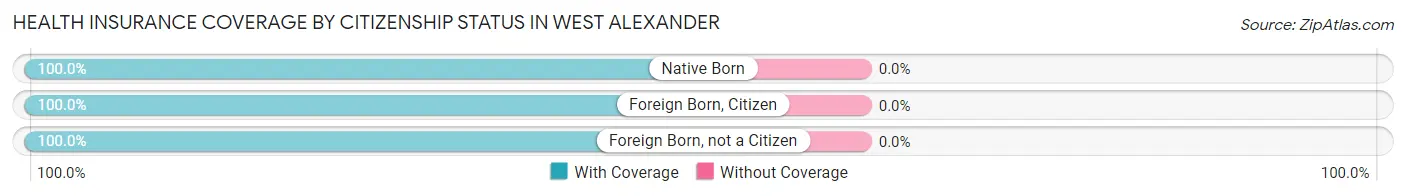
| Citizenship Status | With Coverage | Without Coverage |
| Native Born | 7 (100.0%) | 0 (0.0%) |
| Foreign Born, Citizen | 80 (100.0%) | 0 (0.0%) |
| Foreign Born, not a Citizen | 19 (100.0%) | 0 (0.0%) |
Health Insurance Coverage by Household Income in West Alexander
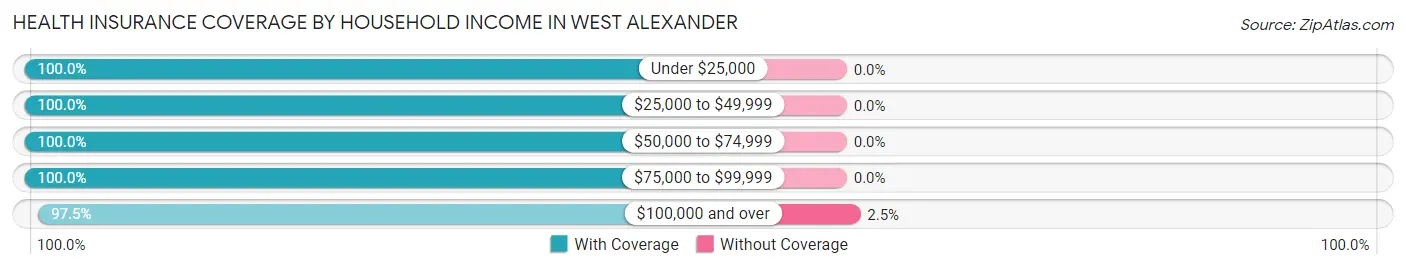
| Household Income | With Coverage | Without Coverage |
| Under $25,000 | 28 (100.0%) | 0 (0.0%) |
| $25,000 to $49,999 | 16 (100.0%) | 0 (0.0%) |
| $50,000 to $74,999 | 155 (100.0%) | 0 (0.0%) |
| $75,000 to $99,999 | 24 (100.0%) | 0 (0.0%) |
| $100,000 and over | 192 (97.5%) | 5 (2.5%) |
Public vs Private Health Insurance Coverage by Age in West Alexander
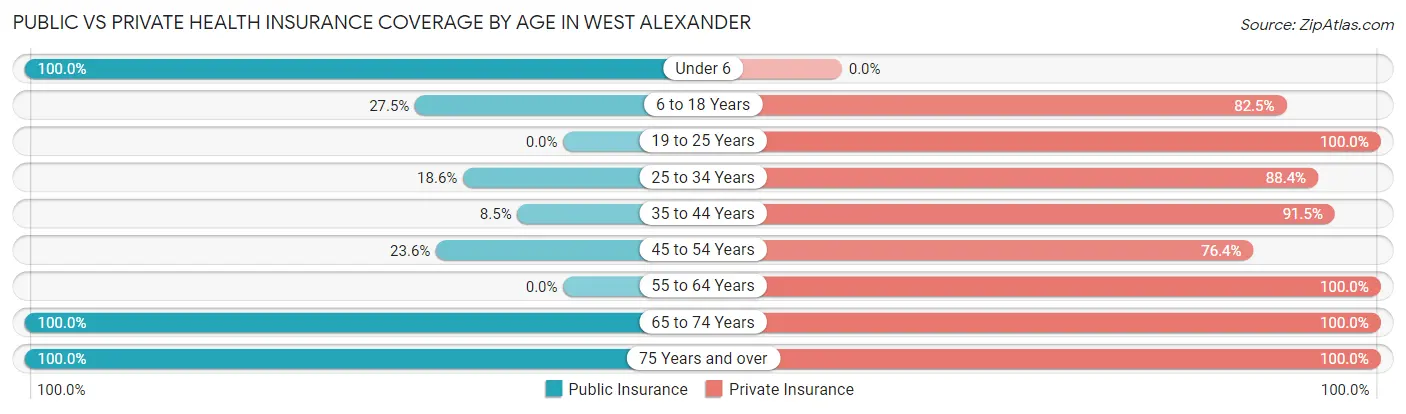
| Age Bracket | Public Insurance | Private Insurance |
| Under 6 | 7 (100.0%) | 0 (0.0%) |
| 6 to 18 Years | 22 (27.5%) | 66 (82.5%) |
| 19 to 25 Years | 0 (0.0%) | 19 (100.0%) |
| 25 to 34 Years | 8 (18.6%) | 38 (88.4%) |
| 35 to 44 Years | 4 (8.5%) | 43 (91.5%) |
| 45 to 54 Years | 17 (23.6%) | 55 (76.4%) |
| 55 to 64 Years | 0 (0.0%) | 77 (100.0%) |
| 65 to 74 Years | 38 (100.0%) | 38 (100.0%) |
| 75 Years and over | 37 (100.0%) | 37 (100.0%) |
| Total | 133 (31.7%) | 373 (88.8%) |
Disability Status by Sex by Age in West Alexander
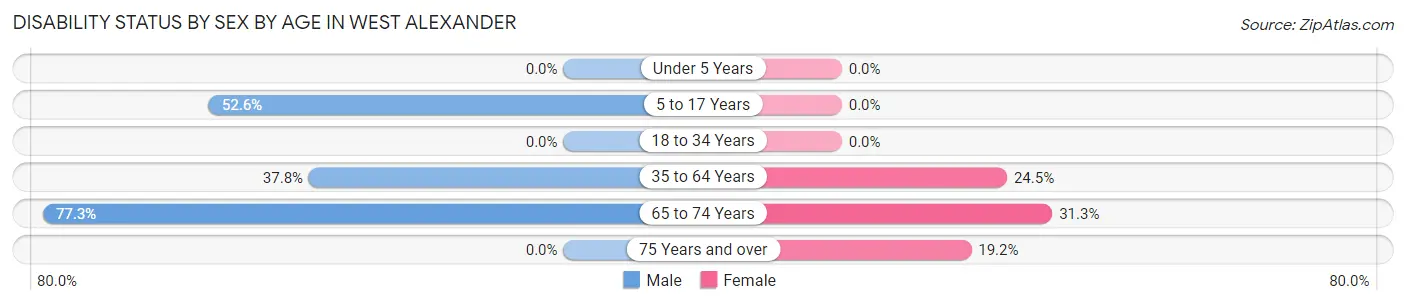
| Age Bracket | Male | Female |
| Under 5 Years | 0 (0.0%) | 0 (0.0%) |
| 5 to 17 Years | 20 (52.6%) | 0 (0.0%) |
| 18 to 34 Years | 0 (0.0%) | 0 (0.0%) |
| 35 to 64 Years | 34 (37.8%) | 26 (24.5%) |
| 65 to 74 Years | 17 (77.3%) | 5 (31.2%) |
| 75 Years and over | 0 (0.0%) | 5 (19.2%) |
Disability Class by Sex by Age in West Alexander
Disability Class: Hearing Difficulty
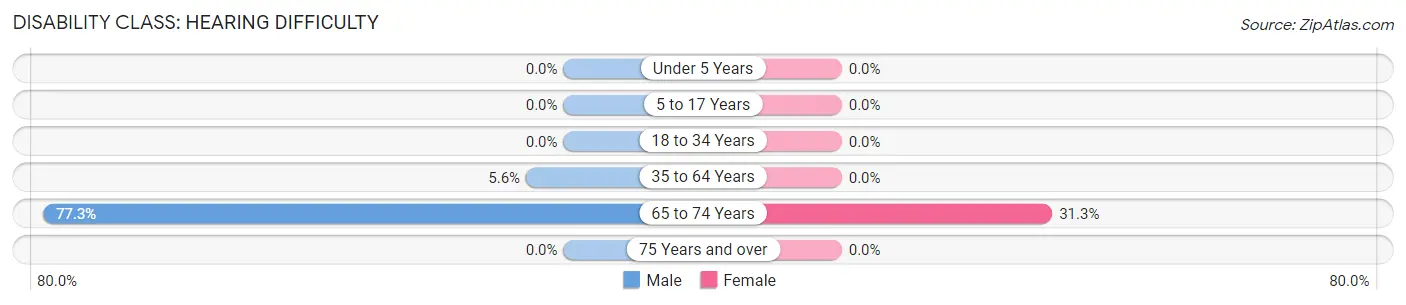
| Age Bracket | Male | Female |
| Under 5 Years | 0 (0.0%) | 0 (0.0%) |
| 5 to 17 Years | 0 (0.0%) | 0 (0.0%) |
| 18 to 34 Years | 0 (0.0%) | 0 (0.0%) |
| 35 to 64 Years | 5 (5.6%) | 0 (0.0%) |
| 65 to 74 Years | 17 (77.3%) | 5 (31.2%) |
| 75 Years and over | 0 (0.0%) | 0 (0.0%) |
Disability Class: Vision Difficulty
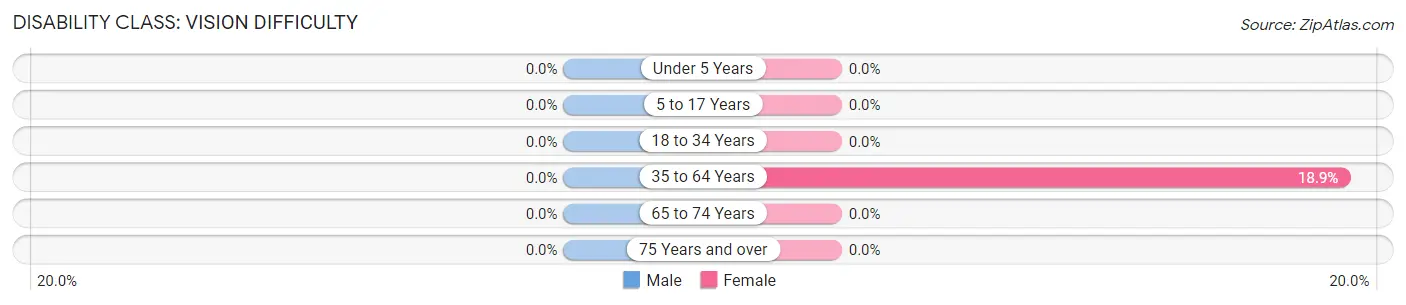
| Age Bracket | Male | Female |
| Under 5 Years | 0 (0.0%) | 0 (0.0%) |
| 5 to 17 Years | 0 (0.0%) | 0 (0.0%) |
| 18 to 34 Years | 0 (0.0%) | 0 (0.0%) |
| 35 to 64 Years | 0 (0.0%) | 20 (18.9%) |
| 65 to 74 Years | 0 (0.0%) | 0 (0.0%) |
| 75 Years and over | 0 (0.0%) | 0 (0.0%) |
Disability Class: Cognitive Difficulty
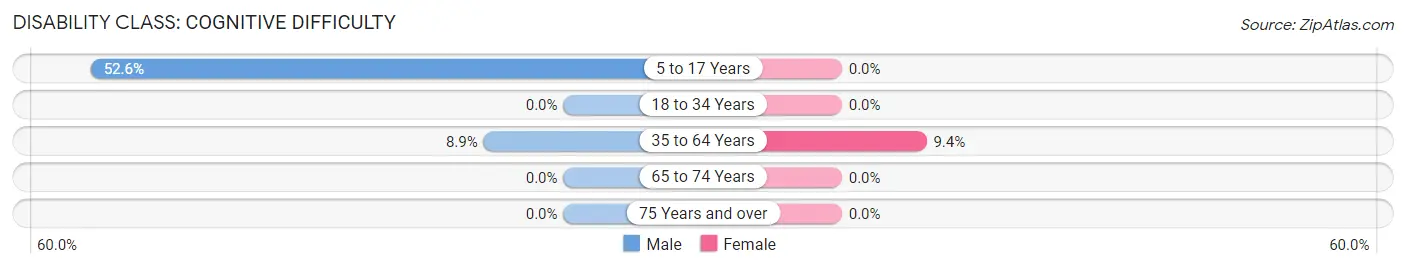
| Age Bracket | Male | Female |
| 5 to 17 Years | 20 (52.6%) | 0 (0.0%) |
| 18 to 34 Years | 0 (0.0%) | 0 (0.0%) |
| 35 to 64 Years | 8 (8.9%) | 10 (9.4%) |
| 65 to 74 Years | 0 (0.0%) | 0 (0.0%) |
| 75 Years and over | 0 (0.0%) | 0 (0.0%) |
Disability Class: Ambulatory Difficulty
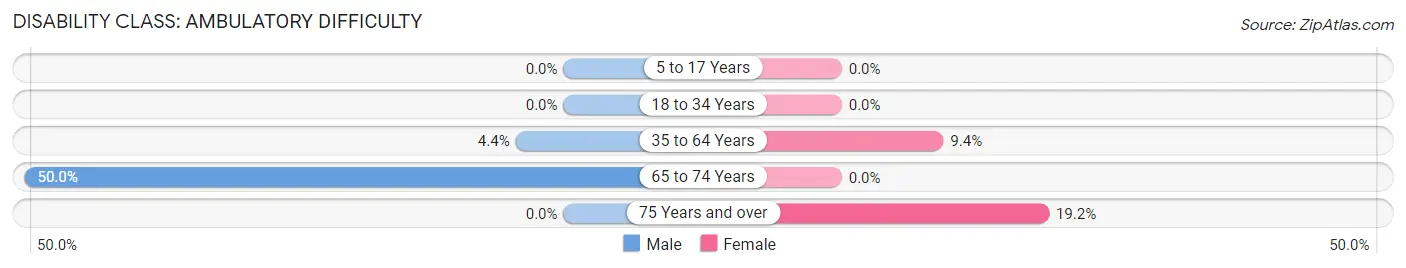
| Age Bracket | Male | Female |
| 5 to 17 Years | 0 (0.0%) | 0 (0.0%) |
| 18 to 34 Years | 0 (0.0%) | 0 (0.0%) |
| 35 to 64 Years | 4 (4.4%) | 10 (9.4%) |
| 65 to 74 Years | 11 (50.0%) | 0 (0.0%) |
| 75 Years and over | 0 (0.0%) | 5 (19.2%) |
Disability Class: Self-Care Difficulty
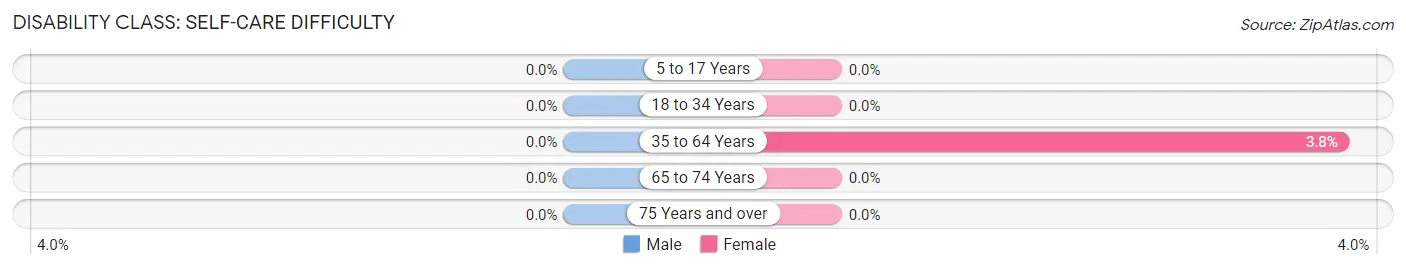
| Age Bracket | Male | Female |
| 5 to 17 Years | 0 (0.0%) | 0 (0.0%) |
| 18 to 34 Years | 0 (0.0%) | 0 (0.0%) |
| 35 to 64 Years | 0 (0.0%) | 4 (3.8%) |
| 65 to 74 Years | 0 (0.0%) | 0 (0.0%) |
| 75 Years and over | 0 (0.0%) | 0 (0.0%) |
Technology Access in West Alexander
Computing Device Access in West Alexander
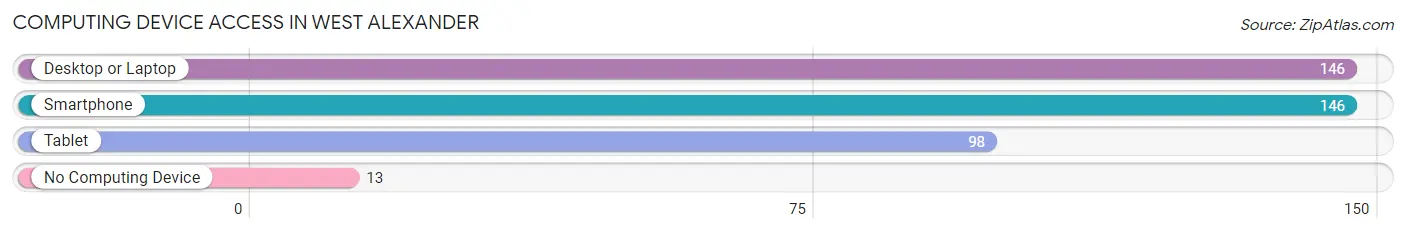
| Device Type | # Households | % Households |
| Desktop or Laptop | 146 | 84.4% |
| Smartphone | 146 | 84.4% |
| Tablet | 98 | 56.7% |
| No Computing Device | 13 | 7.5% |
| Total | 173 | 100.0% |
Internet Access in West Alexander
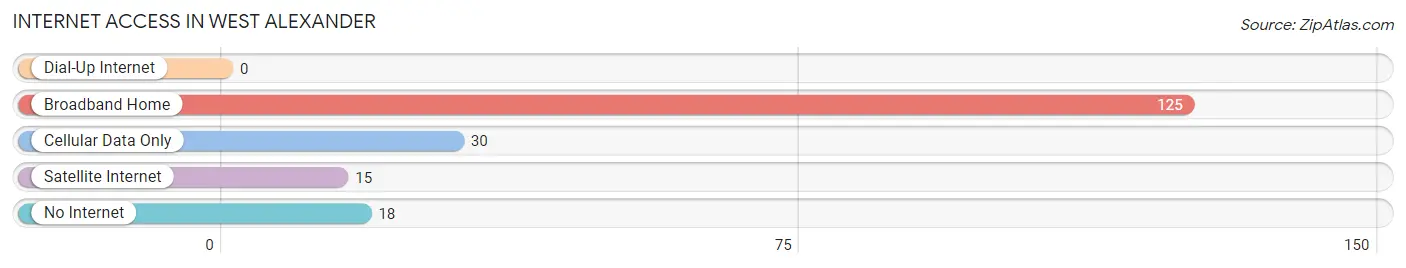
| Internet Type | # Households | % Households |
| Dial-Up Internet | 0 | 0.0% |
| Broadband Home | 125 | 72.3% |
| Cellular Data Only | 30 | 17.3% |
| Satellite Internet | 15 | 8.7% |
| No Internet | 18 | 10.4% |
| Total | 173 | 100.0% |
West Alexander Summary
History
West Alexander is a small borough located in Washington County, Pennsylvania. It is situated in the southwestern corner of the state, approximately 30 miles south of Pittsburgh. The borough was founded in 1832 and was originally known as West Liberty. The name was changed to West Alexander in 1845 in honor of Alexander McClelland, a local landowner and prominent figure in the area.
The area was first settled in the late 1700s by a group of Scots-Irish immigrants who had migrated from the north of Ireland. These settlers were attracted to the area due to its fertile soil and abundant natural resources. The first industry in the area was a grist mill, which was built in 1810. This mill was the first of many businesses that would be established in the area over the next century.
In the late 1800s, the area experienced a period of rapid growth and development. The population increased from just over 500 in 1880 to nearly 1,500 by 1900. This growth was largely due to the development of the coal and oil industries in the area. The coal industry was particularly important, as it provided employment for many of the area’s residents.
Geography
West Alexander is located in the southwestern corner of Washington County, Pennsylvania. It is situated in the Appalachian Plateau region of the state, which is characterized by rolling hills and valleys. The borough is located approximately 30 miles south of Pittsburgh and is bordered by the towns of Claysville, West Finley, and East Finley.
The borough is situated on the banks of the Monongahela River, which provides a natural boundary between West Alexander and the neighboring towns. The borough is also home to several small creeks and streams, including the West Fork of the Little Beaver Creek and the East Fork of the Little Beaver Creek.
The climate in West Alexander is typical of the Appalachian Plateau region, with cold winters and hot, humid summers. The average annual temperature is around 50 degrees Fahrenheit, with an average high of around 70 degrees in the summer and an average low of around 30 degrees in the winter.
Economy
The economy of West Alexander is largely based on agriculture and natural resources. The area is home to several farms, which produce a variety of crops, including corn, soybeans, wheat, and hay. The borough is also home to several oil and gas wells, which provide employment for many of the area’s residents.
In addition to agriculture and natural resources, West Alexander is home to several small businesses, including restaurants, retail stores, and service providers. The borough is also home to a small industrial park, which houses several manufacturing and distribution companies.
Demographics
As of the 2010 census, the population of West Alexander was 1,845. The racial makeup of the borough was 97.3% White, 0.9% African American, 0.2% Native American, 0.3% Asian, and 1.3% from other races. The median household income was $41,250, and the median family income was $50,000.
The population of West Alexander is largely rural, with most of the borough’s residents living in small towns and villages. The largest town in the borough is West Alexander, which has a population of 1,072. The other towns in the borough are Claysville, West Finley, and East Finley.
Common Questions
What is Per Capita Income in West Alexander?
Per Capita income in West Alexander is $36,977.
What is the Median Family Income in West Alexander?
Median Family Income in West Alexander is $69,904.
What is the Median Household income in West Alexander?
Median Household Income in West Alexander is $68,264.
What is Income or Wage Gap in West Alexander?
Income or Wage Gap in West Alexander is 41.8%.
Women in West Alexander earn 58.2 cents for every dollar earned by a man.
What is Inequality or Gini Index in West Alexander?
Inequality or Gini Index in West Alexander is 0.33.
What is the Total Population of West Alexander?
Total Population of West Alexander is 420.
What is the Total Male Population of West Alexander?
Total Male Population of West Alexander is 210.
What is the Total Female Population of West Alexander?
Total Female Population of West Alexander is 210.
What is the Ratio of Males per 100 Females in West Alexander?
There are 100.00 Males per 100 Females in West Alexander.
What is the Ratio of Females per 100 Males in West Alexander?
There are 100.00 Females per 100 Males in West Alexander.
What is the Median Population Age in West Alexander?
Median Population Age in West Alexander is 49.4 Years.
What is the Average Family Size in West Alexander
Average Family Size in West Alexander is 3.0 People.
What is the Average Household Size in West Alexander
Average Household Size in West Alexander is 2.4 People.
How Large is the Labor Force in West Alexander?
There are 250 People in the Labor Forcein in West Alexander.
What is the Percentage of People in the Labor Force in West Alexander?
67.4% of People are in the Labor Force in West Alexander.