Sewickley Hills borough, PA Map & Demographics
Sewickley Hills borough Overview
$81,576
PER CAPITA INCOME
$206,250
AVG FAMILY INCOME
$156,667
AVG HOUSEHOLD INCOME
20.5%
WAGE / INCOME GAP [ % ]
79.5¢/ $1
WAGE / INCOME GAP [ $ ]
0.45
INEQUALITY / GINI INDEX
697
TOTAL POPULATION
314
MALE POPULATION
383
FEMALE POPULATION
81.98
MALES / 100 FEMALES
121.97
FEMALES / 100 MALES
49.5
MEDIAN AGE
3.1
AVG FAMILY SIZE
2.6
AVG HOUSEHOLD SIZE
284
LABOR FORCE [ PEOPLE ]
51.6%
PERCENT IN LABOR FORCE
4.6%
UNEMPLOYMENT RATE
Income in Sewickley Hills borough
Income Overview in Sewickley Hills borough
Per Capita Income in Sewickley Hills borough is $81,576, while median incomes of families and households are $206,250 and $156,667 respectively.
| Characteristic | Number | Measure |
| Per Capita Income | 697 | $81,576 |
| Median Family Income | 204 | $206,250 |
| Mean Family Income | 204 | $247,853 |
| Median Household Income | 264 | $156,667 |
| Mean Household Income | 264 | $212,475 |
| Income Deficit | 204 | $0 |
| Wage / Income Gap (%) | 697 | 20.55% |
| Wage / Income Gap ($) | 697 | 79.45¢ per $1 |
| Gini / Inequality Index | 697 | 0.45 |
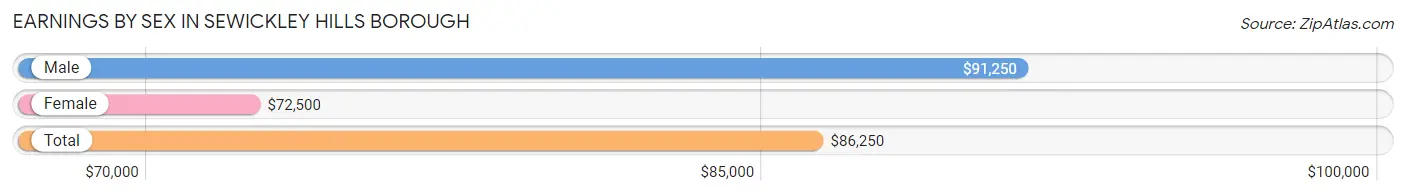
Earnings by Sex in Sewickley Hills borough
Average Earnings in Sewickley Hills borough are $86,250, $91,250 for men and $72,500 for women, a difference of 20.5%.
| Sex | Number | Average Earnings |
| Male | 168 (56.4%) | $91,250 |
| Female | 130 (43.6%) | $72,500 |
| Total | 298 (100.0%) | $86,250 |
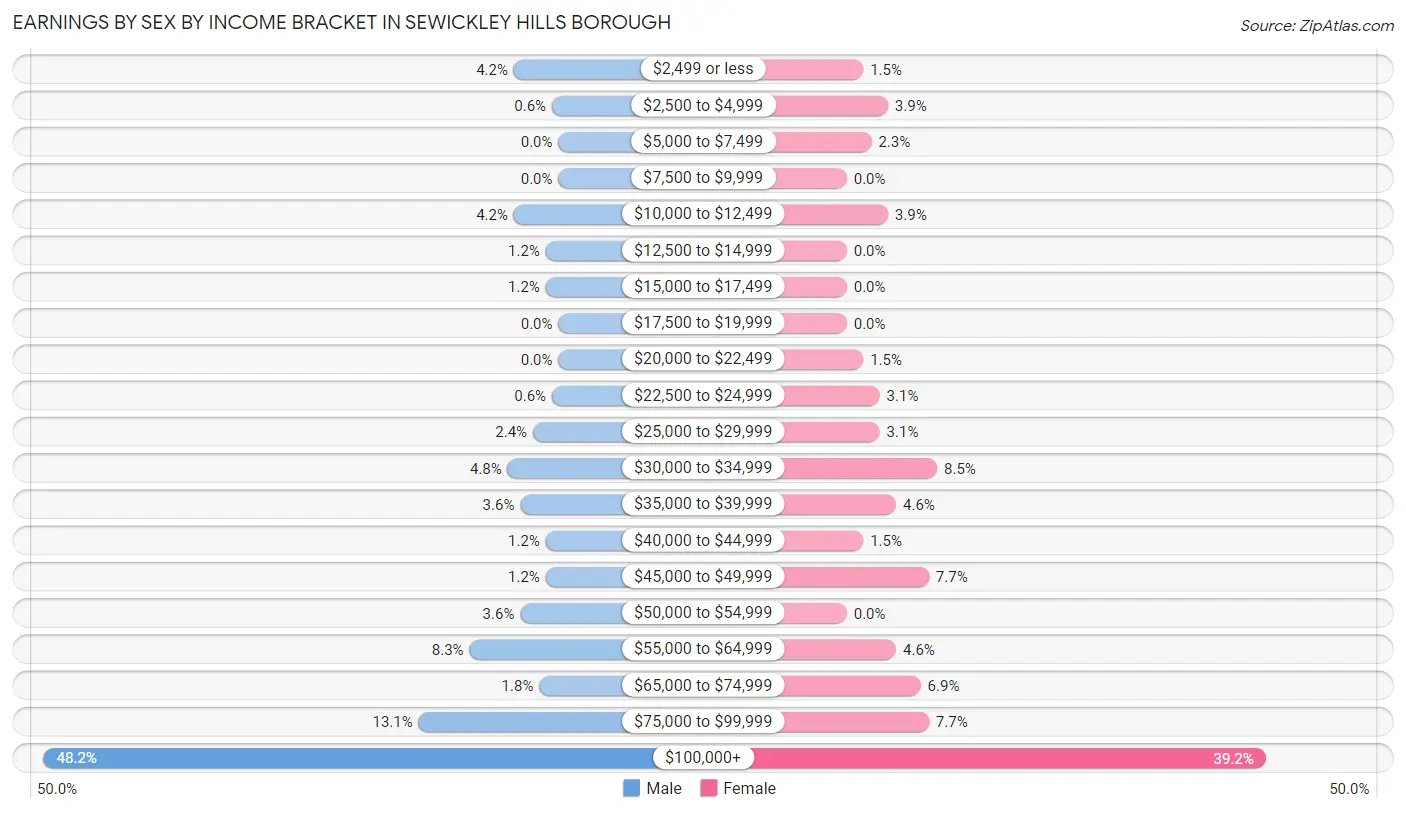
Earnings by Sex by Income Bracket in Sewickley Hills borough
The most common earnings brackets in Sewickley Hills borough are $100,000+ for men (81 | 48.2%) and $100,000+ for women (51 | 39.2%).
| Income | Male | Female |
| $2,499 or less | 7 (4.2%) | 2 (1.5%) |
| $2,500 to $4,999 | 1 (0.6%) | 5 (3.8%) |
| $5,000 to $7,499 | 0 (0.0%) | 3 (2.3%) |
| $7,500 to $9,999 | 0 (0.0%) | 0 (0.0%) |
| $10,000 to $12,499 | 7 (4.2%) | 5 (3.8%) |
| $12,500 to $14,999 | 2 (1.2%) | 0 (0.0%) |
| $15,000 to $17,499 | 2 (1.2%) | 0 (0.0%) |
| $17,500 to $19,999 | 0 (0.0%) | 0 (0.0%) |
| $20,000 to $22,499 | 0 (0.0%) | 2 (1.5%) |
| $22,500 to $24,999 | 1 (0.6%) | 4 (3.1%) |
| $25,000 to $29,999 | 4 (2.4%) | 4 (3.1%) |
| $30,000 to $34,999 | 8 (4.8%) | 11 (8.5%) |
| $35,000 to $39,999 | 6 (3.6%) | 6 (4.6%) |
| $40,000 to $44,999 | 2 (1.2%) | 2 (1.5%) |
| $45,000 to $49,999 | 2 (1.2%) | 10 (7.7%) |
| $50,000 to $54,999 | 6 (3.6%) | 0 (0.0%) |
| $55,000 to $64,999 | 14 (8.3%) | 6 (4.6%) |
| $65,000 to $74,999 | 3 (1.8%) | 9 (6.9%) |
| $75,000 to $99,999 | 22 (13.1%) | 10 (7.7%) |
| $100,000+ | 81 (48.2%) | 51 (39.2%) |
| Total | 168 (100.0%) | 130 (100.0%) |
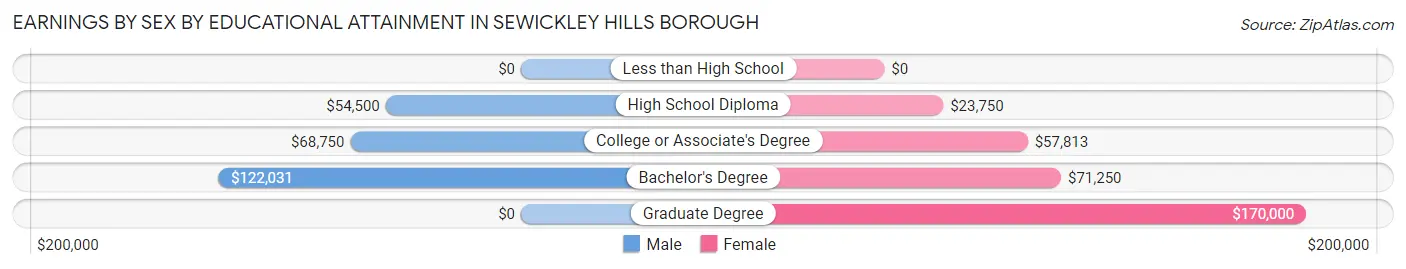
Earnings by Sex by Educational Attainment in Sewickley Hills borough
Average earnings in Sewickley Hills borough are $104,063 for men and $74,063 for women, a difference of 28.8%. Men with an educational attainment of bachelor's degree enjoy the highest average annual earnings of $122,031, while those with high school diploma education earn the least with $54,500. Women with an educational attainment of graduate degree earn the most with the average annual earnings of $170,000, while those with high school diploma education have the smallest earnings of $23,750.
| Educational Attainment | Male Income | Female Income |
| Less than High School | - | - |
| High School Diploma | $54,500 | $23,750 |
| College or Associate's Degree | $68,750 | $57,813 |
| Bachelor's Degree | $122,031 | $71,250 |
| Graduate Degree | - | - |
| Total | $104,063 | $74,063 |
Family Income in Sewickley Hills borough
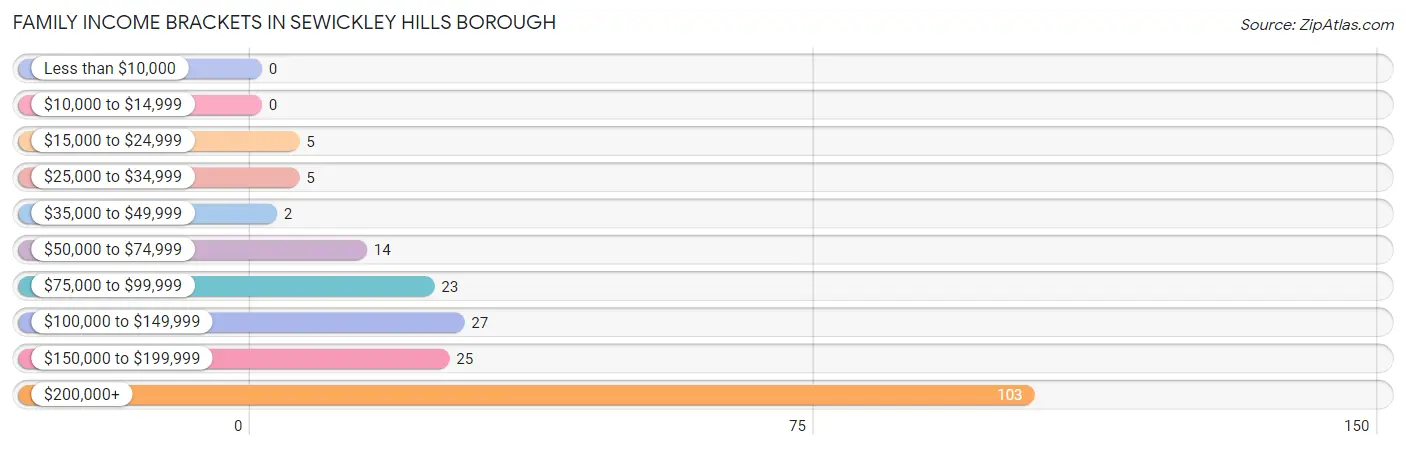
Family Income Brackets in Sewickley Hills borough
According to the Sewickley Hills borough family income data, there are 103 families falling into the $200,000+ income range, which is the most common income bracket and makes up 50.5% of all families.
| Income Bracket | # Families | % Families |
| Less than $10,000 | 0 | 0.0% |
| $10,000 to $14,999 | 0 | 0.0% |
| $15,000 to $24,999 | 5 | 2.5% |
| $25,000 to $34,999 | 5 | 2.5% |
| $35,000 to $49,999 | 2 | 1.0% |
| $50,000 to $74,999 | 14 | 6.9% |
| $75,000 to $99,999 | 23 | 11.3% |
| $100,000 to $149,999 | 27 | 13.2% |
| $150,000 to $199,999 | 25 | 12.3% |
| $200,000+ | 103 | 50.5% |
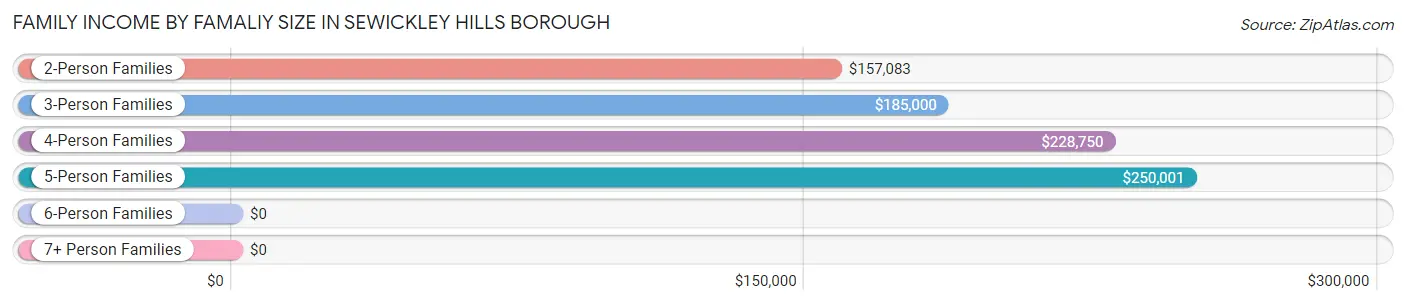
Family Income by Famaliy Size in Sewickley Hills borough
5-person families (19 | 9.3%) account for the highest median family income in Sewickley Hills borough with $250,001 per family, while 2-person families (99 | 48.5%) have the highest median income of $78,542 per family member.
| Income Bracket | # Families | Median Income |
| 2-Person Families | 99 (48.5%) | $157,083 |
| 3-Person Families | 40 (19.6%) | $185,000 |
| 4-Person Families | 43 (21.1%) | $228,750 |
| 5-Person Families | 19 (9.3%) | $250,001 |
| 6-Person Families | 0 (0.0%) | $0 |
| 7+ Person Families | 3 (1.5%) | $0 |
| Total | 204 (100.0%) | $206,250 |
Family Income by Number of Earners in Sewickley Hills borough
The median family income in Sewickley Hills borough is $206,250, with families comprising 3+ earners (15) having the highest median family income of $250,001, while families with no earners (54) have the lowest median family income of $94,167, accounting for 7.3% and 26.5% of families, respectively.

| Number of Earners | # Families | Median Income |
| No Earners | 54 (26.5%) | $94,167 |
| 1 Earner | 45 (22.1%) | $156,250 |
| 2 Earners | 90 (44.1%) | $230,000 |
| 3+ Earners | 15 (7.3%) | $250,001 |
| Total | 204 (100.0%) | $206,250 |
Household Income in Sewickley Hills borough
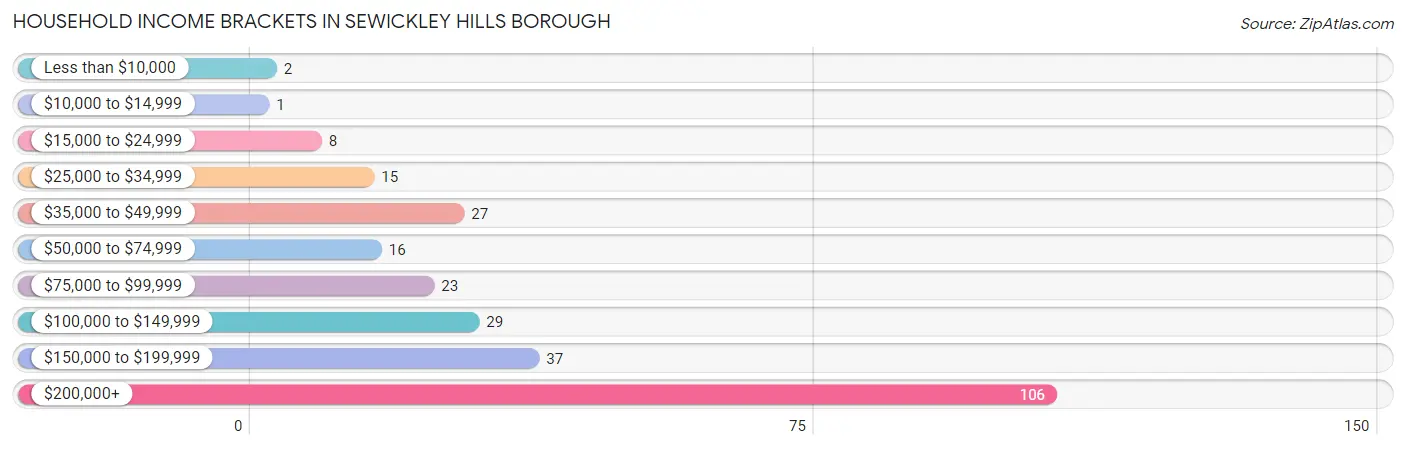
Household Income Brackets in Sewickley Hills borough
With 106 households falling in the category, the $200,000+ income range is the most frequent in Sewickley Hills borough, accounting for 40.2% of all households. In contrast, only 1 households (0.4%) fall into the $10,000 to $14,999 income bracket, making it the least populous group.
| Income Bracket | # Households | % Households |
| Less than $10,000 | 2 | 0.8% |
| $10,000 to $14,999 | 1 | 0.4% |
| $15,000 to $24,999 | 8 | 3.0% |
| $25,000 to $34,999 | 15 | 5.7% |
| $35,000 to $49,999 | 27 | 10.2% |
| $50,000 to $74,999 | 16 | 6.1% |
| $75,000 to $99,999 | 23 | 8.7% |
| $100,000 to $149,999 | 29 | 11.0% |
| $150,000 to $199,999 | 37 | 14.0% |
| $200,000+ | 106 | 40.2% |
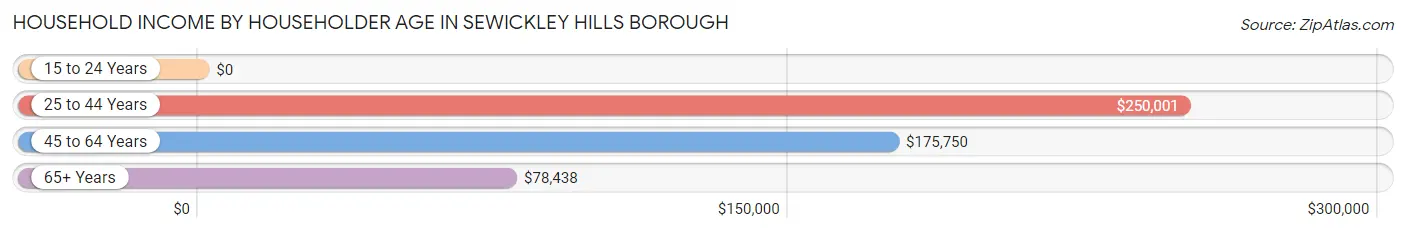
Household Income by Householder Age in Sewickley Hills borough
The median household income in Sewickley Hills borough is $156,667, with the highest median household income of $250,001 found in the 25 to 44 years age bracket for the primary householder. A total of 58 households (22.0%) fall into this category.
| Income Bracket | # Households | Median Income |
| 15 to 24 Years | 0 (0.0%) | $0 |
| 25 to 44 Years | 58 (22.0%) | $250,001 |
| 45 to 64 Years | 97 (36.7%) | $175,750 |
| 65+ Years | 109 (41.3%) | $78,438 |
| Total | 264 (100.0%) | $156,667 |
Poverty in Sewickley Hills borough
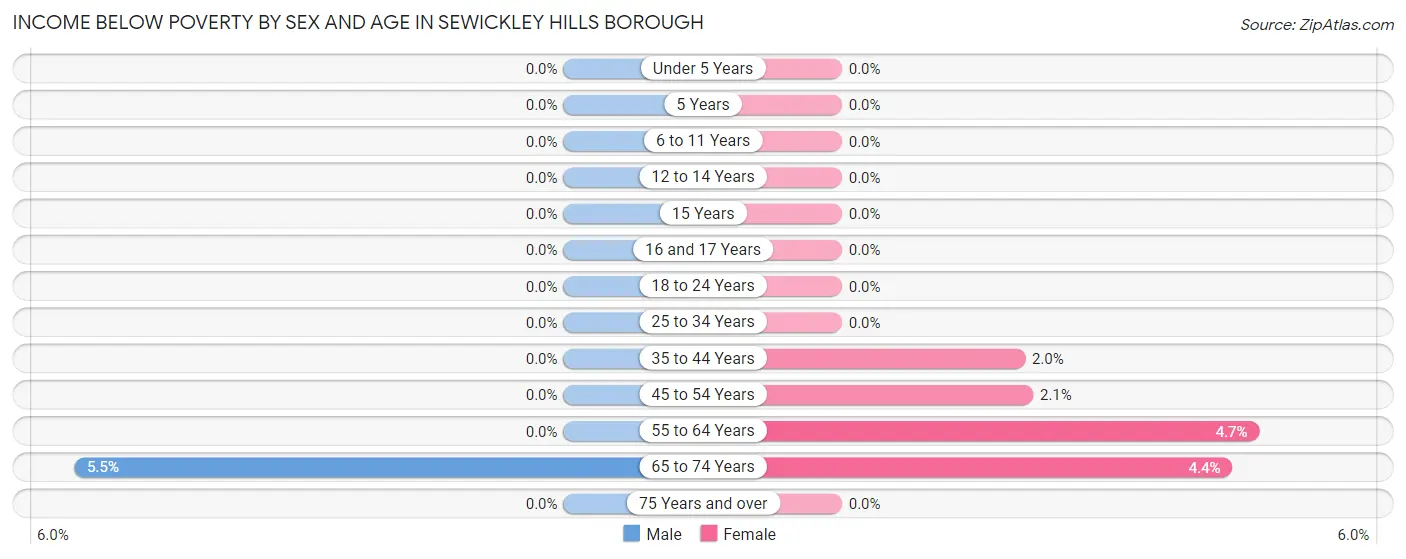
Income Below Poverty by Sex and Age in Sewickley Hills borough
With 1.0% poverty level for males and 1.8% for females among the residents of Sewickley Hills borough, 65 to 74 year old males and 55 to 64 year old females are the most vulnerable to poverty, with 3 males (5.4%) and 2 females (4.6%) in their respective age groups living below the poverty level.
| Age Bracket | Male | Female |
| Under 5 Years | 0 (0.0%) | 0 (0.0%) |
| 5 Years | 0 (0.0%) | 0 (0.0%) |
| 6 to 11 Years | 0 (0.0%) | 0 (0.0%) |
| 12 to 14 Years | 0 (0.0%) | 0 (0.0%) |
| 15 Years | 0 (0.0%) | 0 (0.0%) |
| 16 and 17 Years | 0 (0.0%) | 0 (0.0%) |
| 18 to 24 Years | 0 (0.0%) | 0 (0.0%) |
| 25 to 34 Years | 0 (0.0%) | 0 (0.0%) |
| 35 to 44 Years | 0 (0.0%) | 1 (2.0%) |
| 45 to 54 Years | 0 (0.0%) | 1 (2.1%) |
| 55 to 64 Years | 0 (0.0%) | 2 (4.6%) |
| 65 to 74 Years | 3 (5.4%) | 3 (4.3%) |
| 75 Years and over | 0 (0.0%) | 0 (0.0%) |
| Total | 3 (1.0%) | 7 (1.8%) |
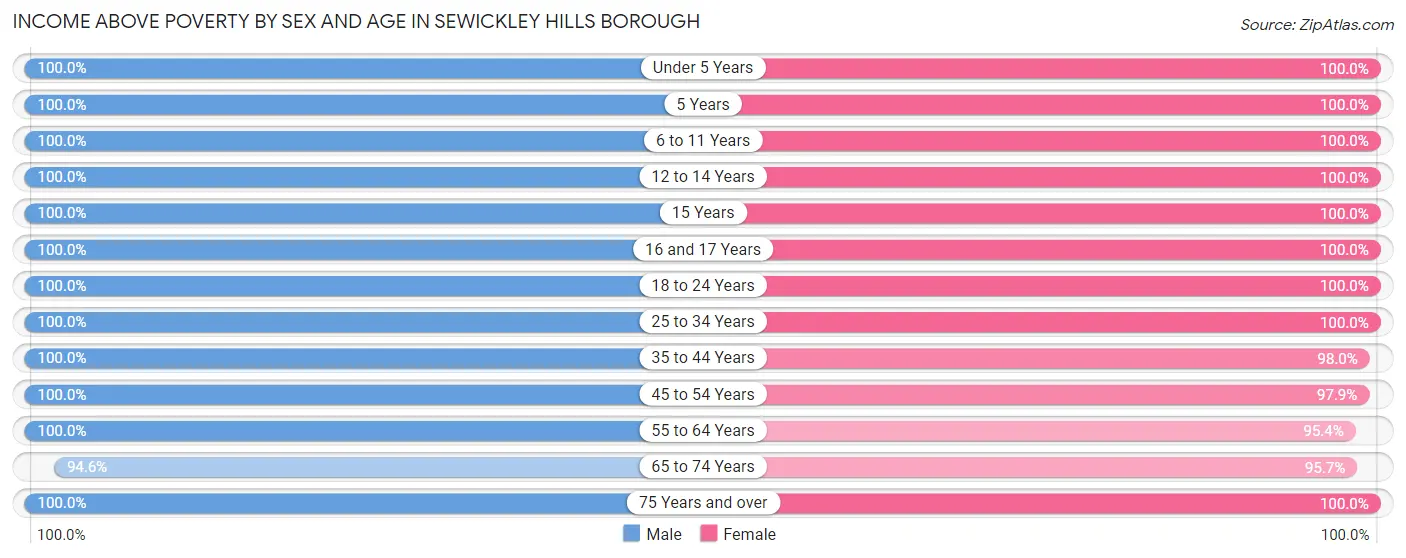
Income Above Poverty by Sex and Age in Sewickley Hills borough
According to the poverty statistics in Sewickley Hills borough, males aged under 5 years and females aged under 5 years are the age groups that are most secure financially, with 100.0% of males and 100.0% of females in these age groups living above the poverty line.
| Age Bracket | Male | Female |
| Under 5 Years | 19 (100.0%) | 24 (100.0%) |
| 5 Years | 3 (100.0%) | 5 (100.0%) |
| 6 to 11 Years | 17 (100.0%) | 36 (100.0%) |
| 12 to 14 Years | 15 (100.0%) | 20 (100.0%) |
| 15 Years | 2 (100.0%) | 6 (100.0%) |
| 16 and 17 Years | 5 (100.0%) | 9 (100.0%) |
| 18 to 24 Years | 15 (100.0%) | 8 (100.0%) |
| 25 to 34 Years | 19 (100.0%) | 15 (100.0%) |
| 35 to 44 Years | 48 (100.0%) | 48 (98.0%) |
| 45 to 54 Years | 46 (100.0%) | 46 (97.9%) |
| 55 to 64 Years | 37 (100.0%) | 41 (95.4%) |
| 65 to 74 Years | 52 (94.6%) | 66 (95.7%) |
| 75 Years and over | 33 (100.0%) | 52 (100.0%) |
| Total | 311 (99.0%) | 376 (98.2%) |
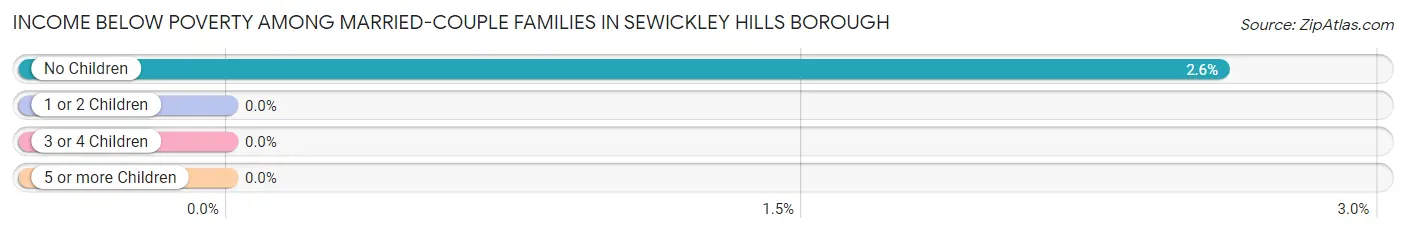
Income Below Poverty Among Married-Couple Families in Sewickley Hills borough
The poverty statistics for married-couple families in Sewickley Hills borough show that 1.5% or 3 of the total 193 families live below the poverty line. Families with no children have the highest poverty rate of 2.6%, comprising of 3 families. On the other hand, families with 1 or 2 children have the lowest poverty rate of 0.0%, which includes 0 families.
| Children | Above Poverty | Below Poverty |
| No Children | 113 (97.4%) | 3 (2.6%) |
| 1 or 2 Children | 61 (100.0%) | 0 (0.0%) |
| 3 or 4 Children | 13 (100.0%) | 0 (0.0%) |
| 5 or more Children | 3 (100.0%) | 0 (0.0%) |
| Total | 190 (98.5%) | 3 (1.5%) |
Income Below Poverty Among Single-Parent Households in Sewickley Hills borough
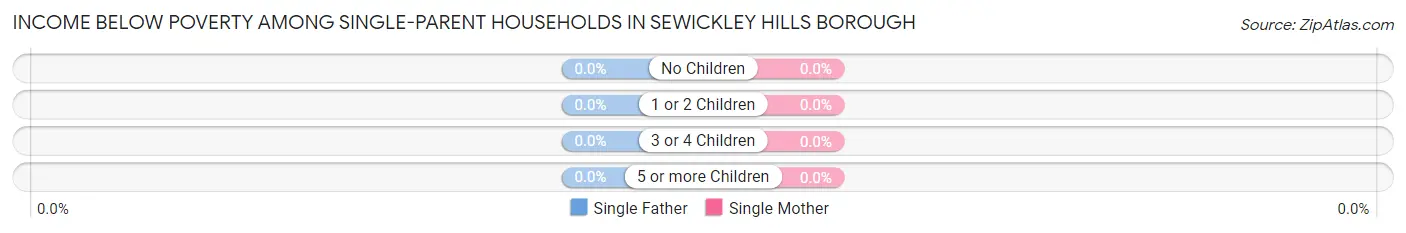
| Children | Single Father | Single Mother |
| No Children | 0 (0.0%) | 0 (0.0%) |
| 1 or 2 Children | 0 (0.0%) | 0 (0.0%) |
| 3 or 4 Children | 0 (0.0%) | 0 (0.0%) |
| 5 or more Children | 0 (0.0%) | 0 (0.0%) |
| Total | 0 (0.0%) | 0 (0.0%) |
Income Below Poverty Among Married-Couple vs Single-Parent Households in Sewickley Hills borough
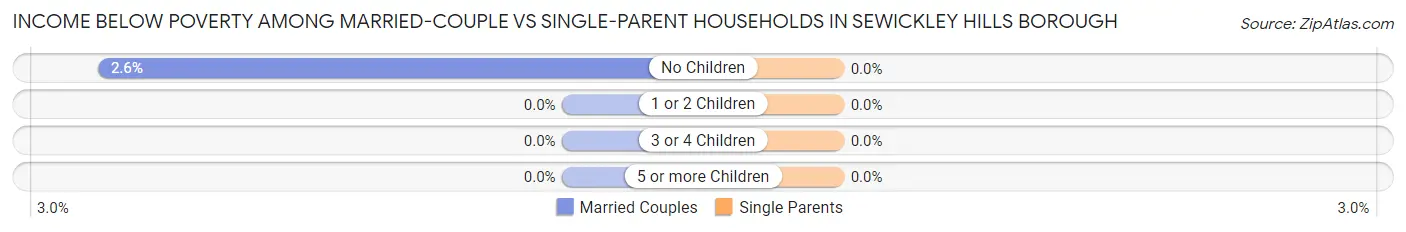
| Children | Married-Couple Families | Single-Parent Households |
| No Children | 3 (2.6%) | 0 (0.0%) |
| 1 or 2 Children | 0 (0.0%) | 0 (0.0%) |
| 3 or 4 Children | 0 (0.0%) | 0 (0.0%) |
| 5 or more Children | 0 (0.0%) | 0 (0.0%) |
| Total | 3 (1.5%) | 0 (0.0%) |
Race in Sewickley Hills borough
The most populous races in Sewickley Hills borough are White / Caucasian (646 | 92.7%), Asian (21 | 3.0%), and Two or more Races (17 | 2.4%).
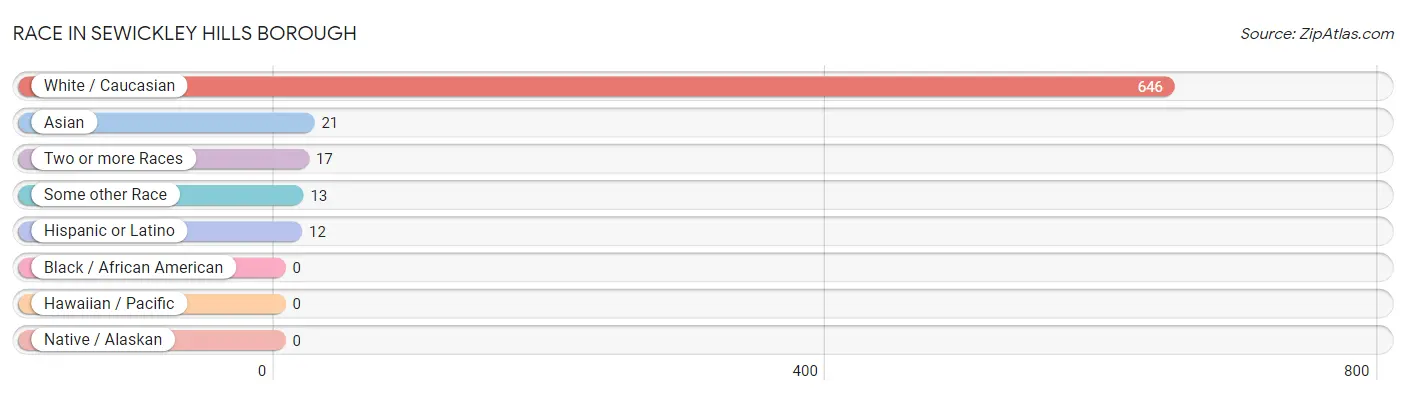
| Race | # Population | % Population |
| Asian | 21 | 3.0% |
| Black / African American | 0 | 0.0% |
| Hawaiian / Pacific | 0 | 0.0% |
| Hispanic or Latino | 12 | 1.7% |
| Native / Alaskan | 0 | 0.0% |
| White / Caucasian | 646 | 92.7% |
| Two or more Races | 17 | 2.4% |
| Some other Race | 13 | 1.9% |
| Total | 697 | 100.0% |
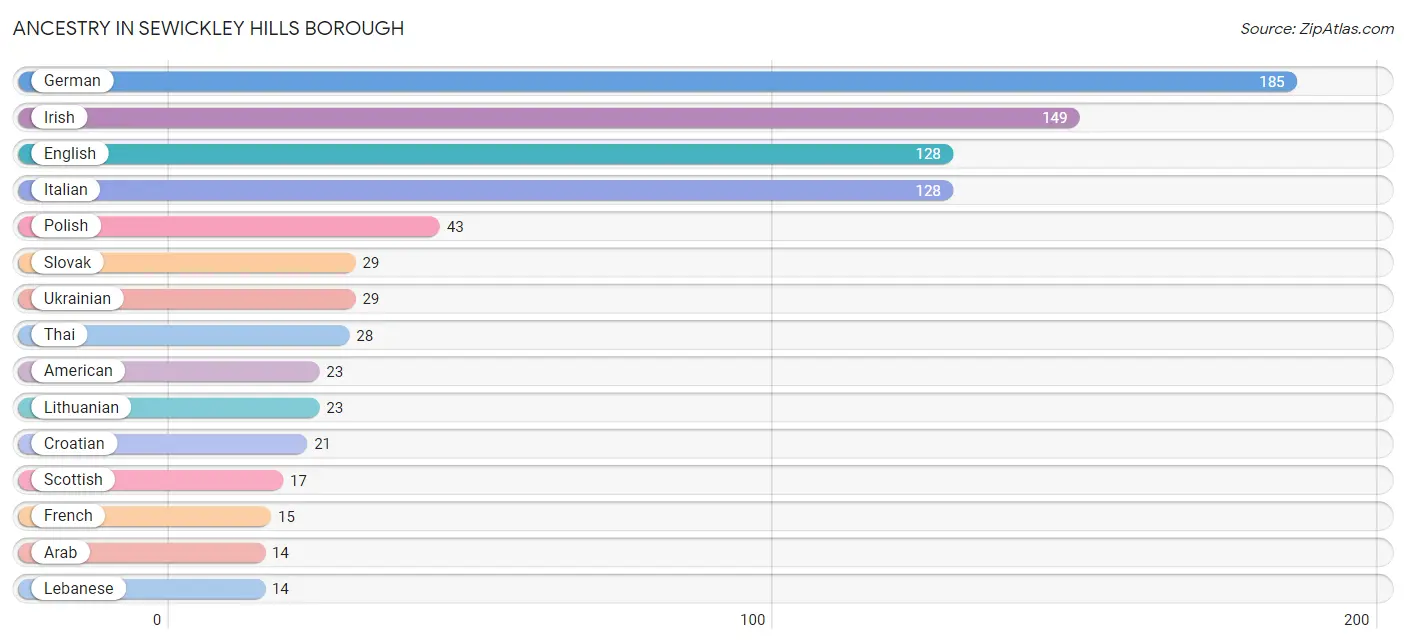
Ancestry in Sewickley Hills borough
The most populous ancestries reported in Sewickley Hills borough are German (185 | 26.5%), Irish (149 | 21.4%), English (128 | 18.4%), Italian (128 | 18.4%), and Polish (43 | 6.2%), together accounting for 90.8% of all Sewickley Hills borough residents.
| Ancestry | # Population | % Population |
| American | 23 | 3.3% |
| Arab | 14 | 2.0% |
| British | 4 | 0.6% |
| Central American | 5 | 0.7% |
| Costa Rican | 5 | 0.7% |
| Croatian | 21 | 3.0% |
| Czech | 7 | 1.0% |
| Czechoslovakian | 9 | 1.3% |
| Danish | 2 | 0.3% |
| Dutch | 7 | 1.0% |
| English | 128 | 18.4% |
| French | 15 | 2.1% |
| German | 185 | 26.5% |
| Greek | 3 | 0.4% |
| Hungarian | 7 | 1.0% |
| Indian (Asian) | 2 | 0.3% |
| Iranian | 6 | 0.9% |
| Irish | 149 | 21.4% |
| Italian | 128 | 18.4% |
| Jamaican | 8 | 1.1% |
| Korean | 2 | 0.3% |
| Lebanese | 14 | 2.0% |
| Lithuanian | 23 | 3.3% |
| Norwegian | 8 | 1.1% |
| Polish | 43 | 6.2% |
| Portuguese | 2 | 0.3% |
| Russian | 9 | 1.3% |
| Scandinavian | 2 | 0.3% |
| Scotch-Irish | 2 | 0.3% |
| Scottish | 17 | 2.4% |
| Serbian | 2 | 0.3% |
| Slavic | 3 | 0.4% |
| Slovak | 29 | 4.2% |
| Slovene | 14 | 2.0% |
| Spaniard | 7 | 1.0% |
| Swedish | 8 | 1.1% |
| Thai | 28 | 4.0% |
| Ukrainian | 29 | 4.2% |
| Welsh | 9 | 1.3% | View All 39 Rows |
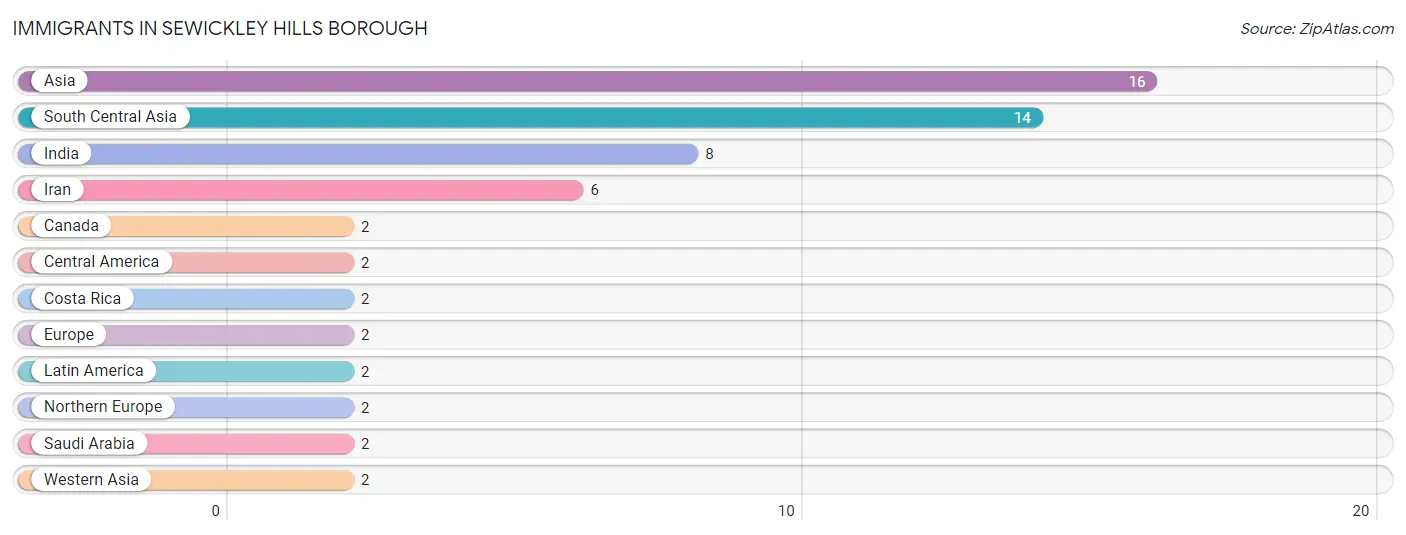
Immigrants in Sewickley Hills borough
The most numerous immigrant groups reported in Sewickley Hills borough came from Asia (16 | 2.3%), South Central Asia (14 | 2.0%), India (8 | 1.1%), Iran (6 | 0.9%), and Canada (2 | 0.3%), together accounting for 6.6% of all Sewickley Hills borough residents.
| Immigration Origin | # Population | % Population |
| Asia | 16 | 2.3% |
| Canada | 2 | 0.3% |
| Central America | 2 | 0.3% |
| Costa Rica | 2 | 0.3% |
| Europe | 2 | 0.3% |
| India | 8 | 1.1% |
| Iran | 6 | 0.9% |
| Latin America | 2 | 0.3% |
| Northern Europe | 2 | 0.3% |
| Saudi Arabia | 2 | 0.3% |
| South Central Asia | 14 | 2.0% |
| Western Asia | 2 | 0.3% | View All 12 Rows |
Sex and Age in Sewickley Hills borough
Sex and Age in Sewickley Hills borough
The most populous age groups in Sewickley Hills borough are 70 to 74 Years (34 | 10.8%) for men and 65 to 69 Years (57 | 14.9%) for women.
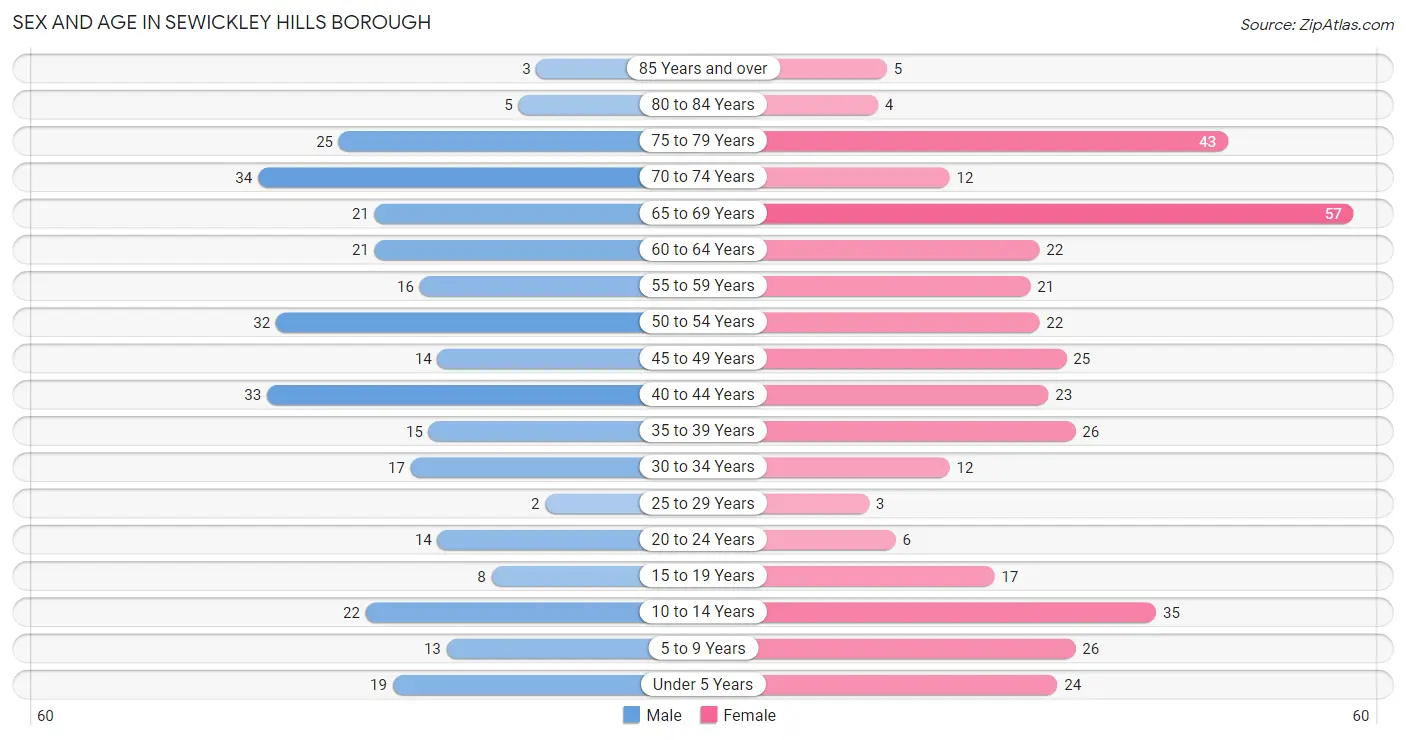
| Age Bracket | Male | Female |
| Under 5 Years | 19 (6.0%) | 24 (6.3%) |
| 5 to 9 Years | 13 (4.1%) | 26 (6.8%) |
| 10 to 14 Years | 22 (7.0%) | 35 (9.1%) |
| 15 to 19 Years | 8 (2.5%) | 17 (4.4%) |
| 20 to 24 Years | 14 (4.5%) | 6 (1.6%) |
| 25 to 29 Years | 2 (0.6%) | 3 (0.8%) |
| 30 to 34 Years | 17 (5.4%) | 12 (3.1%) |
| 35 to 39 Years | 15 (4.8%) | 26 (6.8%) |
| 40 to 44 Years | 33 (10.5%) | 23 (6.0%) |
| 45 to 49 Years | 14 (4.5%) | 25 (6.5%) |
| 50 to 54 Years | 32 (10.2%) | 22 (5.7%) |
| 55 to 59 Years | 16 (5.1%) | 21 (5.5%) |
| 60 to 64 Years | 21 (6.7%) | 22 (5.7%) |
| 65 to 69 Years | 21 (6.7%) | 57 (14.9%) |
| 70 to 74 Years | 34 (10.8%) | 12 (3.1%) |
| 75 to 79 Years | 25 (8.0%) | 43 (11.2%) |
| 80 to 84 Years | 5 (1.6%) | 4 (1.0%) |
| 85 Years and over | 3 (1.0%) | 5 (1.3%) |
| Total | 314 (100.0%) | 383 (100.0%) |
Families and Households in Sewickley Hills borough
Median Family Size in Sewickley Hills borough
The median family size in Sewickley Hills borough is 3.10 persons per family, with single female/mother families (4 | 2.0%) accounting for the largest median family size of 4 persons per family. On the other hand, single male/father families (7 | 3.4%) represent the smallest median family size with 2.86 persons per family.
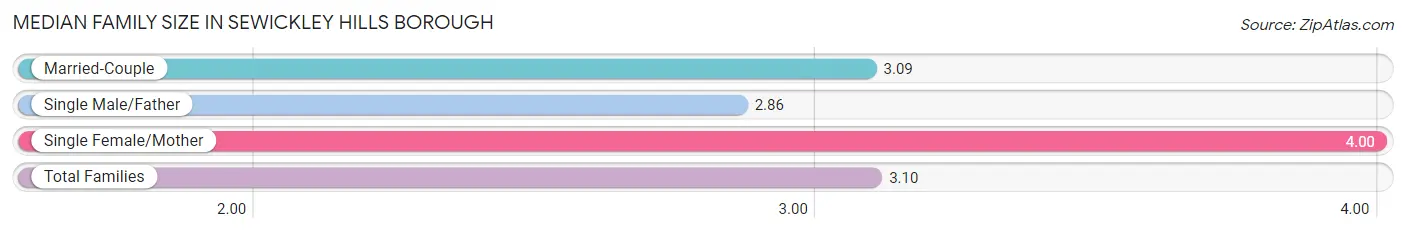
| Family Type | # Families | Family Size |
| Married-Couple | 193 (94.6%) | 3.09 |
| Single Male/Father | 7 (3.4%) | 2.86 |
| Single Female/Mother | 4 (2.0%) | 4.00 |
| Total Families | 204 (100.0%) | 3.10 |
Median Household Size in Sewickley Hills borough
The median household size in Sewickley Hills borough is 2.64 persons per household, with single female/mother households (4 | 1.5%) accounting for the largest median household size of 4 persons per household. non-family households (60 | 22.7%) represent the smallest median household size with 1.07 persons per household.
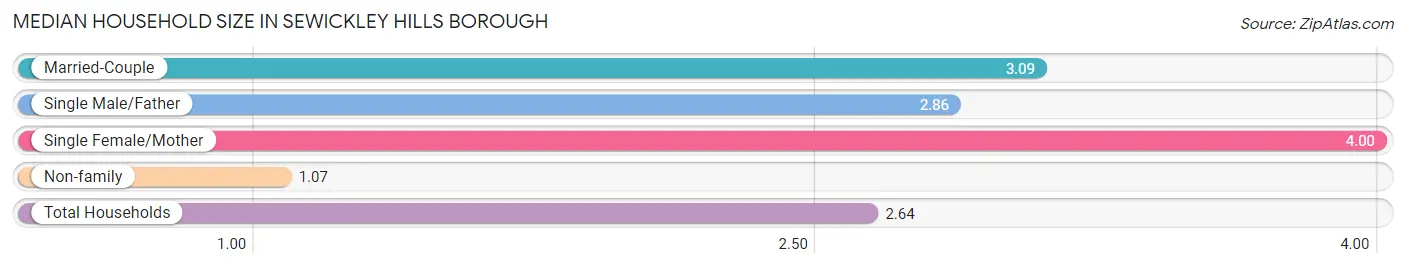
| Household Type | # Households | Household Size |
| Married-Couple | 193 (73.1%) | 3.09 |
| Single Male/Father | 7 (2.6%) | 2.86 |
| Single Female/Mother | 4 (1.5%) | 4.00 |
| Non-family | 60 (22.7%) | 1.07 |
| Total Households | 264 (100.0%) | 2.64 |
Household Size by Marriage Status in Sewickley Hills borough
Out of a total of 264 households in Sewickley Hills borough, 204 (77.3%) are family households, while 60 (22.7%) are nonfamily households. The most numerous type of family households are 2-person households, comprising 99, and the most common type of nonfamily households are 1-person households, comprising 56.
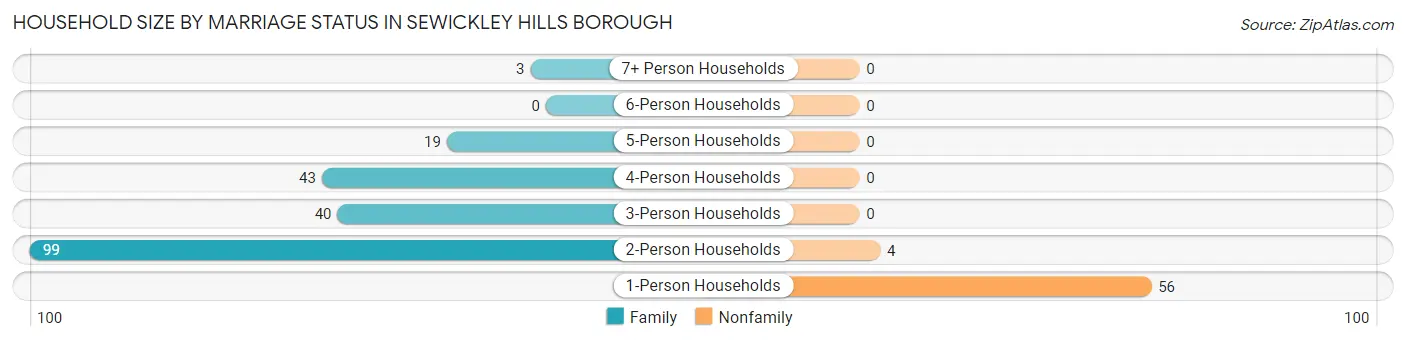
| Household Size | Family Households | Nonfamily Households |
| 1-Person Households | - | 56 (21.2%) |
| 2-Person Households | 99 (37.5%) | 4 (1.5%) |
| 3-Person Households | 40 (15.1%) | 0 (0.0%) |
| 4-Person Households | 43 (16.3%) | 0 (0.0%) |
| 5-Person Households | 19 (7.2%) | 0 (0.0%) |
| 6-Person Households | 0 (0.0%) | 0 (0.0%) |
| 7+ Person Households | 3 (1.1%) | 0 (0.0%) |
| Total | 204 (77.3%) | 60 (22.7%) |
Female Fertility in Sewickley Hills borough
Fertility by Age in Sewickley Hills borough
Average fertility rate in Sewickley Hills borough is 53.0 births per 1,000 women. Women in the age bracket of 20 to 34 years have the highest fertility rate with 190.0 births per 1,000 women. Women in the age bracket of 20 to 34 years acount for 66.7% of all women with births.
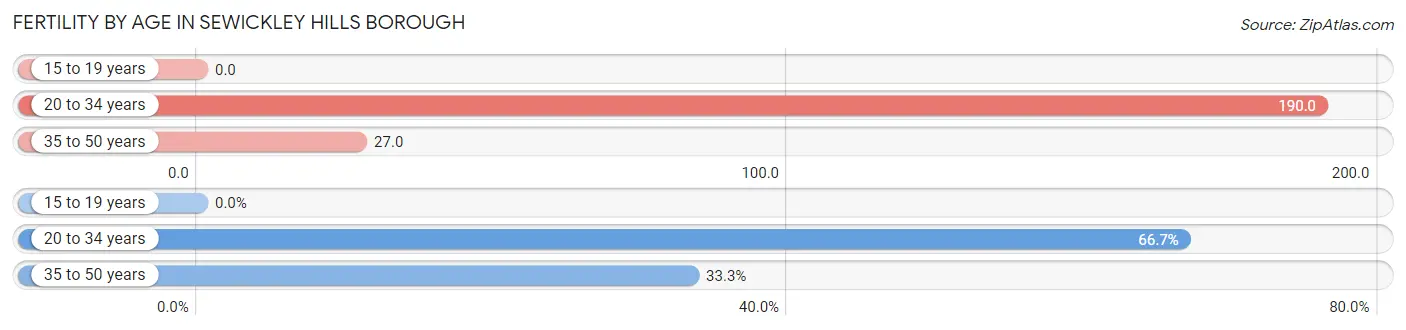
| Age Bracket | Women with Births | Births / 1,000 Women |
| 15 to 19 years | 0 (0.0%) | 0.0 |
| 20 to 34 years | 4 (66.7%) | 190.0 |
| 35 to 50 years | 2 (33.3%) | 27.0 |
| Total | 6 (100.0%) | 53.0 |
Fertility by Age by Marriage Status in Sewickley Hills borough
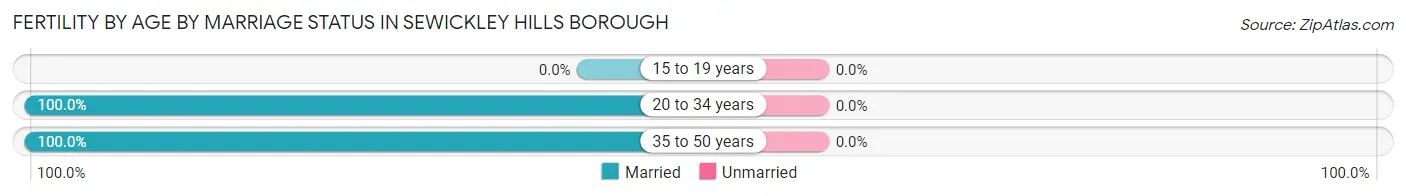
| Age Bracket | Married | Unmarried |
| 15 to 19 years | 0 (0.0%) | 0 (0.0%) |
| 20 to 34 years | 4 (100.0%) | 0 (0.0%) |
| 35 to 50 years | 2 (100.0%) | 0 (0.0%) |
| Total | 6 (100.0%) | 0 (0.0%) |
Fertility by Education in Sewickley Hills borough
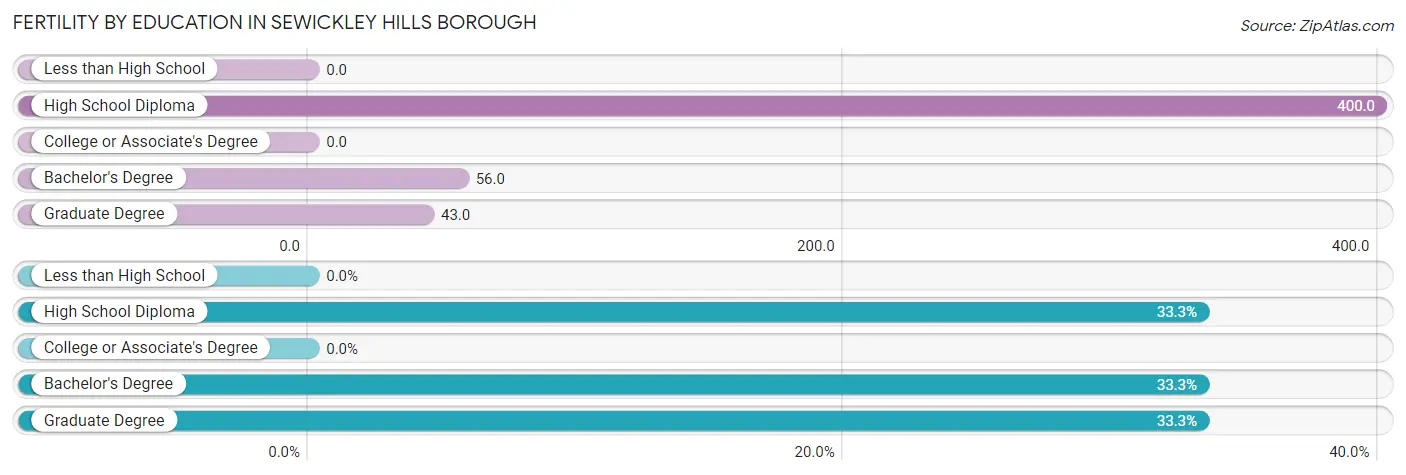
| Educational Attainment | Women with Births | Births / 1,000 Women |
| Less than High School | 0 (0.0%) | 0.0 |
| High School Diploma | 2 (33.3%) | 400.0 |
| College or Associate's Degree | 0 (0.0%) | 0.0 |
| Bachelor's Degree | 2 (33.3%) | 56.0 |
| Graduate Degree | 2 (33.3%) | 43.0 |
| Total | 6 (100.0%) | 53.0 |
Fertility by Education by Marriage Status in Sewickley Hills borough
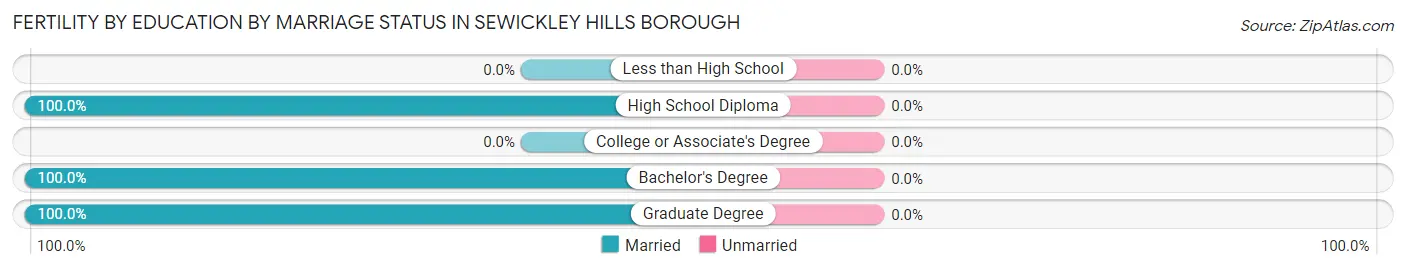
| Educational Attainment | Married | Unmarried |
| Less than High School | 0 (0.0%) | 0 (0.0%) |
| High School Diploma | 2 (100.0%) | 0 (0.0%) |
| College or Associate's Degree | 0 (0.0%) | 0 (0.0%) |
| Bachelor's Degree | 2 (100.0%) | 0 (0.0%) |
| Graduate Degree | 2 (100.0%) | 0 (0.0%) |
| Total | 6 (100.0%) | 0 (0.0%) |
Employment Characteristics in Sewickley Hills borough
Employment by Class of Employer in Sewickley Hills borough
Among the 265 employed individuals in Sewickley Hills borough, private company employees (171 | 64.5%), not-for-profit organizations (29 | 10.9%), and self-employed (incorporated) (27 | 10.2%) make up the most common classes of employment.
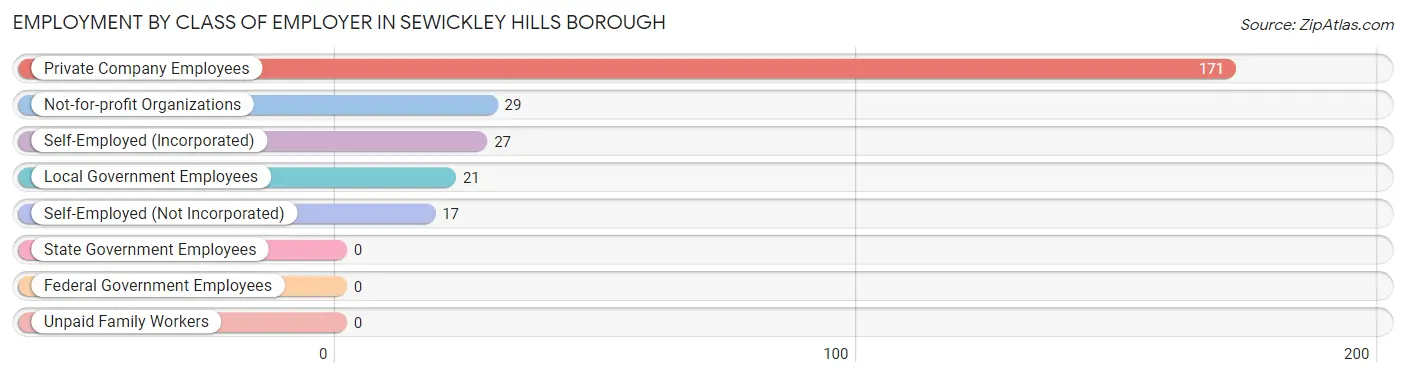
| Employer Class | # Employees | % Employees |
| Private Company Employees | 171 | 64.5% |
| Self-Employed (Incorporated) | 27 | 10.2% |
| Self-Employed (Not Incorporated) | 17 | 6.4% |
| Not-for-profit Organizations | 29 | 10.9% |
| Local Government Employees | 21 | 7.9% |
| State Government Employees | 0 | 0.0% |
| Federal Government Employees | 0 | 0.0% |
| Unpaid Family Workers | 0 | 0.0% |
| Total | 265 | 100.0% |
Employment Status by Age in Sewickley Hills borough
According to the labor force statistics for Sewickley Hills borough, out of the total population over 16 years of age (550), 51.6% or 284 individuals are in the labor force, with 4.6% or 13 of them unemployed. The age group with the highest labor force participation rate is 20 to 24 years, with 100.0% or 20 individuals in the labor force. Within the labor force, the 20 to 24 years age range has the highest percentage of unemployed individuals, with 20.0% or 4 of them being unemployed.
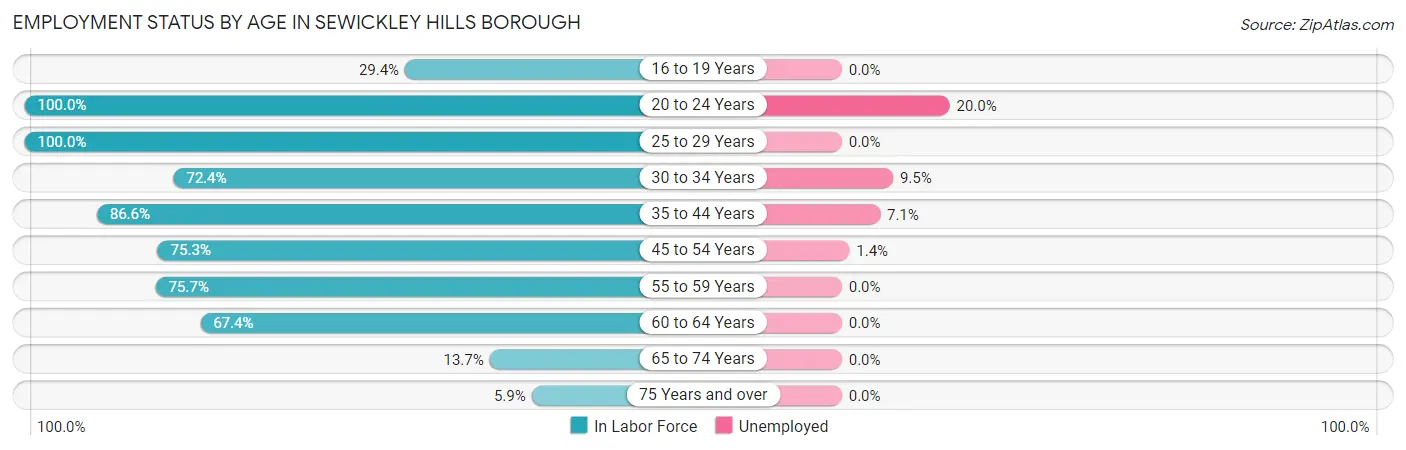
| Age Bracket | In Labor Force | Unemployed |
| 16 to 19 Years | 5 (29.4%) | 0 (0.0%) |
| 20 to 24 Years | 20 (100.0%) | 4 (20.0%) |
| 25 to 29 Years | 5 (100.0%) | 0 (0.0%) |
| 30 to 34 Years | 21 (72.4%) | 2 (9.5%) |
| 35 to 44 Years | 84 (86.6%) | 6 (7.1%) |
| 45 to 54 Years | 70 (75.3%) | 1 (1.4%) |
| 55 to 59 Years | 28 (75.7%) | 0 (0.0%) |
| 60 to 64 Years | 29 (67.4%) | 0 (0.0%) |
| 65 to 74 Years | 17 (13.7%) | 0 (0.0%) |
| 75 Years and over | 5 (5.9%) | 0 (0.0%) |
| Total | 284 (51.6%) | 13 (4.6%) |
Employment Status by Educational Attainment in Sewickley Hills borough
According to labor force statistics for Sewickley Hills borough, 78.0% of individuals (237) out of the total population between 25 and 64 years of age (304) are in the labor force, with 3.8% or 9 of them being unemployed. The group with the highest labor force participation rate are those with the educational attainment of bachelor's degree or higher, with 84.1% or 174 individuals in the labor force. Within the labor force, individuals with college / associate degree education have the highest percentage of unemployment, with 6.9% or 2 of them being unemployed.
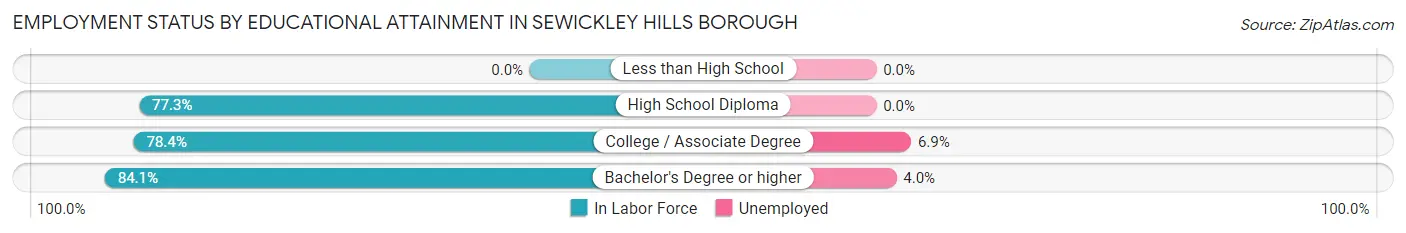
| Educational Attainment | In Labor Force | Unemployed |
| Less than High School | 0 (0.0%) | 0 (0.0%) |
| High School Diploma | 34 (77.3%) | 0 (0.0%) |
| College / Associate Degree | 29 (78.4%) | 3 (6.9%) |
| Bachelor's Degree or higher | 174 (84.1%) | 8 (4.0%) |
| Total | 237 (78.0%) | 12 (3.8%) |
Employment Occupations by Sex in Sewickley Hills borough
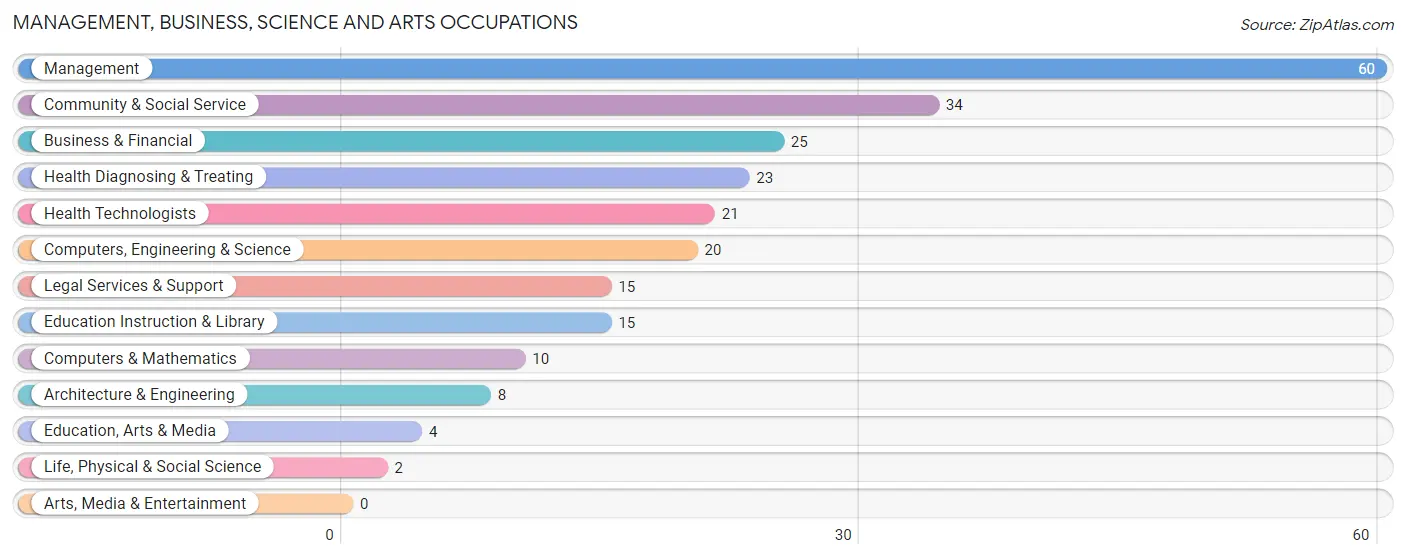
Management, Business, Science and Arts Occupations
The most common Management, Business, Science and Arts occupations in Sewickley Hills borough are Management (60 | 22.1%), Community & Social Service (34 | 12.6%), Business & Financial (25 | 9.2%), Health Diagnosing & Treating (23 | 8.5%), and Health Technologists (21 | 7.7%).
Management, Business, Science and Arts Occupations by Sex
Within the Management, Business, Science and Arts occupations in Sewickley Hills borough, the most male-oriented occupations are Computers & Mathematics (100.0%), Life, Physical & Social Science (100.0%), and Computers, Engineering & Science (90.0%), while the most female-oriented occupations are Education Instruction & Library (73.3%), Community & Social Service (67.6%), and Legal Services & Support (66.7%).
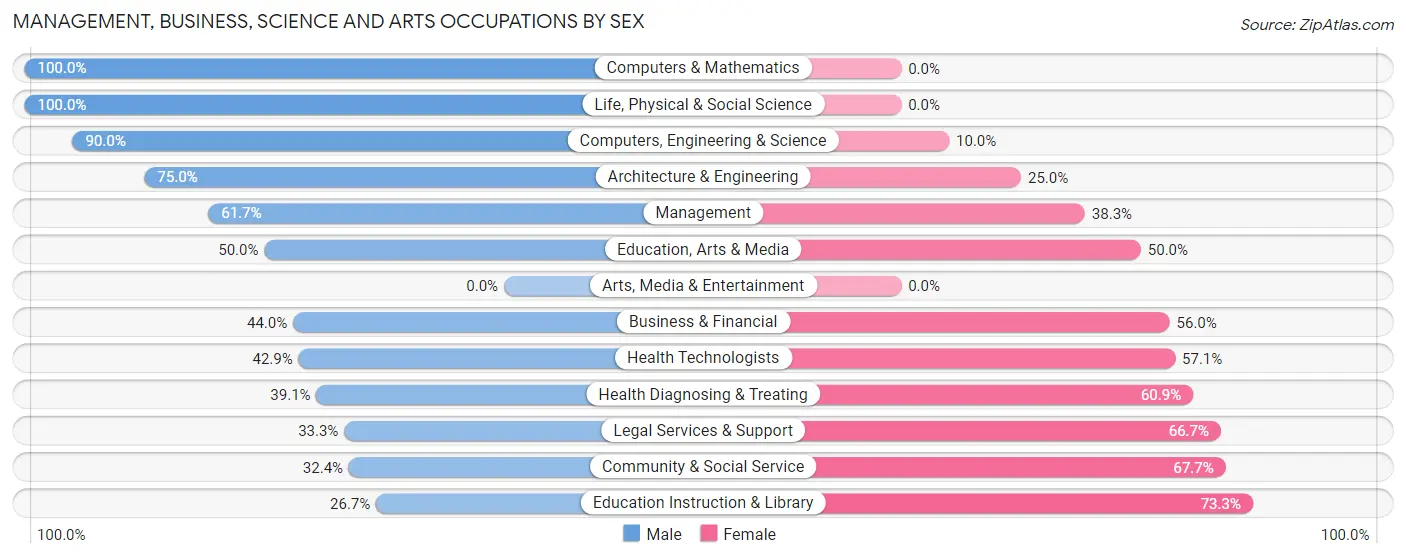
| Occupation | Male | Female |
| Management | 37 (61.7%) | 23 (38.3%) |
| Business & Financial | 11 (44.0%) | 14 (56.0%) |
| Computers, Engineering & Science | 18 (90.0%) | 2 (10.0%) |
| Computers & Mathematics | 10 (100.0%) | 0 (0.0%) |
| Architecture & Engineering | 6 (75.0%) | 2 (25.0%) |
| Life, Physical & Social Science | 2 (100.0%) | 0 (0.0%) |
| Community & Social Service | 11 (32.4%) | 23 (67.6%) |
| Education, Arts & Media | 2 (50.0%) | 2 (50.0%) |
| Legal Services & Support | 5 (33.3%) | 10 (66.7%) |
| Education Instruction & Library | 4 (26.7%) | 11 (73.3%) |
| Arts, Media & Entertainment | 0 (0.0%) | 0 (0.0%) |
| Health Diagnosing & Treating | 9 (39.1%) | 14 (60.9%) |
| Health Technologists | 9 (42.9%) | 12 (57.1%) |
| Total (Category) | 86 (53.1%) | 76 (46.9%) |
| Total (Overall) | 155 (57.2%) | 116 (42.8%) |
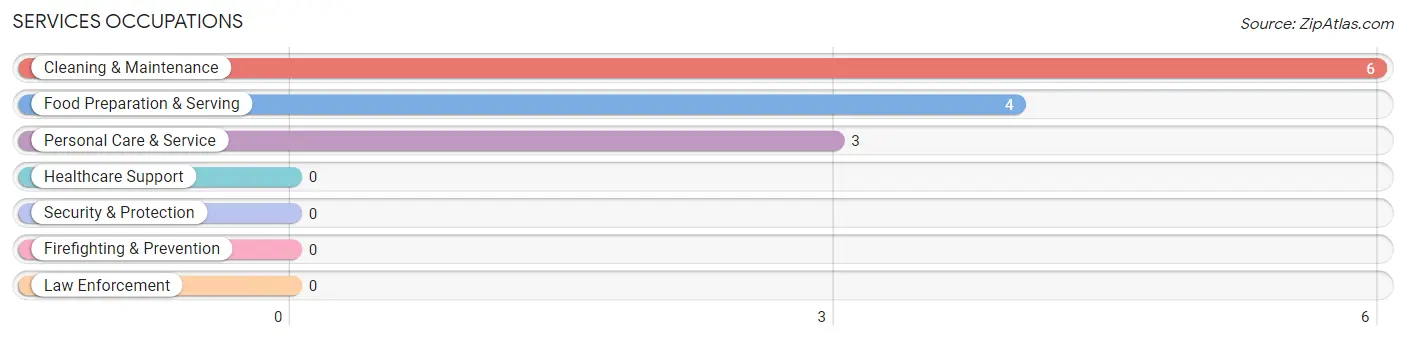
Services Occupations
The most common Services occupations in Sewickley Hills borough are Cleaning & Maintenance (6 | 2.2%), Food Preparation & Serving (4 | 1.5%), and Personal Care & Service (3 | 1.1%).
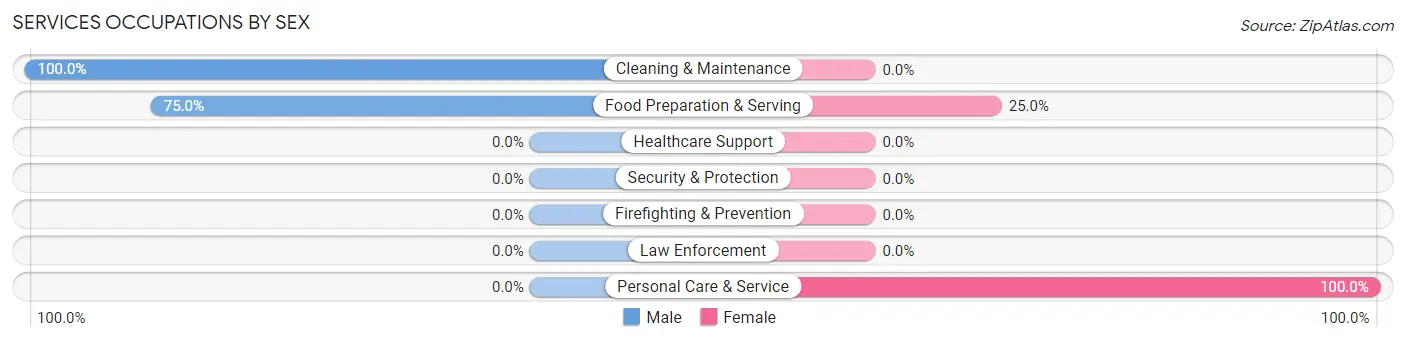
Services Occupations by Sex
Within the Services occupations in Sewickley Hills borough, the most male-oriented occupations are Cleaning & Maintenance (100.0%), and Food Preparation & Serving (75.0%), while the most female-oriented occupations are Personal Care & Service (100.0%), and Food Preparation & Serving (25.0%).
| Occupation | Male | Female |
| Healthcare Support | 0 (0.0%) | 0 (0.0%) |
| Security & Protection | 0 (0.0%) | 0 (0.0%) |
| Firefighting & Prevention | 0 (0.0%) | 0 (0.0%) |
| Law Enforcement | 0 (0.0%) | 0 (0.0%) |
| Food Preparation & Serving | 3 (75.0%) | 1 (25.0%) |
| Cleaning & Maintenance | 6 (100.0%) | 0 (0.0%) |
| Personal Care & Service | 0 (0.0%) | 3 (100.0%) |
| Total (Category) | 9 (69.2%) | 4 (30.8%) |
| Total (Overall) | 155 (57.2%) | 116 (42.8%) |
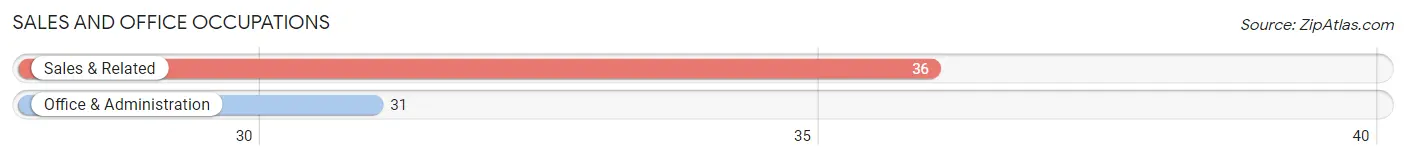
Sales and Office Occupations
The most common Sales and Office occupations in Sewickley Hills borough are Sales & Related (36 | 13.3%), and Office & Administration (31 | 11.4%).
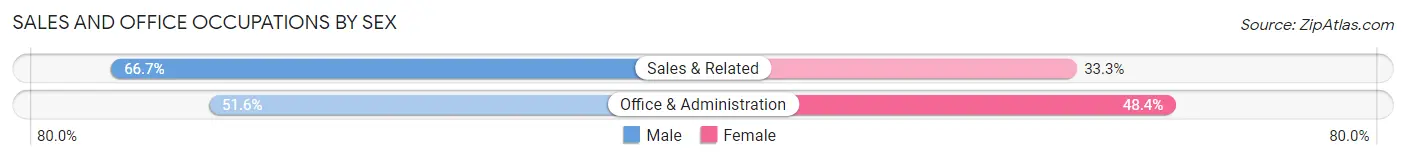
Sales and Office Occupations by Sex
| Occupation | Male | Female |
| Sales & Related | 24 (66.7%) | 12 (33.3%) |
| Office & Administration | 16 (51.6%) | 15 (48.4%) |
| Total (Category) | 40 (59.7%) | 27 (40.3%) |
| Total (Overall) | 155 (57.2%) | 116 (42.8%) |
Natural Resources, Construction and Maintenance Occupations
The most common Natural Resources, Construction and Maintenance occupations in Sewickley Hills borough are Construction & Extraction (10 | 3.7%), and Installation, Maintenance & Repair (5 | 1.8%).
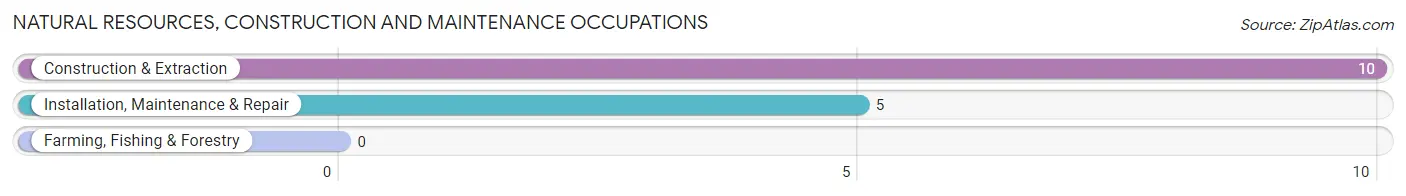
Natural Resources, Construction and Maintenance Occupations by Sex
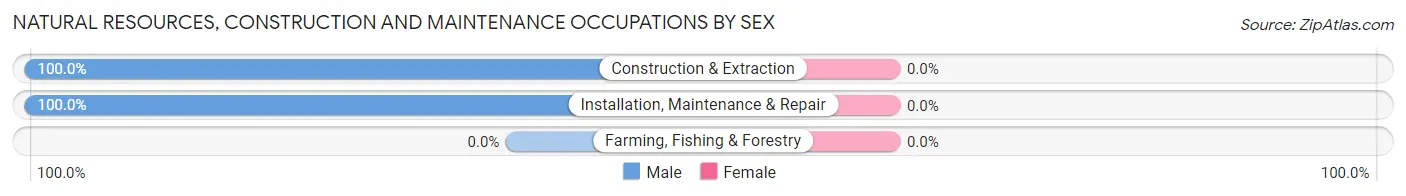
| Occupation | Male | Female |
| Farming, Fishing & Forestry | 0 (0.0%) | 0 (0.0%) |
| Construction & Extraction | 10 (100.0%) | 0 (0.0%) |
| Installation, Maintenance & Repair | 5 (100.0%) | 0 (0.0%) |
| Total (Category) | 15 (100.0%) | 0 (0.0%) |
| Total (Overall) | 155 (57.2%) | 116 (42.8%) |
Production, Transportation and Moving Occupations
The most common Production, Transportation and Moving occupations in Sewickley Hills borough are Transportation (9 | 3.3%), and Production (5 | 1.8%).
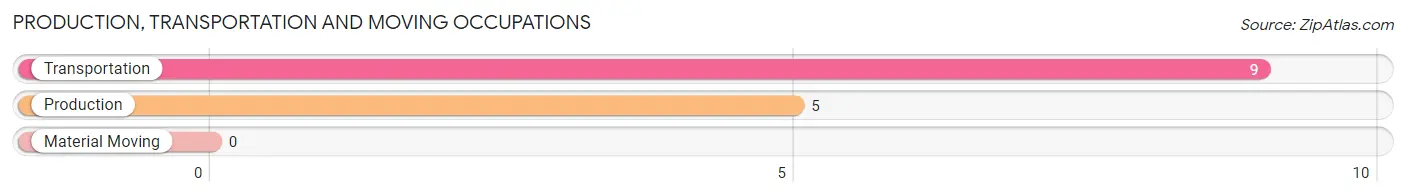
Production, Transportation and Moving Occupations by Sex
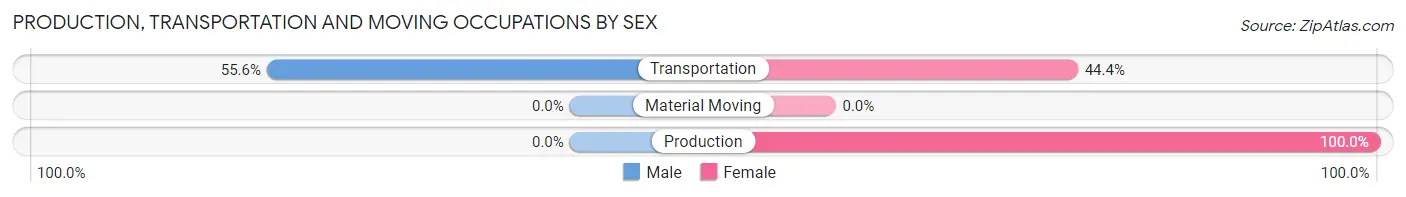
| Occupation | Male | Female |
| Production | 0 (0.0%) | 5 (100.0%) |
| Transportation | 5 (55.6%) | 4 (44.4%) |
| Material Moving | 0 (0.0%) | 0 (0.0%) |
| Total (Category) | 5 (35.7%) | 9 (64.3%) |
| Total (Overall) | 155 (57.2%) | 116 (42.8%) |
Employment Industries by Sex in Sewickley Hills borough
Employment Industries in Sewickley Hills borough
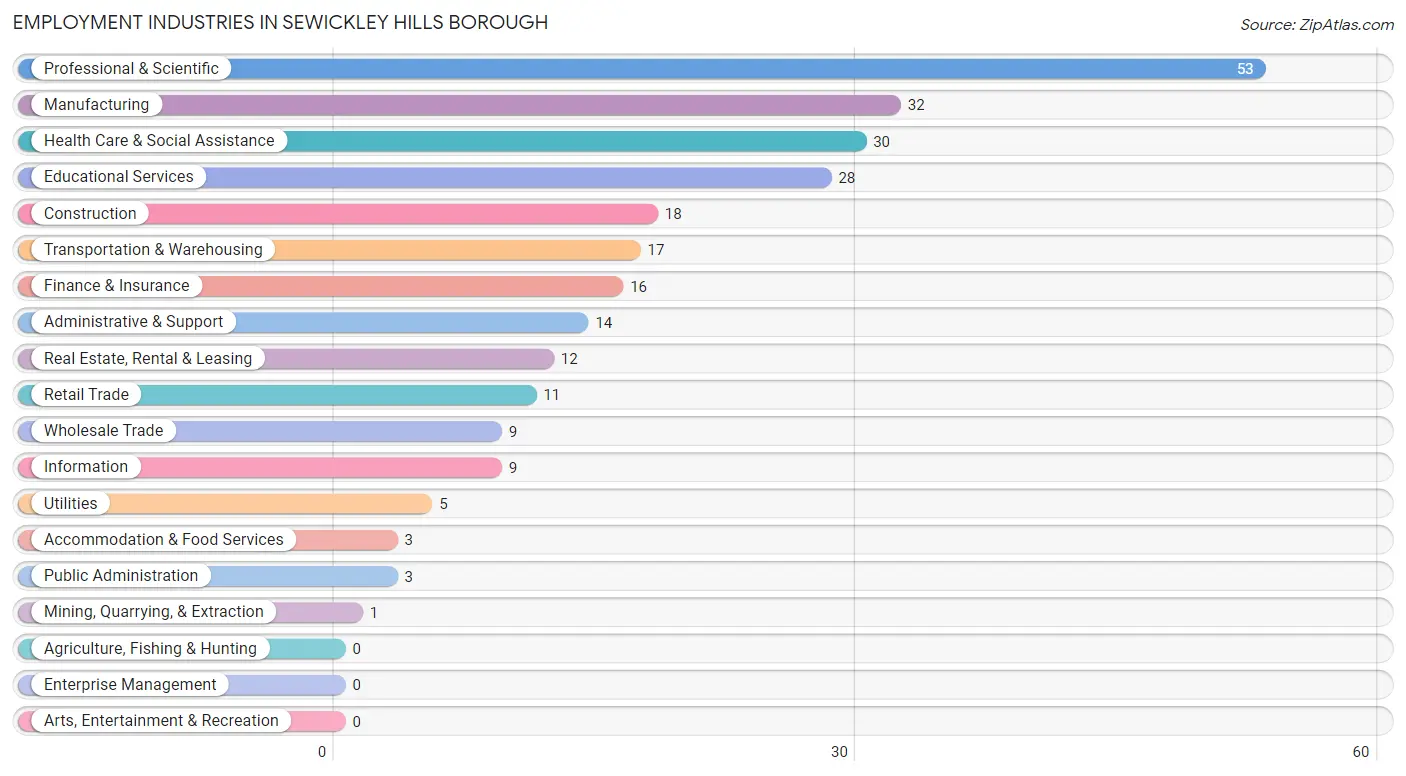
The major employment industries in Sewickley Hills borough include Professional & Scientific (53 | 19.6%), Manufacturing (32 | 11.8%), Health Care & Social Assistance (30 | 11.1%), Educational Services (28 | 10.3%), and Construction (18 | 6.6%).
Employment Industries by Sex in Sewickley Hills borough
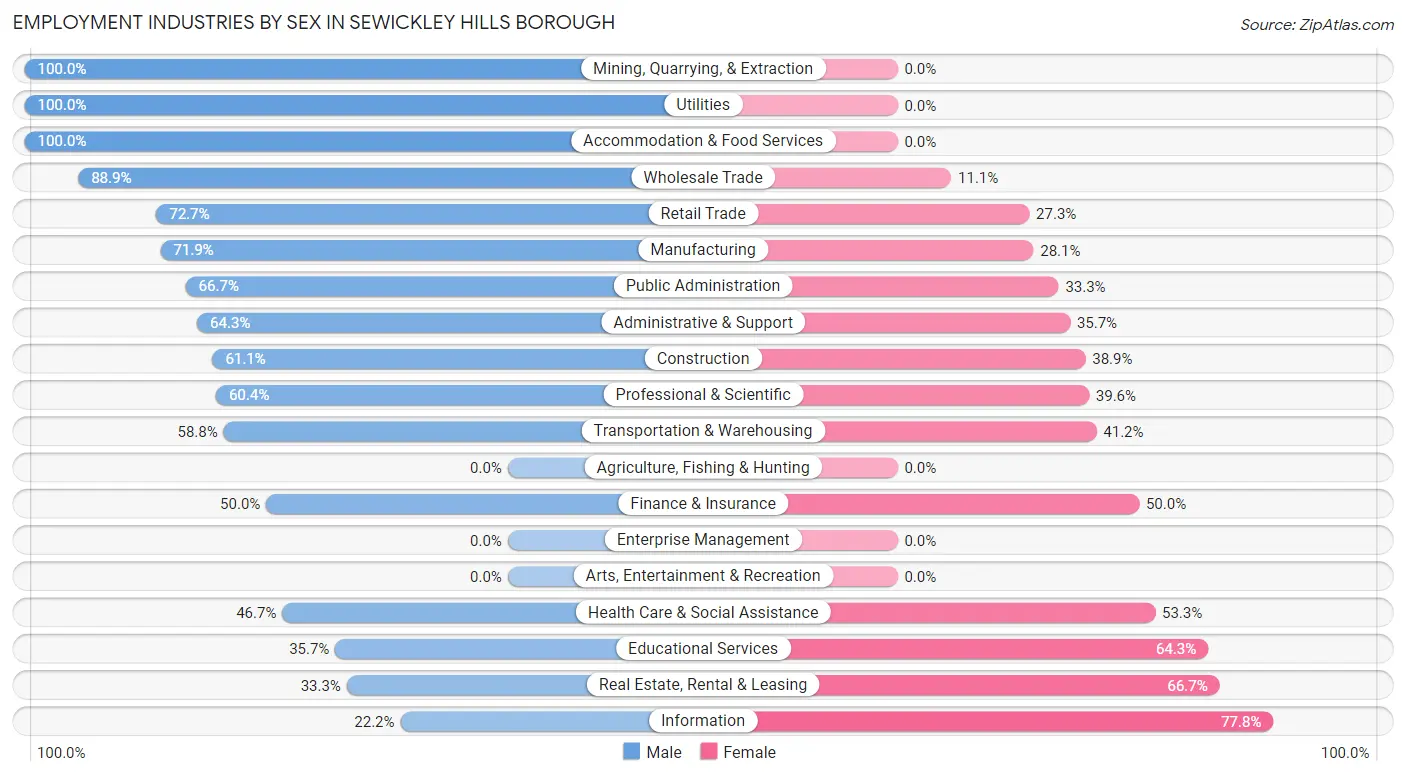
The Sewickley Hills borough industries that see more men than women are Mining, Quarrying, & Extraction (100.0%), Utilities (100.0%), and Accommodation & Food Services (100.0%), whereas the industries that tend to have a higher number of women are Information (77.8%), Real Estate, Rental & Leasing (66.7%), and Educational Services (64.3%).
| Industry | Male | Female |
| Agriculture, Fishing & Hunting | 0 (0.0%) | 0 (0.0%) |
| Mining, Quarrying, & Extraction | 1 (100.0%) | 0 (0.0%) |
| Construction | 11 (61.1%) | 7 (38.9%) |
| Manufacturing | 23 (71.9%) | 9 (28.1%) |
| Wholesale Trade | 8 (88.9%) | 1 (11.1%) |
| Retail Trade | 8 (72.7%) | 3 (27.3%) |
| Transportation & Warehousing | 10 (58.8%) | 7 (41.2%) |
| Utilities | 5 (100.0%) | 0 (0.0%) |
| Information | 2 (22.2%) | 7 (77.8%) |
| Finance & Insurance | 8 (50.0%) | 8 (50.0%) |
| Real Estate, Rental & Leasing | 4 (33.3%) | 8 (66.7%) |
| Professional & Scientific | 32 (60.4%) | 21 (39.6%) |
| Enterprise Management | 0 (0.0%) | 0 (0.0%) |
| Administrative & Support | 9 (64.3%) | 5 (35.7%) |
| Educational Services | 10 (35.7%) | 18 (64.3%) |
| Health Care & Social Assistance | 14 (46.7%) | 16 (53.3%) |
| Arts, Entertainment & Recreation | 0 (0.0%) | 0 (0.0%) |
| Accommodation & Food Services | 3 (100.0%) | 0 (0.0%) |
| Public Administration | 2 (66.7%) | 1 (33.3%) |
| Total | 155 (57.2%) | 116 (42.8%) |
Education in Sewickley Hills borough
School Enrollment in Sewickley Hills borough
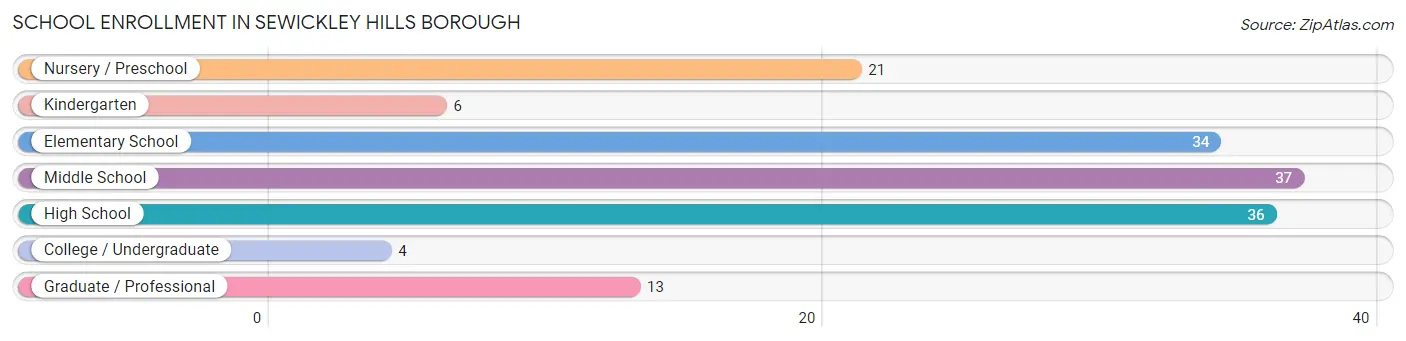
The most common levels of schooling among the 151 students in Sewickley Hills borough are middle school (37 | 24.5%), high school (36 | 23.8%), and elementary school (34 | 22.5%).
| School Level | # Students | % Students |
| Nursery / Preschool | 21 | 13.9% |
| Kindergarten | 6 | 4.0% |
| Elementary School | 34 | 22.5% |
| Middle School | 37 | 24.5% |
| High School | 36 | 23.8% |
| College / Undergraduate | 4 | 2.6% |
| Graduate / Professional | 13 | 8.6% |
| Total | 151 | 100.0% |
School Enrollment by Age by Funding Source in Sewickley Hills borough
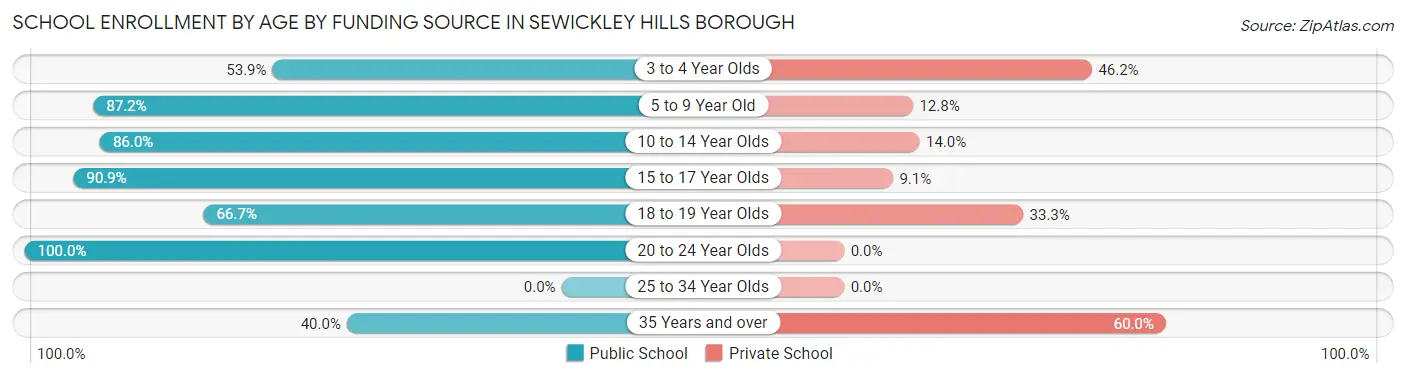
Out of a total of 151 students who are enrolled in schools in Sewickley Hills borough, 28 (18.5%) attend a private institution, while the remaining 123 (81.5%) are enrolled in public schools. The age group of 35 years and over has the highest likelihood of being enrolled in private schools, with 6 (60.0% in the age bracket) enrolled. Conversely, the age group of 20 to 24 year olds has the lowest likelihood of being enrolled in a private school, with 7 (100.0% in the age bracket) attending a public institution.
| Age Bracket | Public School | Private School |
| 3 to 4 Year Olds | 7 (53.8%) | 6 (46.2%) |
| 5 to 9 Year Old | 34 (87.2%) | 5 (12.8%) |
| 10 to 14 Year Olds | 49 (86.0%) | 8 (14.0%) |
| 15 to 17 Year Olds | 20 (90.9%) | 2 (9.1%) |
| 18 to 19 Year Olds | 2 (66.7%) | 1 (33.3%) |
| 20 to 24 Year Olds | 7 (100.0%) | 0 (0.0%) |
| 25 to 34 Year Olds | 0 (0.0%) | 0 (0.0%) |
| 35 Years and over | 4 (40.0%) | 6 (60.0%) |
| Total | 123 (81.5%) | 28 (18.5%) |
Educational Attainment by Field of Study in Sewickley Hills borough
Business (77 | 19.8%), social sciences (57 | 14.6%), science & technology (54 | 13.9%), education (49 | 12.6%), and engineering (28 | 7.2%) are the most common fields of study among 389 individuals in Sewickley Hills borough who have obtained a bachelor's degree or higher.
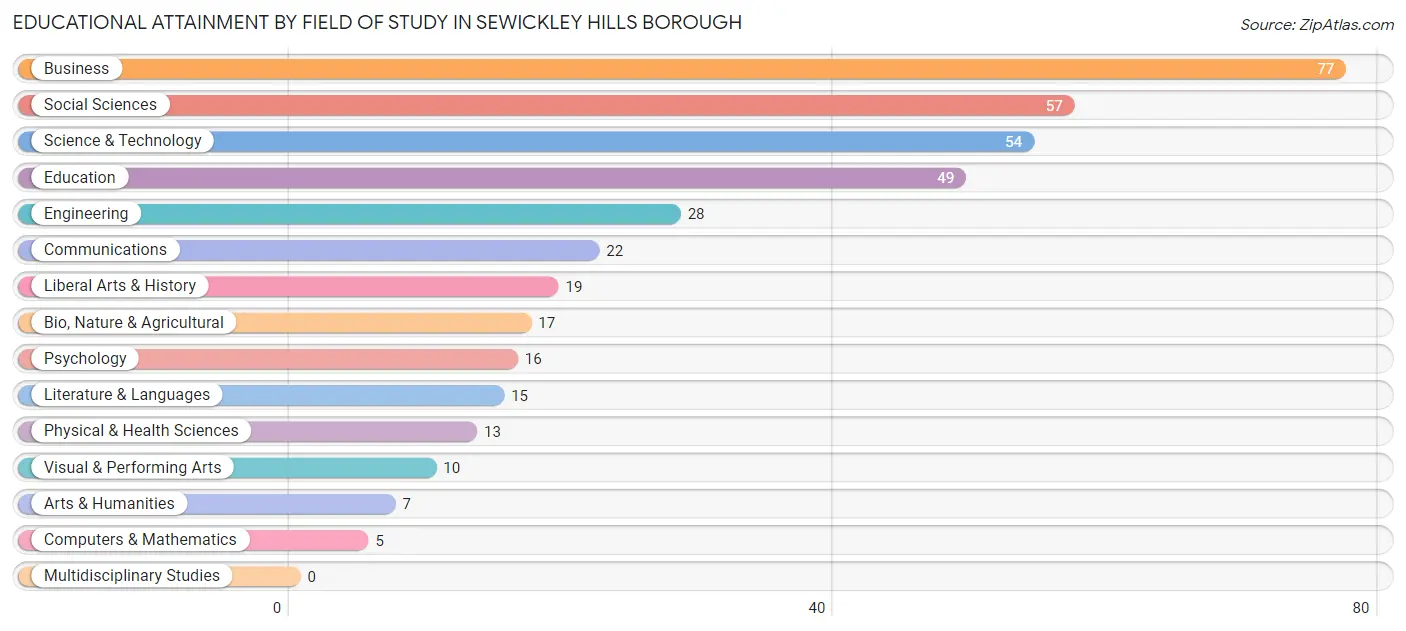
| Field of Study | # Graduates | % Graduates |
| Computers & Mathematics | 5 | 1.3% |
| Bio, Nature & Agricultural | 17 | 4.4% |
| Physical & Health Sciences | 13 | 3.3% |
| Psychology | 16 | 4.1% |
| Social Sciences | 57 | 14.6% |
| Engineering | 28 | 7.2% |
| Multidisciplinary Studies | 0 | 0.0% |
| Science & Technology | 54 | 13.9% |
| Business | 77 | 19.8% |
| Education | 49 | 12.6% |
| Literature & Languages | 15 | 3.9% |
| Liberal Arts & History | 19 | 4.9% |
| Visual & Performing Arts | 10 | 2.6% |
| Communications | 22 | 5.7% |
| Arts & Humanities | 7 | 1.8% |
| Total | 389 | 100.0% |
Transportation & Commute in Sewickley Hills borough
Vehicle Availability by Sex in Sewickley Hills borough
The most prevalent vehicle ownership categories in Sewickley Hills borough are males with 2 vehicles (73, accounting for 49.0%) and females with 2 vehicles (62, making up 62.9%).
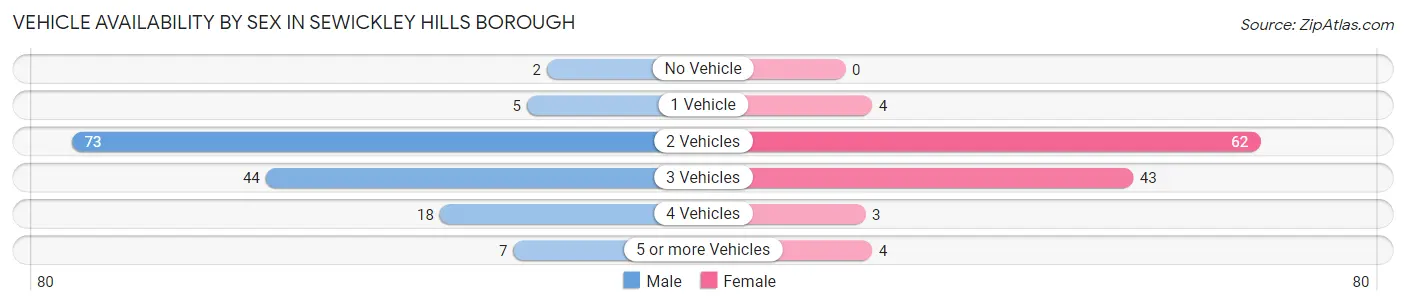
| Vehicles Available | Male | Female |
| No Vehicle | 2 (1.3%) | 0 (0.0%) |
| 1 Vehicle | 5 (3.4%) | 4 (3.5%) |
| 2 Vehicles | 73 (49.0%) | 62 (53.4%) |
| 3 Vehicles | 44 (29.5%) | 43 (37.1%) |
| 4 Vehicles | 18 (12.1%) | 3 (2.6%) |
| 5 or more Vehicles | 7 (4.7%) | 4 (3.5%) |
| Total | 149 (100.0%) | 116 (100.0%) |
Commute Time in Sewickley Hills borough
The most frequently occuring commute durations in Sewickley Hills borough are 20 to 24 minutes (41 commuters, 21.2%), 30 to 34 minutes (40 commuters, 20.7%), and 10 to 14 minutes (26 commuters, 13.5%).
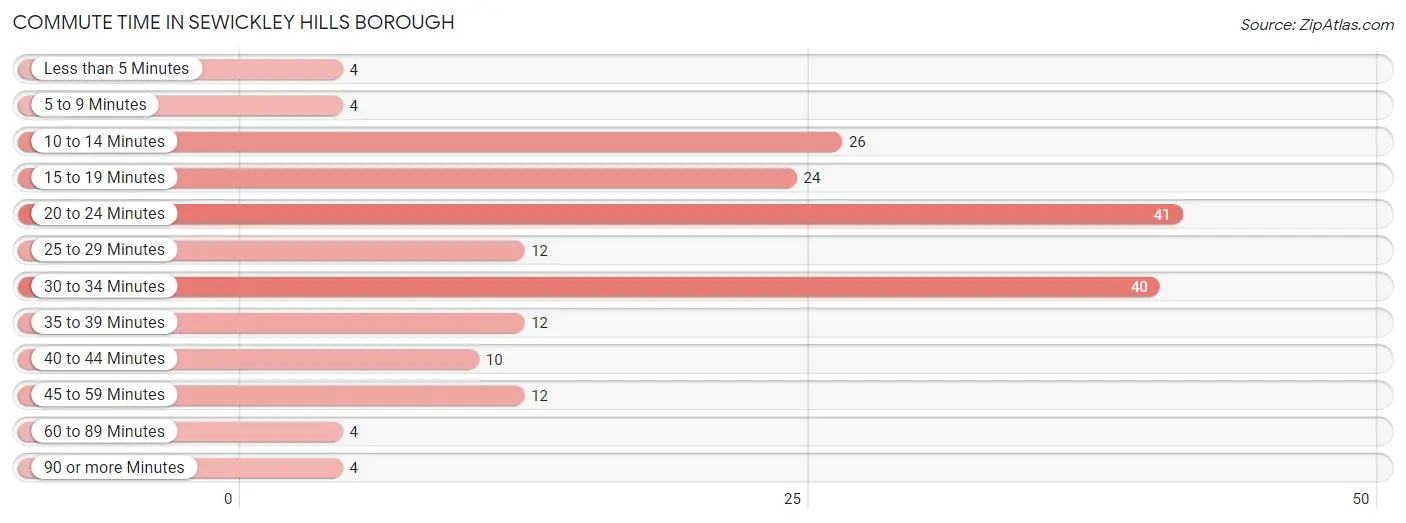
| Commute Time | # Commuters | % Commuters |
| Less than 5 Minutes | 4 | 2.1% |
| 5 to 9 Minutes | 4 | 2.1% |
| 10 to 14 Minutes | 26 | 13.5% |
| 15 to 19 Minutes | 24 | 12.4% |
| 20 to 24 Minutes | 41 | 21.2% |
| 25 to 29 Minutes | 12 | 6.2% |
| 30 to 34 Minutes | 40 | 20.7% |
| 35 to 39 Minutes | 12 | 6.2% |
| 40 to 44 Minutes | 10 | 5.2% |
| 45 to 59 Minutes | 12 | 6.2% |
| 60 to 89 Minutes | 4 | 2.1% |
| 90 or more Minutes | 4 | 2.1% |
Commute Time by Sex in Sewickley Hills borough
The most common commute times in Sewickley Hills borough are 20 to 24 minutes (28 commuters, 22.2%) for males and 20 to 24 minutes (13 commuters, 19.4%) for females.
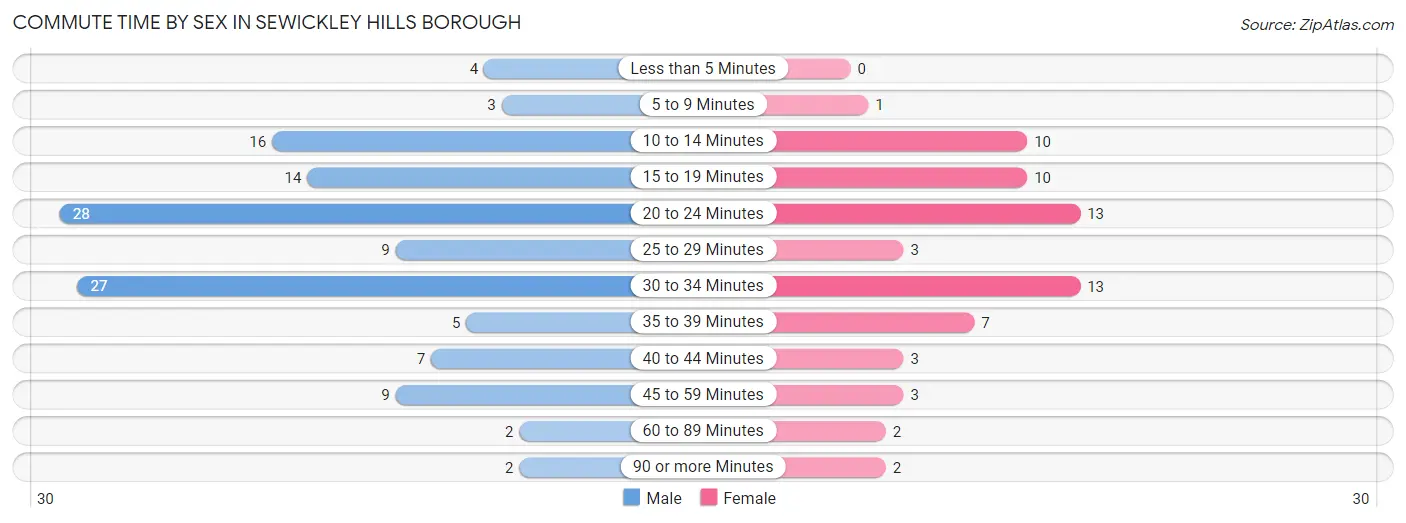
| Commute Time | Male | Female |
| Less than 5 Minutes | 4 (3.2%) | 0 (0.0%) |
| 5 to 9 Minutes | 3 (2.4%) | 1 (1.5%) |
| 10 to 14 Minutes | 16 (12.7%) | 10 (14.9%) |
| 15 to 19 Minutes | 14 (11.1%) | 10 (14.9%) |
| 20 to 24 Minutes | 28 (22.2%) | 13 (19.4%) |
| 25 to 29 Minutes | 9 (7.1%) | 3 (4.5%) |
| 30 to 34 Minutes | 27 (21.4%) | 13 (19.4%) |
| 35 to 39 Minutes | 5 (4.0%) | 7 (10.4%) |
| 40 to 44 Minutes | 7 (5.6%) | 3 (4.5%) |
| 45 to 59 Minutes | 9 (7.1%) | 3 (4.5%) |
| 60 to 89 Minutes | 2 (1.6%) | 2 (3.0%) |
| 90 or more Minutes | 2 (1.6%) | 2 (3.0%) |
Time of Departure to Work by Sex in Sewickley Hills borough
The most frequent times of departure to work in Sewickley Hills borough are 8:00 AM to 8:29 AM (31, 24.6%) for males and 7:00 AM to 7:29 AM (16, 23.9%) for females.
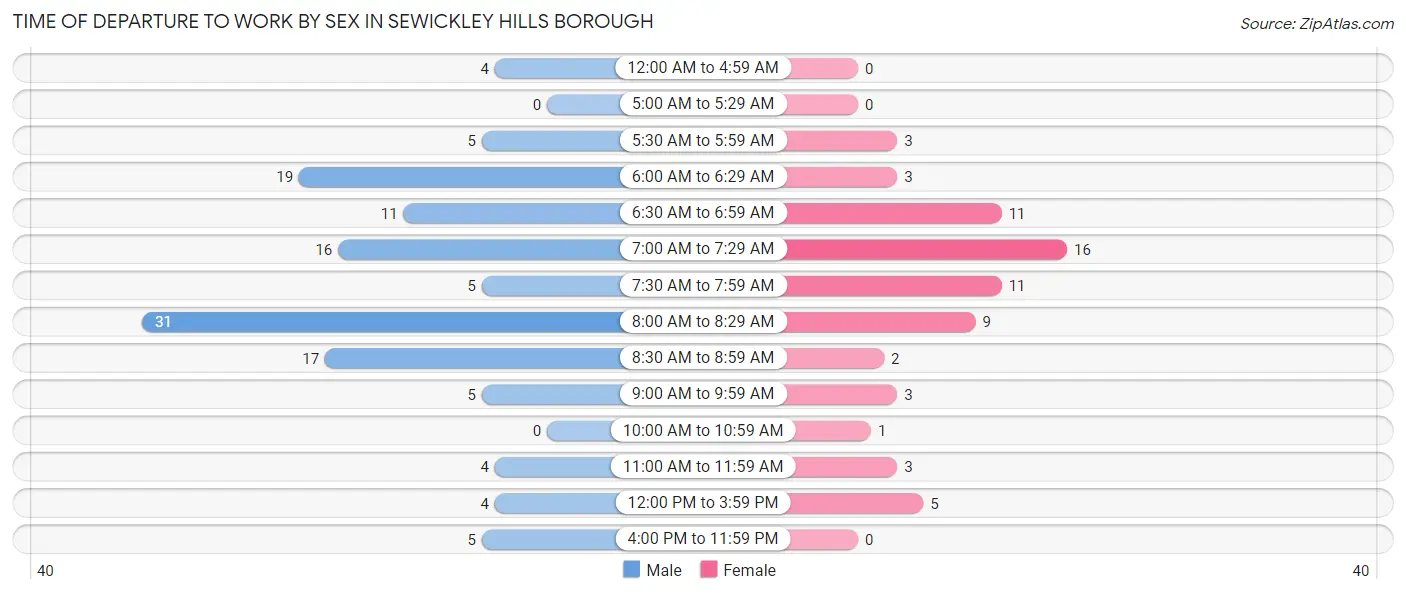
| Time of Departure | Male | Female |
| 12:00 AM to 4:59 AM | 4 (3.2%) | 0 (0.0%) |
| 5:00 AM to 5:29 AM | 0 (0.0%) | 0 (0.0%) |
| 5:30 AM to 5:59 AM | 5 (4.0%) | 3 (4.5%) |
| 6:00 AM to 6:29 AM | 19 (15.1%) | 3 (4.5%) |
| 6:30 AM to 6:59 AM | 11 (8.7%) | 11 (16.4%) |
| 7:00 AM to 7:29 AM | 16 (12.7%) | 16 (23.9%) |
| 7:30 AM to 7:59 AM | 5 (4.0%) | 11 (16.4%) |
| 8:00 AM to 8:29 AM | 31 (24.6%) | 9 (13.4%) |
| 8:30 AM to 8:59 AM | 17 (13.5%) | 2 (3.0%) |
| 9:00 AM to 9:59 AM | 5 (4.0%) | 3 (4.5%) |
| 10:00 AM to 10:59 AM | 0 (0.0%) | 1 (1.5%) |
| 11:00 AM to 11:59 AM | 4 (3.2%) | 3 (4.5%) |
| 12:00 PM to 3:59 PM | 4 (3.2%) | 5 (7.5%) |
| 4:00 PM to 11:59 PM | 5 (4.0%) | 0 (0.0%) |
| Total | 126 (100.0%) | 67 (100.0%) |
Housing Occupancy in Sewickley Hills borough
Occupancy by Ownership in Sewickley Hills borough
Of the total 264 dwellings in Sewickley Hills borough, owner-occupied units account for 258 (97.7%), while renter-occupied units make up 6 (2.3%).
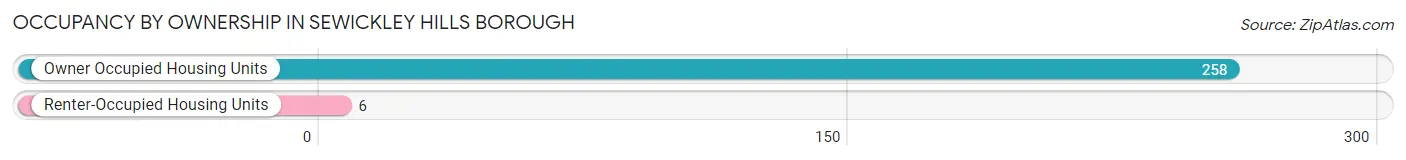
| Occupancy | # Housing Units | % Housing Units |
| Owner Occupied Housing Units | 258 | 97.7% |
| Renter-Occupied Housing Units | 6 | 2.3% |
| Total Occupied Housing Units | 264 | 100.0% |
Occupancy by Household Size in Sewickley Hills borough
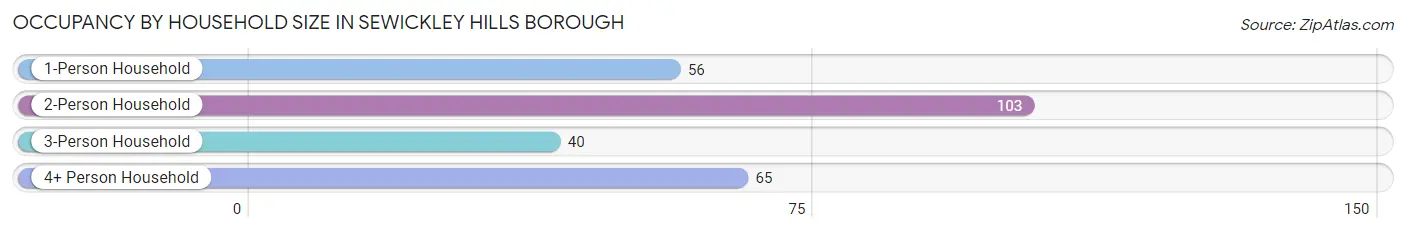
| Household Size | # Housing Units | % Housing Units |
| 1-Person Household | 56 | 21.2% |
| 2-Person Household | 103 | 39.0% |
| 3-Person Household | 40 | 15.1% |
| 4+ Person Household | 65 | 24.6% |
| Total Housing Units | 264 | 100.0% |
Occupancy by Ownership by Household Size in Sewickley Hills borough

| Household Size | Owner-occupied | Renter-occupied |
| 1-Person Household | 50 (89.3%) | 6 (10.7%) |
| 2-Person Household | 103 (100.0%) | 0 (0.0%) |
| 3-Person Household | 40 (100.0%) | 0 (0.0%) |
| 4+ Person Household | 65 (100.0%) | 0 (0.0%) |
| Total Housing Units | 258 (97.7%) | 6 (2.3%) |
Occupancy by Educational Attainment in Sewickley Hills borough
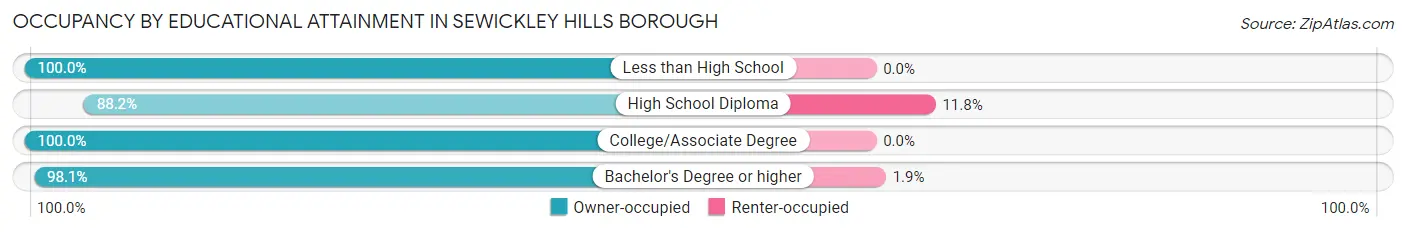
| Household Size | Owner-occupied | Renter-occupied |
| Less than High School | 10 (100.0%) | 0 (0.0%) |
| High School Diploma | 15 (88.2%) | 2 (11.8%) |
| College/Associate Degree | 26 (100.0%) | 0 (0.0%) |
| Bachelor's Degree or higher | 207 (98.1%) | 4 (1.9%) |
Occupancy by Age of Householder in Sewickley Hills borough
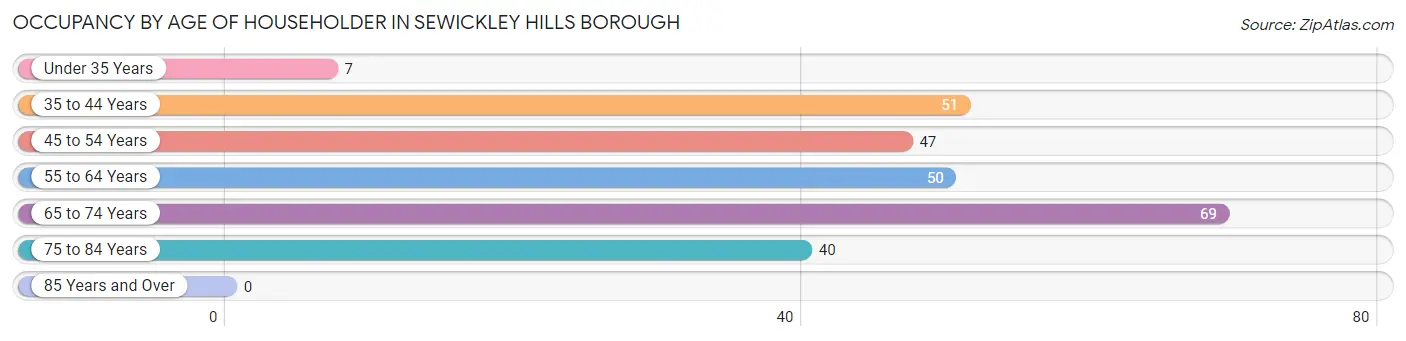
| Age Bracket | # Households | % Households |
| Under 35 Years | 7 | 2.6% |
| 35 to 44 Years | 51 | 19.3% |
| 45 to 54 Years | 47 | 17.8% |
| 55 to 64 Years | 50 | 18.9% |
| 65 to 74 Years | 69 | 26.1% |
| 75 to 84 Years | 40 | 15.1% |
| 85 Years and Over | 0 | 0.0% |
| Total | 264 | 100.0% |
Housing Finances in Sewickley Hills borough
Median Income by Occupancy in Sewickley Hills borough
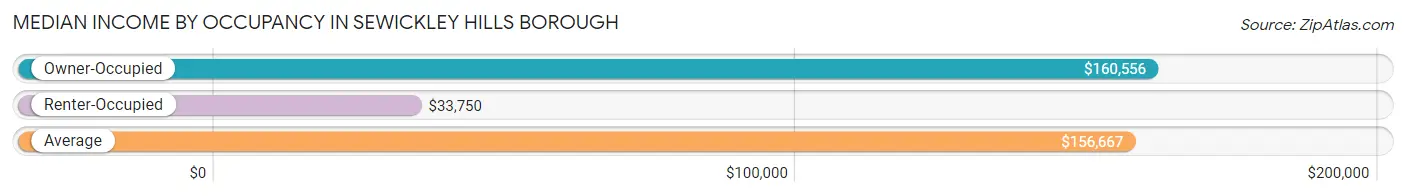
| Occupancy Type | # Households | Median Income |
| Owner-Occupied | 258 (97.7%) | $160,556 |
| Renter-Occupied | 6 (2.3%) | $33,750 |
| Average | 264 (100.0%) | $156,667 |
Occupancy by Householder Income Bracket in Sewickley Hills borough
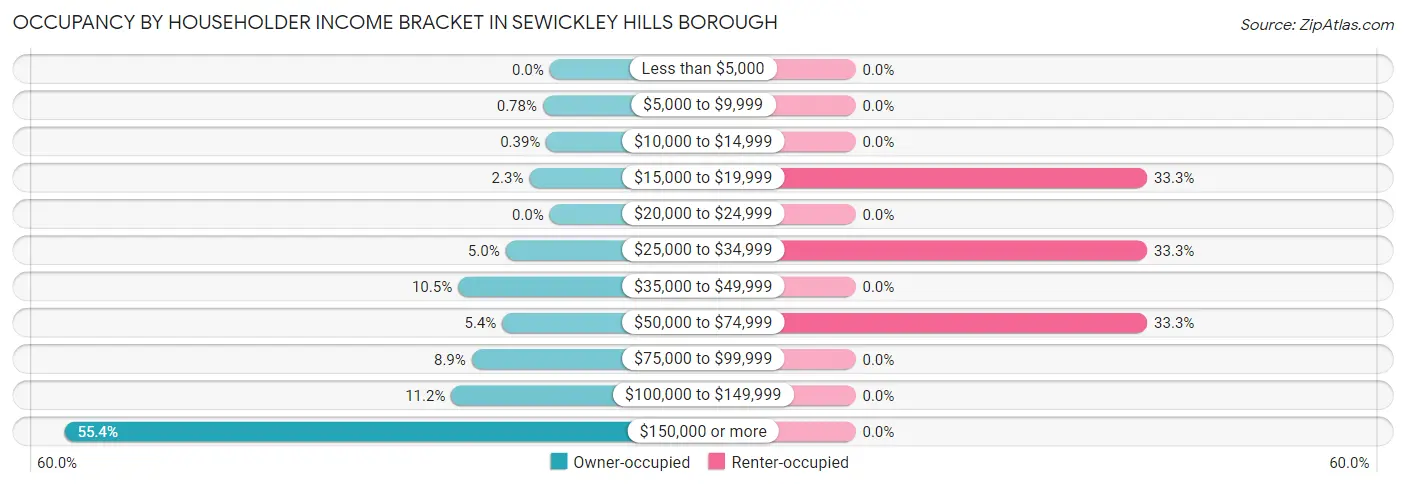
| Income Bracket | Owner-occupied | Renter-occupied |
| Less than $5,000 | 0 (0.0%) | 0 (0.0%) |
| $5,000 to $9,999 | 2 (0.8%) | 0 (0.0%) |
| $10,000 to $14,999 | 1 (0.4%) | 0 (0.0%) |
| $15,000 to $19,999 | 6 (2.3%) | 2 (33.3%) |
| $20,000 to $24,999 | 0 (0.0%) | 0 (0.0%) |
| $25,000 to $34,999 | 13 (5.0%) | 2 (33.3%) |
| $35,000 to $49,999 | 27 (10.5%) | 0 (0.0%) |
| $50,000 to $74,999 | 14 (5.4%) | 2 (33.3%) |
| $75,000 to $99,999 | 23 (8.9%) | 0 (0.0%) |
| $100,000 to $149,999 | 29 (11.2%) | 0 (0.0%) |
| $150,000 or more | 143 (55.4%) | 0 (0.0%) |
| Total | 258 (100.0%) | 6 (100.0%) |
Monthly Housing Cost Tiers in Sewickley Hills borough
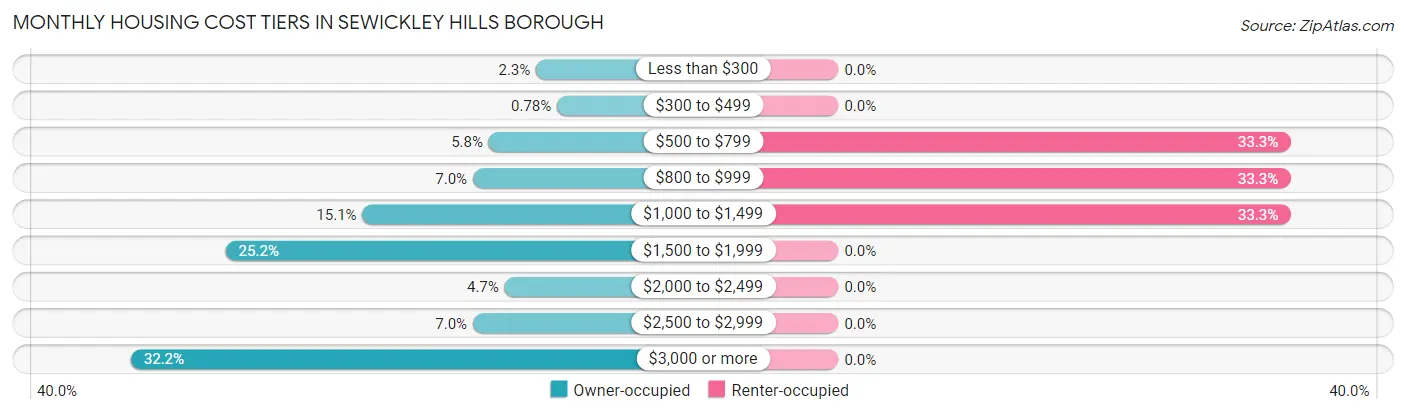
| Monthly Cost | Owner-occupied | Renter-occupied |
| Less than $300 | 6 (2.3%) | 0 (0.0%) |
| $300 to $499 | 2 (0.8%) | 0 (0.0%) |
| $500 to $799 | 15 (5.8%) | 2 (33.3%) |
| $800 to $999 | 18 (7.0%) | 2 (33.3%) |
| $1,000 to $1,499 | 39 (15.1%) | 2 (33.3%) |
| $1,500 to $1,999 | 65 (25.2%) | 0 (0.0%) |
| $2,000 to $2,499 | 12 (4.6%) | 0 (0.0%) |
| $2,500 to $2,999 | 18 (7.0%) | 0 (0.0%) |
| $3,000 or more | 83 (32.2%) | 0 (0.0%) |
| Total | 258 (100.0%) | 6 (100.0%) |
Physical Housing Characteristics in Sewickley Hills borough
Housing Structures in Sewickley Hills borough
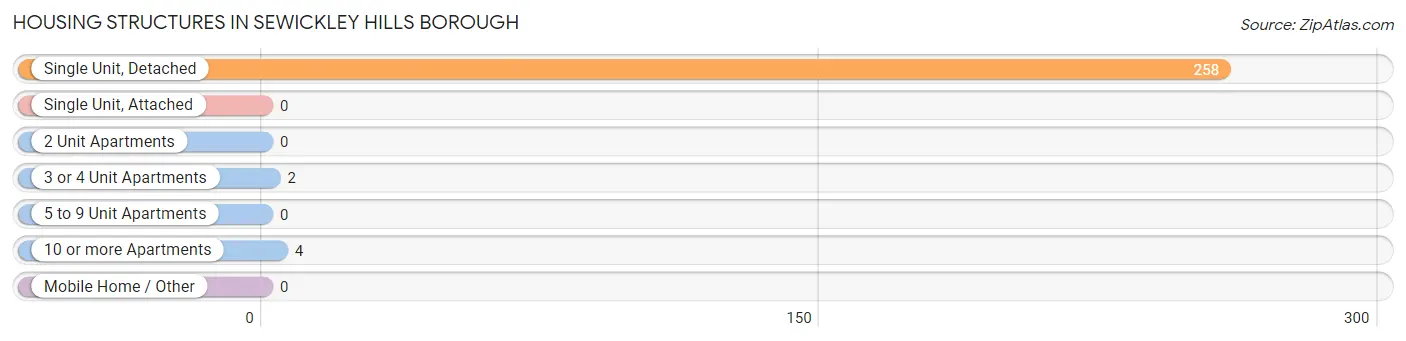
| Structure Type | # Housing Units | % Housing Units |
| Single Unit, Detached | 258 | 97.7% |
| Single Unit, Attached | 0 | 0.0% |
| 2 Unit Apartments | 0 | 0.0% |
| 3 or 4 Unit Apartments | 2 | 0.8% |
| 5 to 9 Unit Apartments | 0 | 0.0% |
| 10 or more Apartments | 4 | 1.5% |
| Mobile Home / Other | 0 | 0.0% |
| Total | 264 | 100.0% |
Housing Structures by Occupancy in Sewickley Hills borough
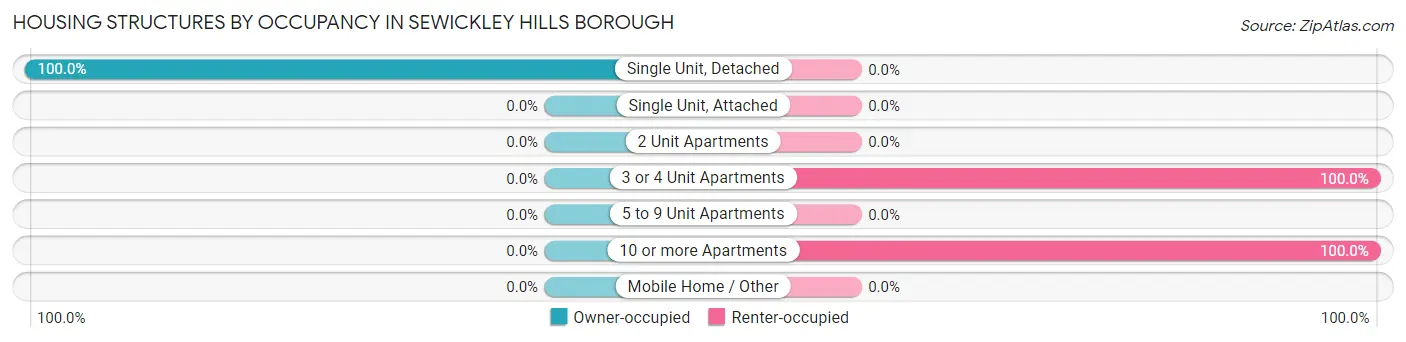
| Structure Type | Owner-occupied | Renter-occupied |
| Single Unit, Detached | 258 (100.0%) | 0 (0.0%) |
| Single Unit, Attached | 0 (0.0%) | 0 (0.0%) |
| 2 Unit Apartments | 0 (0.0%) | 0 (0.0%) |
| 3 or 4 Unit Apartments | 0 (0.0%) | 2 (100.0%) |
| 5 to 9 Unit Apartments | 0 (0.0%) | 0 (0.0%) |
| 10 or more Apartments | 0 (0.0%) | 4 (100.0%) |
| Mobile Home / Other | 0 (0.0%) | 0 (0.0%) |
| Total | 258 (97.7%) | 6 (2.3%) |
Housing Structures by Number of Rooms in Sewickley Hills borough
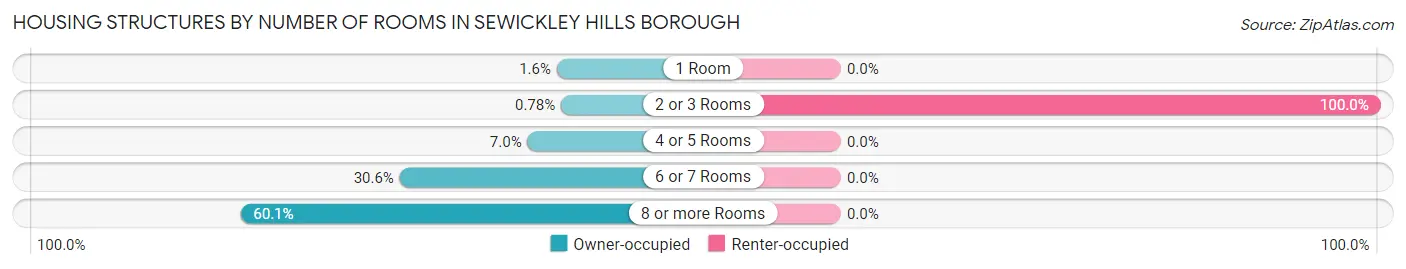
| Number of Rooms | Owner-occupied | Renter-occupied |
| 1 Room | 4 (1.5%) | 0 (0.0%) |
| 2 or 3 Rooms | 2 (0.8%) | 6 (100.0%) |
| 4 or 5 Rooms | 18 (7.0%) | 0 (0.0%) |
| 6 or 7 Rooms | 79 (30.6%) | 0 (0.0%) |
| 8 or more Rooms | 155 (60.1%) | 0 (0.0%) |
| Total | 258 (100.0%) | 6 (100.0%) |
Housing Structure by Heating Type in Sewickley Hills borough
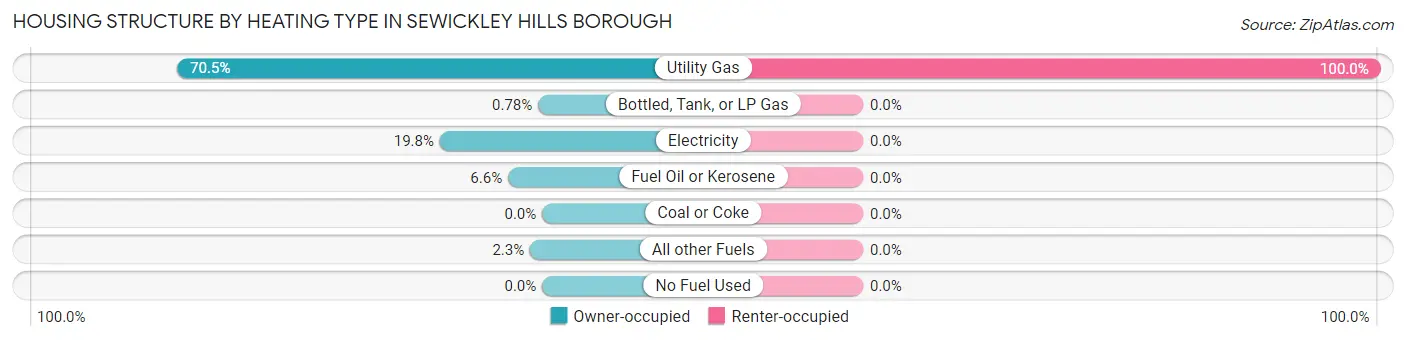
| Heating Type | Owner-occupied | Renter-occupied |
| Utility Gas | 182 (70.5%) | 6 (100.0%) |
| Bottled, Tank, or LP Gas | 2 (0.8%) | 0 (0.0%) |
| Electricity | 51 (19.8%) | 0 (0.0%) |
| Fuel Oil or Kerosene | 17 (6.6%) | 0 (0.0%) |
| Coal or Coke | 0 (0.0%) | 0 (0.0%) |
| All other Fuels | 6 (2.3%) | 0 (0.0%) |
| No Fuel Used | 0 (0.0%) | 0 (0.0%) |
| Total | 258 (100.0%) | 6 (100.0%) |
Household Vehicle Usage in Sewickley Hills borough
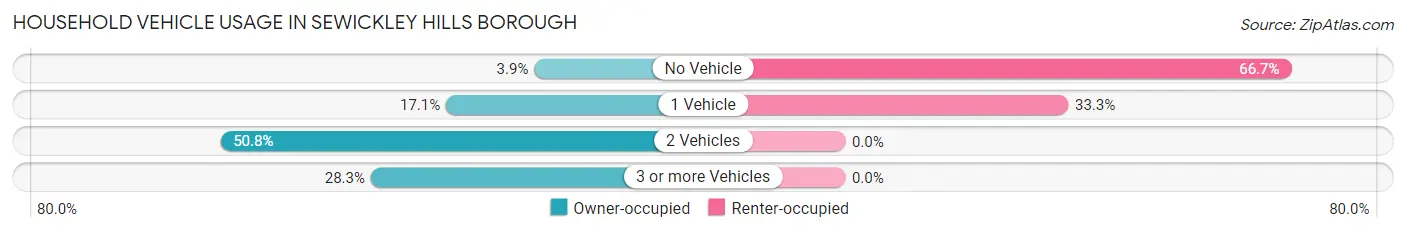
| Vehicles per Household | Owner-occupied | Renter-occupied |
| No Vehicle | 10 (3.9%) | 4 (66.7%) |
| 1 Vehicle | 44 (17.1%) | 2 (33.3%) |
| 2 Vehicles | 131 (50.8%) | 0 (0.0%) |
| 3 or more Vehicles | 73 (28.3%) | 0 (0.0%) |
| Total | 258 (100.0%) | 6 (100.0%) |
Real Estate & Mortgages in Sewickley Hills borough
Real Estate and Mortgage Overview in Sewickley Hills borough
| Characteristic | Without Mortgage | With Mortgage |
| Housing Units | 117 | 141 |
| Median Property Value | $376,900 | $603,100 |
| Median Household Income | $96,250 | $94 |
| Monthly Housing Costs | $1,094 | $83 |
| Real Estate Taxes | $7,317 | $0 |
Property Value by Mortgage Status in Sewickley Hills borough
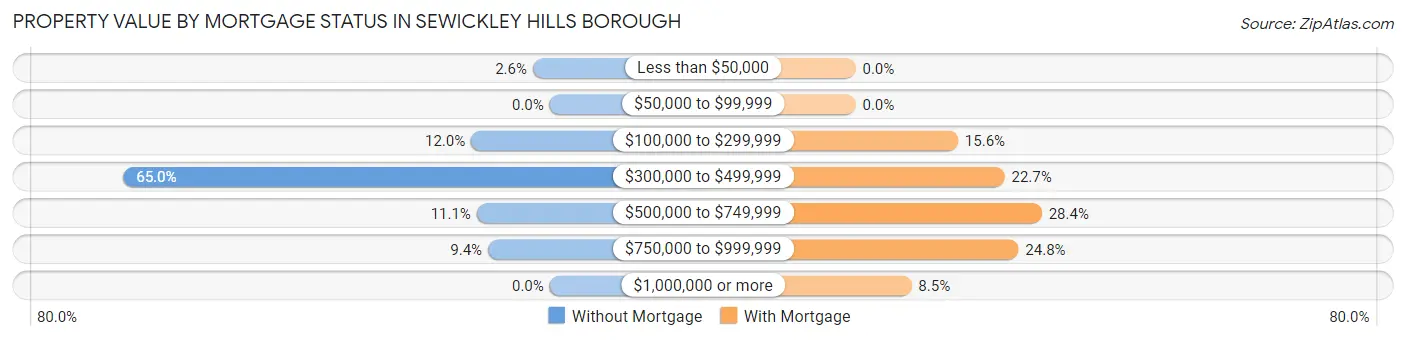
| Property Value | Without Mortgage | With Mortgage |
| Less than $50,000 | 3 (2.6%) | 0 (0.0%) |
| $50,000 to $99,999 | 0 (0.0%) | 0 (0.0%) |
| $100,000 to $299,999 | 14 (12.0%) | 22 (15.6%) |
| $300,000 to $499,999 | 76 (65.0%) | 32 (22.7%) |
| $500,000 to $749,999 | 13 (11.1%) | 40 (28.4%) |
| $750,000 to $999,999 | 11 (9.4%) | 35 (24.8%) |
| $1,000,000 or more | 0 (0.0%) | 12 (8.5%) |
| Total | 117 (100.0%) | 141 (100.0%) |
Household Income by Mortgage Status in Sewickley Hills borough
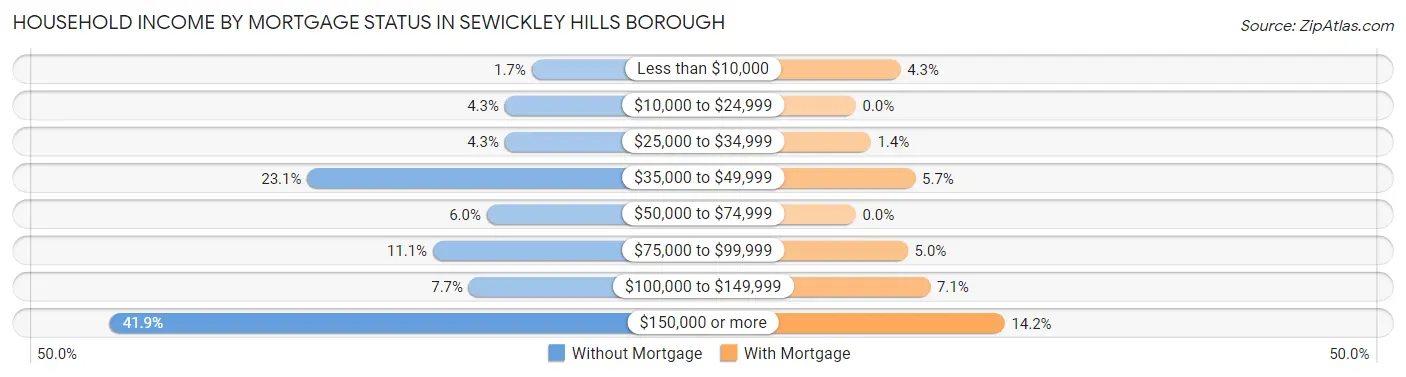
| Household Income | Without Mortgage | With Mortgage |
| Less than $10,000 | 2 (1.7%) | 6 (4.3%) |
| $10,000 to $24,999 | 5 (4.3%) | 0 (0.0%) |
| $25,000 to $34,999 | 5 (4.3%) | 2 (1.4%) |
| $35,000 to $49,999 | 27 (23.1%) | 8 (5.7%) |
| $50,000 to $74,999 | 7 (6.0%) | 0 (0.0%) |
| $75,000 to $99,999 | 13 (11.1%) | 7 (5.0%) |
| $100,000 to $149,999 | 9 (7.7%) | 10 (7.1%) |
| $150,000 or more | 49 (41.9%) | 20 (14.2%) |
| Total | 117 (100.0%) | 141 (100.0%) |
Property Value to Household Income Ratio in Sewickley Hills borough
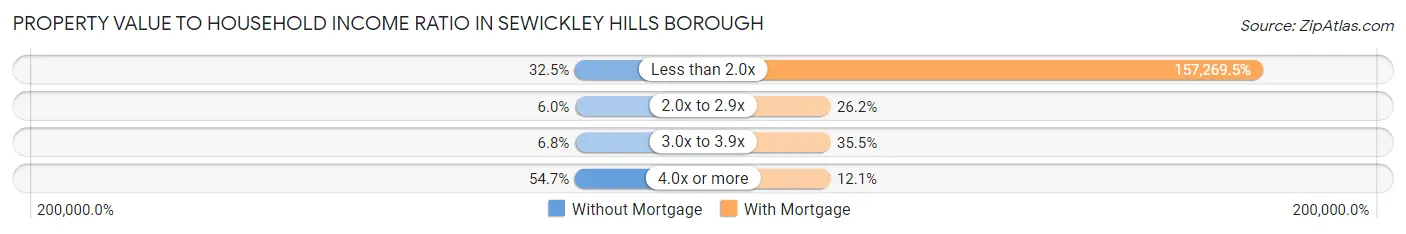
| Value-to-Income Ratio | Without Mortgage | With Mortgage |
| Less than 2.0x | 38 (32.5%) | 221,750 (157,269.5%) |
| 2.0x to 2.9x | 7 (6.0%) | 37 (26.2%) |
| 3.0x to 3.9x | 8 (6.8%) | 50 (35.5%) |
| 4.0x or more | 64 (54.7%) | 17 (12.1%) |
| Total | 117 (100.0%) | 141 (100.0%) |
Real Estate Taxes by Mortgage Status in Sewickley Hills borough
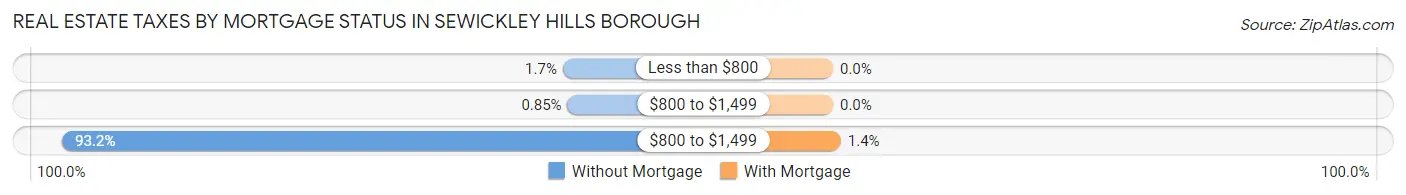
| Property Taxes | Without Mortgage | With Mortgage |
| Less than $800 | 2 (1.7%) | 0 (0.0%) |
| $800 to $1,499 | 1 (0.9%) | 0 (0.0%) |
| $800 to $1,499 | 109 (93.2%) | 2 (1.4%) |
| Total | 117 (100.0%) | 141 (100.0%) |
Health & Disability in Sewickley Hills borough
Health Insurance Coverage by Age in Sewickley Hills borough
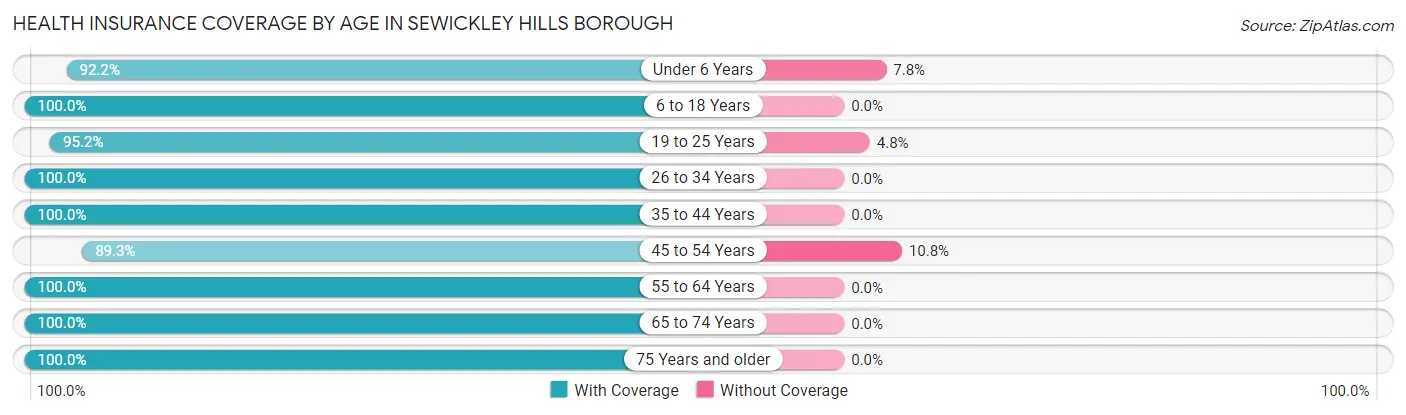
| Age Bracket | With Coverage | Without Coverage |
| Under 6 Years | 47 (92.2%) | 4 (7.8%) |
| 6 to 18 Years | 113 (100.0%) | 0 (0.0%) |
| 19 to 25 Years | 20 (95.2%) | 1 (4.8%) |
| 26 to 34 Years | 33 (100.0%) | 0 (0.0%) |
| 35 to 44 Years | 97 (100.0%) | 0 (0.0%) |
| 45 to 54 Years | 83 (89.2%) | 10 (10.7%) |
| 55 to 64 Years | 80 (100.0%) | 0 (0.0%) |
| 65 to 74 Years | 124 (100.0%) | 0 (0.0%) |
| 75 Years and older | 85 (100.0%) | 0 (0.0%) |
| Total | 682 (97.9%) | 15 (2.1%) |
Health Insurance Coverage by Citizenship Status in Sewickley Hills borough
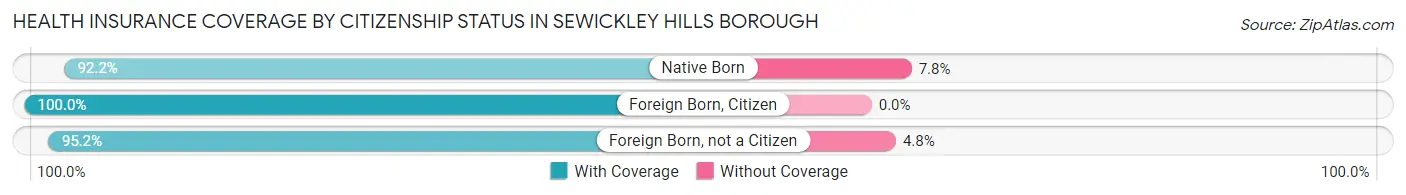
| Citizenship Status | With Coverage | Without Coverage |
| Native Born | 47 (92.2%) | 4 (7.8%) |
| Foreign Born, Citizen | 113 (100.0%) | 0 (0.0%) |
| Foreign Born, not a Citizen | 20 (95.2%) | 1 (4.8%) |
Health Insurance Coverage by Household Income in Sewickley Hills borough
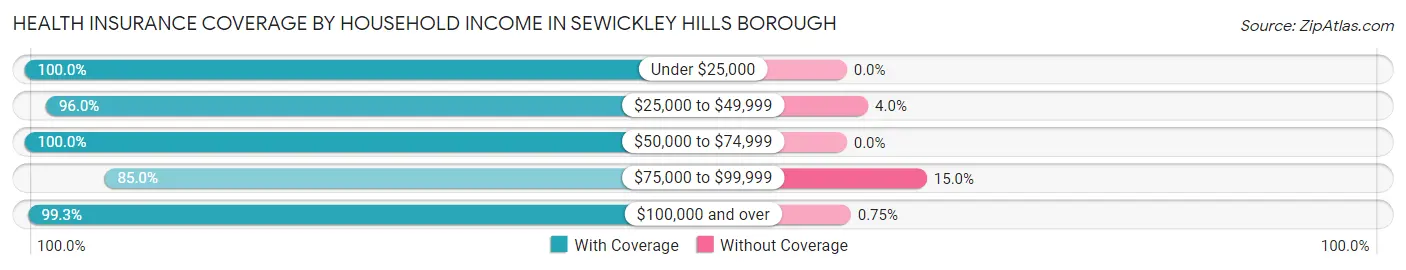
| Household Income | With Coverage | Without Coverage |
| Under $25,000 | 17 (100.0%) | 0 (0.0%) |
| $25,000 to $49,999 | 48 (96.0%) | 2 (4.0%) |
| $50,000 to $74,999 | 35 (100.0%) | 0 (0.0%) |
| $75,000 to $99,999 | 51 (85.0%) | 9 (15.0%) |
| $100,000 and over | 531 (99.3%) | 4 (0.7%) |
Public vs Private Health Insurance Coverage by Age in Sewickley Hills borough
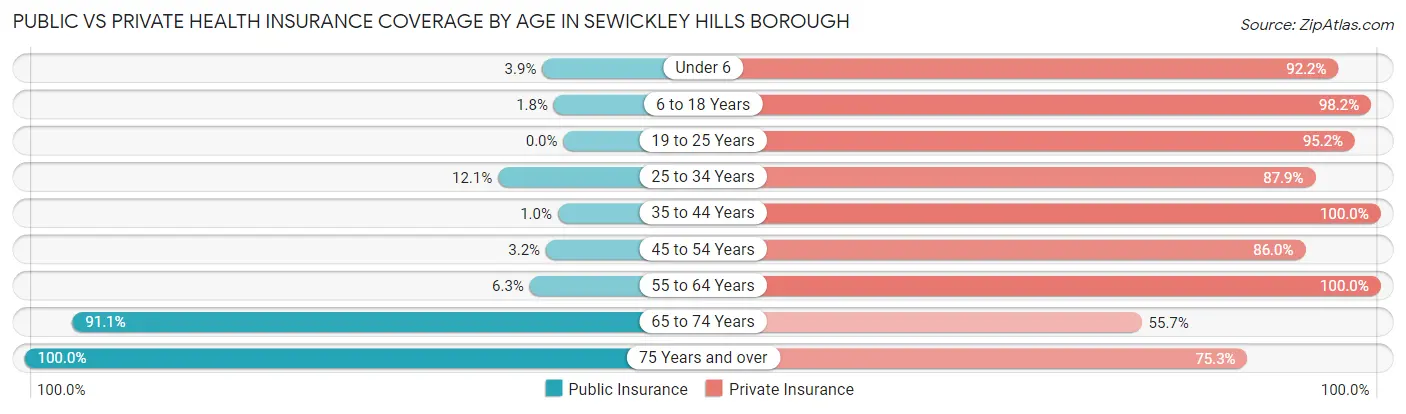
| Age Bracket | Public Insurance | Private Insurance |
| Under 6 | 2 (3.9%) | 47 (92.2%) |
| 6 to 18 Years | 2 (1.8%) | 111 (98.2%) |
| 19 to 25 Years | 0 (0.0%) | 20 (95.2%) |
| 25 to 34 Years | 4 (12.1%) | 29 (87.9%) |
| 35 to 44 Years | 1 (1.0%) | 97 (100.0%) |
| 45 to 54 Years | 3 (3.2%) | 80 (86.0%) |
| 55 to 64 Years | 5 (6.2%) | 80 (100.0%) |
| 65 to 74 Years | 113 (91.1%) | 69 (55.6%) |
| 75 Years and over | 85 (100.0%) | 64 (75.3%) |
| Total | 215 (30.8%) | 597 (85.7%) |
Disability Status by Sex by Age in Sewickley Hills borough
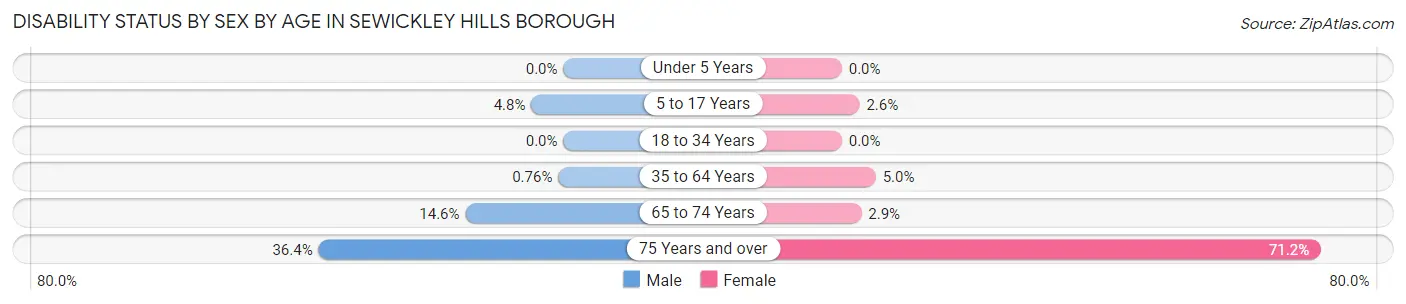
| Age Bracket | Male | Female |
| Under 5 Years | 0 (0.0%) | 0 (0.0%) |
| 5 to 17 Years | 2 (4.8%) | 2 (2.6%) |
| 18 to 34 Years | 0 (0.0%) | 0 (0.0%) |
| 35 to 64 Years | 1 (0.8%) | 7 (5.0%) |
| 65 to 74 Years | 8 (14.5%) | 2 (2.9%) |
| 75 Years and over | 12 (36.4%) | 37 (71.2%) |
Disability Class by Sex by Age in Sewickley Hills borough
Disability Class: Hearing Difficulty
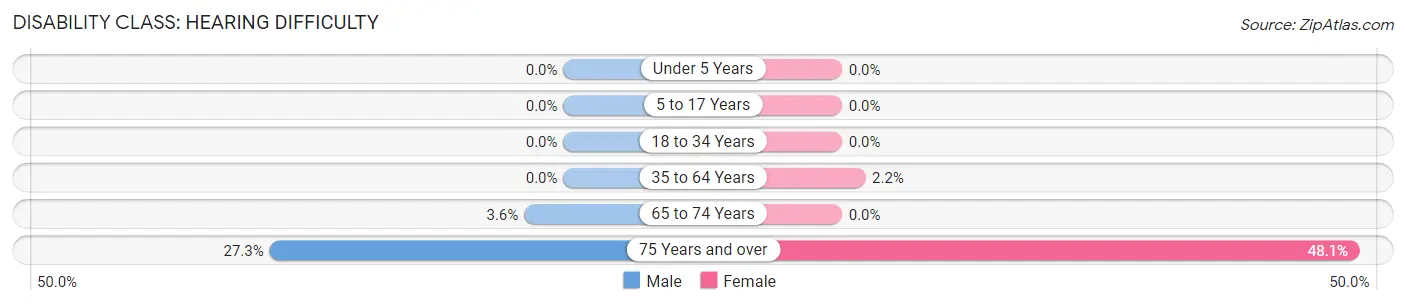
| Age Bracket | Male | Female |
| Under 5 Years | 0 (0.0%) | 0 (0.0%) |
| 5 to 17 Years | 0 (0.0%) | 0 (0.0%) |
| 18 to 34 Years | 0 (0.0%) | 0 (0.0%) |
| 35 to 64 Years | 0 (0.0%) | 3 (2.2%) |
| 65 to 74 Years | 2 (3.6%) | 0 (0.0%) |
| 75 Years and over | 9 (27.3%) | 25 (48.1%) |
Disability Class: Vision Difficulty
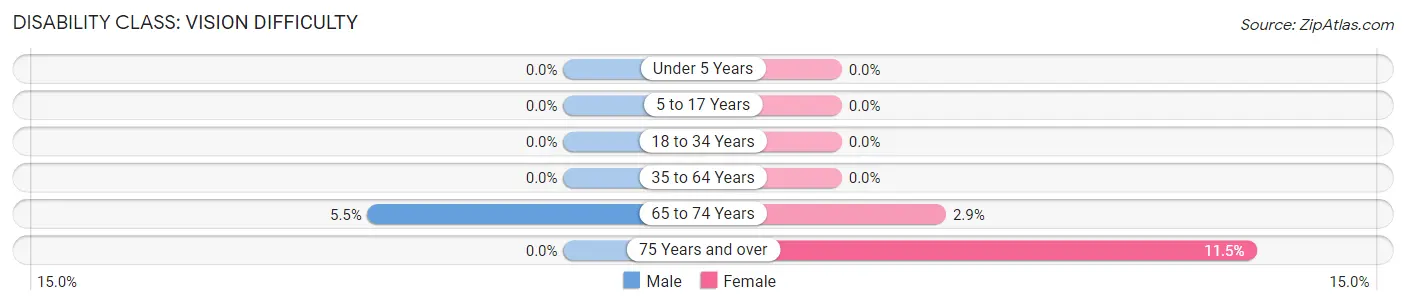
| Age Bracket | Male | Female |
| Under 5 Years | 0 (0.0%) | 0 (0.0%) |
| 5 to 17 Years | 0 (0.0%) | 0 (0.0%) |
| 18 to 34 Years | 0 (0.0%) | 0 (0.0%) |
| 35 to 64 Years | 0 (0.0%) | 0 (0.0%) |
| 65 to 74 Years | 3 (5.4%) | 2 (2.9%) |
| 75 Years and over | 0 (0.0%) | 6 (11.5%) |
Disability Class: Cognitive Difficulty
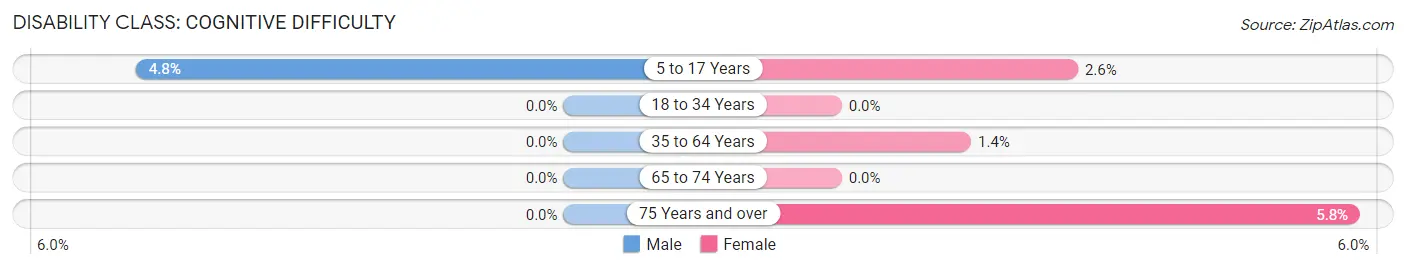
| Age Bracket | Male | Female |
| 5 to 17 Years | 2 (4.8%) | 2 (2.6%) |
| 18 to 34 Years | 0 (0.0%) | 0 (0.0%) |
| 35 to 64 Years | 0 (0.0%) | 2 (1.4%) |
| 65 to 74 Years | 0 (0.0%) | 0 (0.0%) |
| 75 Years and over | 0 (0.0%) | 3 (5.8%) |
Disability Class: Ambulatory Difficulty
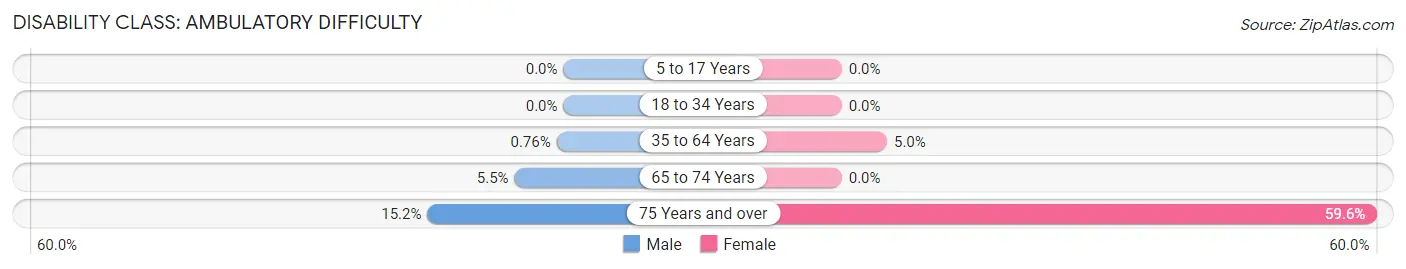
| Age Bracket | Male | Female |
| 5 to 17 Years | 0 (0.0%) | 0 (0.0%) |
| 18 to 34 Years | 0 (0.0%) | 0 (0.0%) |
| 35 to 64 Years | 1 (0.8%) | 7 (5.0%) |
| 65 to 74 Years | 3 (5.4%) | 0 (0.0%) |
| 75 Years and over | 5 (15.1%) | 31 (59.6%) |
Disability Class: Self-Care Difficulty
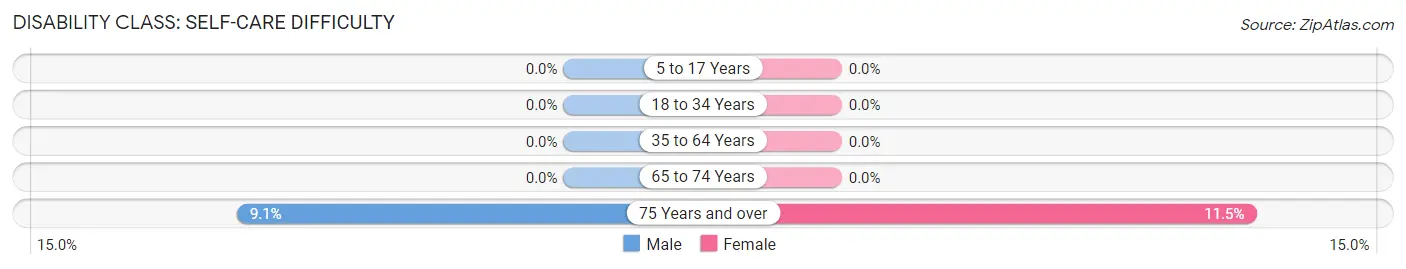
| Age Bracket | Male | Female |
| 5 to 17 Years | 0 (0.0%) | 0 (0.0%) |
| 18 to 34 Years | 0 (0.0%) | 0 (0.0%) |
| 35 to 64 Years | 0 (0.0%) | 0 (0.0%) |
| 65 to 74 Years | 0 (0.0%) | 0 (0.0%) |
| 75 Years and over | 3 (9.1%) | 6 (11.5%) |
Technology Access in Sewickley Hills borough
Computing Device Access in Sewickley Hills borough
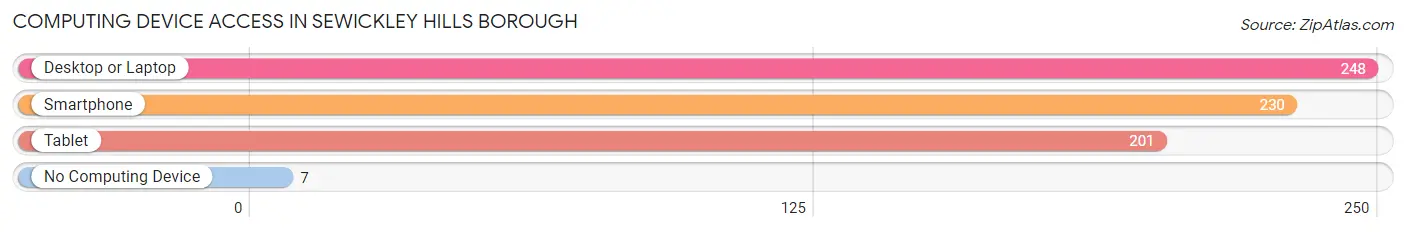
| Device Type | # Households | % Households |
| Desktop or Laptop | 248 | 93.9% |
| Smartphone | 230 | 87.1% |
| Tablet | 201 | 76.1% |
| No Computing Device | 7 | 2.6% |
| Total | 264 | 100.0% |
Internet Access in Sewickley Hills borough
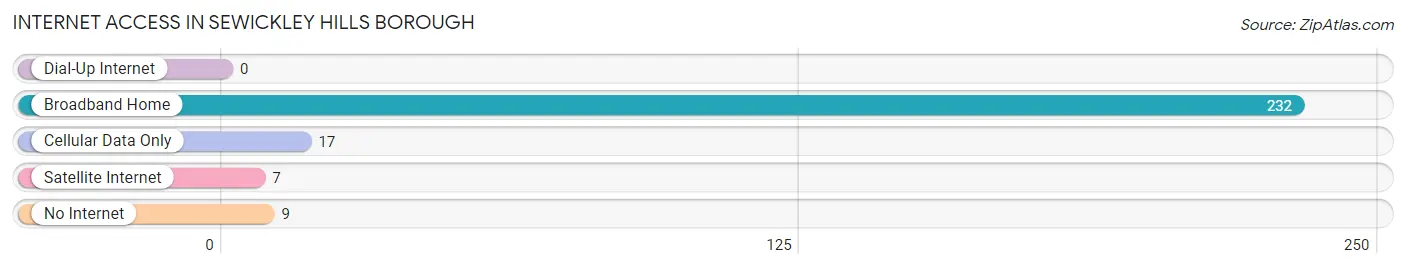
| Internet Type | # Households | % Households |
| Dial-Up Internet | 0 | 0.0% |
| Broadband Home | 232 | 87.9% |
| Cellular Data Only | 17 | 6.4% |
| Satellite Internet | 7 | 2.6% |
| No Internet | 9 | 3.4% |
| Total | 264 | 100.0% |
Sewickley Hills borough Summary
Sewickley Hills Borough is a small borough located in Allegheny County, Pennsylvania. It is situated in the northern part of the county, just south of the city of Pittsburgh. The borough is bordered by the boroughs of Edgeworth, Glen Osborne, Sewickley, and Sewickley Heights. The population of Sewickley Hills Borough was 1,845 at the 2010 census.
History
Sewickley Hills Borough was incorporated in 1892. The area was originally part of the Sewickley Township, which was established in 1788. The area was first settled by the Sewickley family in the late 1700s. The family owned a large tract of land in the area, which was eventually divided into smaller parcels and sold off.
The borough was named after the Sewickley family, who were prominent in the area. The family owned a large tract of land in the area, which was eventually divided into smaller parcels and sold off.
The borough was originally a rural farming community, but in the late 19th century, the area began to experience rapid growth due to the development of the railroad. The railroad allowed for the transportation of goods and people to and from the area, which led to an increase in population and economic activity.
Geography
Sewickley Hills Borough is located in northern Allegheny County, Pennsylvania. It is situated in the northern part of the county, just south of the city of Pittsburgh. The borough is bordered by the boroughs of Edgeworth, Glen Osborne, Sewickley, and Sewickley Heights.
The borough has a total area of 1.2 square miles, all of which is land. The borough is located in the Allegheny Plateau region of Pennsylvania, and is characterized by rolling hills and valleys. The borough is located in the Ohio River watershed.
Economy
Sewickley Hills Borough is primarily a residential community, with most of the population employed in the service sector. The borough is home to several small businesses, including restaurants, retail stores, and professional services.
The borough is also home to several large employers, including the Sewickley Valley Hospital, the Sewickley Valley YMCA, and the Sewickley Valley Country Club. The borough is also home to several educational institutions, including the Sewickley Academy, the Sewickley Valley School District, and the Sewickley Valley Christian Academy.
Demographics
As of the 2010 census, the population of Sewickley Hills Borough was 1,845. The racial makeup of the borough was 94.3% White, 2.2% African American, 0.2% Native American, 1.2% Asian, 0.1% Pacific Islander, 0.7% from other races, and 1.5% from two or more races. Hispanic or Latino of any race were 1.7% of the population.
The median income for a household in the borough was $68,958, and the median income for a family was $77,917. The per capita income for the borough was $35,945. About 4.2% of families and 5.2% of the population were below the poverty line, including 6.3% of those under age 18 and 4.2% of those age 65 or over.
Common Questions
What is Per Capita Income in Sewickley Hills borough?
Per Capita income in Sewickley Hills borough is $81,576.
What is the Median Family Income in Sewickley Hills borough?
Median Family Income in Sewickley Hills borough is $206,250.
What is the Median Household income in Sewickley Hills borough?
Median Household Income in Sewickley Hills borough is $156,667.
What is Income or Wage Gap in Sewickley Hills borough?
Income or Wage Gap in Sewickley Hills borough is 20.5%.
Women in Sewickley Hills borough earn 79.5 cents for every dollar earned by a man.
What is Inequality or Gini Index in Sewickley Hills borough?
Inequality or Gini Index in Sewickley Hills borough is 0.45.
What is the Total Population of Sewickley Hills borough?
Total Population of Sewickley Hills borough is 697.
What is the Total Male Population of Sewickley Hills borough?
Total Male Population of Sewickley Hills borough is 314.
What is the Total Female Population of Sewickley Hills borough?
Total Female Population of Sewickley Hills borough is 383.
What is the Ratio of Males per 100 Females in Sewickley Hills borough?
There are 81.98 Males per 100 Females in Sewickley Hills borough.
What is the Ratio of Females per 100 Males in Sewickley Hills borough?
There are 121.97 Females per 100 Males in Sewickley Hills borough.
What is the Median Population Age in Sewickley Hills borough?
Median Population Age in Sewickley Hills borough is 49.5 Years.
What is the Average Family Size in Sewickley Hills borough
Average Family Size in Sewickley Hills borough is 3.1 People.
What is the Average Household Size in Sewickley Hills borough
Average Household Size in Sewickley Hills borough is 2.6 People.
How Large is the Labor Force in Sewickley Hills borough?
There are 284 People in the Labor Forcein in Sewickley Hills borough.
What is the Percentage of People in the Labor Force in Sewickley Hills borough?
51.6% of People are in the Labor Force in Sewickley Hills borough.
What is the Unemployment Rate in Sewickley Hills borough?
Unemployment Rate in Sewickley Hills borough is 4.6%.