Hickory, PA Map & Demographics
Hickory Map
Hickory Overview
$36,335
PER CAPITA INCOME
$105,481
AVG FAMILY INCOME
$75,511
AVG HOUSEHOLD INCOME
0.42
INEQUALITY / GINI INDEX
636
TOTAL POPULATION
358
MALE POPULATION
278
FEMALE POPULATION
128.78
MALES / 100 FEMALES
77.65
FEMALES / 100 MALES
41.4
MEDIAN AGE
3.4
AVG FAMILY SIZE
2.6
AVG HOUSEHOLD SIZE
206
LABOR FORCE [ PEOPLE ]
39.3%
PERCENT IN LABOR FORCE
Hickory Zip Codes
Hickory Area Codes
Income in Hickory
Income Overview in Hickory
Per Capita Income in Hickory is $36,335, while median incomes of families and households are $105,481 and $75,511 respectively.
| Characteristic | Number | Measure |
| Per Capita Income | 636 | $36,335 |
| Median Family Income | 163 | $105,481 |
| Mean Family Income | 163 | $113,107 |
| Median Household Income | 245 | $75,511 |
| Mean Household Income | 245 | $95,263 |
| Income Deficit | 163 | $0 |
| Wage / Income Gap (%) | 636 | 0.00% |
| Wage / Income Gap ($) | 636 | 100.00¢ per $1 |
| Gini / Inequality Index | 636 | 0.42 |
Earnings by Sex in Hickory
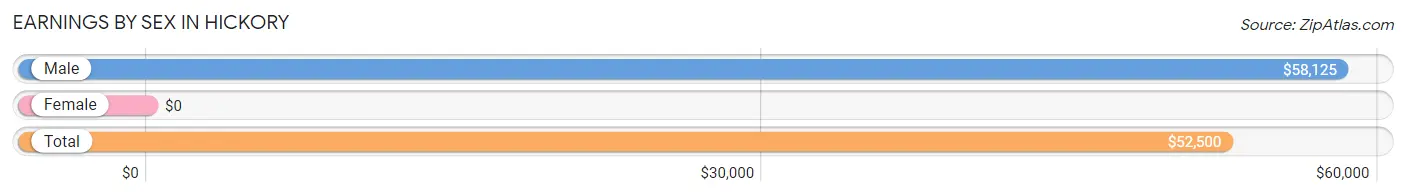
| Sex | Number | Average Earnings |
| Male | 128 (51.2%) | $58,125 |
| Female | 122 (48.8%) | $0 |
| Total | 250 (100.0%) | $52,500 |
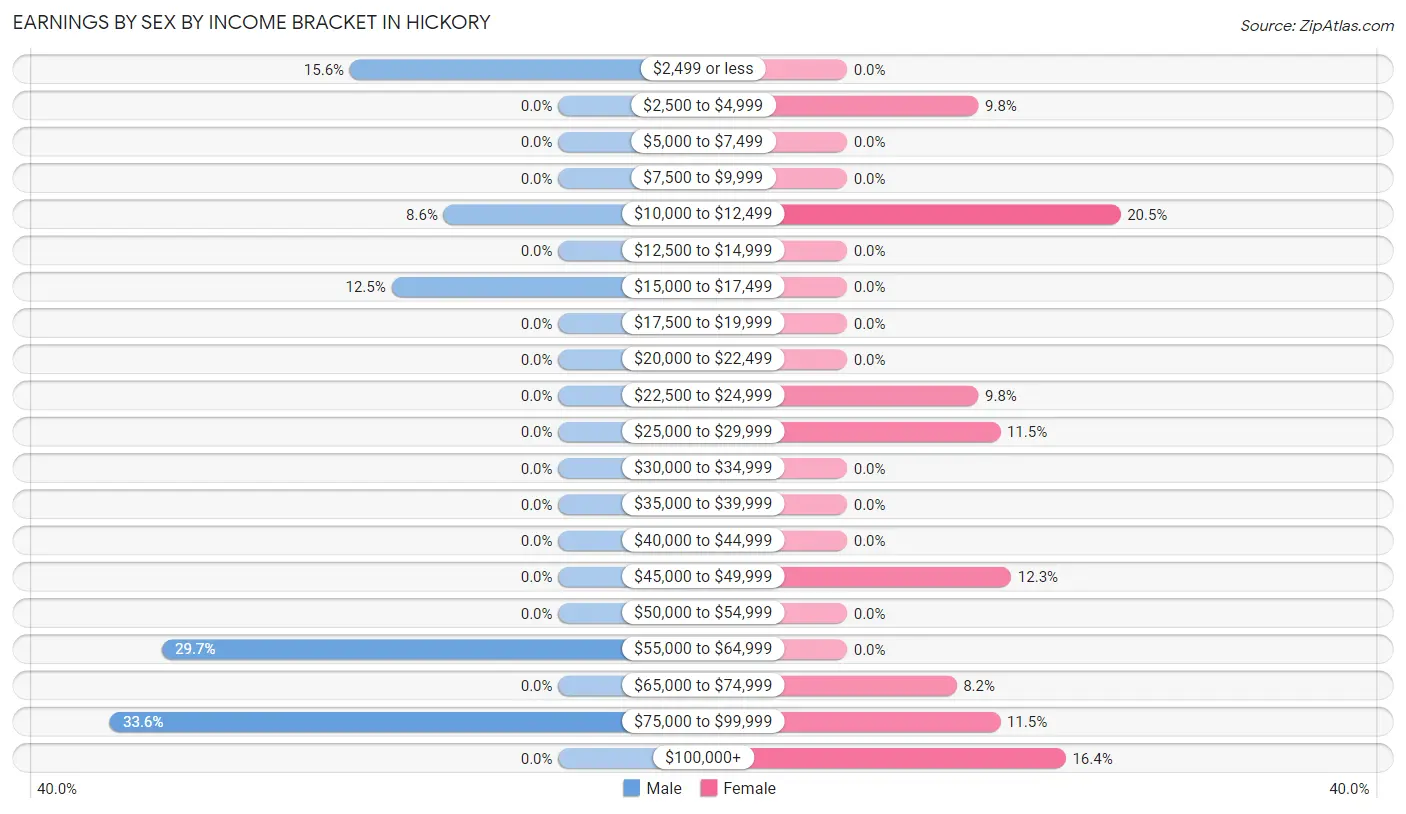
Earnings by Sex by Income Bracket in Hickory
The most common earnings brackets in Hickory are $75,000 to $99,999 for men (43 | 33.6%) and $10,000 to $12,499 for women (25 | 20.5%).
| Income | Male | Female |
| $2,499 or less | 20 (15.6%) | 0 (0.0%) |
| $2,500 to $4,999 | 0 (0.0%) | 12 (9.8%) |
| $5,000 to $7,499 | 0 (0.0%) | 0 (0.0%) |
| $7,500 to $9,999 | 0 (0.0%) | 0 (0.0%) |
| $10,000 to $12,499 | 11 (8.6%) | 25 (20.5%) |
| $12,500 to $14,999 | 0 (0.0%) | 0 (0.0%) |
| $15,000 to $17,499 | 16 (12.5%) | 0 (0.0%) |
| $17,500 to $19,999 | 0 (0.0%) | 0 (0.0%) |
| $20,000 to $22,499 | 0 (0.0%) | 0 (0.0%) |
| $22,500 to $24,999 | 0 (0.0%) | 12 (9.8%) |
| $25,000 to $29,999 | 0 (0.0%) | 14 (11.5%) |
| $30,000 to $34,999 | 0 (0.0%) | 0 (0.0%) |
| $35,000 to $39,999 | 0 (0.0%) | 0 (0.0%) |
| $40,000 to $44,999 | 0 (0.0%) | 0 (0.0%) |
| $45,000 to $49,999 | 0 (0.0%) | 15 (12.3%) |
| $50,000 to $54,999 | 0 (0.0%) | 0 (0.0%) |
| $55,000 to $64,999 | 38 (29.7%) | 0 (0.0%) |
| $65,000 to $74,999 | 0 (0.0%) | 10 (8.2%) |
| $75,000 to $99,999 | 43 (33.6%) | 14 (11.5%) |
| $100,000+ | 0 (0.0%) | 20 (16.4%) |
| Total | 128 (100.0%) | 122 (100.0%) |
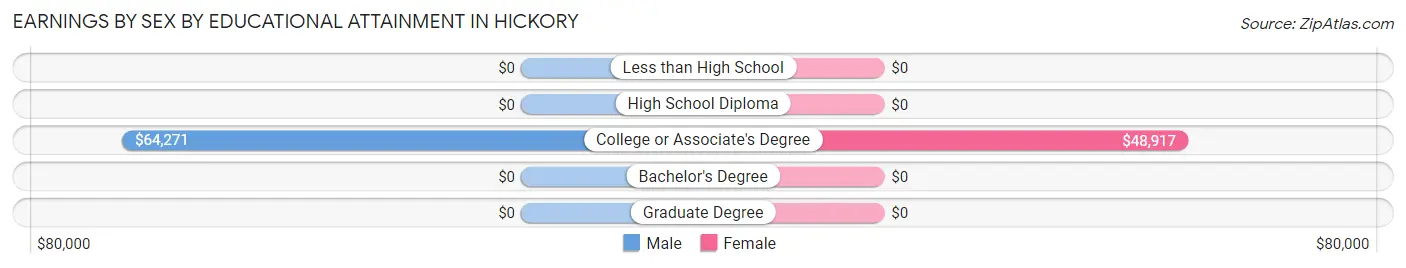
Earnings by Sex by Educational Attainment in Hickory
Average earnings in Hickory are $59,063 for men and $48,250 for women, a difference of 18.3%. Men with an educational attainment of college or associate's degree enjoy the highest average annual earnings of $64,271, while those with college or associate's degree education earn the least with $64,271. Women with an educational attainment of college or associate's degree earn the most with the average annual earnings of $48,917, while those with college or associate's degree education have the smallest earnings of $48,917.
| Educational Attainment | Male Income | Female Income |
| Less than High School | - | - |
| High School Diploma | - | - |
| College or Associate's Degree | $64,271 | $48,917 |
| Bachelor's Degree | - | - |
| Graduate Degree | - | - |
| Total | $59,063 | $48,250 |
Family Income in Hickory
Family Income Brackets in Hickory
According to the Hickory family income data, there are 36 families falling into the $35,000 to $49,999 income range, which is the most common income bracket and makes up 22.1% of all families.
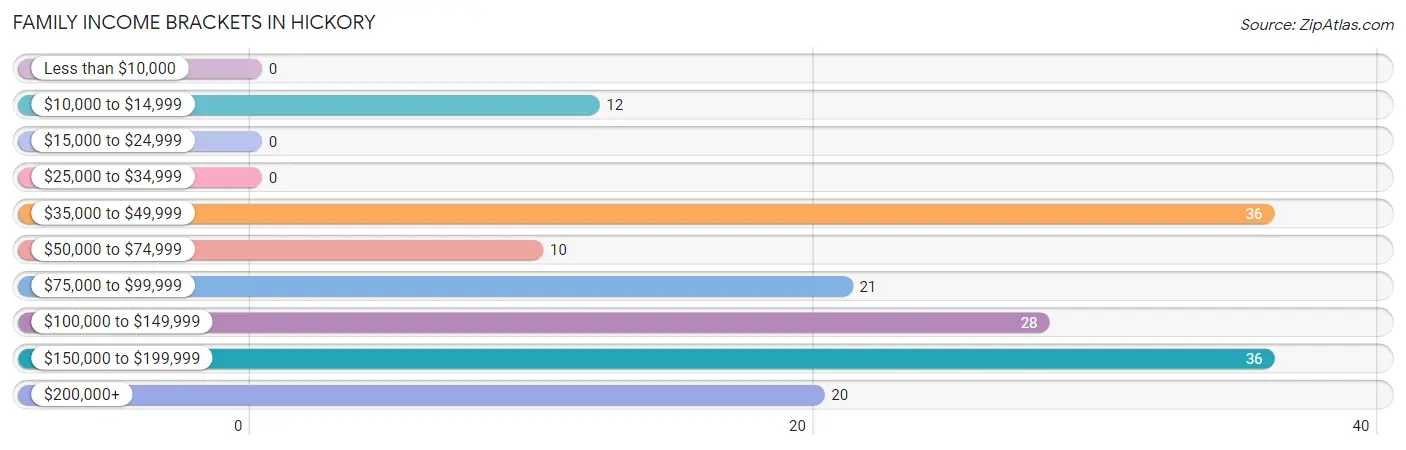
| Income Bracket | # Families | % Families |
| Less than $10,000 | 0 | 0.0% |
| $10,000 to $14,999 | 12 | 7.4% |
| $15,000 to $24,999 | 0 | 0.0% |
| $25,000 to $34,999 | 0 | 0.0% |
| $35,000 to $49,999 | 36 | 22.1% |
| $50,000 to $74,999 | 10 | 6.1% |
| $75,000 to $99,999 | 21 | 12.9% |
| $100,000 to $149,999 | 28 | 17.2% |
| $150,000 to $199,999 | 36 | 22.1% |
| $200,000+ | 20 | 12.3% |
Family Income by Famaliy Size in Hickory
4-person families (60 | 36.8%) account for the highest median family income in Hickory with $155,714 per family, while 4-person families (60 | 36.8%) have the highest median income of $38,928 per family member.
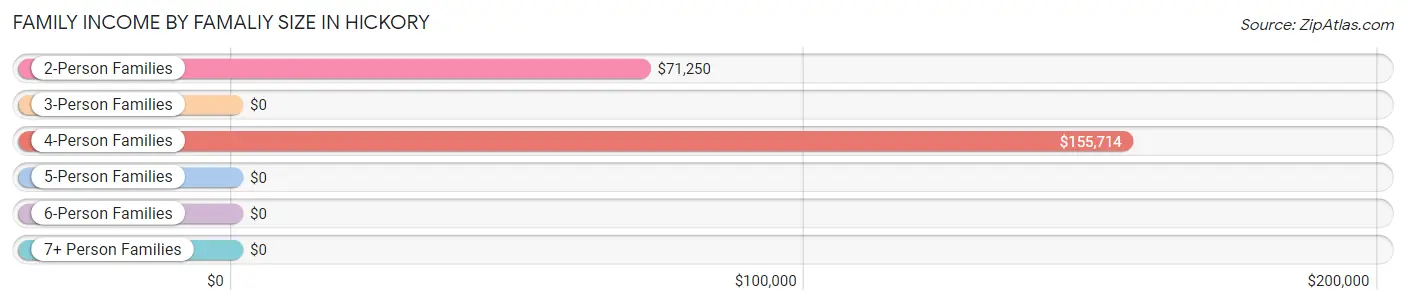
| Income Bracket | # Families | Median Income |
| 2-Person Families | 66 (40.5%) | $71,250 |
| 3-Person Families | 11 (6.8%) | $0 |
| 4-Person Families | 60 (36.8%) | $155,714 |
| 5-Person Families | 26 (16.0%) | $0 |
| 6-Person Families | 0 (0.0%) | $0 |
| 7+ Person Families | 0 (0.0%) | $0 |
| Total | 163 (100.0%) | $105,481 |
Family Income by Number of Earners in Hickory
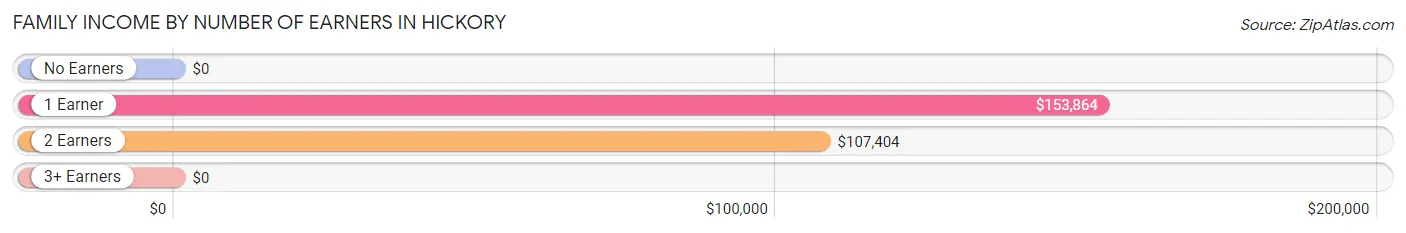
| Number of Earners | # Families | Median Income |
| No Earners | 32 (19.6%) | $0 |
| 1 Earner | 32 (19.6%) | $153,864 |
| 2 Earners | 99 (60.7%) | $107,404 |
| 3+ Earners | 0 (0.0%) | $0 |
| Total | 163 (100.0%) | $105,481 |
Household Income in Hickory
Household Income Brackets in Hickory
With 48 households falling in the category, the $150,000 to $199,999 income range is the most frequent in Hickory, accounting for 19.6% of all households.
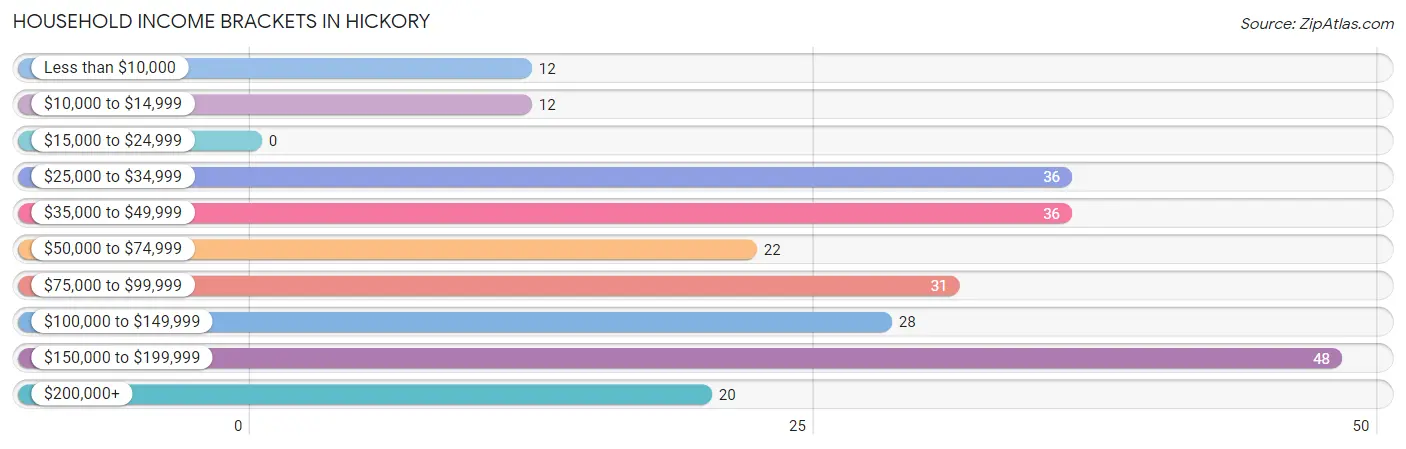
| Income Bracket | # Households | % Households |
| Less than $10,000 | 12 | 4.9% |
| $10,000 to $14,999 | 12 | 4.9% |
| $15,000 to $24,999 | 0 | 0.0% |
| $25,000 to $34,999 | 36 | 14.7% |
| $35,000 to $49,999 | 36 | 14.7% |
| $50,000 to $74,999 | 22 | 9.0% |
| $75,000 to $99,999 | 31 | 12.7% |
| $100,000 to $149,999 | 28 | 11.4% |
| $150,000 to $199,999 | 48 | 19.6% |
| $200,000+ | 20 | 8.2% |
Household Income by Householder Age in Hickory
The median household income in Hickory is $75,511, with the highest median household income of $106,442 found in the 45 to 64 years age bracket for the primary householder. A total of 81 households (33.1%) fall into this category.
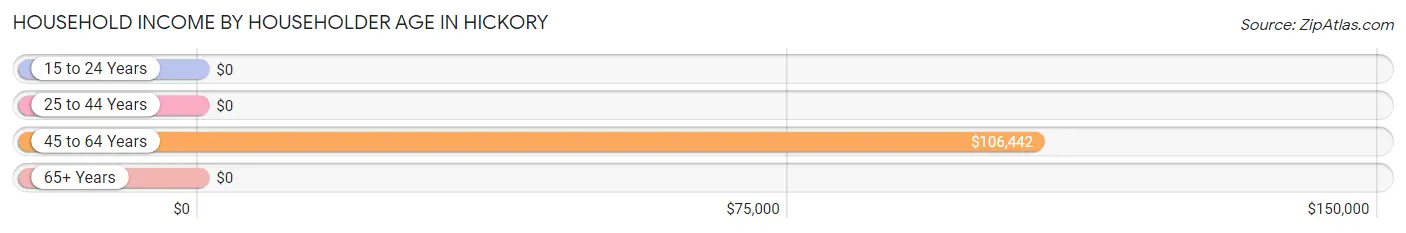
| Income Bracket | # Households | Median Income |
| 15 to 24 Years | 0 (0.0%) | $0 |
| 25 to 44 Years | 40 (16.3%) | $0 |
| 45 to 64 Years | 81 (33.1%) | $106,442 |
| 65+ Years | 124 (50.6%) | $0 |
| Total | 245 (100.0%) | $75,511 |
Poverty in Hickory
Income Below Poverty by Sex and Age in Hickory
With 6.7% poverty level for males and 4.3% for females among the residents of Hickory, 65 to 74 year old males and 65 to 74 year old females are the most vulnerable to poverty, with 12 males (27.9%) and 12 females (23.5%) in their respective age groups living below the poverty level.
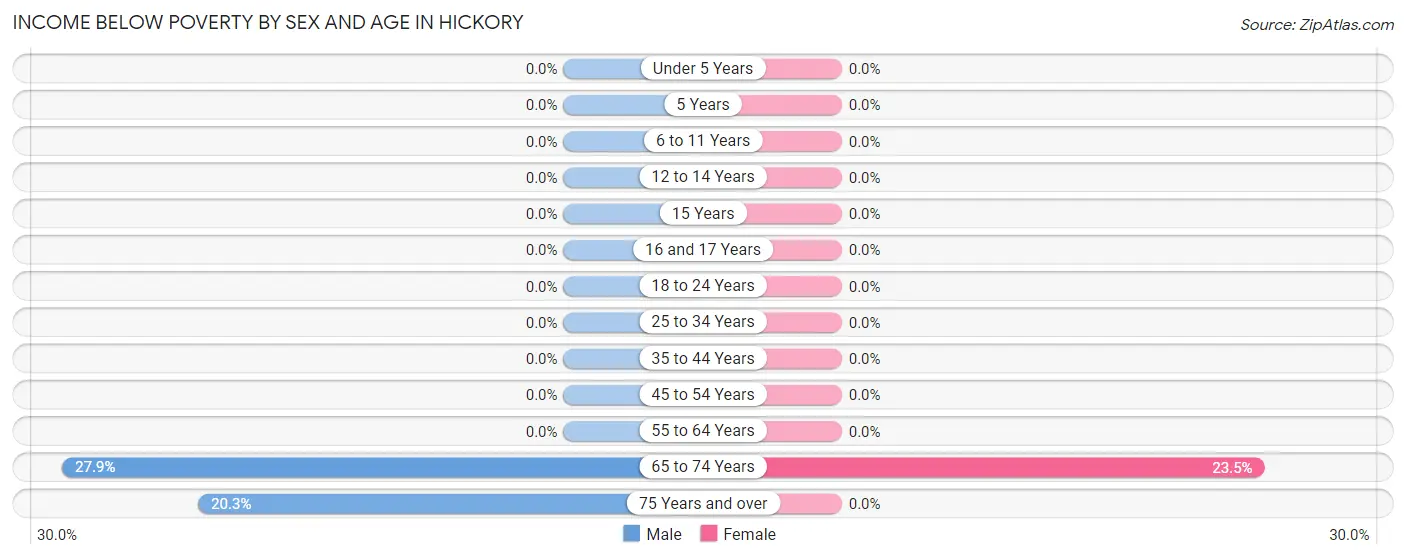
| Age Bracket | Male | Female |
| Under 5 Years | 0 (0.0%) | 0 (0.0%) |
| 5 Years | 0 (0.0%) | 0 (0.0%) |
| 6 to 11 Years | 0 (0.0%) | 0 (0.0%) |
| 12 to 14 Years | 0 (0.0%) | 0 (0.0%) |
| 15 Years | 0 (0.0%) | 0 (0.0%) |
| 16 and 17 Years | 0 (0.0%) | 0 (0.0%) |
| 18 to 24 Years | 0 (0.0%) | 0 (0.0%) |
| 25 to 34 Years | 0 (0.0%) | 0 (0.0%) |
| 35 to 44 Years | 0 (0.0%) | 0 (0.0%) |
| 45 to 54 Years | 0 (0.0%) | 0 (0.0%) |
| 55 to 64 Years | 0 (0.0%) | 0 (0.0%) |
| 65 to 74 Years | 12 (27.9%) | 12 (23.5%) |
| 75 Years and over | 12 (20.3%) | 0 (0.0%) |
| Total | 24 (6.7%) | 12 (4.3%) |
Income Above Poverty by Sex and Age in Hickory
According to the poverty statistics in Hickory, males aged under 5 years and females aged under 5 years are the age groups that are most secure financially, with 100.0% of males and 100.0% of females in these age groups living above the poverty line.
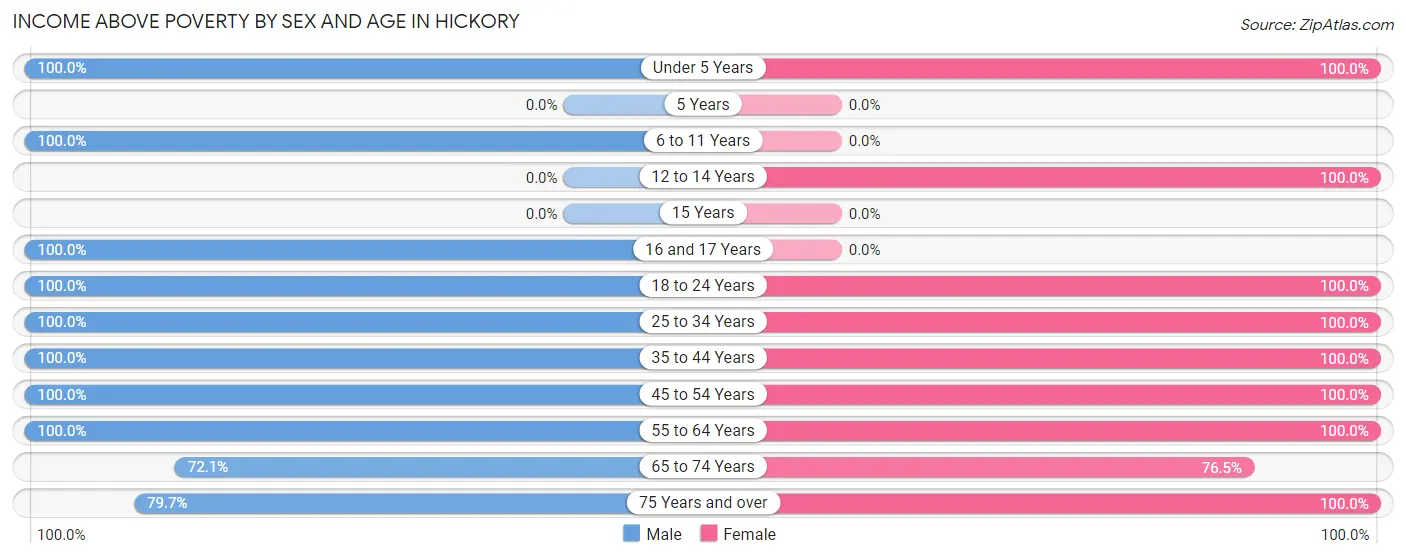
| Age Bracket | Male | Female |
| Under 5 Years | 13 (100.0%) | 59 (100.0%) |
| 5 Years | 0 (0.0%) | 0 (0.0%) |
| 6 to 11 Years | 28 (100.0%) | 0 (0.0%) |
| 12 to 14 Years | 0 (0.0%) | 12 (100.0%) |
| 15 Years | 0 (0.0%) | 0 (0.0%) |
| 16 and 17 Years | 54 (100.0%) | 0 (0.0%) |
| 18 to 24 Years | 42 (100.0%) | 13 (100.0%) |
| 25 to 34 Years | 41 (100.0%) | 28 (100.0%) |
| 35 to 44 Years | 23 (100.0%) | 12 (100.0%) |
| 45 to 54 Years | 42 (100.0%) | 58 (100.0%) |
| 55 to 64 Years | 13 (100.0%) | 22 (100.0%) |
| 65 to 74 Years | 31 (72.1%) | 39 (76.5%) |
| 75 Years and over | 47 (79.7%) | 23 (100.0%) |
| Total | 334 (93.3%) | 266 (95.7%) |
Income Below Poverty Among Married-Couple Families in Hickory
The poverty statistics for married-couple families in Hickory show that 7.8% or 12 of the total 153 families live below the poverty line. Families with no children have the highest poverty rate of 15.4%, comprising of 12 families. On the other hand, families with 1 or 2 children have the lowest poverty rate of 0.0%, which includes 0 families.
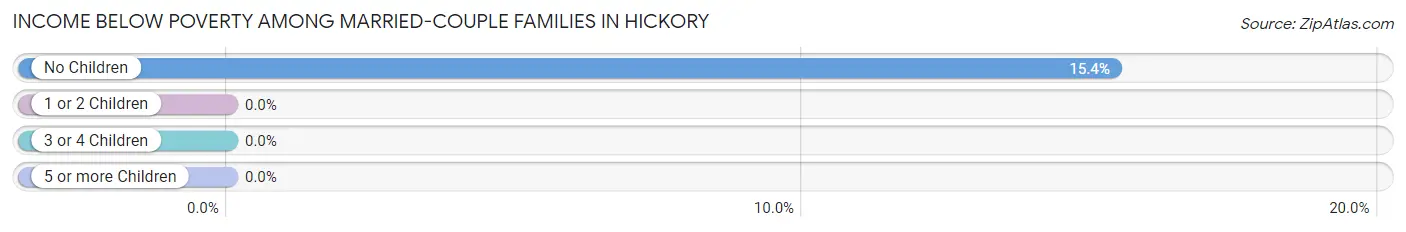
| Children | Above Poverty | Below Poverty |
| No Children | 66 (84.6%) | 12 (15.4%) |
| 1 or 2 Children | 49 (100.0%) | 0 (0.0%) |
| 3 or 4 Children | 26 (100.0%) | 0 (0.0%) |
| 5 or more Children | 0 (0.0%) | 0 (0.0%) |
| Total | 141 (92.2%) | 12 (7.8%) |
Income Below Poverty Among Single-Parent Households in Hickory
| Children | Single Father | Single Mother |
| No Children | 0 (0.0%) | 0 (0.0%) |
| 1 or 2 Children | 0 (0.0%) | 0 (0.0%) |
| 3 or 4 Children | 0 (0.0%) | 0 (0.0%) |
| 5 or more Children | 0 (0.0%) | 0 (0.0%) |
| Total | 0 (0.0%) | 0 (0.0%) |
Income Below Poverty Among Married-Couple vs Single-Parent Households in Hickory
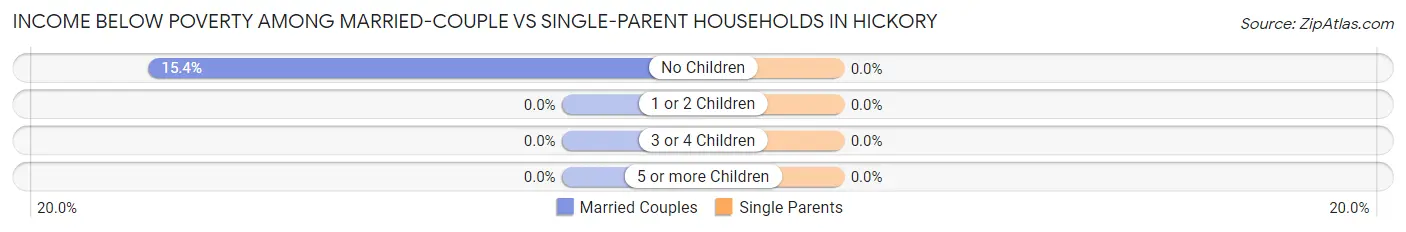
| Children | Married-Couple Families | Single-Parent Households |
| No Children | 12 (15.4%) | 0 (0.0%) |
| 1 or 2 Children | 0 (0.0%) | 0 (0.0%) |
| 3 or 4 Children | 0 (0.0%) | 0 (0.0%) |
| 5 or more Children | 0 (0.0%) | 0 (0.0%) |
| Total | 12 (7.8%) | 0 (0.0%) |
Race in Hickory
The most populous races in Hickory are , and White / Caucasian (636 | 100.0%).
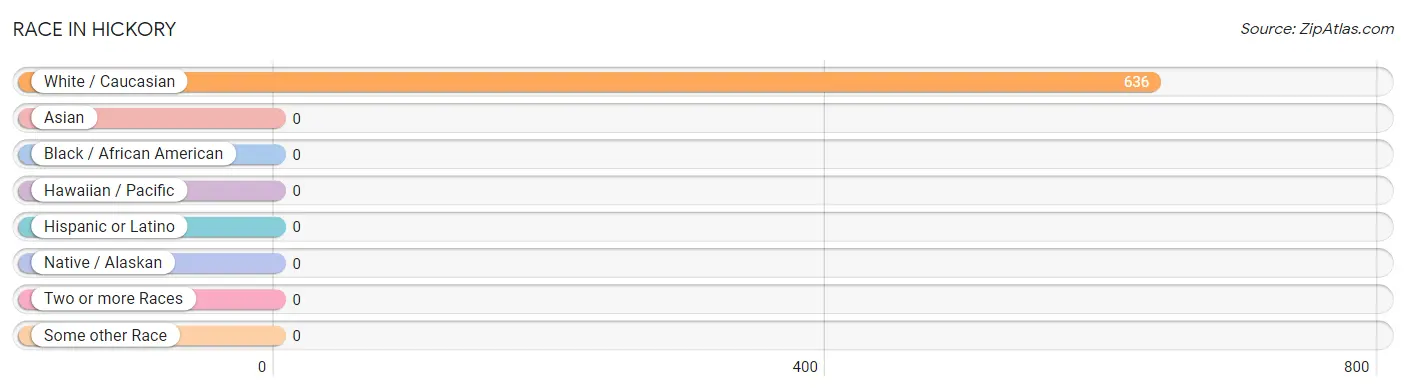
| Race | # Population | % Population |
| Asian | 0 | 0.0% |
| Black / African American | 0 | 0.0% |
| Hawaiian / Pacific | 0 | 0.0% |
| Hispanic or Latino | 0 | 0.0% |
| Native / Alaskan | 0 | 0.0% |
| White / Caucasian | 636 | 100.0% |
| Two or more Races | 0 | 0.0% |
| Some other Race | 0 | 0.0% |
| Total | 636 | 100.0% |
Ancestry in Hickory
The most populous ancestries reported in Hickory are Italian (174 | 27.4%), English (64 | 10.1%), German (57 | 9.0%), Belgian (53 | 8.3%), and Polish (52 | 8.2%), together accounting for 62.9% of all Hickory residents.
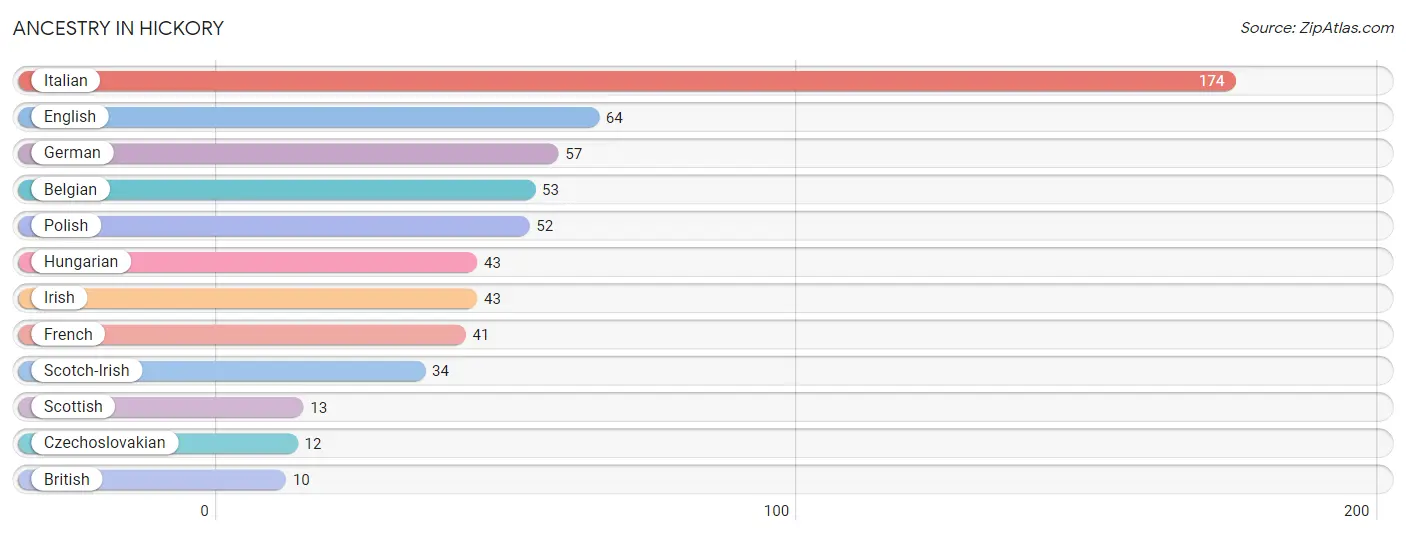
| Ancestry | # Population | % Population |
| Belgian | 53 | 8.3% |
| British | 10 | 1.6% |
| Czechoslovakian | 12 | 1.9% |
| English | 64 | 10.1% |
| French | 41 | 6.5% |
| German | 57 | 9.0% |
| Hungarian | 43 | 6.8% |
| Irish | 43 | 6.8% |
| Italian | 174 | 27.4% |
| Polish | 52 | 8.2% |
| Scotch-Irish | 34 | 5.3% |
| Scottish | 13 | 2.0% | View All 12 Rows |
Immigrants in Hickory

| Immigration Origin | # Population | % Population | View All 0 Rows |
Sex and Age in Hickory
Sex and Age in Hickory
The most populous age groups in Hickory are 15 to 19 Years (96 | 26.8%) for men and Under 5 Years (59 | 21.2%) for women.
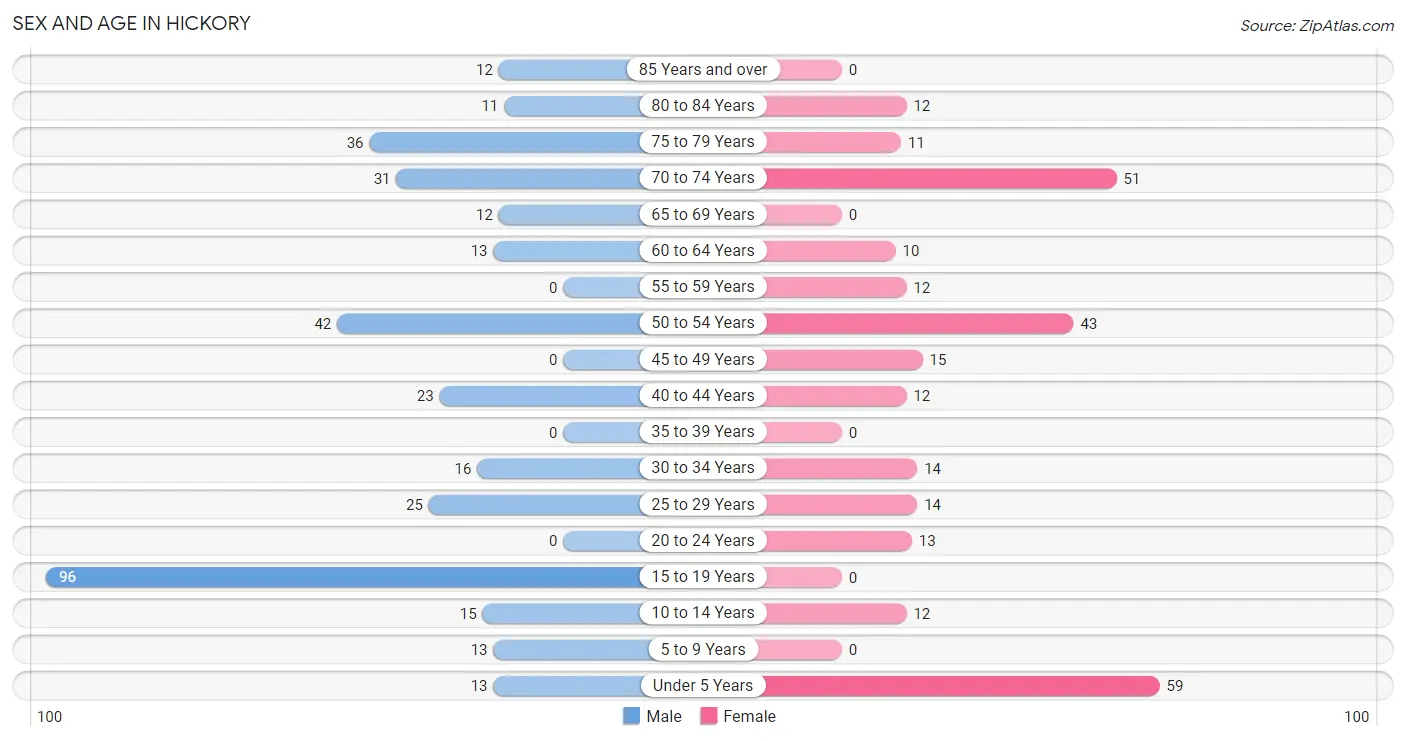
| Age Bracket | Male | Female |
| Under 5 Years | 13 (3.6%) | 59 (21.2%) |
| 5 to 9 Years | 13 (3.6%) | 0 (0.0%) |
| 10 to 14 Years | 15 (4.2%) | 12 (4.3%) |
| 15 to 19 Years | 96 (26.8%) | 0 (0.0%) |
| 20 to 24 Years | 0 (0.0%) | 13 (4.7%) |
| 25 to 29 Years | 25 (7.0%) | 14 (5.0%) |
| 30 to 34 Years | 16 (4.5%) | 14 (5.0%) |
| 35 to 39 Years | 0 (0.0%) | 0 (0.0%) |
| 40 to 44 Years | 23 (6.4%) | 12 (4.3%) |
| 45 to 49 Years | 0 (0.0%) | 15 (5.4%) |
| 50 to 54 Years | 42 (11.7%) | 43 (15.5%) |
| 55 to 59 Years | 0 (0.0%) | 12 (4.3%) |
| 60 to 64 Years | 13 (3.6%) | 10 (3.6%) |
| 65 to 69 Years | 12 (3.4%) | 0 (0.0%) |
| 70 to 74 Years | 31 (8.7%) | 51 (18.3%) |
| 75 to 79 Years | 36 (10.1%) | 11 (4.0%) |
| 80 to 84 Years | 11 (3.1%) | 12 (4.3%) |
| 85 Years and over | 12 (3.4%) | 0 (0.0%) |
| Total | 358 (100.0%) | 278 (100.0%) |
Families and Households in Hickory
Median Family Size in Hickory
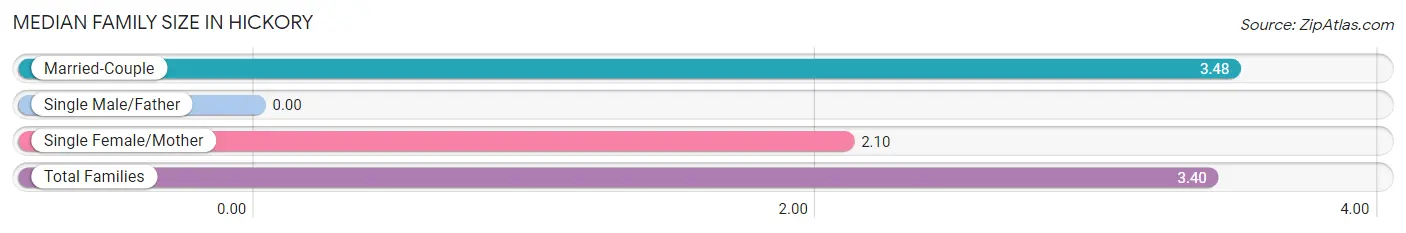
| Family Type | # Families | Family Size |
| Married-Couple | 153 (93.9%) | 3.48 |
| Single Male/Father | 0 (0.0%) | - |
| Single Female/Mother | 10 (6.1%) | 2.10 |
| Total Families | 163 (100.0%) | 3.40 |
Median Household Size in Hickory
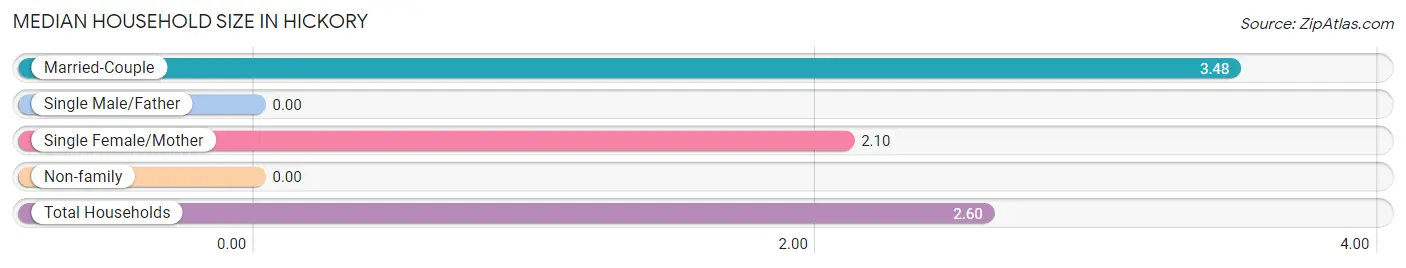
| Household Type | # Households | Household Size |
| Married-Couple | 153 (62.5%) | 3.48 |
| Single Male/Father | 0 (0.0%) | - |
| Single Female/Mother | 10 (4.1%) | 2.10 |
| Non-family | 82 (33.5%) | - |
| Total Households | 245 (100.0%) | 2.60 |
Household Size by Marriage Status in Hickory
Out of a total of 245 households in Hickory, 163 (66.5%) are family households, while 82 (33.5%) are nonfamily households. The most numerous type of family households are 2-person households, comprising 66, and the most common type of nonfamily households are 1-person households, comprising 82.
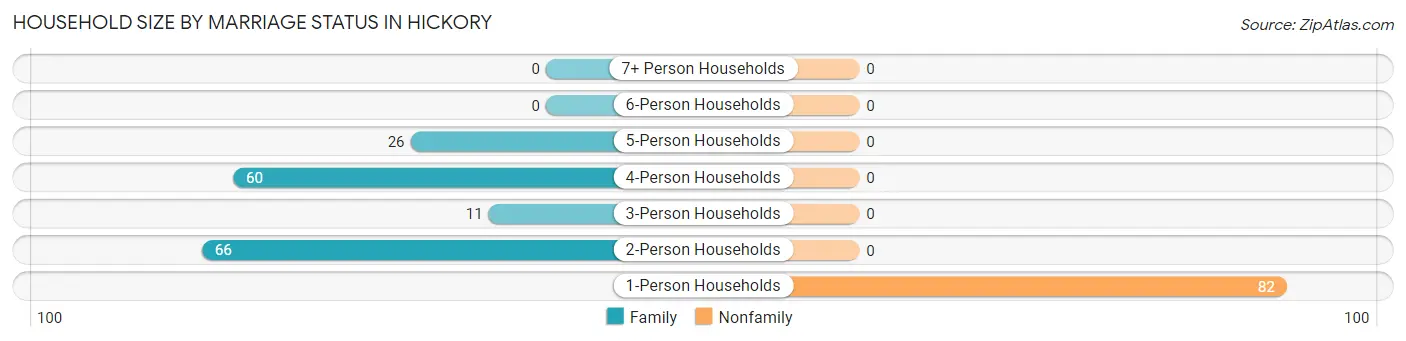
| Household Size | Family Households | Nonfamily Households |
| 1-Person Households | - | 82 (33.5%) |
| 2-Person Households | 66 (26.9%) | 0 (0.0%) |
| 3-Person Households | 11 (4.5%) | 0 (0.0%) |
| 4-Person Households | 60 (24.5%) | 0 (0.0%) |
| 5-Person Households | 26 (10.6%) | 0 (0.0%) |
| 6-Person Households | 0 (0.0%) | 0 (0.0%) |
| 7+ Person Households | 0 (0.0%) | 0 (0.0%) |
| Total | 163 (66.5%) | 82 (33.5%) |
Female Fertility in Hickory
Fertility by Age in Hickory
Average fertility rate in Hickory is 318.0 births per 1,000 women. Women in the age bracket of 20 to 34 years have the highest fertility rate with 683.0 births per 1,000 women. Women in the age bracket of 20 to 34 years acount for 100.0% of all women with births.

| Age Bracket | Women with Births | Births / 1,000 Women |
| 15 to 19 years | 0 (0.0%) | 0.0 |
| 20 to 34 years | 28 (100.0%) | 683.0 |
| 35 to 50 years | 0 (0.0%) | 0.0 |
| Total | 28 (100.0%) | 318.0 |
Fertility by Age by Marriage Status in Hickory
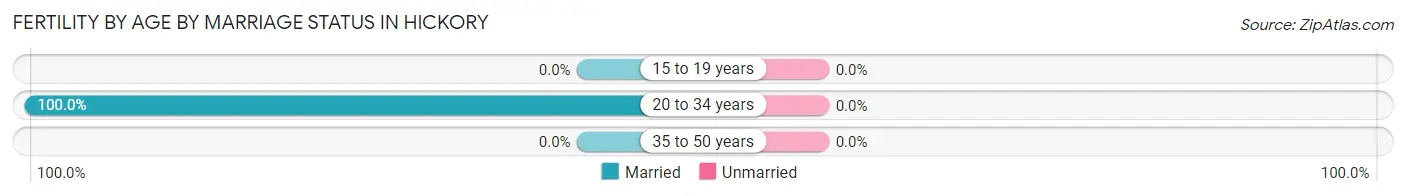
| Age Bracket | Married | Unmarried |
| 15 to 19 years | 0 (0.0%) | 0 (0.0%) |
| 20 to 34 years | 28 (100.0%) | 0 (0.0%) |
| 35 to 50 years | 0 (0.0%) | 0 (0.0%) |
| Total | 28 (100.0%) | 0 (0.0%) |
Fertility by Education in Hickory
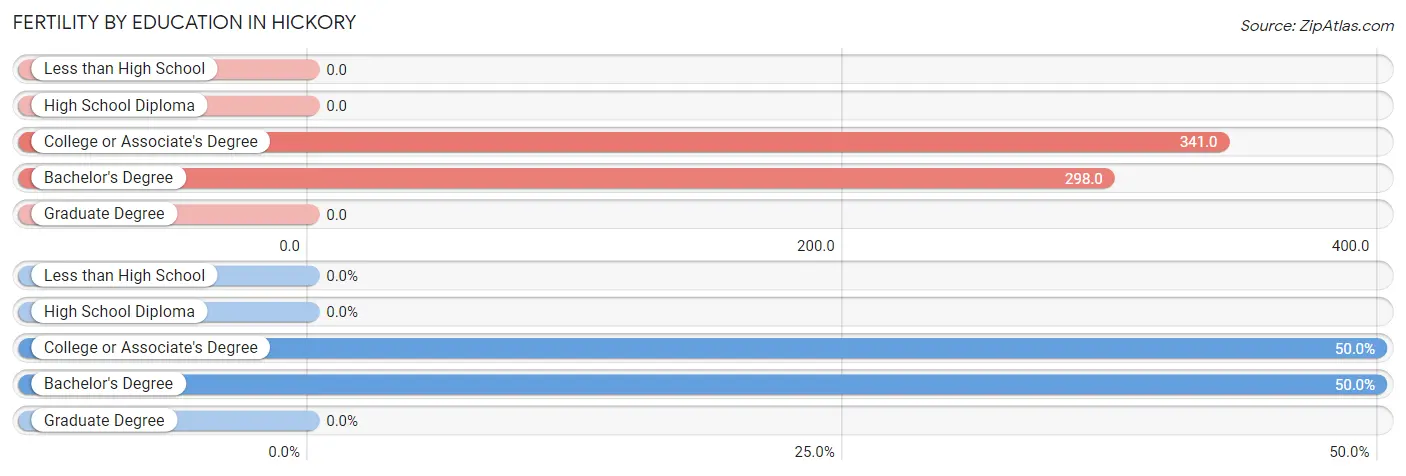
| Educational Attainment | Women with Births | Births / 1,000 Women |
| Less than High School | 0 (0.0%) | 0.0 |
| High School Diploma | 0 (0.0%) | 0.0 |
| College or Associate's Degree | 14 (50.0%) | 341.0 |
| Bachelor's Degree | 14 (50.0%) | 298.0 |
| Graduate Degree | 0 (0.0%) | 0.0 |
| Total | 28 (100.0%) | 318.0 |
Fertility by Education by Marriage Status in Hickory
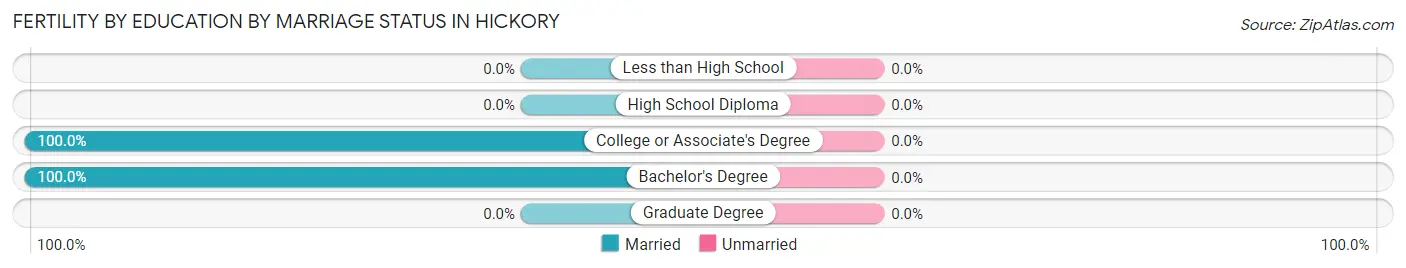
| Educational Attainment | Married | Unmarried |
| Less than High School | 0 (0.0%) | 0 (0.0%) |
| High School Diploma | 0 (0.0%) | 0 (0.0%) |
| College or Associate's Degree | 14 (100.0%) | 0 (0.0%) |
| Bachelor's Degree | 14 (100.0%) | 0 (0.0%) |
| Graduate Degree | 0 (0.0%) | 0 (0.0%) |
| Total | 28 (100.0%) | 0 (0.0%) |
Employment Characteristics in Hickory
Employment by Class of Employer in Hickory
Among the 180 employed individuals in Hickory, private company employees (148 | 82.2%), federal government employees (20 | 11.1%), and local government employees (12 | 6.7%) make up the most common classes of employment.
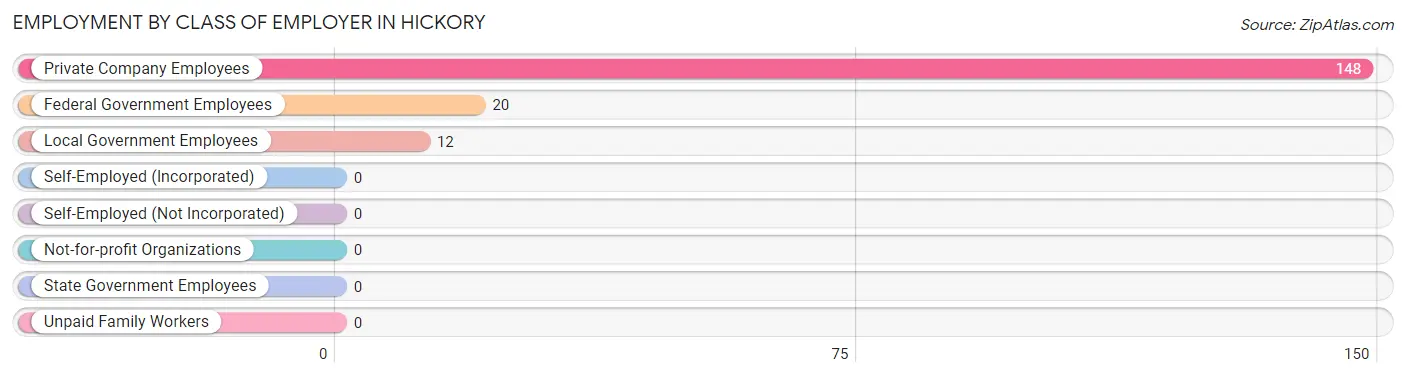
| Employer Class | # Employees | % Employees |
| Private Company Employees | 148 | 82.2% |
| Self-Employed (Incorporated) | 0 | 0.0% |
| Self-Employed (Not Incorporated) | 0 | 0.0% |
| Not-for-profit Organizations | 0 | 0.0% |
| Local Government Employees | 12 | 6.7% |
| State Government Employees | 0 | 0.0% |
| Federal Government Employees | 20 | 11.1% |
| Unpaid Family Workers | 0 | 0.0% |
| Total | 180 | 100.0% |
Employment Status by Age in Hickory
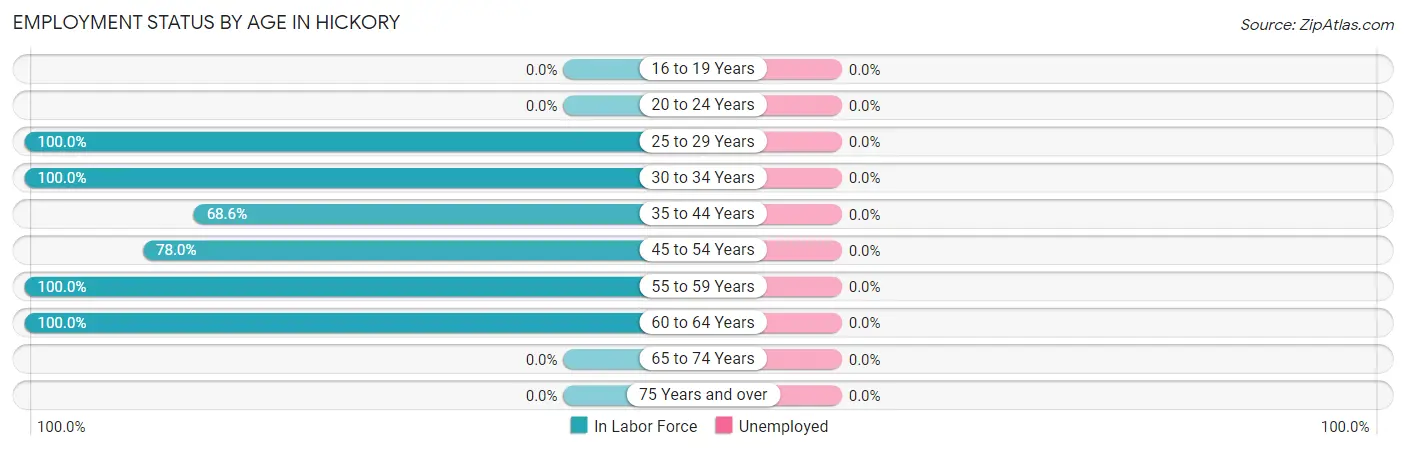
| Age Bracket | In Labor Force | Unemployed |
| 16 to 19 Years | 0 (0.0%) | 0 (0.0%) |
| 20 to 24 Years | 0 (0.0%) | 0 (0.0%) |
| 25 to 29 Years | 39 (100.0%) | 0 (0.0%) |
| 30 to 34 Years | 30 (100.0%) | 0 (0.0%) |
| 35 to 44 Years | 24 (68.6%) | 0 (0.0%) |
| 45 to 54 Years | 78 (78.0%) | 0 (0.0%) |
| 55 to 59 Years | 12 (100.0%) | 0 (0.0%) |
| 60 to 64 Years | 23 (100.0%) | 0 (0.0%) |
| 65 to 74 Years | 0 (0.0%) | 0 (0.0%) |
| 75 Years and over | 0 (0.0%) | 0 (0.0%) |
| Total | 206 (39.3%) | 0 (0.0%) |
Employment Status by Educational Attainment in Hickory
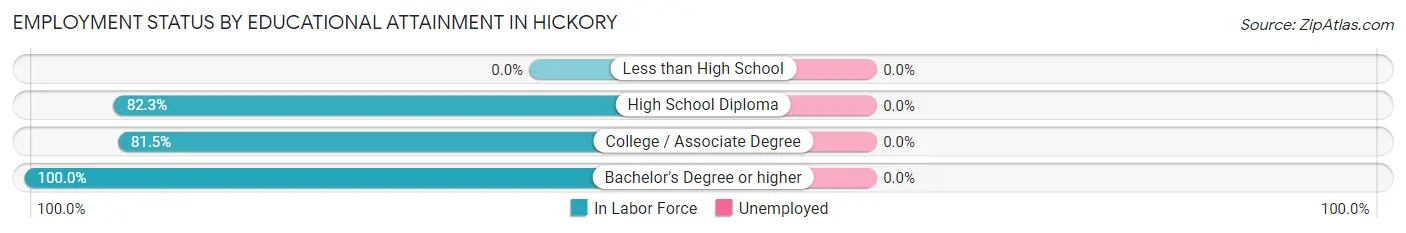
| Educational Attainment | In Labor Force | Unemployed |
| Less than High School | 0 (0.0%) | 0 (0.0%) |
| High School Diploma | 51 (82.3%) | 0 (0.0%) |
| College / Associate Degree | 97 (81.5%) | 0 (0.0%) |
| Bachelor's Degree or higher | 58 (100.0%) | 0 (0.0%) |
| Total | 206 (86.2%) | 0 (0.0%) |
Employment Occupations by Sex in Hickory
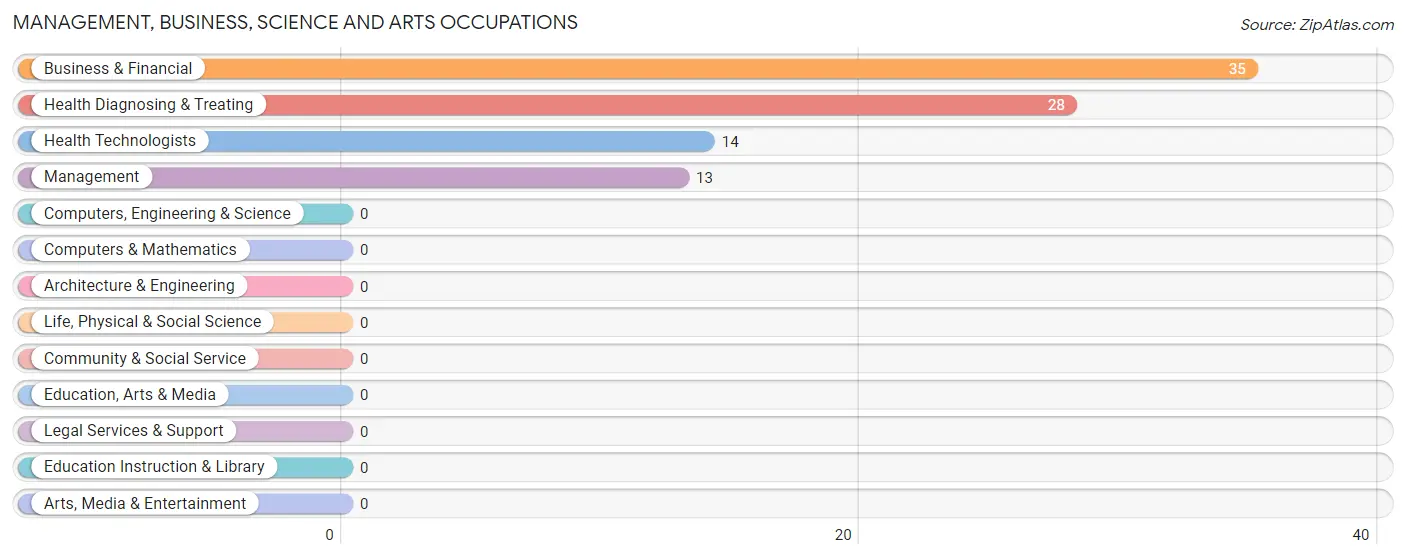
Management, Business, Science and Arts Occupations
The most common Management, Business, Science and Arts occupations in Hickory are Business & Financial (35 | 17.0%), Health Diagnosing & Treating (28 | 13.6%), Health Technologists (14 | 6.8%), and Management (13 | 6.3%).
Management, Business, Science and Arts Occupations by Sex
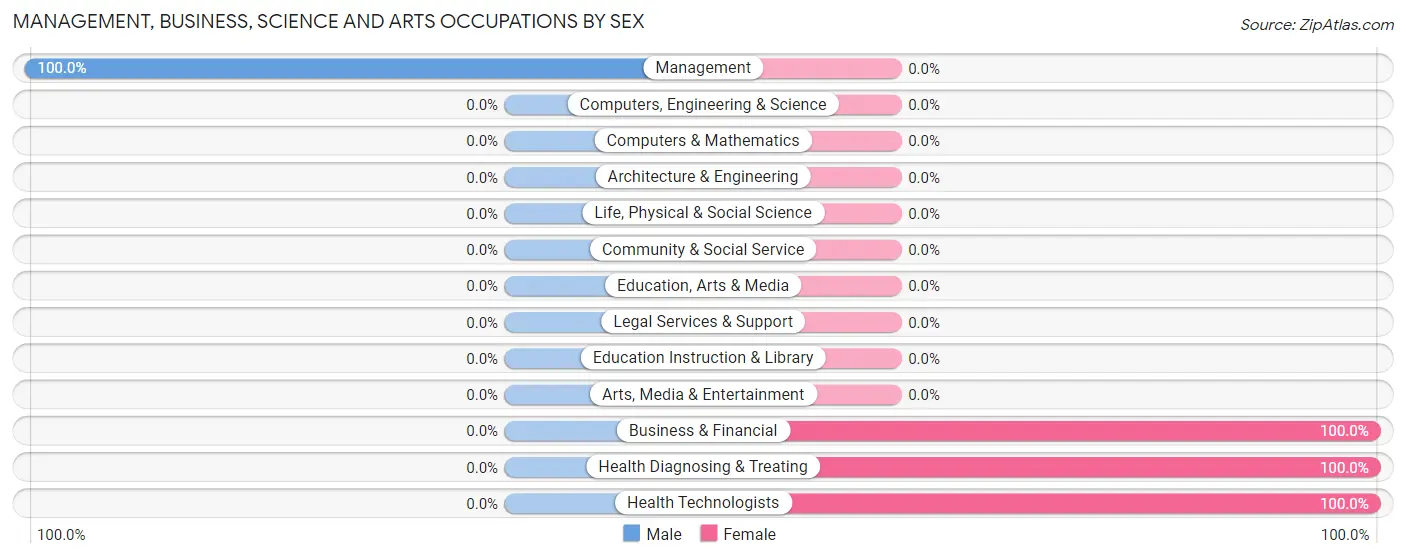
| Occupation | Male | Female |
| Management | 13 (100.0%) | 0 (0.0%) |
| Business & Financial | 0 (0.0%) | 35 (100.0%) |
| Computers, Engineering & Science | 0 (0.0%) | 0 (0.0%) |
| Computers & Mathematics | 0 (0.0%) | 0 (0.0%) |
| Architecture & Engineering | 0 (0.0%) | 0 (0.0%) |
| Life, Physical & Social Science | 0 (0.0%) | 0 (0.0%) |
| Community & Social Service | 0 (0.0%) | 0 (0.0%) |
| Education, Arts & Media | 0 (0.0%) | 0 (0.0%) |
| Legal Services & Support | 0 (0.0%) | 0 (0.0%) |
| Education Instruction & Library | 0 (0.0%) | 0 (0.0%) |
| Arts, Media & Entertainment | 0 (0.0%) | 0 (0.0%) |
| Health Diagnosing & Treating | 0 (0.0%) | 28 (100.0%) |
| Health Technologists | 0 (0.0%) | 14 (100.0%) |
| Total (Category) | 13 (17.1%) | 63 (82.9%) |
| Total (Overall) | 97 (47.1%) | 109 (52.9%) |
Services Occupations
The most common Services occupations in Hickory are , and Food Preparation & Serving (12 | 5.8%).
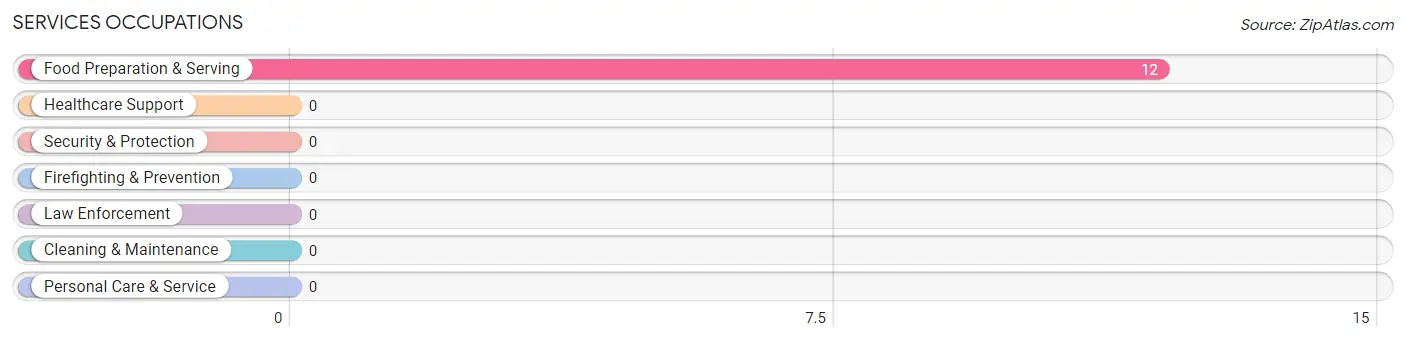
Services Occupations by Sex
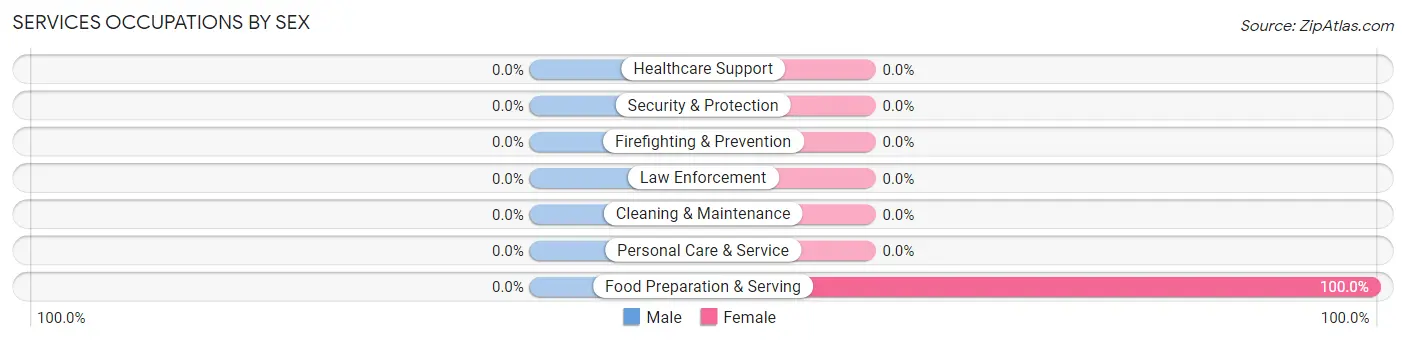
| Occupation | Male | Female |
| Healthcare Support | 0 (0.0%) | 0 (0.0%) |
| Security & Protection | 0 (0.0%) | 0 (0.0%) |
| Firefighting & Prevention | 0 (0.0%) | 0 (0.0%) |
| Law Enforcement | 0 (0.0%) | 0 (0.0%) |
| Food Preparation & Serving | 0 (0.0%) | 12 (100.0%) |
| Cleaning & Maintenance | 0 (0.0%) | 0 (0.0%) |
| Personal Care & Service | 0 (0.0%) | 0 (0.0%) |
| Total (Category) | 0 (0.0%) | 12 (100.0%) |
| Total (Overall) | 97 (47.1%) | 109 (52.9%) |
Sales and Office Occupations
The most common Sales and Office occupations in Hickory are Office & Administration (40 | 19.4%), and Sales & Related (14 | 6.8%).
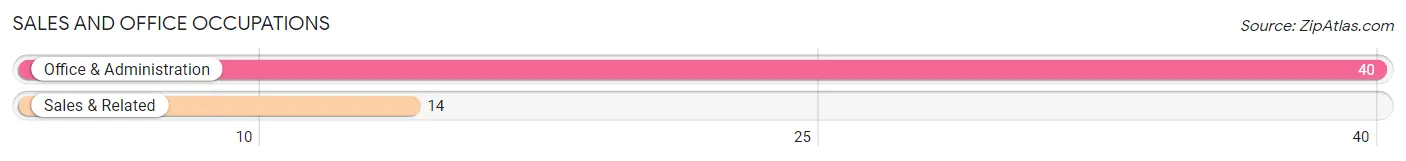
Sales and Office Occupations by Sex
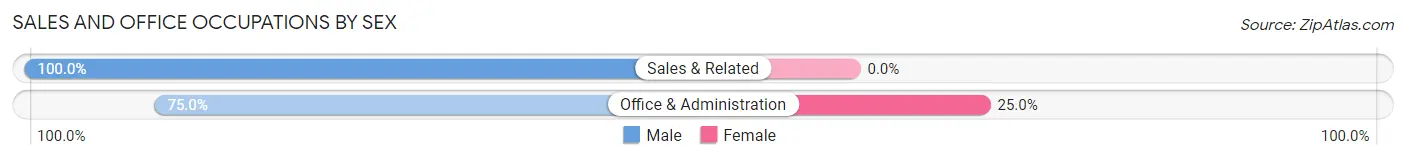
| Occupation | Male | Female |
| Sales & Related | 14 (100.0%) | 0 (0.0%) |
| Office & Administration | 30 (75.0%) | 10 (25.0%) |
| Total (Category) | 44 (81.5%) | 10 (18.5%) |
| Total (Overall) | 97 (47.1%) | 109 (52.9%) |
Natural Resources, Construction and Maintenance Occupations
The most common Natural Resources, Construction and Maintenance occupations in Hickory are , and Construction & Extraction (36 | 17.5%).
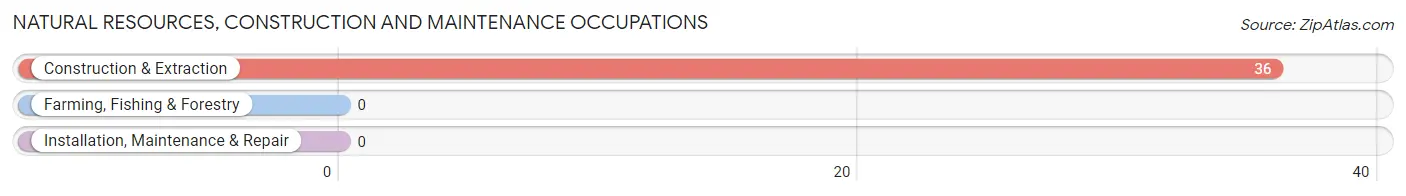
Natural Resources, Construction and Maintenance Occupations by Sex

| Occupation | Male | Female |
| Farming, Fishing & Forestry | 0 (0.0%) | 0 (0.0%) |
| Construction & Extraction | 24 (66.7%) | 12 (33.3%) |
| Installation, Maintenance & Repair | 0 (0.0%) | 0 (0.0%) |
| Total (Category) | 24 (66.7%) | 12 (33.3%) |
| Total (Overall) | 97 (47.1%) | 109 (52.9%) |
Production, Transportation and Moving Occupations
The most common Production, Transportation and Moving occupations in Hickory are Production (16 | 7.8%), and Transportation (12 | 5.8%).
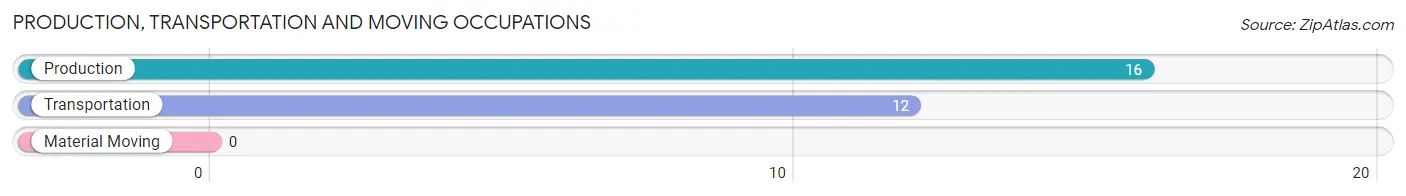
Production, Transportation and Moving Occupations by Sex
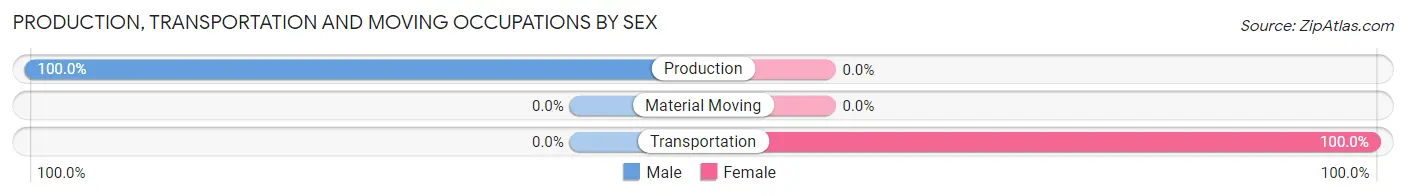
| Occupation | Male | Female |
| Production | 16 (100.0%) | 0 (0.0%) |
| Transportation | 0 (0.0%) | 12 (100.0%) |
| Material Moving | 0 (0.0%) | 0 (0.0%) |
| Total (Category) | 16 (57.1%) | 12 (42.9%) |
| Total (Overall) | 97 (47.1%) | 109 (52.9%) |
Employment Industries by Sex in Hickory
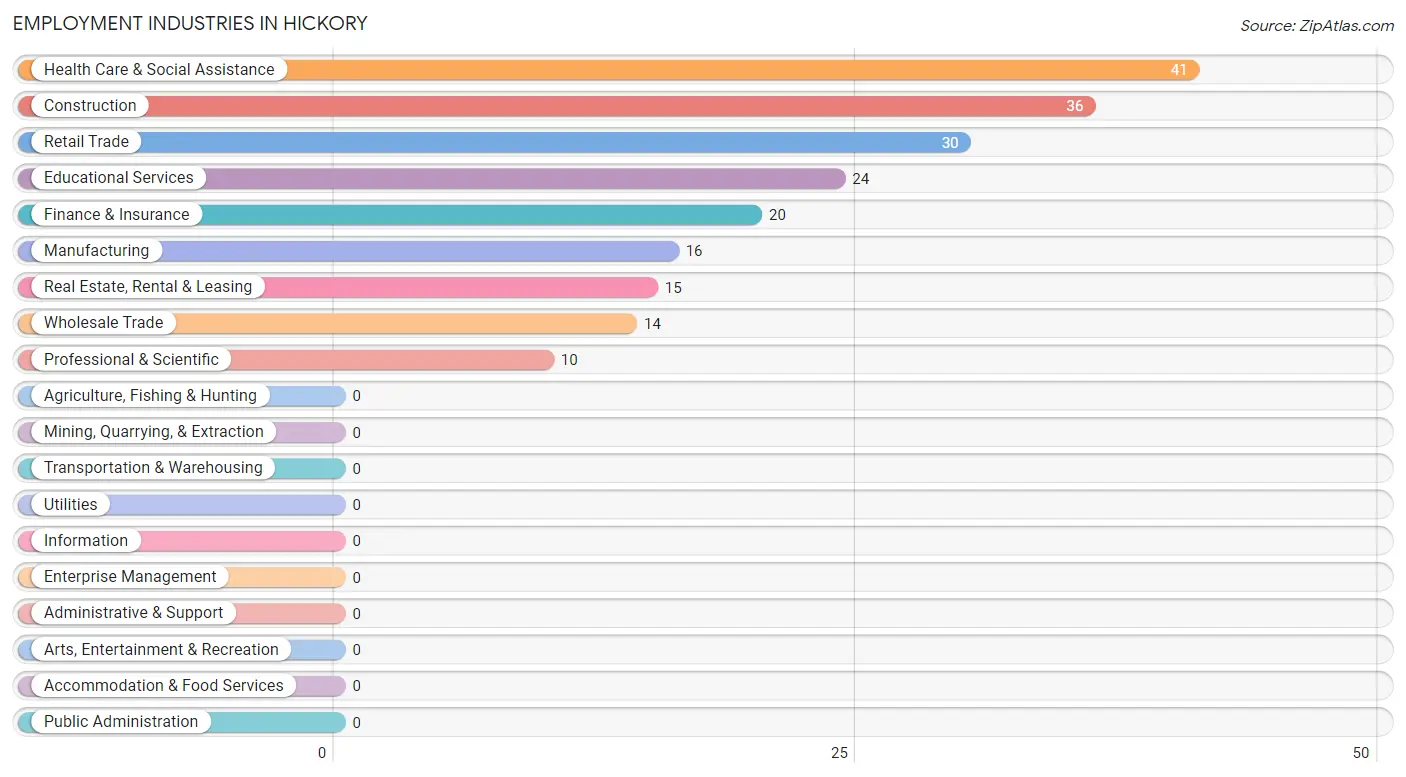
Employment Industries in Hickory
The major employment industries in Hickory include Health Care & Social Assistance (41 | 19.9%), Construction (36 | 17.5%), Retail Trade (30 | 14.6%), Educational Services (24 | 11.7%), and Finance & Insurance (20 | 9.7%).
Employment Industries by Sex in Hickory
The Hickory industries that see more men than women are Manufacturing (100.0%), Wholesale Trade (100.0%), and Retail Trade (100.0%), whereas the industries that tend to have a higher number of women are Finance & Insurance (100.0%), Real Estate, Rental & Leasing (100.0%), and Professional & Scientific (100.0%).
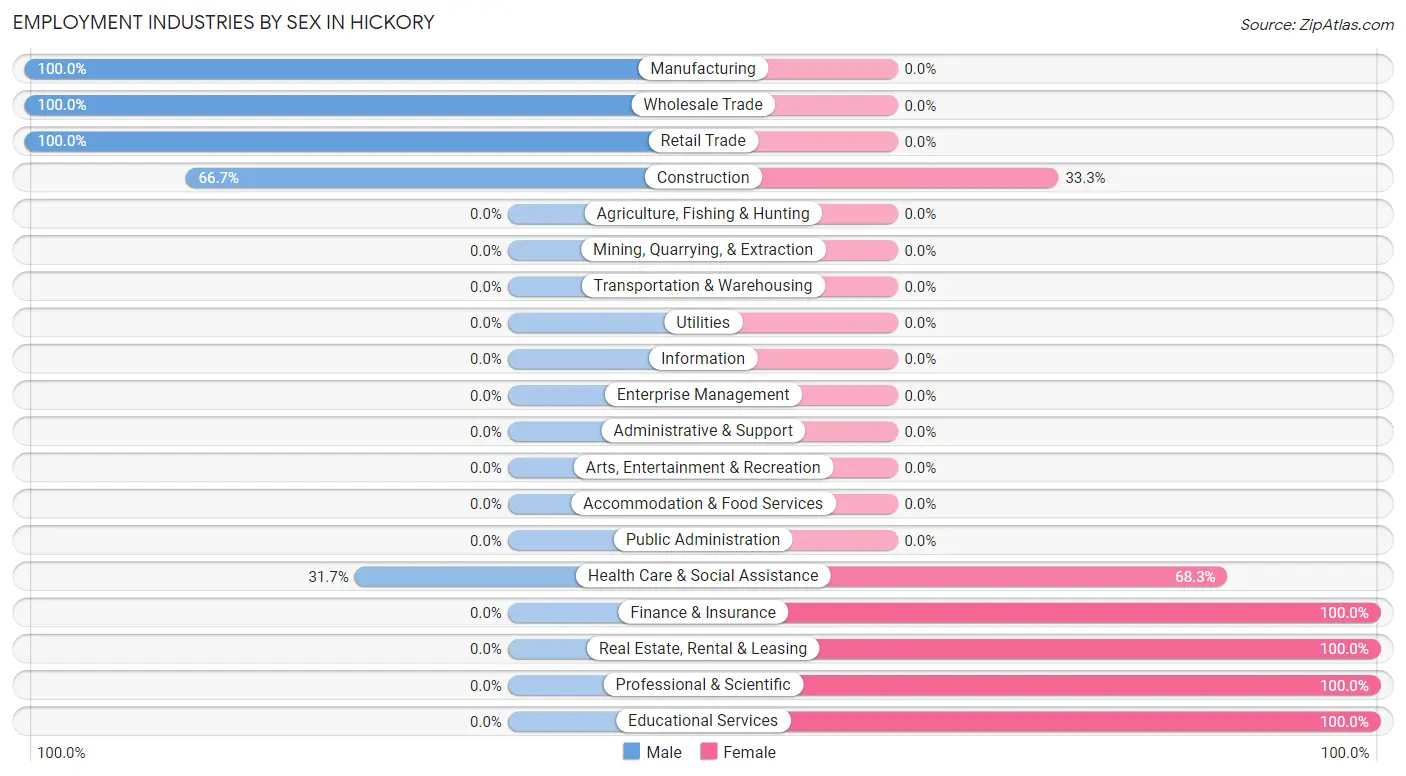
| Industry | Male | Female |
| Agriculture, Fishing & Hunting | 0 (0.0%) | 0 (0.0%) |
| Mining, Quarrying, & Extraction | 0 (0.0%) | 0 (0.0%) |
| Construction | 24 (66.7%) | 12 (33.3%) |
| Manufacturing | 16 (100.0%) | 0 (0.0%) |
| Wholesale Trade | 14 (100.0%) | 0 (0.0%) |
| Retail Trade | 30 (100.0%) | 0 (0.0%) |
| Transportation & Warehousing | 0 (0.0%) | 0 (0.0%) |
| Utilities | 0 (0.0%) | 0 (0.0%) |
| Information | 0 (0.0%) | 0 (0.0%) |
| Finance & Insurance | 0 (0.0%) | 20 (100.0%) |
| Real Estate, Rental & Leasing | 0 (0.0%) | 15 (100.0%) |
| Professional & Scientific | 0 (0.0%) | 10 (100.0%) |
| Enterprise Management | 0 (0.0%) | 0 (0.0%) |
| Administrative & Support | 0 (0.0%) | 0 (0.0%) |
| Educational Services | 0 (0.0%) | 24 (100.0%) |
| Health Care & Social Assistance | 13 (31.7%) | 28 (68.3%) |
| Arts, Entertainment & Recreation | 0 (0.0%) | 0 (0.0%) |
| Accommodation & Food Services | 0 (0.0%) | 0 (0.0%) |
| Public Administration | 0 (0.0%) | 0 (0.0%) |
| Total | 97 (47.1%) | 109 (52.9%) |
Education in Hickory
School Enrollment in Hickory
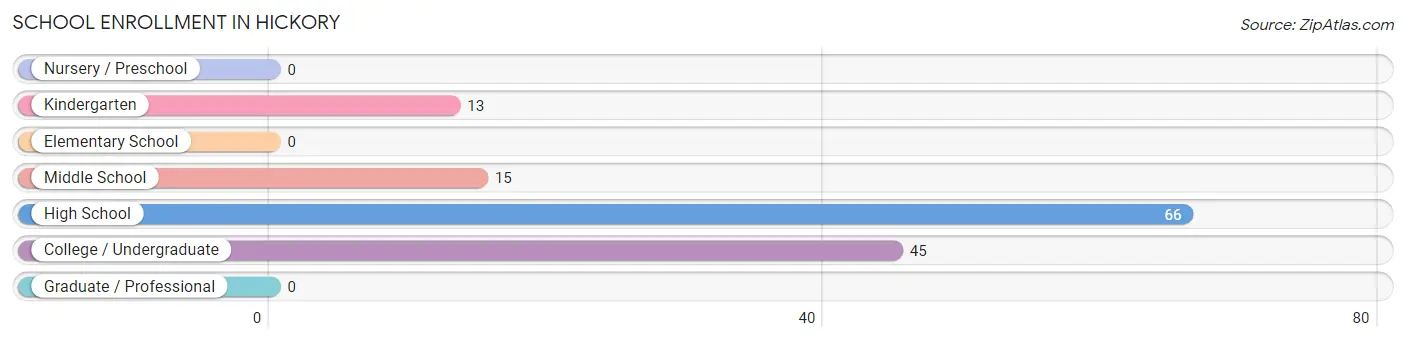
The most common levels of schooling among the 139 students in Hickory are high school (66 | 47.5%), college / undergraduate (45 | 32.4%), and middle school (15 | 10.8%).
| School Level | # Students | % Students |
| Nursery / Preschool | 0 | 0.0% |
| Kindergarten | 13 | 9.3% |
| Elementary School | 0 | 0.0% |
| Middle School | 15 | 10.8% |
| High School | 66 | 47.5% |
| College / Undergraduate | 45 | 32.4% |
| Graduate / Professional | 0 | 0.0% |
| Total | 139 | 100.0% |
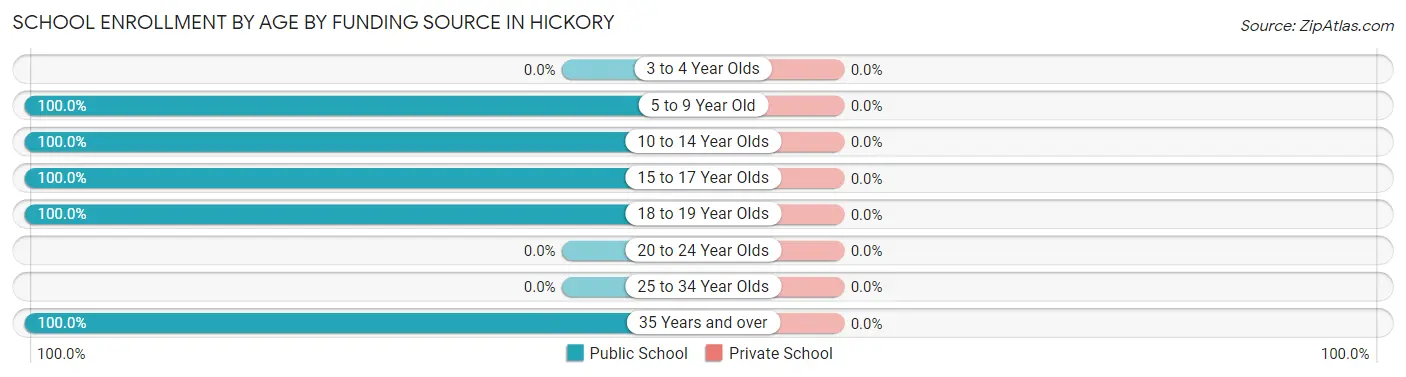
School Enrollment by Age by Funding Source in Hickory
| Age Bracket | Public School | Private School |
| 3 to 4 Year Olds | 0 (0.0%) | 0 (0.0%) |
| 5 to 9 Year Old | 13 (100.0%) | 0 (0.0%) |
| 10 to 14 Year Olds | 27 (100.0%) | 0 (0.0%) |
| 15 to 17 Year Olds | 54 (100.0%) | 0 (0.0%) |
| 18 to 19 Year Olds | 33 (100.0%) | 0 (0.0%) |
| 20 to 24 Year Olds | 0 (0.0%) | 0 (0.0%) |
| 25 to 34 Year Olds | 0 (0.0%) | 0 (0.0%) |
| 35 Years and over | 12 (100.0%) | 0 (0.0%) |
| Total | 139 (100.0%) | 0 (0.0%) |
Educational Attainment by Field of Study in Hickory
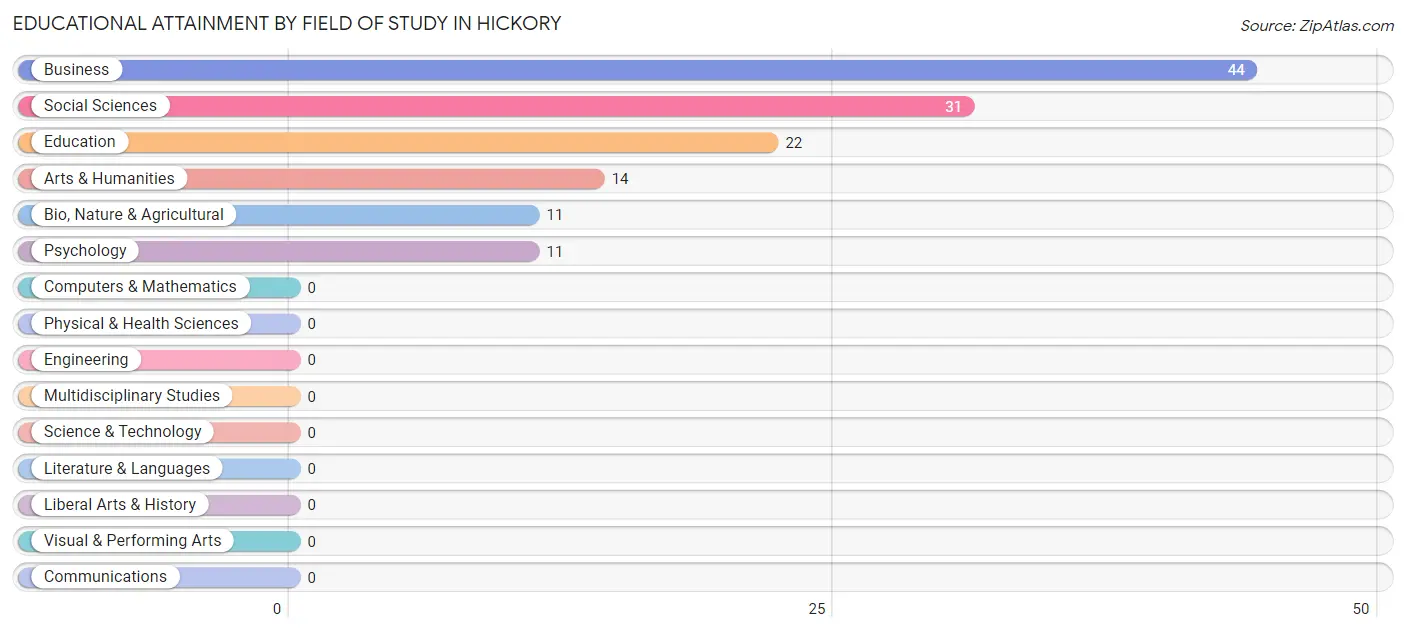
Business (44 | 33.1%), social sciences (31 | 23.3%), education (22 | 16.5%), arts & humanities (14 | 10.5%), and bio, nature & agricultural (11 | 8.3%) are the most common fields of study among 133 individuals in Hickory who have obtained a bachelor's degree or higher.
| Field of Study | # Graduates | % Graduates |
| Computers & Mathematics | 0 | 0.0% |
| Bio, Nature & Agricultural | 11 | 8.3% |
| Physical & Health Sciences | 0 | 0.0% |
| Psychology | 11 | 8.3% |
| Social Sciences | 31 | 23.3% |
| Engineering | 0 | 0.0% |
| Multidisciplinary Studies | 0 | 0.0% |
| Science & Technology | 0 | 0.0% |
| Business | 44 | 33.1% |
| Education | 22 | 16.5% |
| Literature & Languages | 0 | 0.0% |
| Liberal Arts & History | 0 | 0.0% |
| Visual & Performing Arts | 0 | 0.0% |
| Communications | 0 | 0.0% |
| Arts & Humanities | 14 | 10.5% |
| Total | 133 | 100.0% |
Transportation & Commute in Hickory
Vehicle Availability by Sex in Hickory
The most prevalent vehicle ownership categories in Hickory are males with 2 vehicles (30, accounting for 30.9%) and females with 2 vehicles (27, making up 36.1%).
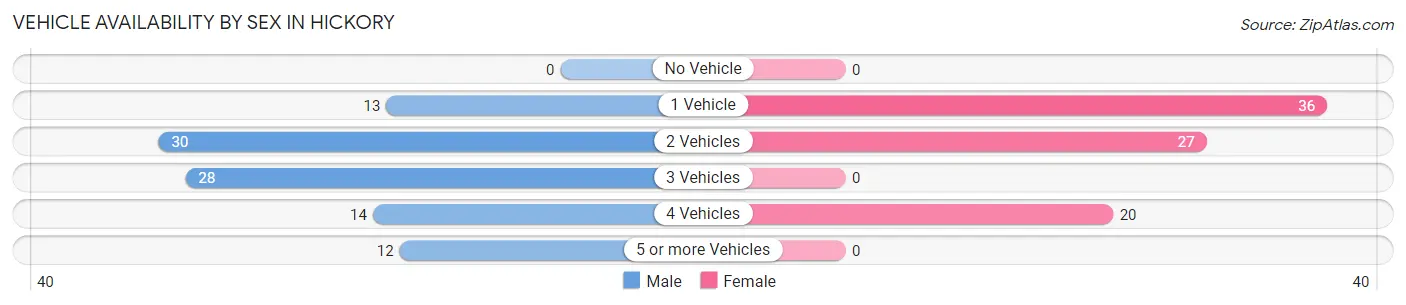
| Vehicles Available | Male | Female |
| No Vehicle | 0 (0.0%) | 0 (0.0%) |
| 1 Vehicle | 13 (13.4%) | 36 (43.4%) |
| 2 Vehicles | 30 (30.9%) | 27 (32.5%) |
| 3 Vehicles | 28 (28.9%) | 0 (0.0%) |
| 4 Vehicles | 14 (14.4%) | 20 (24.1%) |
| 5 or more Vehicles | 12 (12.4%) | 0 (0.0%) |
| Total | 97 (100.0%) | 83 (100.0%) |
Commute Time in Hickory
The most frequently occuring commute durations in Hickory are 45 to 59 minutes (56 commuters, 31.1%), 20 to 24 minutes (33 commuters, 18.3%), and 25 to 29 minutes (32 commuters, 17.8%).
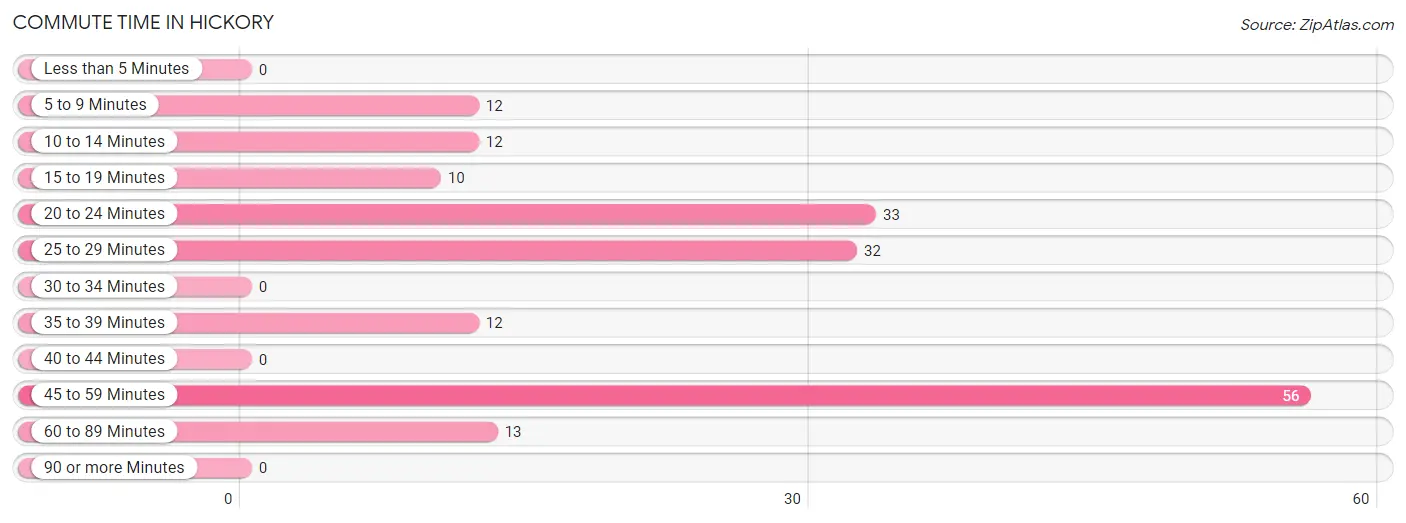
| Commute Time | # Commuters | % Commuters |
| Less than 5 Minutes | 0 | 0.0% |
| 5 to 9 Minutes | 12 | 6.7% |
| 10 to 14 Minutes | 12 | 6.7% |
| 15 to 19 Minutes | 10 | 5.6% |
| 20 to 24 Minutes | 33 | 18.3% |
| 25 to 29 Minutes | 32 | 17.8% |
| 30 to 34 Minutes | 0 | 0.0% |
| 35 to 39 Minutes | 12 | 6.7% |
| 40 to 44 Minutes | 0 | 0.0% |
| 45 to 59 Minutes | 56 | 31.1% |
| 60 to 89 Minutes | 13 | 7.2% |
| 90 or more Minutes | 0 | 0.0% |
Commute Time by Sex in Hickory
The most common commute times in Hickory are 45 to 59 minutes (42 commuters, 43.3%) for males and 20 to 24 minutes (20 commuters, 24.1%) for females.
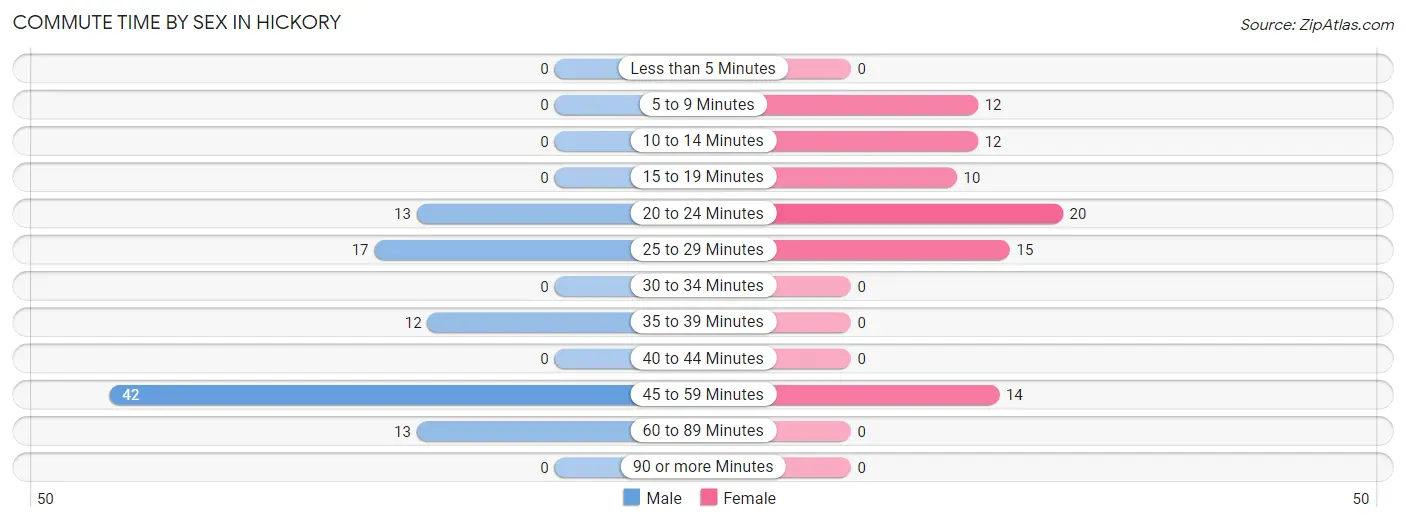
| Commute Time | Male | Female |
| Less than 5 Minutes | 0 (0.0%) | 0 (0.0%) |
| 5 to 9 Minutes | 0 (0.0%) | 12 (14.5%) |
| 10 to 14 Minutes | 0 (0.0%) | 12 (14.5%) |
| 15 to 19 Minutes | 0 (0.0%) | 10 (12.0%) |
| 20 to 24 Minutes | 13 (13.4%) | 20 (24.1%) |
| 25 to 29 Minutes | 17 (17.5%) | 15 (18.1%) |
| 30 to 34 Minutes | 0 (0.0%) | 0 (0.0%) |
| 35 to 39 Minutes | 12 (12.4%) | 0 (0.0%) |
| 40 to 44 Minutes | 0 (0.0%) | 0 (0.0%) |
| 45 to 59 Minutes | 42 (43.3%) | 14 (16.9%) |
| 60 to 89 Minutes | 13 (13.4%) | 0 (0.0%) |
| 90 or more Minutes | 0 (0.0%) | 0 (0.0%) |
Time of Departure to Work by Sex in Hickory
The most frequent times of departure to work in Hickory are 10:00 AM to 10:59 AM (30, 30.9%) for males and 8:00 AM to 8:29 AM (24, 28.9%) for females.
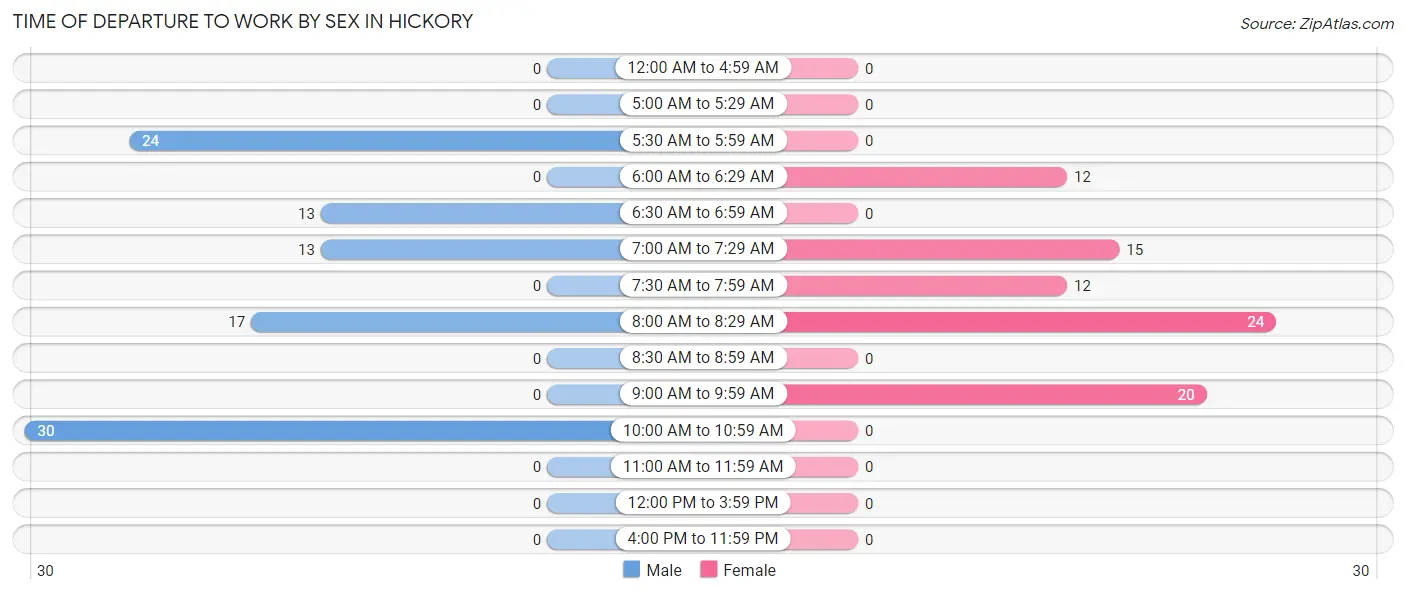
| Time of Departure | Male | Female |
| 12:00 AM to 4:59 AM | 0 (0.0%) | 0 (0.0%) |
| 5:00 AM to 5:29 AM | 0 (0.0%) | 0 (0.0%) |
| 5:30 AM to 5:59 AM | 24 (24.7%) | 0 (0.0%) |
| 6:00 AM to 6:29 AM | 0 (0.0%) | 12 (14.5%) |
| 6:30 AM to 6:59 AM | 13 (13.4%) | 0 (0.0%) |
| 7:00 AM to 7:29 AM | 13 (13.4%) | 15 (18.1%) |
| 7:30 AM to 7:59 AM | 0 (0.0%) | 12 (14.5%) |
| 8:00 AM to 8:29 AM | 17 (17.5%) | 24 (28.9%) |
| 8:30 AM to 8:59 AM | 0 (0.0%) | 0 (0.0%) |
| 9:00 AM to 9:59 AM | 0 (0.0%) | 20 (24.1%) |
| 10:00 AM to 10:59 AM | 30 (30.9%) | 0 (0.0%) |
| 11:00 AM to 11:59 AM | 0 (0.0%) | 0 (0.0%) |
| 12:00 PM to 3:59 PM | 0 (0.0%) | 0 (0.0%) |
| 4:00 PM to 11:59 PM | 0 (0.0%) | 0 (0.0%) |
| Total | 97 (100.0%) | 83 (100.0%) |
Housing Occupancy in Hickory
Occupancy by Ownership in Hickory
Of the total 245 dwellings in Hickory, owner-occupied units account for 197 (80.4%), while renter-occupied units make up 48 (19.6%).
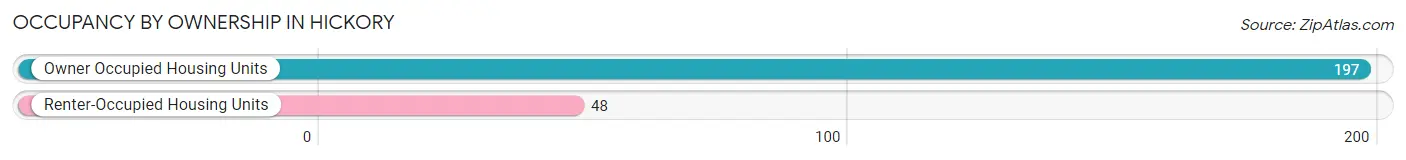
| Occupancy | # Housing Units | % Housing Units |
| Owner Occupied Housing Units | 197 | 80.4% |
| Renter-Occupied Housing Units | 48 | 19.6% |
| Total Occupied Housing Units | 245 | 100.0% |
Occupancy by Household Size in Hickory
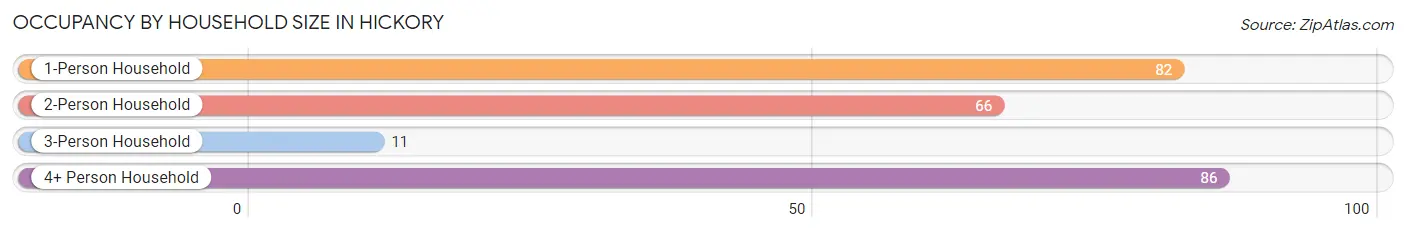
| Household Size | # Housing Units | % Housing Units |
| 1-Person Household | 82 | 33.5% |
| 2-Person Household | 66 | 26.9% |
| 3-Person Household | 11 | 4.5% |
| 4+ Person Household | 86 | 35.1% |
| Total Housing Units | 245 | 100.0% |
Occupancy by Ownership by Household Size in Hickory
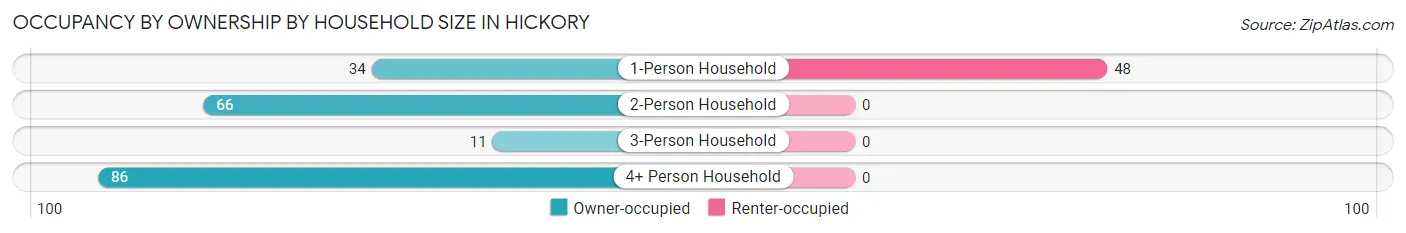
| Household Size | Owner-occupied | Renter-occupied |
| 1-Person Household | 34 (41.5%) | 48 (58.5%) |
| 2-Person Household | 66 (100.0%) | 0 (0.0%) |
| 3-Person Household | 11 (100.0%) | 0 (0.0%) |
| 4+ Person Household | 86 (100.0%) | 0 (0.0%) |
| Total Housing Units | 197 (80.4%) | 48 (19.6%) |
Occupancy by Educational Attainment in Hickory
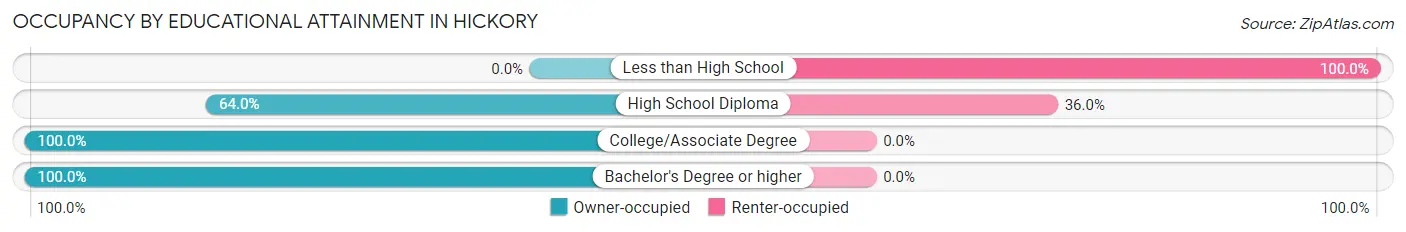
| Household Size | Owner-occupied | Renter-occupied |
| Less than High School | 0 (0.0%) | 12 (100.0%) |
| High School Diploma | 64 (64.0%) | 36 (36.0%) |
| College/Associate Degree | 54 (100.0%) | 0 (0.0%) |
| Bachelor's Degree or higher | 79 (100.0%) | 0 (0.0%) |
Occupancy by Age of Householder in Hickory
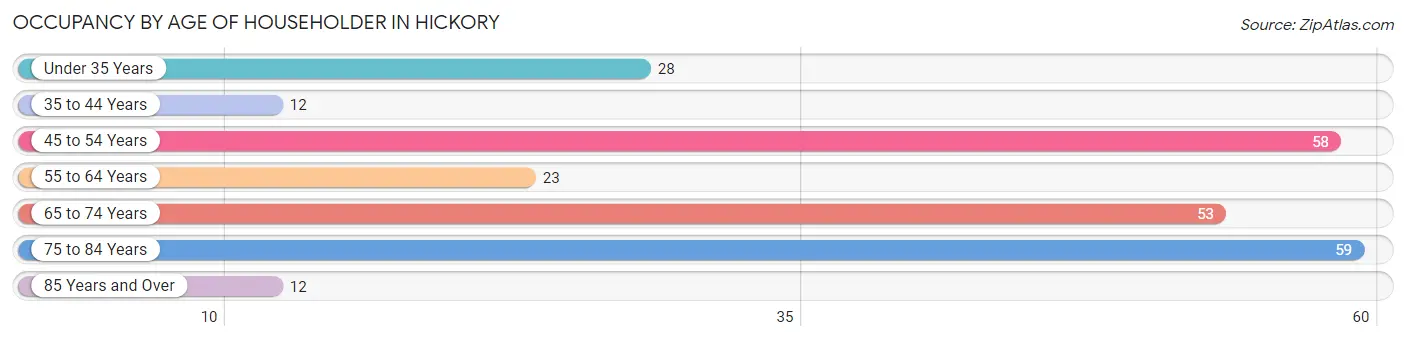
| Age Bracket | # Households | % Households |
| Under 35 Years | 28 | 11.4% |
| 35 to 44 Years | 12 | 4.9% |
| 45 to 54 Years | 58 | 23.7% |
| 55 to 64 Years | 23 | 9.4% |
| 65 to 74 Years | 53 | 21.6% |
| 75 to 84 Years | 59 | 24.1% |
| 85 Years and Over | 12 | 4.9% |
| Total | 245 | 100.0% |
Housing Finances in Hickory
Median Income by Occupancy in Hickory
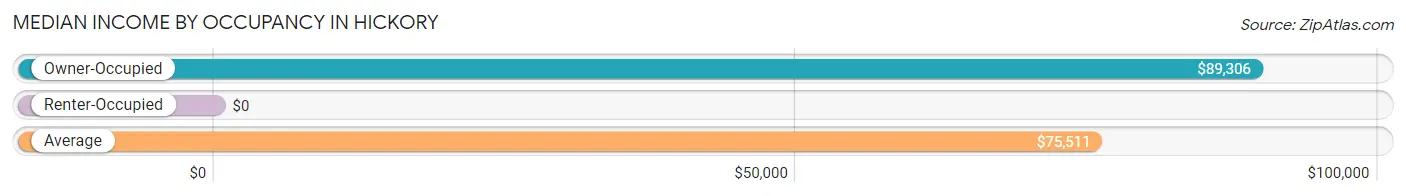
| Occupancy Type | # Households | Median Income |
| Owner-Occupied | 197 (80.4%) | $89,306 |
| Renter-Occupied | 48 (19.6%) | $0 |
| Average | 245 (100.0%) | $75,511 |
Occupancy by Householder Income Bracket in Hickory
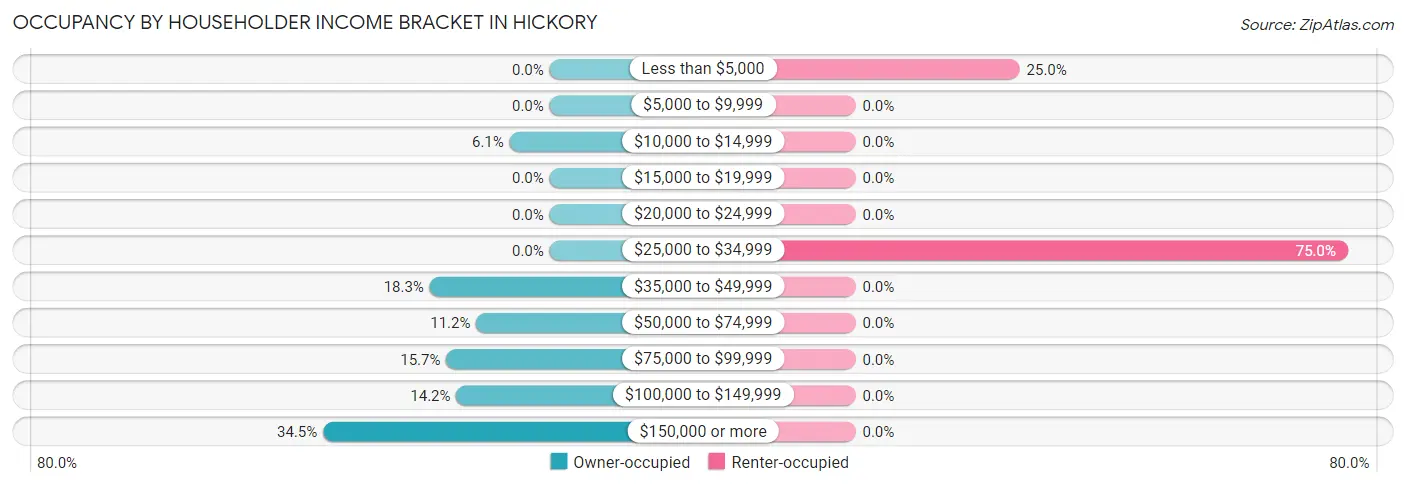
| Income Bracket | Owner-occupied | Renter-occupied |
| Less than $5,000 | 0 (0.0%) | 12 (25.0%) |
| $5,000 to $9,999 | 0 (0.0%) | 0 (0.0%) |
| $10,000 to $14,999 | 12 (6.1%) | 0 (0.0%) |
| $15,000 to $19,999 | 0 (0.0%) | 0 (0.0%) |
| $20,000 to $24,999 | 0 (0.0%) | 0 (0.0%) |
| $25,000 to $34,999 | 0 (0.0%) | 36 (75.0%) |
| $35,000 to $49,999 | 36 (18.3%) | 0 (0.0%) |
| $50,000 to $74,999 | 22 (11.2%) | 0 (0.0%) |
| $75,000 to $99,999 | 31 (15.7%) | 0 (0.0%) |
| $100,000 to $149,999 | 28 (14.2%) | 0 (0.0%) |
| $150,000 or more | 68 (34.5%) | 0 (0.0%) |
| Total | 197 (100.0%) | 48 (100.0%) |
Monthly Housing Cost Tiers in Hickory
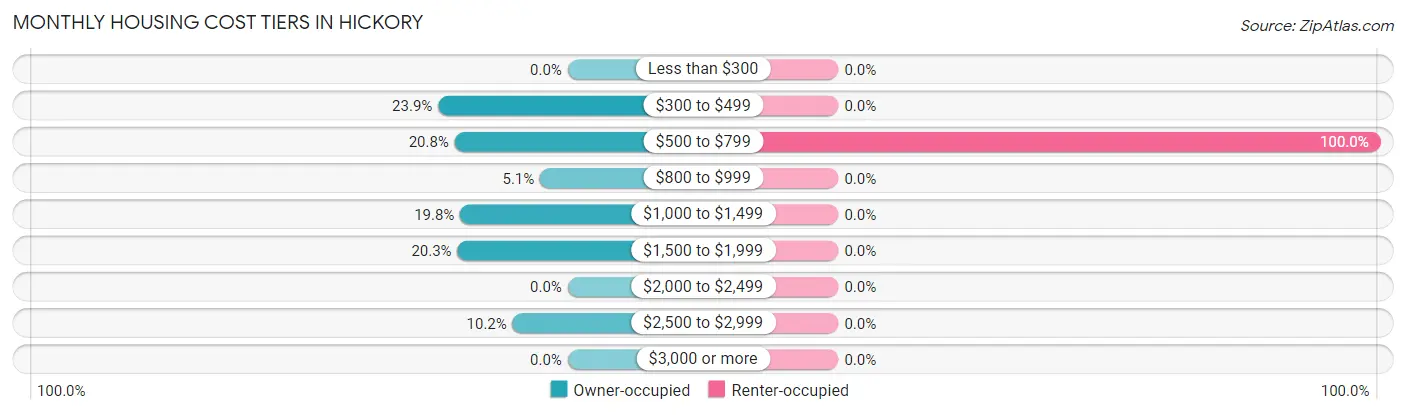
| Monthly Cost | Owner-occupied | Renter-occupied |
| Less than $300 | 0 (0.0%) | 0 (0.0%) |
| $300 to $499 | 47 (23.9%) | 0 (0.0%) |
| $500 to $799 | 41 (20.8%) | 48 (100.0%) |
| $800 to $999 | 10 (5.1%) | 0 (0.0%) |
| $1,000 to $1,499 | 39 (19.8%) | 0 (0.0%) |
| $1,500 to $1,999 | 40 (20.3%) | 0 (0.0%) |
| $2,000 to $2,499 | 0 (0.0%) | 0 (0.0%) |
| $2,500 to $2,999 | 20 (10.2%) | 0 (0.0%) |
| $3,000 or more | 0 (0.0%) | 0 (0.0%) |
| Total | 197 (100.0%) | 48 (100.0%) |
Physical Housing Characteristics in Hickory
Housing Structures in Hickory
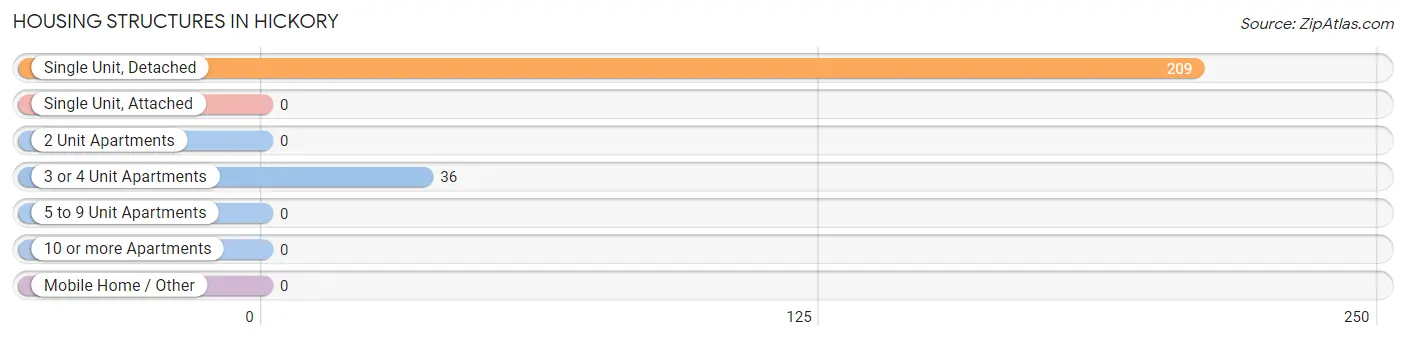
| Structure Type | # Housing Units | % Housing Units |
| Single Unit, Detached | 209 | 85.3% |
| Single Unit, Attached | 0 | 0.0% |
| 2 Unit Apartments | 0 | 0.0% |
| 3 or 4 Unit Apartments | 36 | 14.7% |
| 5 to 9 Unit Apartments | 0 | 0.0% |
| 10 or more Apartments | 0 | 0.0% |
| Mobile Home / Other | 0 | 0.0% |
| Total | 245 | 100.0% |
Housing Structures by Occupancy in Hickory
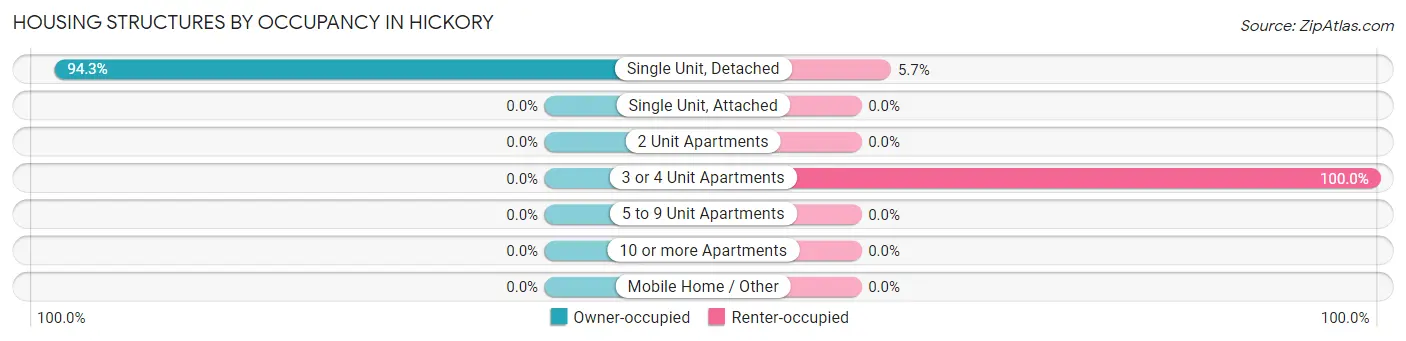
| Structure Type | Owner-occupied | Renter-occupied |
| Single Unit, Detached | 197 (94.3%) | 12 (5.7%) |
| Single Unit, Attached | 0 (0.0%) | 0 (0.0%) |
| 2 Unit Apartments | 0 (0.0%) | 0 (0.0%) |
| 3 or 4 Unit Apartments | 0 (0.0%) | 36 (100.0%) |
| 5 to 9 Unit Apartments | 0 (0.0%) | 0 (0.0%) |
| 10 or more Apartments | 0 (0.0%) | 0 (0.0%) |
| Mobile Home / Other | 0 (0.0%) | 0 (0.0%) |
| Total | 197 (80.4%) | 48 (19.6%) |
Housing Structures by Number of Rooms in Hickory
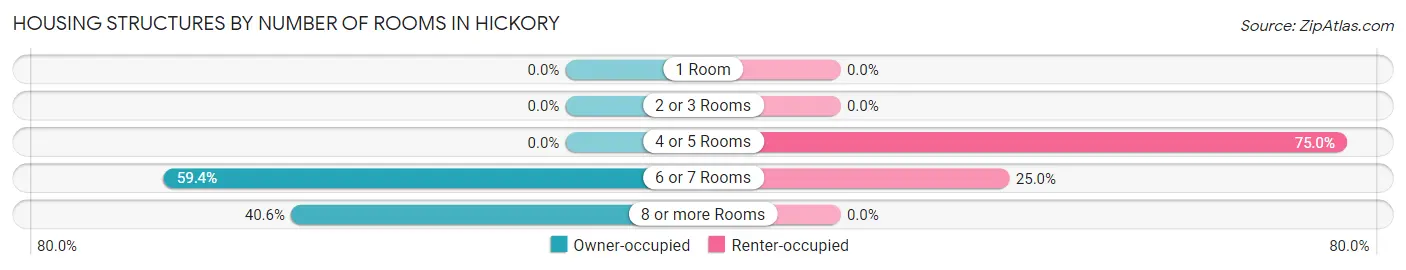
| Number of Rooms | Owner-occupied | Renter-occupied |
| 1 Room | 0 (0.0%) | 0 (0.0%) |
| 2 or 3 Rooms | 0 (0.0%) | 0 (0.0%) |
| 4 or 5 Rooms | 0 (0.0%) | 36 (75.0%) |
| 6 or 7 Rooms | 117 (59.4%) | 12 (25.0%) |
| 8 or more Rooms | 80 (40.6%) | 0 (0.0%) |
| Total | 197 (100.0%) | 48 (100.0%) |
Housing Structure by Heating Type in Hickory
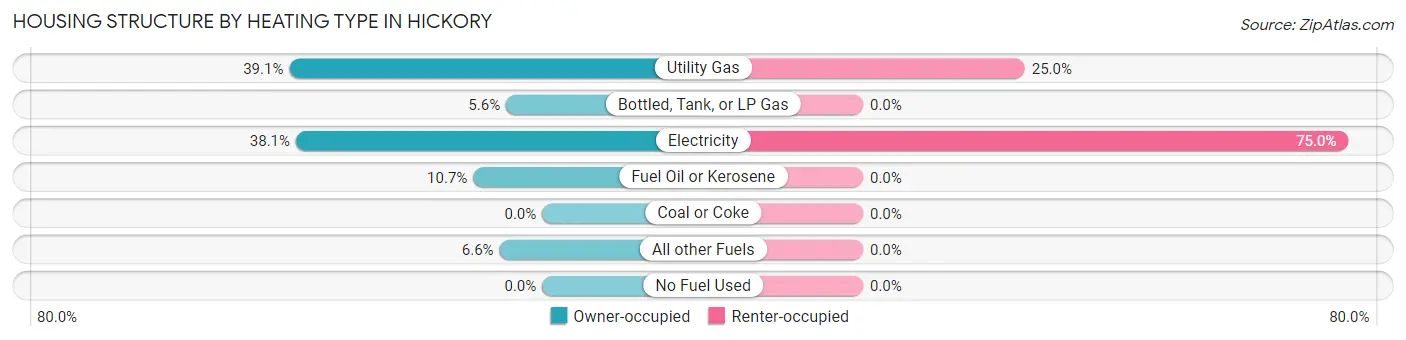
| Heating Type | Owner-occupied | Renter-occupied |
| Utility Gas | 77 (39.1%) | 12 (25.0%) |
| Bottled, Tank, or LP Gas | 11 (5.6%) | 0 (0.0%) |
| Electricity | 75 (38.1%) | 36 (75.0%) |
| Fuel Oil or Kerosene | 21 (10.7%) | 0 (0.0%) |
| Coal or Coke | 0 (0.0%) | 0 (0.0%) |
| All other Fuels | 13 (6.6%) | 0 (0.0%) |
| No Fuel Used | 0 (0.0%) | 0 (0.0%) |
| Total | 197 (100.0%) | 48 (100.0%) |
Household Vehicle Usage in Hickory
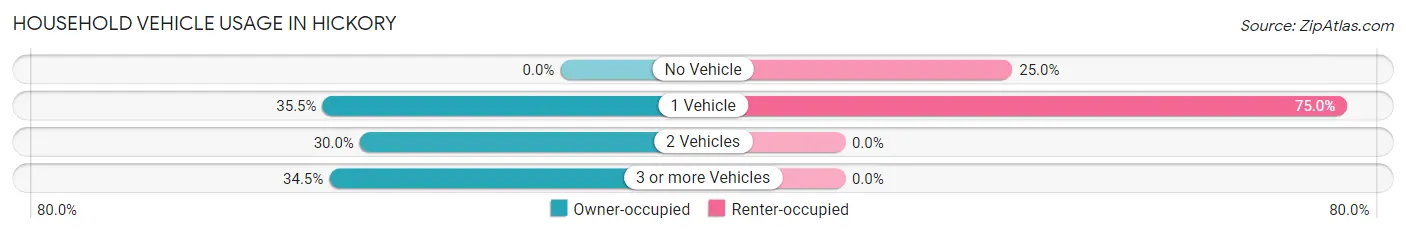
| Vehicles per Household | Owner-occupied | Renter-occupied |
| No Vehicle | 0 (0.0%) | 12 (25.0%) |
| 1 Vehicle | 70 (35.5%) | 36 (75.0%) |
| 2 Vehicles | 59 (29.9%) | 0 (0.0%) |
| 3 or more Vehicles | 68 (34.5%) | 0 (0.0%) |
| Total | 197 (100.0%) | 48 (100.0%) |
Real Estate & Mortgages in Hickory
Real Estate and Mortgage Overview in Hickory
| Characteristic | Without Mortgage | With Mortgage |
| Housing Units | 99 | 98 |
| Median Property Value | $156,000 | $199,000 |
| Median Household Income | - | - |
| Monthly Housing Costs | $512 | $0 |
| Real Estate Taxes | $2,470 | $0 |
Property Value by Mortgage Status in Hickory
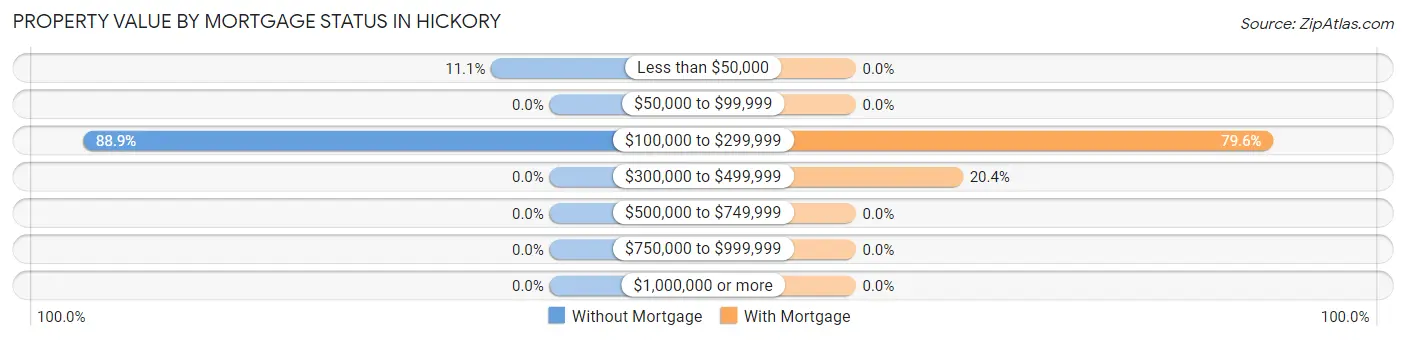
| Property Value | Without Mortgage | With Mortgage |
| Less than $50,000 | 11 (11.1%) | 0 (0.0%) |
| $50,000 to $99,999 | 0 (0.0%) | 0 (0.0%) |
| $100,000 to $299,999 | 88 (88.9%) | 78 (79.6%) |
| $300,000 to $499,999 | 0 (0.0%) | 20 (20.4%) |
| $500,000 to $749,999 | 0 (0.0%) | 0 (0.0%) |
| $750,000 to $999,999 | 0 (0.0%) | 0 (0.0%) |
| $1,000,000 or more | 0 (0.0%) | 0 (0.0%) |
| Total | 99 (100.0%) | 98 (100.0%) |
Household Income by Mortgage Status in Hickory
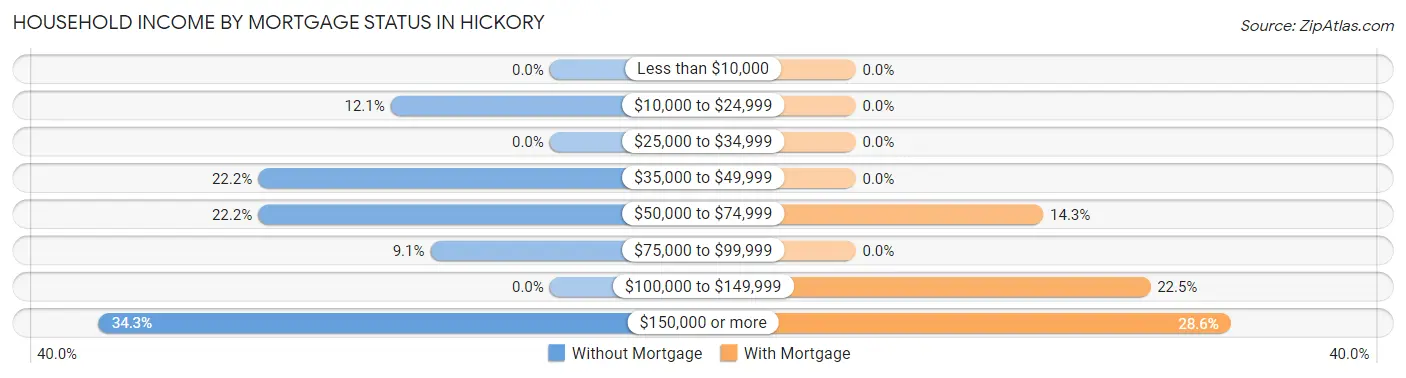
| Household Income | Without Mortgage | With Mortgage |
| Less than $10,000 | 0 (0.0%) | 0 (0.0%) |
| $10,000 to $24,999 | 12 (12.1%) | 0 (0.0%) |
| $25,000 to $34,999 | 0 (0.0%) | 0 (0.0%) |
| $35,000 to $49,999 | 22 (22.2%) | 0 (0.0%) |
| $50,000 to $74,999 | 22 (22.2%) | 14 (14.3%) |
| $75,000 to $99,999 | 9 (9.1%) | 0 (0.0%) |
| $100,000 to $149,999 | 0 (0.0%) | 22 (22.5%) |
| $150,000 or more | 34 (34.3%) | 28 (28.6%) |
| Total | 99 (100.0%) | 98 (100.0%) |
Property Value to Household Income Ratio in Hickory
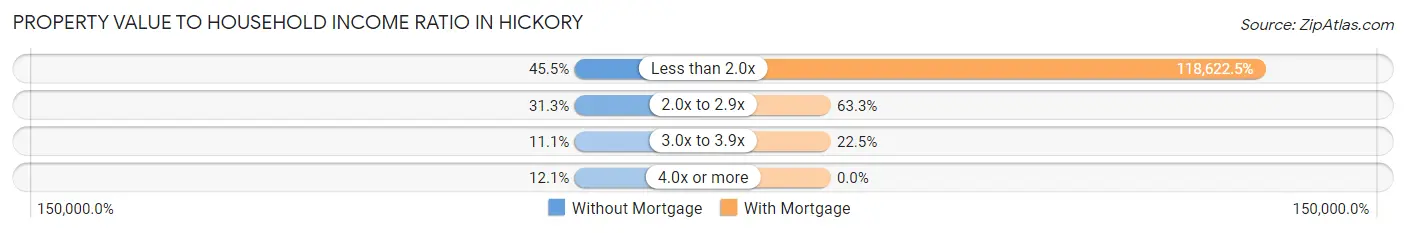
| Value-to-Income Ratio | Without Mortgage | With Mortgage |
| Less than 2.0x | 45 (45.5%) | 116,250 (118,622.5%) |
| 2.0x to 2.9x | 31 (31.3%) | 62 (63.3%) |
| 3.0x to 3.9x | 11 (11.1%) | 22 (22.5%) |
| 4.0x or more | 12 (12.1%) | 0 (0.0%) |
| Total | 99 (100.0%) | 98 (100.0%) |
Real Estate Taxes by Mortgage Status in Hickory
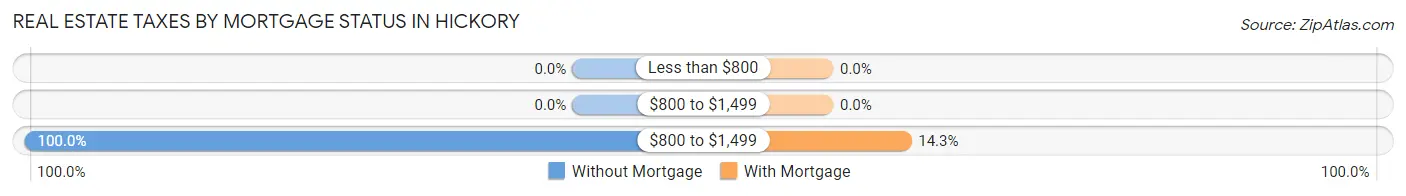
| Property Taxes | Without Mortgage | With Mortgage |
| Less than $800 | 0 (0.0%) | 0 (0.0%) |
| $800 to $1,499 | 0 (0.0%) | 0 (0.0%) |
| $800 to $1,499 | 99 (100.0%) | 14 (14.3%) |
| Total | 99 (100.0%) | 98 (100.0%) |
Health & Disability in Hickory
Health Insurance Coverage by Age in Hickory
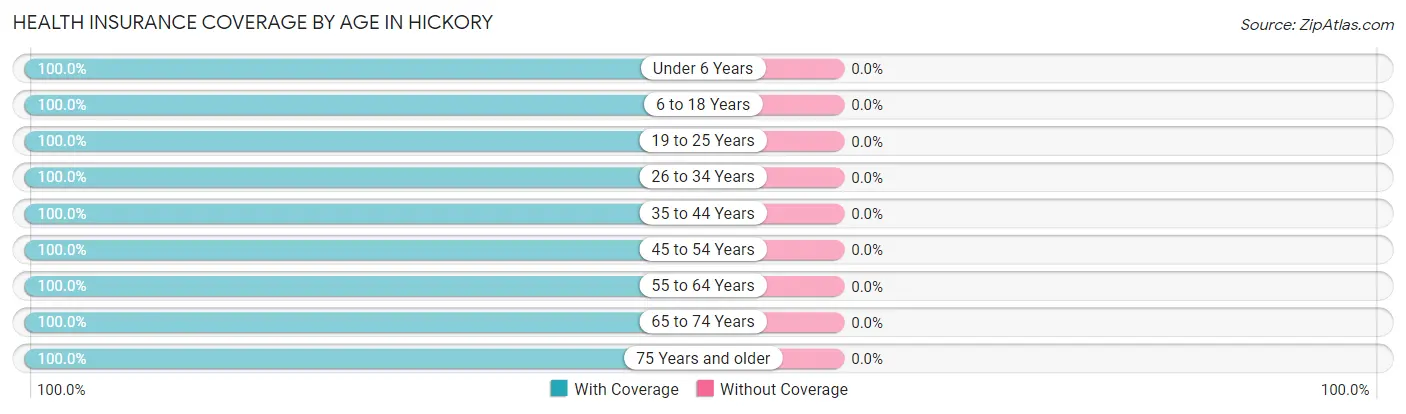
| Age Bracket | With Coverage | Without Coverage |
| Under 6 Years | 72 (100.0%) | 0 (0.0%) |
| 6 to 18 Years | 103 (100.0%) | 0 (0.0%) |
| 19 to 25 Years | 46 (100.0%) | 0 (0.0%) |
| 26 to 34 Years | 69 (100.0%) | 0 (0.0%) |
| 35 to 44 Years | 35 (100.0%) | 0 (0.0%) |
| 45 to 54 Years | 100 (100.0%) | 0 (0.0%) |
| 55 to 64 Years | 35 (100.0%) | 0 (0.0%) |
| 65 to 74 Years | 94 (100.0%) | 0 (0.0%) |
| 75 Years and older | 82 (100.0%) | 0 (0.0%) |
| Total | 636 (100.0%) | 0 (0.0%) |
Health Insurance Coverage by Citizenship Status in Hickory
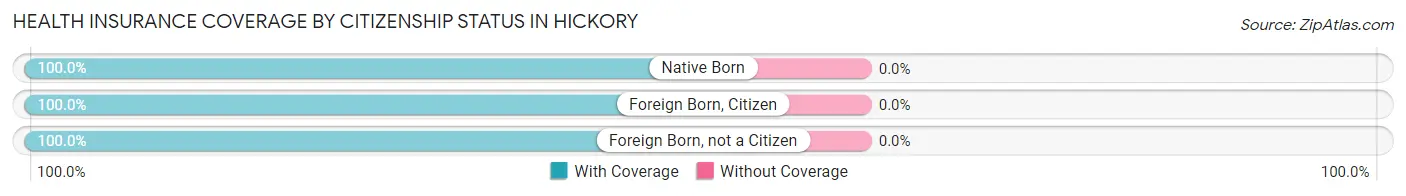
| Citizenship Status | With Coverage | Without Coverage |
| Native Born | 72 (100.0%) | 0 (0.0%) |
| Foreign Born, Citizen | 103 (100.0%) | 0 (0.0%) |
| Foreign Born, not a Citizen | 46 (100.0%) | 0 (0.0%) |
Health Insurance Coverage by Household Income in Hickory
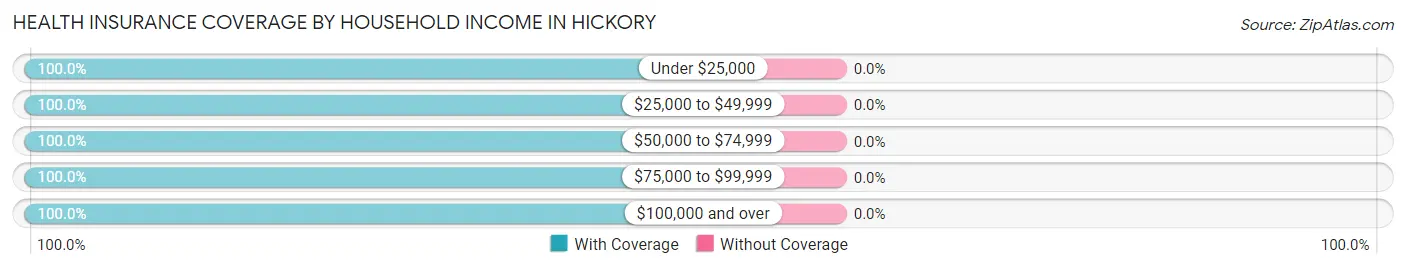
| Household Income | With Coverage | Without Coverage |
| Under $25,000 | 36 (100.0%) | 0 (0.0%) |
| $25,000 to $49,999 | 176 (100.0%) | 0 (0.0%) |
| $50,000 to $74,999 | 33 (100.0%) | 0 (0.0%) |
| $75,000 to $99,999 | 91 (100.0%) | 0 (0.0%) |
| $100,000 and over | 300 (100.0%) | 0 (0.0%) |
Public vs Private Health Insurance Coverage by Age in Hickory
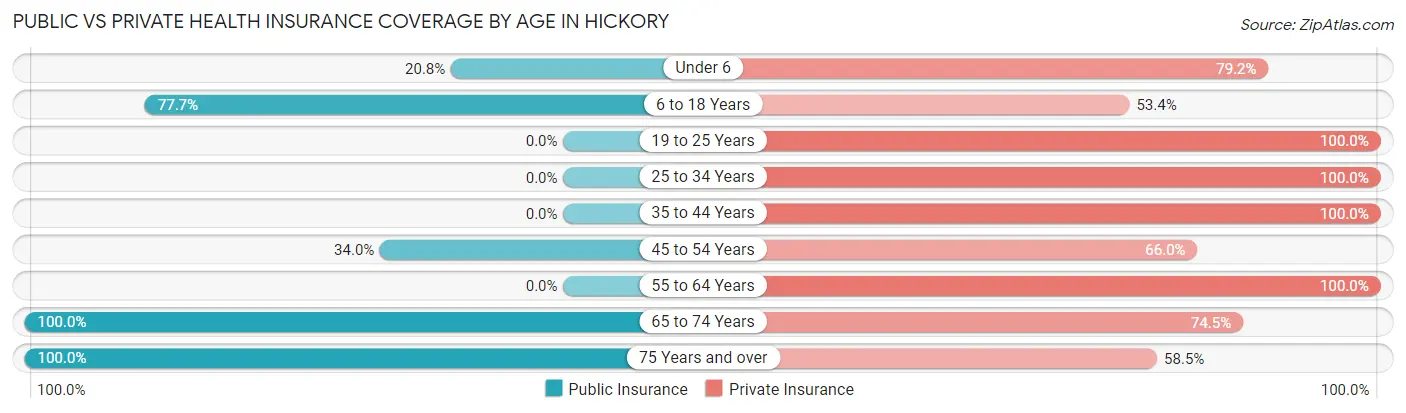
| Age Bracket | Public Insurance | Private Insurance |
| Under 6 | 15 (20.8%) | 57 (79.2%) |
| 6 to 18 Years | 80 (77.7%) | 55 (53.4%) |
| 19 to 25 Years | 0 (0.0%) | 46 (100.0%) |
| 25 to 34 Years | 0 (0.0%) | 69 (100.0%) |
| 35 to 44 Years | 0 (0.0%) | 35 (100.0%) |
| 45 to 54 Years | 34 (34.0%) | 66 (66.0%) |
| 55 to 64 Years | 0 (0.0%) | 35 (100.0%) |
| 65 to 74 Years | 94 (100.0%) | 70 (74.5%) |
| 75 Years and over | 82 (100.0%) | 48 (58.5%) |
| Total | 305 (48.0%) | 481 (75.6%) |
Disability Status by Sex by Age in Hickory
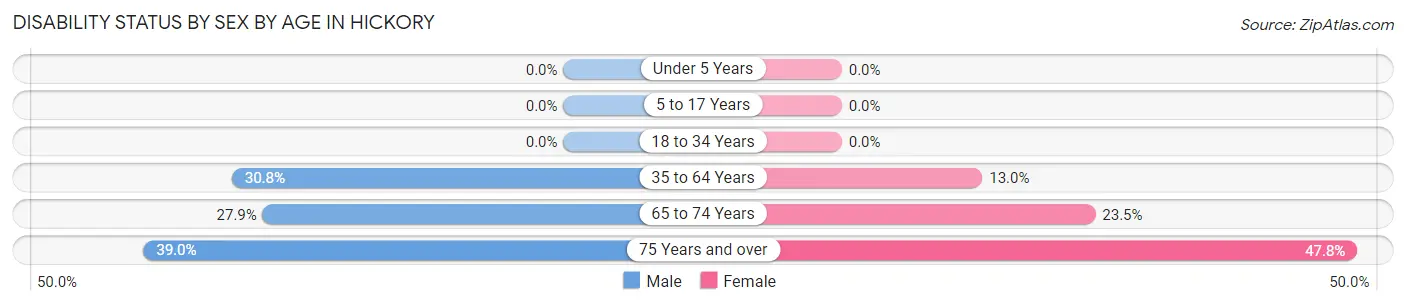
| Age Bracket | Male | Female |
| Under 5 Years | 0 (0.0%) | 0 (0.0%) |
| 5 to 17 Years | 0 (0.0%) | 0 (0.0%) |
| 18 to 34 Years | 0 (0.0%) | 0 (0.0%) |
| 35 to 64 Years | 24 (30.8%) | 12 (13.0%) |
| 65 to 74 Years | 12 (27.9%) | 12 (23.5%) |
| 75 Years and over | 23 (39.0%) | 11 (47.8%) |
Disability Class by Sex by Age in Hickory
Disability Class: Hearing Difficulty
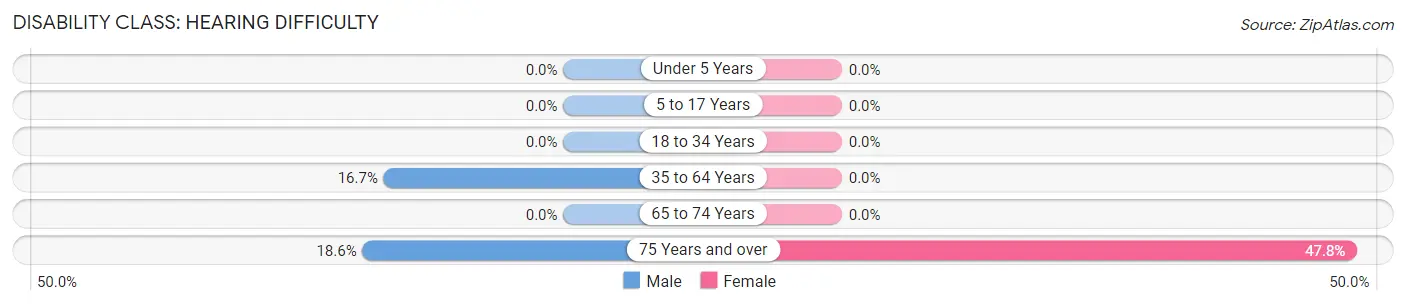
| Age Bracket | Male | Female |
| Under 5 Years | 0 (0.0%) | 0 (0.0%) |
| 5 to 17 Years | 0 (0.0%) | 0 (0.0%) |
| 18 to 34 Years | 0 (0.0%) | 0 (0.0%) |
| 35 to 64 Years | 13 (16.7%) | 0 (0.0%) |
| 65 to 74 Years | 0 (0.0%) | 0 (0.0%) |
| 75 Years and over | 11 (18.6%) | 11 (47.8%) |
Disability Class: Vision Difficulty
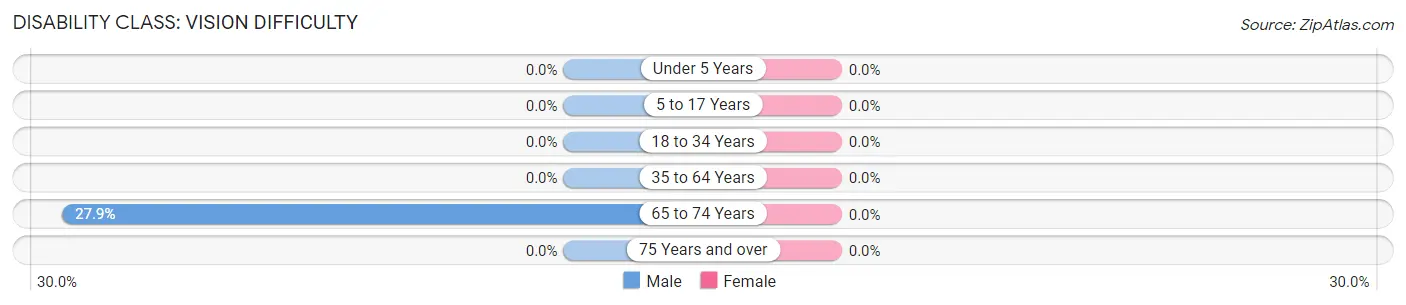
| Age Bracket | Male | Female |
| Under 5 Years | 0 (0.0%) | 0 (0.0%) |
| 5 to 17 Years | 0 (0.0%) | 0 (0.0%) |
| 18 to 34 Years | 0 (0.0%) | 0 (0.0%) |
| 35 to 64 Years | 0 (0.0%) | 0 (0.0%) |
| 65 to 74 Years | 12 (27.9%) | 0 (0.0%) |
| 75 Years and over | 0 (0.0%) | 0 (0.0%) |
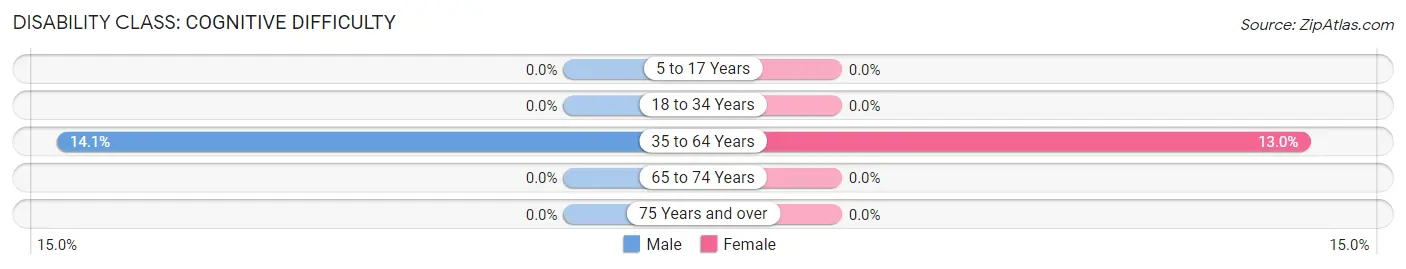
Disability Class: Cognitive Difficulty
| Age Bracket | Male | Female |
| 5 to 17 Years | 0 (0.0%) | 0 (0.0%) |
| 18 to 34 Years | 0 (0.0%) | 0 (0.0%) |
| 35 to 64 Years | 11 (14.1%) | 12 (13.0%) |
| 65 to 74 Years | 0 (0.0%) | 0 (0.0%) |
| 75 Years and over | 0 (0.0%) | 0 (0.0%) |
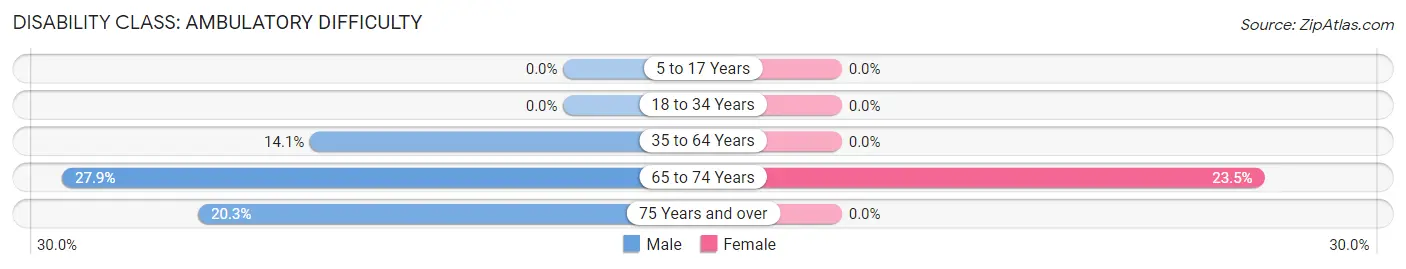
Disability Class: Ambulatory Difficulty
| Age Bracket | Male | Female |
| 5 to 17 Years | 0 (0.0%) | 0 (0.0%) |
| 18 to 34 Years | 0 (0.0%) | 0 (0.0%) |
| 35 to 64 Years | 11 (14.1%) | 0 (0.0%) |
| 65 to 74 Years | 12 (27.9%) | 12 (23.5%) |
| 75 Years and over | 12 (20.3%) | 0 (0.0%) |
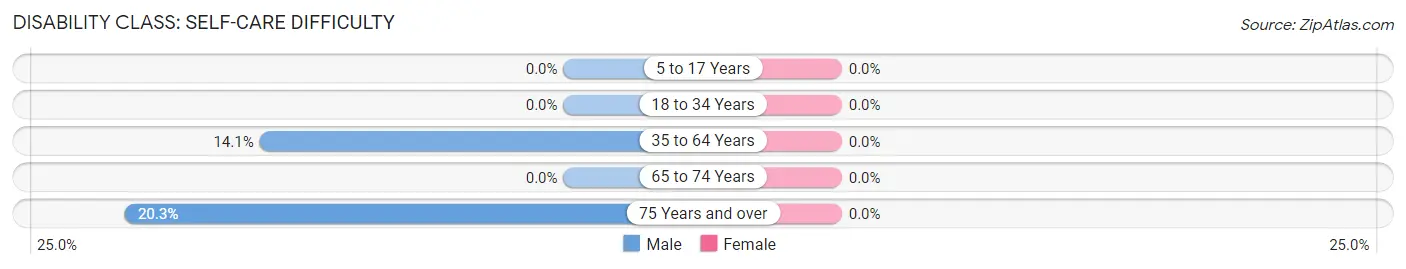
Disability Class: Self-Care Difficulty
| Age Bracket | Male | Female |
| 5 to 17 Years | 0 (0.0%) | 0 (0.0%) |
| 18 to 34 Years | 0 (0.0%) | 0 (0.0%) |
| 35 to 64 Years | 11 (14.1%) | 0 (0.0%) |
| 65 to 74 Years | 0 (0.0%) | 0 (0.0%) |
| 75 Years and over | 12 (20.3%) | 0 (0.0%) |
Technology Access in Hickory
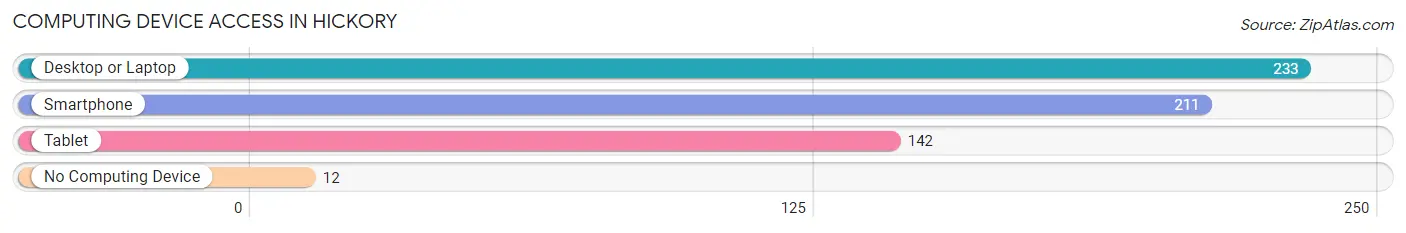
Computing Device Access in Hickory
| Device Type | # Households | % Households |
| Desktop or Laptop | 233 | 95.1% |
| Smartphone | 211 | 86.1% |
| Tablet | 142 | 58.0% |
| No Computing Device | 12 | 4.9% |
| Total | 245 | 100.0% |
Internet Access in Hickory
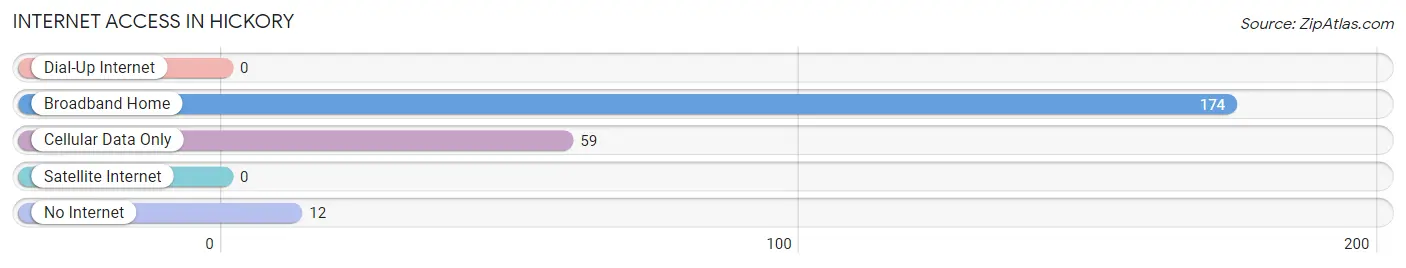
| Internet Type | # Households | % Households |
| Dial-Up Internet | 0 | 0.0% |
| Broadband Home | 174 | 71.0% |
| Cellular Data Only | 59 | 24.1% |
| Satellite Internet | 0 | 0.0% |
| No Internet | 12 | 4.9% |
| Total | 245 | 100.0% |
Hickory Summary
Hickory is a small borough located in Mercer County, Pennsylvania. It is situated in the Shenango Valley, approximately 30 miles north of Pittsburgh. The population of Hickory was 1,845 as of the 2010 census.
History
Hickory was founded in 1817 by a group of settlers from New England. The town was named after the hickory trees that grew in the area. The first settlers were mostly farmers, and the town quickly grew to become a center of commerce and industry. In 1820, the first post office was established in Hickory.
In 1845, the first railroad line was built through Hickory, connecting it to the larger cities of Pittsburgh and Erie. This allowed for the transportation of goods and people, and helped to spur the growth of the town.
In 1871, the first school was built in Hickory. The school was a two-room building, and it served as the only school in the area until the early 1900s.
In the late 1800s, Hickory became a center of the oil and gas industry. The town was home to several oil refineries, and the industry provided jobs and economic growth for the area.
Geography
Hickory is located in the Shenango Valley, in the northwest corner of Mercer County. The borough is situated on the banks of the Shenango River, and is surrounded by rolling hills and farmland. The climate in Hickory is humid continental, with cold winters and hot, humid summers.
The total area of Hickory is 0.8 square miles, all of which is land. The borough is located approximately 30 miles north of Pittsburgh, and is accessible by the Pennsylvania Turnpike and Interstate 79.
Economy
Hickory’s economy is largely based on agriculture and manufacturing. The town is home to several small businesses, including a grocery store, a hardware store, and a few restaurants.
The town is also home to several manufacturing companies, including a plastics manufacturer, a metal fabricator, and a machine shop. These companies provide jobs for many of the town’s residents.
The town is also home to several oil and gas companies, which provide jobs and economic growth for the area.
Demographics
As of the 2010 census, the population of Hickory was 1,845. The racial makeup of the town was 97.3% White, 0.7% African American, 0.2% Native American, 0.3% Asian, and 1.5% from other races.
The median household income in Hickory was $37,917, and the median family income was $45,938. The per capita income was $19,945.
The town is home to several churches, including the Hickory United Methodist Church, the Hickory Presbyterian Church, and the Hickory Baptist Church. The town also has a public library, a post office, and a volunteer fire department.
Common Questions
What is Per Capita Income in Hickory?
Per Capita income in Hickory is $36,335.
What is the Median Family Income in Hickory?
Median Family Income in Hickory is $105,481.
What is the Median Household income in Hickory?
Median Household Income in Hickory is $75,511.
What is Inequality or Gini Index in Hickory?
Inequality or Gini Index in Hickory is 0.42.
What is the Total Population of Hickory?
Total Population of Hickory is 636.
What is the Total Male Population of Hickory?
Total Male Population of Hickory is 358.
What is the Total Female Population of Hickory?
Total Female Population of Hickory is 278.
What is the Ratio of Males per 100 Females in Hickory?
There are 128.78 Males per 100 Females in Hickory.
What is the Ratio of Females per 100 Males in Hickory?
There are 77.65 Females per 100 Males in Hickory.
What is the Median Population Age in Hickory?
Median Population Age in Hickory is 41.4 Years.
What is the Average Family Size in Hickory
Average Family Size in Hickory is 3.4 People.
What is the Average Household Size in Hickory
Average Household Size in Hickory is 2.6 People.
How Large is the Labor Force in Hickory?
There are 206 People in the Labor Forcein in Hickory.
What is the Percentage of People in the Labor Force in Hickory?
39.3% of People are in the Labor Force in Hickory.