Atlantic, PA Map & Demographics
Atlantic Map
Atlantic Overview
$28,608
PER CAPITA INCOME
$83,750
AVG FAMILY INCOME
$76,250
AVG HOUSEHOLD INCOME
0.34
INEQUALITY / GINI INDEX
64
TOTAL POPULATION
20
MALE POPULATION
44
FEMALE POPULATION
45.45
MALES / 100 FEMALES
220.00
FEMALES / 100 MALES
36.8
MEDIAN AGE
3.9
AVG FAMILY SIZE
3.2
AVG HOUSEHOLD SIZE
29
LABOR FORCE [ PEOPLE ]
60.4%
PERCENT IN LABOR FORCE
17.2%
UNEMPLOYMENT RATE
Atlantic Zip Codes
Atlantic Area Codes
Income in Atlantic
Income Overview in Atlantic
Per Capita Income in Atlantic is $28,608, while median incomes of families and households are $83,750 and $76,250 respectively.
| Characteristic | Number | Measure |
| Per Capita Income | 64 | $28,608 |
| Median Family Income | 15 | $83,750 |
| Mean Family Income | 15 | $97,687 |
| Median Household Income | 20 | $76,250 |
| Mean Household Income | 20 | $78,255 |
| Income Deficit | 15 | $0 |
| Wage / Income Gap (%) | 64 | 0.00% |
| Wage / Income Gap ($) | 64 | 100.00¢ per $1 |
| Gini / Inequality Index | 64 | 0.34 |
Earnings by Sex in Atlantic
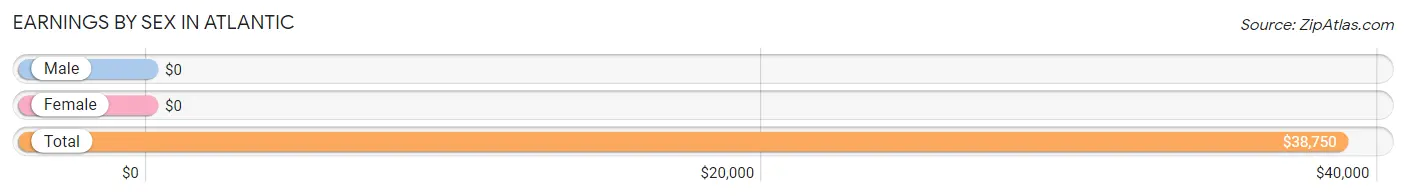
| Sex | Number | Average Earnings |
| Male | 11 (39.3%) | $0 |
| Female | 17 (60.7%) | $0 |
| Total | 28 (100.0%) | $38,750 |
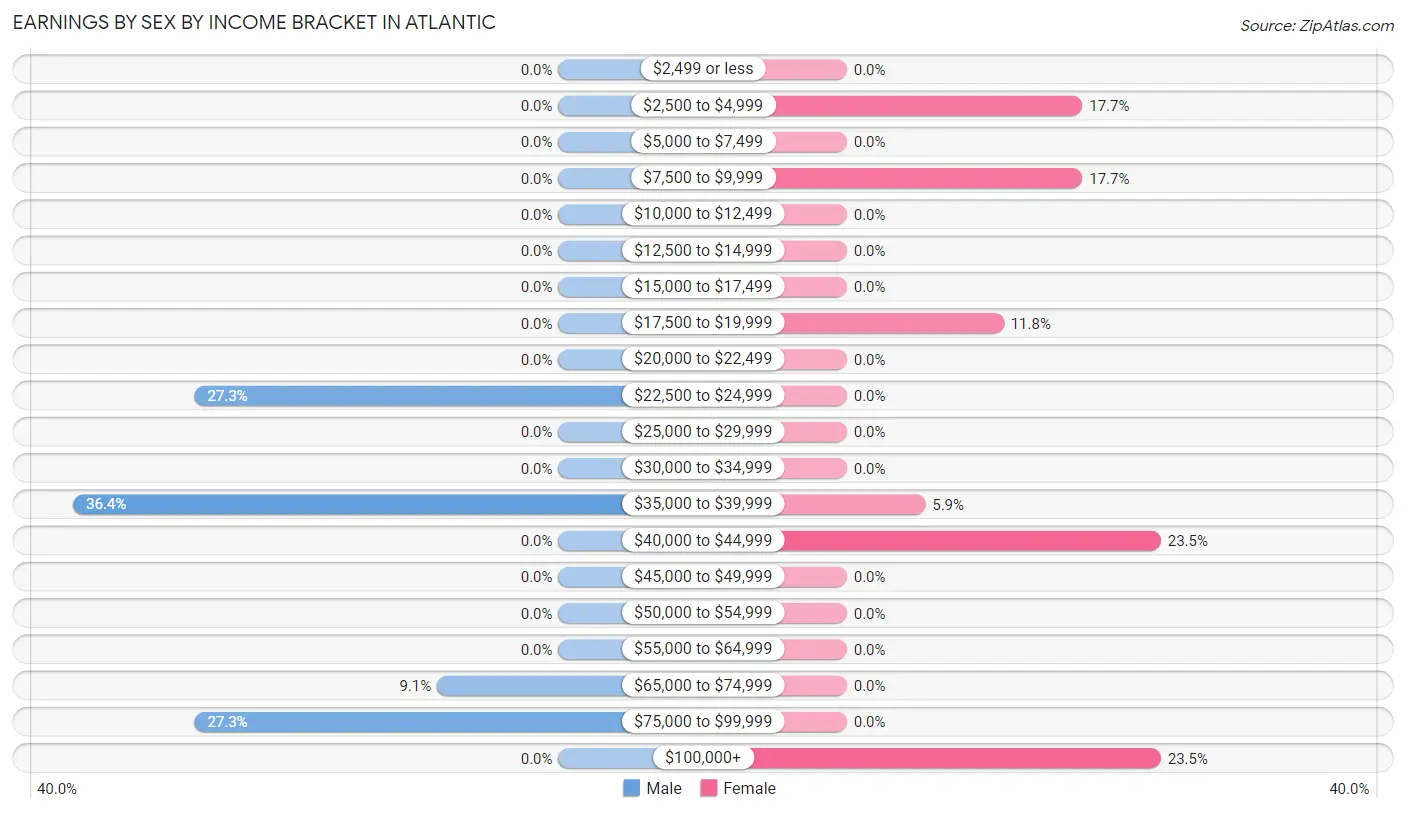
Earnings by Sex by Income Bracket in Atlantic
The most common earnings brackets in Atlantic are $35,000 to $39,999 for men (4 | 36.4%) and $40,000 to $44,999 for women (4 | 23.5%).
| Income | Male | Female |
| $2,499 or less | 0 (0.0%) | 0 (0.0%) |
| $2,500 to $4,999 | 0 (0.0%) | 3 (17.6%) |
| $5,000 to $7,499 | 0 (0.0%) | 0 (0.0%) |
| $7,500 to $9,999 | 0 (0.0%) | 3 (17.6%) |
| $10,000 to $12,499 | 0 (0.0%) | 0 (0.0%) |
| $12,500 to $14,999 | 0 (0.0%) | 0 (0.0%) |
| $15,000 to $17,499 | 0 (0.0%) | 0 (0.0%) |
| $17,500 to $19,999 | 0 (0.0%) | 2 (11.8%) |
| $20,000 to $22,499 | 0 (0.0%) | 0 (0.0%) |
| $22,500 to $24,999 | 3 (27.3%) | 0 (0.0%) |
| $25,000 to $29,999 | 0 (0.0%) | 0 (0.0%) |
| $30,000 to $34,999 | 0 (0.0%) | 0 (0.0%) |
| $35,000 to $39,999 | 4 (36.4%) | 1 (5.9%) |
| $40,000 to $44,999 | 0 (0.0%) | 4 (23.5%) |
| $45,000 to $49,999 | 0 (0.0%) | 0 (0.0%) |
| $50,000 to $54,999 | 0 (0.0%) | 0 (0.0%) |
| $55,000 to $64,999 | 0 (0.0%) | 0 (0.0%) |
| $65,000 to $74,999 | 1 (9.1%) | 0 (0.0%) |
| $75,000 to $99,999 | 3 (27.3%) | 0 (0.0%) |
| $100,000+ | 0 (0.0%) | 4 (23.5%) |
| Total | 11 (100.0%) | 17 (100.0%) |
Earnings by Sex by Educational Attainment in Atlantic
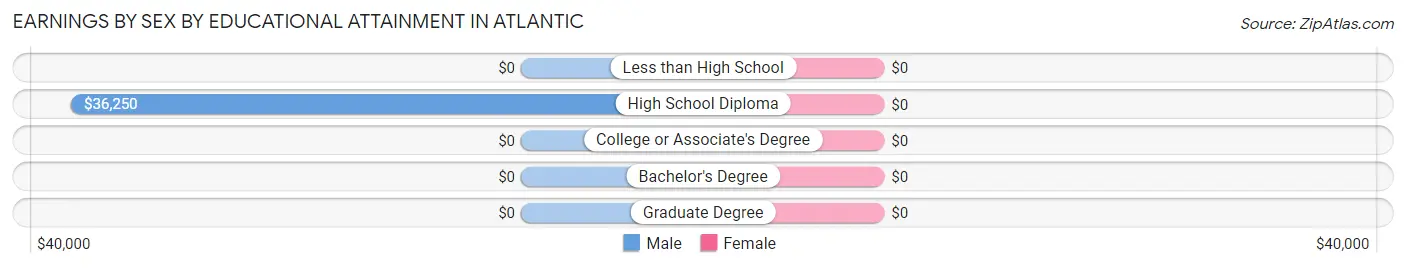
| Educational Attainment | Male Income | Female Income |
| Less than High School | - | - |
| High School Diploma | $36,250 | $0 |
| College or Associate's Degree | - | - |
| Bachelor's Degree | - | - |
| Graduate Degree | - | - |
| Total | - | - |
Family Income in Atlantic
Family Income Brackets in Atlantic
According to the Atlantic family income data, there are 4 families falling into the $75,000 to $99,999 income range, which is the most common income bracket and makes up 26.7% of all families.
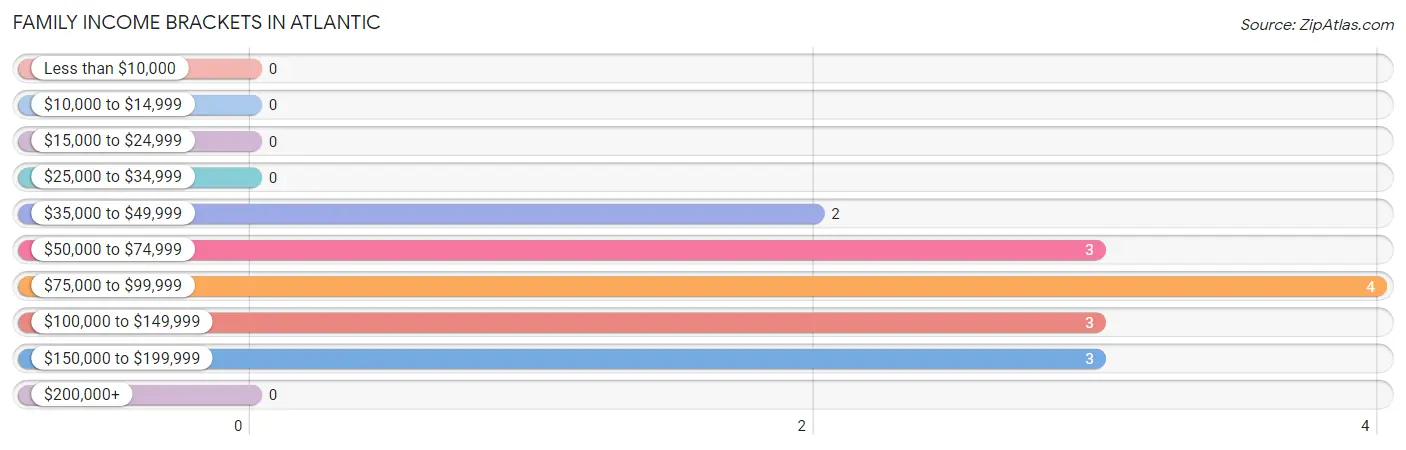
| Income Bracket | # Families | % Families |
| Less than $10,000 | 0 | 0.0% |
| $10,000 to $14,999 | 0 | 0.0% |
| $15,000 to $24,999 | 0 | 0.0% |
| $25,000 to $34,999 | 0 | 0.0% |
| $35,000 to $49,999 | 2 | 13.3% |
| $50,000 to $74,999 | 3 | 20.0% |
| $75,000 to $99,999 | 4 | 26.7% |
| $100,000 to $149,999 | 3 | 20.0% |
| $150,000 to $199,999 | 3 | 20.0% |
| $200,000+ | 0 | 0.0% |
Family Income by Famaliy Size in Atlantic
2-person families (8 | 53.3%) account for the highest median family income in Atlantic with $72,500 per family, while 2-person families (8 | 53.3%) have the highest median income of $36,250 per family member.
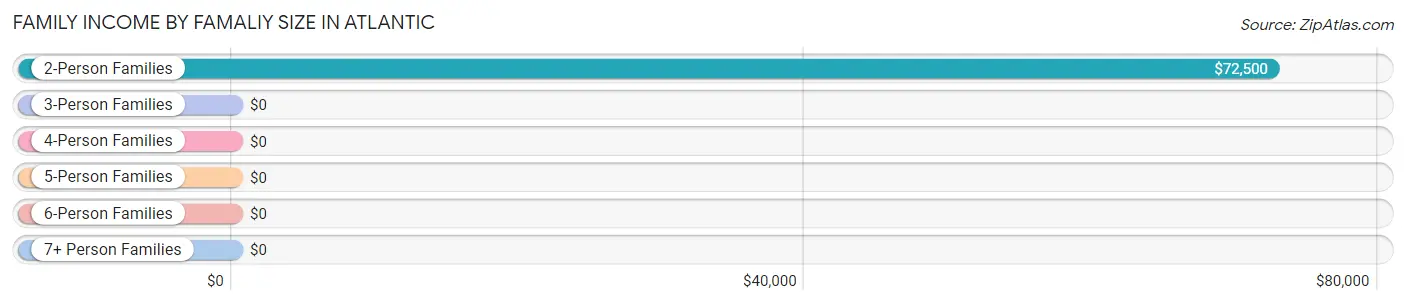
| Income Bracket | # Families | Median Income |
| 2-Person Families | 8 (53.3%) | $72,500 |
| 3-Person Families | 3 (20.0%) | $0 |
| 4-Person Families | 0 (0.0%) | $0 |
| 5-Person Families | 1 (6.7%) | $0 |
| 6-Person Families | 0 (0.0%) | $0 |
| 7+ Person Families | 3 (20.0%) | $0 |
| Total | 15 (100.0%) | $83,750 |
Family Income by Number of Earners in Atlantic
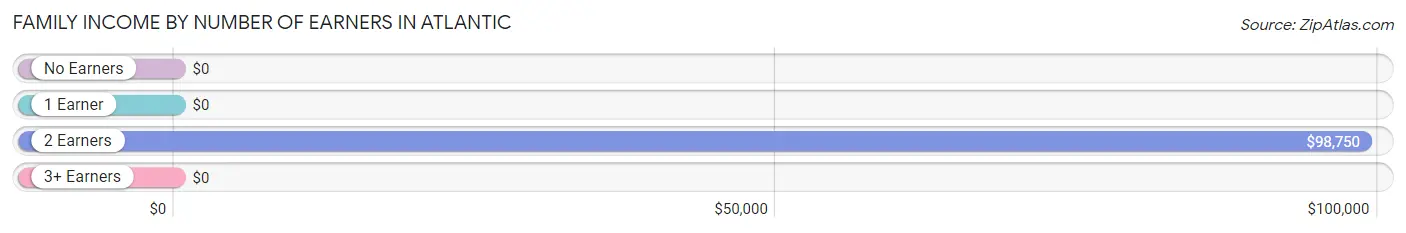
| Number of Earners | # Families | Median Income |
| No Earners | 2 (13.3%) | $0 |
| 1 Earner | 1 (6.7%) | $0 |
| 2 Earners | 12 (80.0%) | $98,750 |
| 3+ Earners | 0 (0.0%) | $0 |
| Total | 15 (100.0%) | $83,750 |
Household Income in Atlantic
Household Income Brackets in Atlantic
With 5 households falling in the category, the $15,000 to $24,999 income range is the most frequent in Atlantic, accounting for 25.0% of all households.
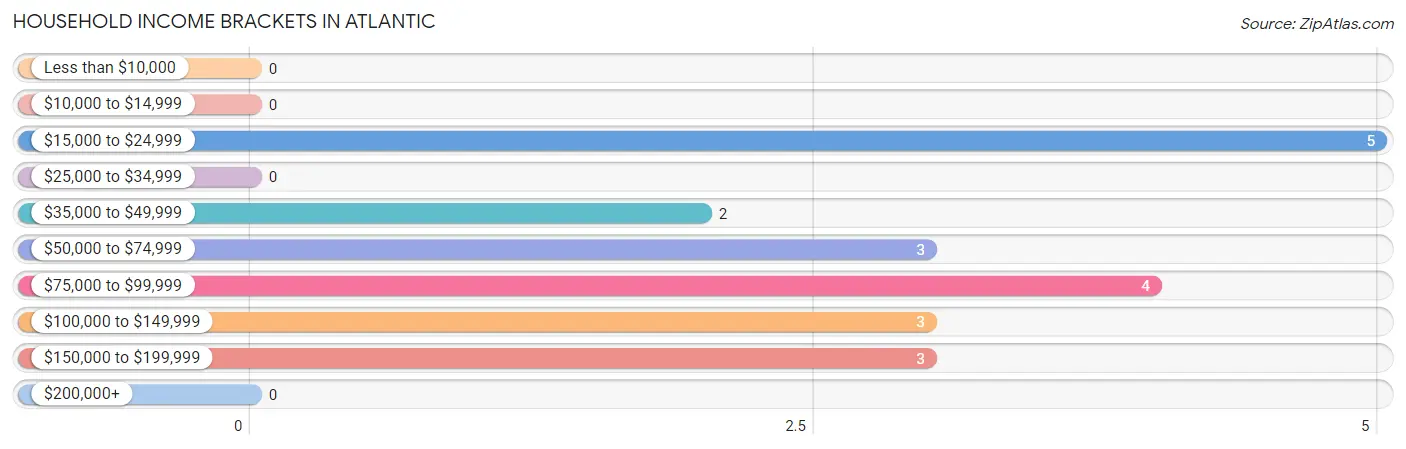
| Income Bracket | # Households | % Households |
| Less than $10,000 | 0 | 0.0% |
| $10,000 to $14,999 | 0 | 0.0% |
| $15,000 to $24,999 | 5 | 25.0% |
| $25,000 to $34,999 | 0 | 0.0% |
| $35,000 to $49,999 | 2 | 10.0% |
| $50,000 to $74,999 | 3 | 15.0% |
| $75,000 to $99,999 | 4 | 20.0% |
| $100,000 to $149,999 | 3 | 15.0% |
| $150,000 to $199,999 | 3 | 15.0% |
| $200,000+ | 0 | 0.0% |
Household Income by Householder Age in Atlantic
The median household income in Atlantic is $76,250, with the highest median household income of $83,333 found in the 25 to 44 years age bracket for the primary householder. A total of 10 households (50.0%) fall into this category.
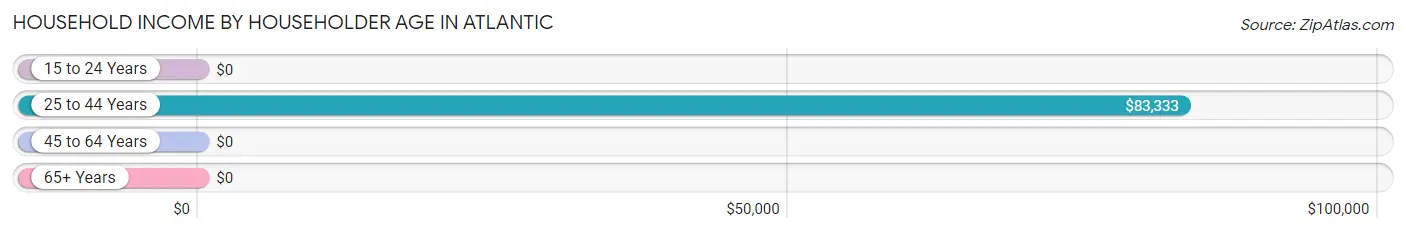
| Income Bracket | # Households | Median Income |
| 15 to 24 Years | 0 (0.0%) | $0 |
| 25 to 44 Years | 10 (50.0%) | $83,333 |
| 45 to 64 Years | 3 (15.0%) | $0 |
| 65+ Years | 7 (35.0%) | $0 |
| Total | 20 (100.0%) | $76,250 |
Poverty in Atlantic
Income Below Poverty by Sex and Age in Atlantic
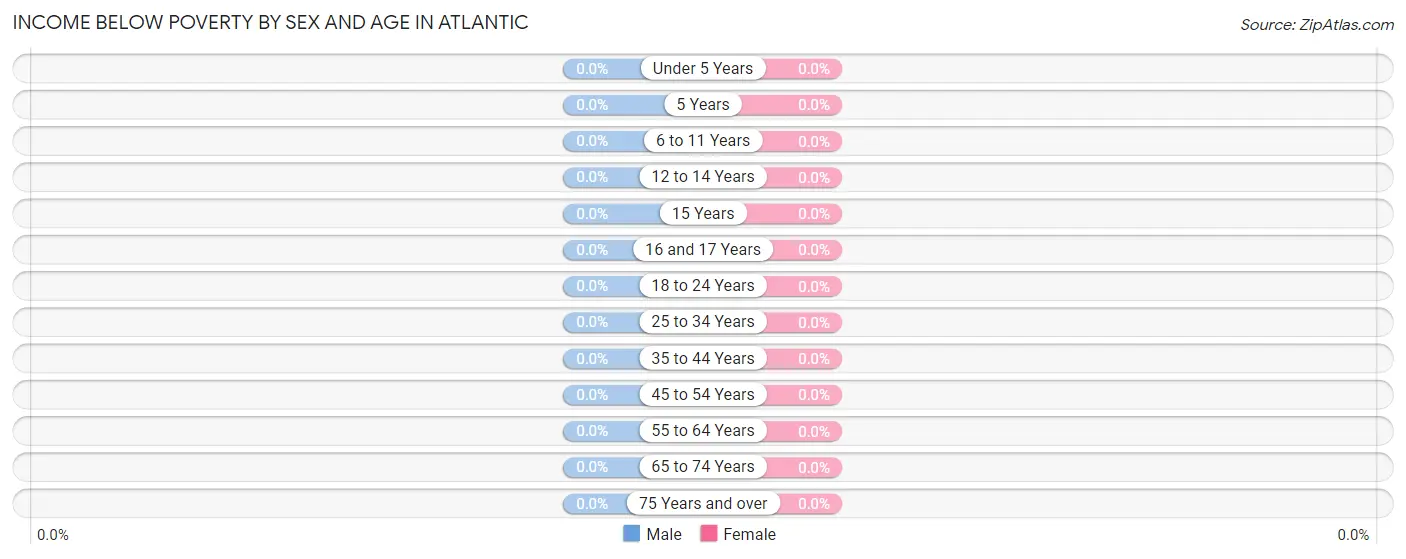
| Age Bracket | Male | Female |
| Under 5 Years | 0 (0.0%) | 0 (0.0%) |
| 5 Years | 0 (0.0%) | 0 (0.0%) |
| 6 to 11 Years | 0 (0.0%) | 0 (0.0%) |
| 12 to 14 Years | 0 (0.0%) | 0 (0.0%) |
| 15 Years | 0 (0.0%) | 0 (0.0%) |
| 16 and 17 Years | 0 (0.0%) | 0 (0.0%) |
| 18 to 24 Years | 0 (0.0%) | 0 (0.0%) |
| 25 to 34 Years | 0 (0.0%) | 0 (0.0%) |
| 35 to 44 Years | 0 (0.0%) | 0 (0.0%) |
| 45 to 54 Years | 0 (0.0%) | 0 (0.0%) |
| 55 to 64 Years | 0 (0.0%) | 0 (0.0%) |
| 65 to 74 Years | 0 (0.0%) | 0 (0.0%) |
| 75 Years and over | 0 (0.0%) | 0 (0.0%) |
| Total | 0 (0.0%) | 0 (0.0%) |
Income Above Poverty by Sex and Age in Atlantic
According to the poverty statistics in Atlantic, males aged under 5 years and females aged under 5 years are the age groups that are most secure financially, with 100.0% of males and 100.0% of females in these age groups living above the poverty line.
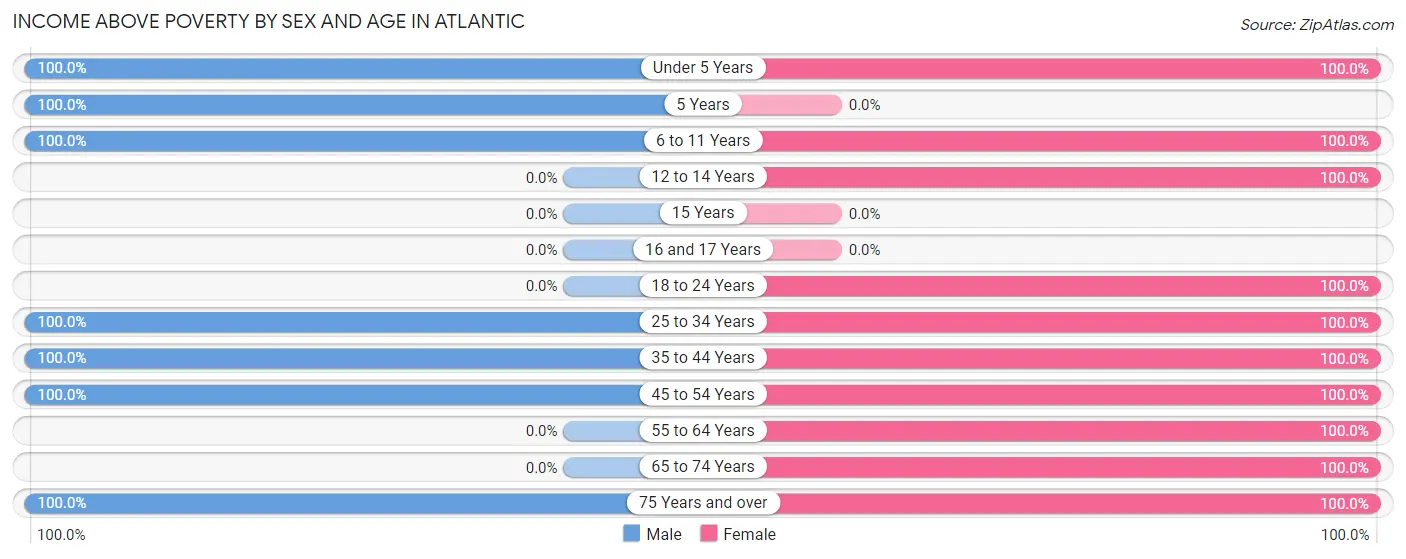
| Age Bracket | Male | Female |
| Under 5 Years | 1 (100.0%) | 3 (100.0%) |
| 5 Years | 3 (100.0%) | 0 (0.0%) |
| 6 to 11 Years | 3 (100.0%) | 3 (100.0%) |
| 12 to 14 Years | 0 (0.0%) | 3 (100.0%) |
| 15 Years | 0 (0.0%) | 0 (0.0%) |
| 16 and 17 Years | 0 (0.0%) | 0 (0.0%) |
| 18 to 24 Years | 0 (0.0%) | 5 (100.0%) |
| 25 to 34 Years | 6 (100.0%) | 2 (100.0%) |
| 35 to 44 Years | 4 (100.0%) | 5 (100.0%) |
| 45 to 54 Years | 1 (100.0%) | 9 (100.0%) |
| 55 to 64 Years | 0 (0.0%) | 3 (100.0%) |
| 65 to 74 Years | 0 (0.0%) | 7 (100.0%) |
| 75 Years and over | 2 (100.0%) | 4 (100.0%) |
| Total | 20 (100.0%) | 44 (100.0%) |
Income Below Poverty Among Married-Couple Families in Atlantic
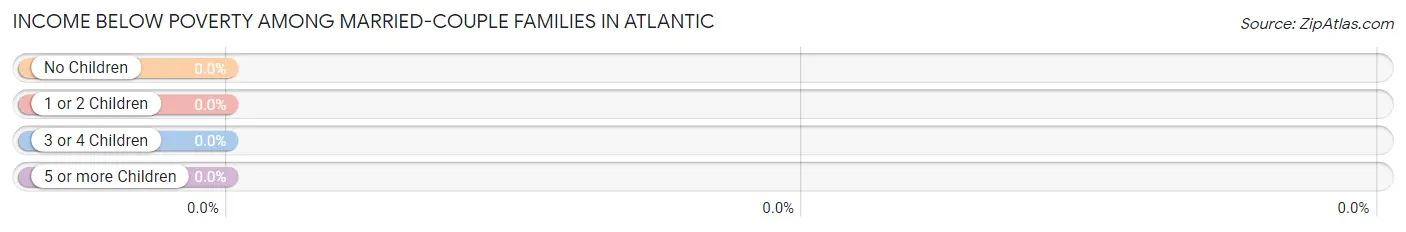
| Children | Above Poverty | Below Poverty |
| No Children | 8 (100.0%) | 0 (0.0%) |
| 1 or 2 Children | 1 (100.0%) | 0 (0.0%) |
| 3 or 4 Children | 0 (0.0%) | 0 (0.0%) |
| 5 or more Children | 3 (100.0%) | 0 (0.0%) |
| Total | 12 (100.0%) | 0 (0.0%) |
Income Below Poverty Among Single-Parent Households in Atlantic
| Children | Single Father | Single Mother |
| No Children | 0 (0.0%) | 0 (0.0%) |
| 1 or 2 Children | 0 (0.0%) | 0 (0.0%) |
| 3 or 4 Children | 0 (0.0%) | 0 (0.0%) |
| 5 or more Children | 0 (0.0%) | 0 (0.0%) |
| Total | 0 (0.0%) | 0 (0.0%) |
Income Below Poverty Among Married-Couple vs Single-Parent Households in Atlantic
| Children | Married-Couple Families | Single-Parent Households |
| No Children | 0 (0.0%) | 0 (0.0%) |
| 1 or 2 Children | 0 (0.0%) | 0 (0.0%) |
| 3 or 4 Children | 0 (0.0%) | 0 (0.0%) |
| 5 or more Children | 0 (0.0%) | 0 (0.0%) |
| Total | 0 (0.0%) | 0 (0.0%) |
Race in Atlantic
The most populous races in Atlantic are White / Caucasian (56 | 87.5%), and Two or more Races (8 | 12.5%).
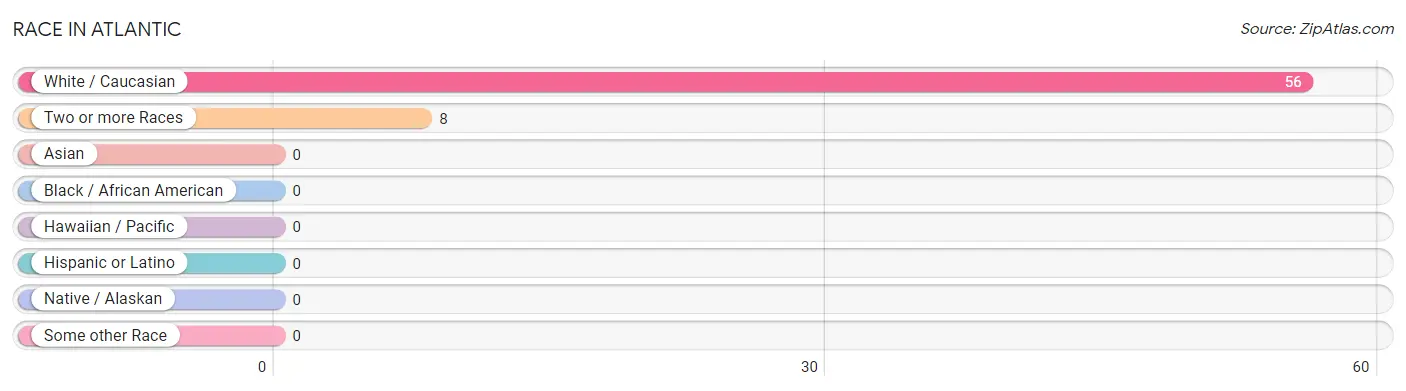
| Race | # Population | % Population |
| Asian | 0 | 0.0% |
| Black / African American | 0 | 0.0% |
| Hawaiian / Pacific | 0 | 0.0% |
| Hispanic or Latino | 0 | 0.0% |
| Native / Alaskan | 0 | 0.0% |
| White / Caucasian | 56 | 87.5% |
| Two or more Races | 8 | 12.5% |
| Some other Race | 0 | 0.0% |
| Total | 64 | 100.0% |
Ancestry in Atlantic
The most populous ancestries reported in Atlantic are American (18 | 28.1%), German (9 | 14.1%), Irish (4 | 6.2%), and Scotch-Irish (3 | 4.7%), together accounting for 53.1% of all Atlantic residents.
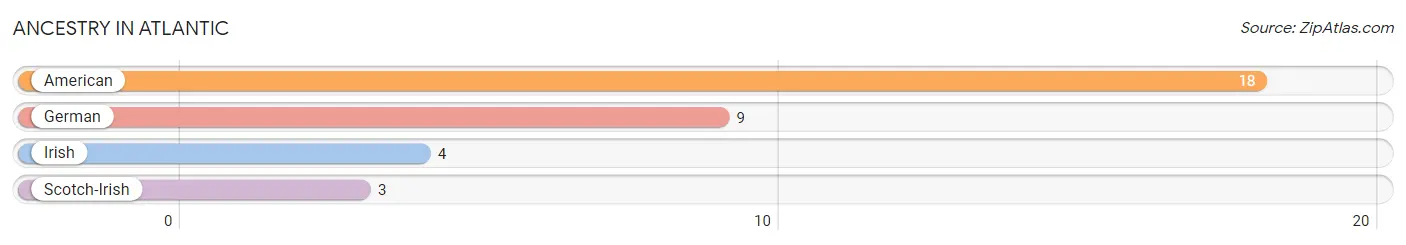
| Ancestry | # Population | % Population |
| American | 18 | 28.1% |
| German | 9 | 14.1% |
| Irish | 4 | 6.2% |
| Scotch-Irish | 3 | 4.7% | View All 4 Rows |
Immigrants in Atlantic

| Immigration Origin | # Population | % Population | View All 0 Rows |
Sex and Age in Atlantic
Sex and Age in Atlantic
The most populous age groups in Atlantic are 5 to 9 Years (6 | 30.0%) for men and 70 to 74 Years (7 | 15.9%) for women.

| Age Bracket | Male | Female |
| Under 5 Years | 1 (5.0%) | 3 (6.8%) |
| 5 to 9 Years | 6 (30.0%) | 3 (6.8%) |
| 10 to 14 Years | 0 (0.0%) | 3 (6.8%) |
| 15 to 19 Years | 0 (0.0%) | 1 (2.3%) |
| 20 to 24 Years | 0 (0.0%) | 4 (9.1%) |
| 25 to 29 Years | 6 (30.0%) | 0 (0.0%) |
| 30 to 34 Years | 0 (0.0%) | 2 (4.5%) |
| 35 to 39 Years | 3 (15.0%) | 4 (9.1%) |
| 40 to 44 Years | 1 (5.0%) | 1 (2.3%) |
| 45 to 49 Years | 1 (5.0%) | 5 (11.4%) |
| 50 to 54 Years | 0 (0.0%) | 4 (9.1%) |
| 55 to 59 Years | 0 (0.0%) | 3 (6.8%) |
| 60 to 64 Years | 0 (0.0%) | 0 (0.0%) |
| 65 to 69 Years | 0 (0.0%) | 0 (0.0%) |
| 70 to 74 Years | 0 (0.0%) | 7 (15.9%) |
| 75 to 79 Years | 0 (0.0%) | 0 (0.0%) |
| 80 to 84 Years | 0 (0.0%) | 2 (4.5%) |
| 85 Years and over | 2 (10.0%) | 2 (4.5%) |
| Total | 20 (100.0%) | 44 (100.0%) |
Families and Households in Atlantic
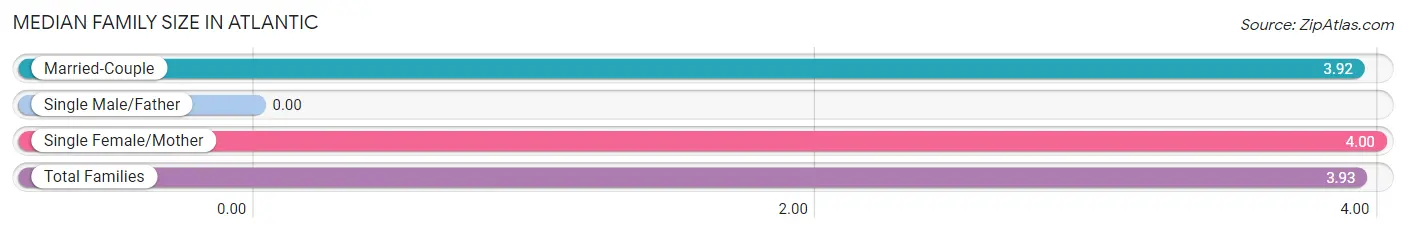
Median Family Size in Atlantic
| Family Type | # Families | Family Size |
| Married-Couple | 12 (80.0%) | 3.92 |
| Single Male/Father | 0 (0.0%) | - |
| Single Female/Mother | 3 (20.0%) | 4.00 |
| Total Families | 15 (100.0%) | 3.93 |
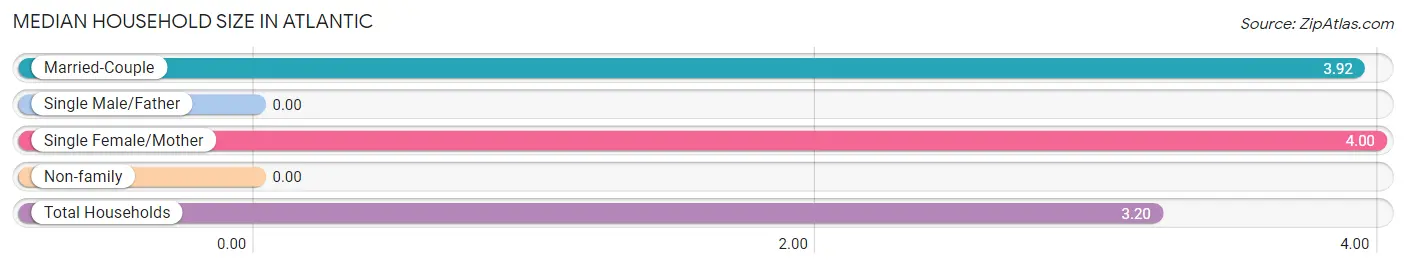
Median Household Size in Atlantic
| Household Type | # Households | Household Size |
| Married-Couple | 12 (60.0%) | 3.92 |
| Single Male/Father | 0 (0.0%) | - |
| Single Female/Mother | 3 (15.0%) | 4.00 |
| Non-family | 5 (25.0%) | - |
| Total Households | 20 (100.0%) | 3.20 |
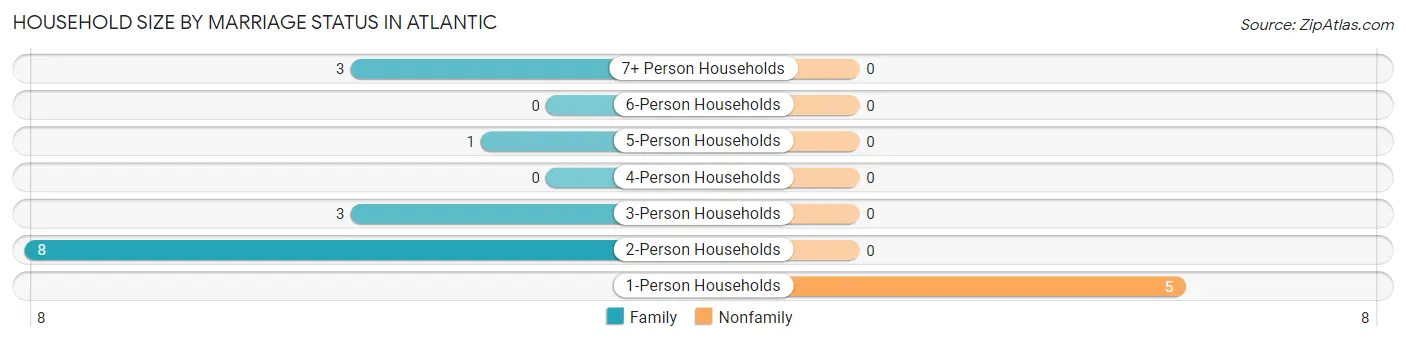
Household Size by Marriage Status in Atlantic
Out of a total of 20 households in Atlantic, 15 (75.0%) are family households, while 5 (25.0%) are nonfamily households. The most numerous type of family households are 2-person households, comprising 8, and the most common type of nonfamily households are 1-person households, comprising 5.
| Household Size | Family Households | Nonfamily Households |
| 1-Person Households | - | 5 (25.0%) |
| 2-Person Households | 8 (40.0%) | 0 (0.0%) |
| 3-Person Households | 3 (15.0%) | 0 (0.0%) |
| 4-Person Households | 0 (0.0%) | 0 (0.0%) |
| 5-Person Households | 1 (5.0%) | 0 (0.0%) |
| 6-Person Households | 0 (0.0%) | 0 (0.0%) |
| 7+ Person Households | 3 (15.0%) | 0 (0.0%) |
| Total | 15 (75.0%) | 5 (25.0%) |
Female Fertility in Atlantic
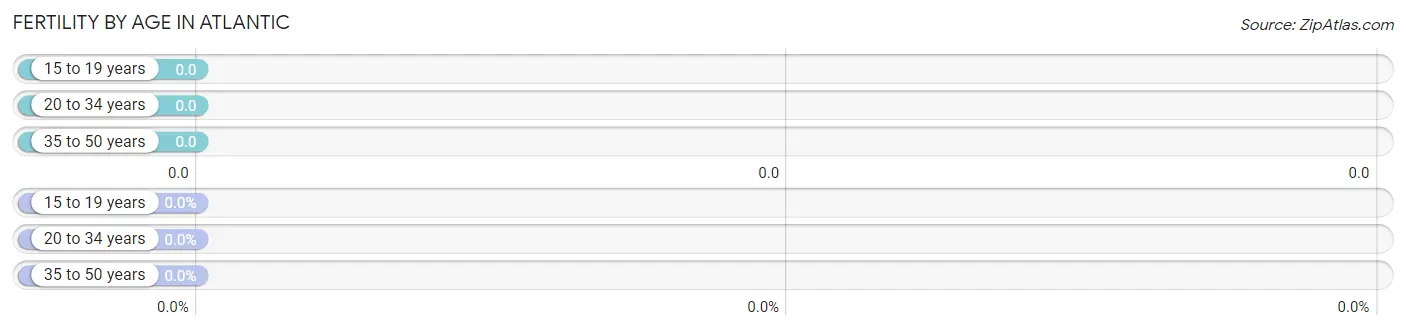
Fertility by Age in Atlantic
| Age Bracket | Women with Births | Births / 1,000 Women |
| 15 to 19 years | 0 (0.0%) | 0.0 |
| 20 to 34 years | 0 (0.0%) | 0.0 |
| 35 to 50 years | 0 (0.0%) | 0.0 |
| Total | 0 (0.0%) | 0.0 |
Fertility by Age by Marriage Status in Atlantic
| Age Bracket | Married | Unmarried |
| 15 to 19 years | 0 (0.0%) | 0 (0.0%) |
| 20 to 34 years | 0 (0.0%) | 0 (0.0%) |
| 35 to 50 years | 0 (0.0%) | 0 (0.0%) |
| Total | 0 (0.0%) | 0 (0.0%) |
Fertility by Education in Atlantic
| Educational Attainment | Women with Births | Births / 1,000 Women |
| Less than High School | 0 (0.0%) | 0.0 |
| High School Diploma | 0 (0.0%) | 0.0 |
| College or Associate's Degree | 0 (0.0%) | 0.0 |
| Bachelor's Degree | 0 (0.0%) | 0.0 |
| Graduate Degree | 0 (0.0%) | 0.0 |
| Total | 0 (0.0%) | 0.0 |
Fertility by Education by Marriage Status in Atlantic
| Educational Attainment | Married | Unmarried |
| Less than High School | 0 (0.0%) | 0 (0.0%) |
| High School Diploma | 0 (0.0%) | 0 (0.0%) |
| College or Associate's Degree | 0 (0.0%) | 0 (0.0%) |
| Bachelor's Degree | 0 (0.0%) | 0 (0.0%) |
| Graduate Degree | 0 (0.0%) | 0 (0.0%) |
| Total | 0 (0.0%) | 0 (0.0%) |
Employment Characteristics in Atlantic
Employment by Class of Employer in Atlantic
Among the 24 employed individuals in Atlantic, self-employed (not incorporated) (9 | 37.5%), private company employees (7 | 29.2%), and federal government employees (4 | 16.7%) make up the most common classes of employment.
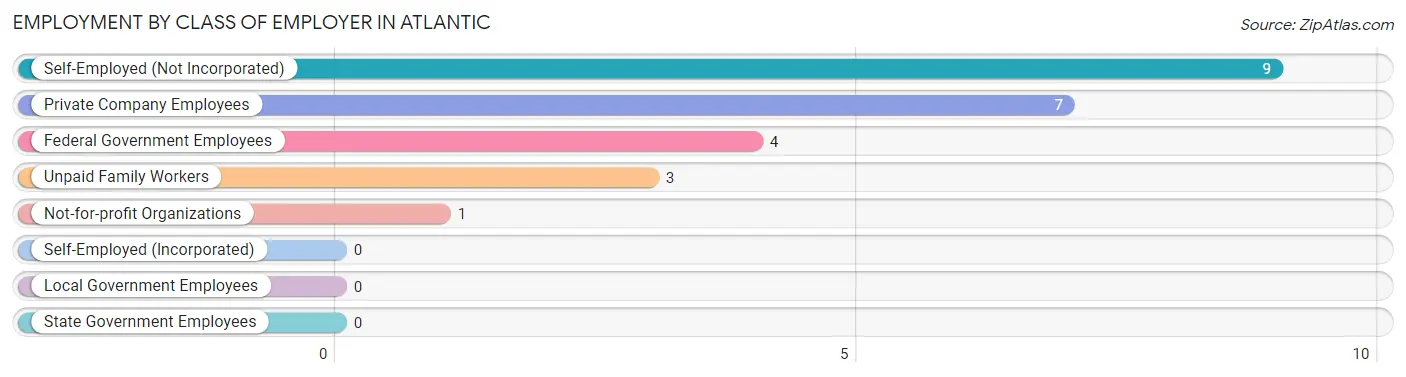
| Employer Class | # Employees | % Employees |
| Private Company Employees | 7 | 29.2% |
| Self-Employed (Incorporated) | 0 | 0.0% |
| Self-Employed (Not Incorporated) | 9 | 37.5% |
| Not-for-profit Organizations | 1 | 4.2% |
| Local Government Employees | 0 | 0.0% |
| State Government Employees | 0 | 0.0% |
| Federal Government Employees | 4 | 16.7% |
| Unpaid Family Workers | 3 | 12.5% |
| Total | 24 | 100.0% |
Employment Status by Age in Atlantic
According to the labor force statistics for Atlantic, out of the total population over 16 years of age (48), 60.4% or 29 individuals are in the labor force, with 17.2% or 5 of them unemployed. The age group with the highest labor force participation rate is 25 to 29 years, with 100.0% or 6 individuals in the labor force. Within the labor force, the 45 to 54 years age range has the highest percentage of unemployed individuals, with 50.0% or 5 of them being unemployed.
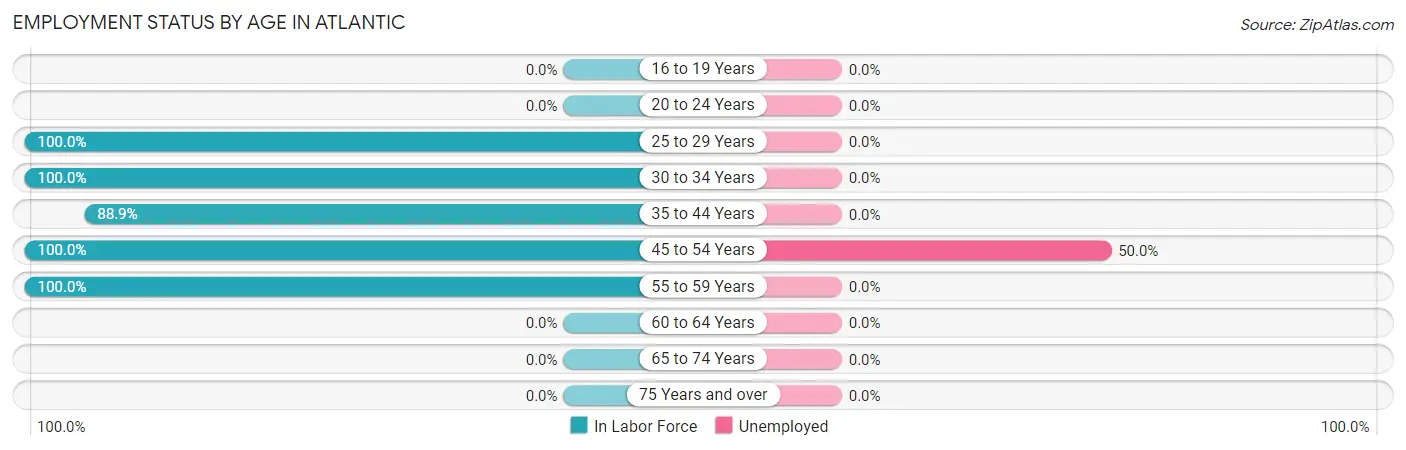
| Age Bracket | In Labor Force | Unemployed |
| 16 to 19 Years | 0 (0.0%) | 0 (0.0%) |
| 20 to 24 Years | 0 (0.0%) | 0 (0.0%) |
| 25 to 29 Years | 6 (100.0%) | 0 (0.0%) |
| 30 to 34 Years | 2 (100.0%) | 0 (0.0%) |
| 35 to 44 Years | 8 (88.9%) | 0 (0.0%) |
| 45 to 54 Years | 10 (100.0%) | 5 (50.0%) |
| 55 to 59 Years | 3 (100.0%) | 0 (0.0%) |
| 60 to 64 Years | 0 (0.0%) | 0 (0.0%) |
| 65 to 74 Years | 0 (0.0%) | 0 (0.0%) |
| 75 Years and over | 0 (0.0%) | 0 (0.0%) |
| Total | 29 (60.4%) | 5 (17.2%) |
Employment Status by Educational Attainment in Atlantic
According to labor force statistics for Atlantic, 96.7% of individuals (29) out of the total population between 25 and 64 years of age (30) are in the labor force, with 17.2% or 5 of them being unemployed. The group with the highest labor force participation rate are those with the educational attainment of high school diploma, with 100.0% or 15 individuals in the labor force. Within the labor force, individuals with high school diploma education have the highest percentage of unemployment, with 33.3% or 5 of them being unemployed.
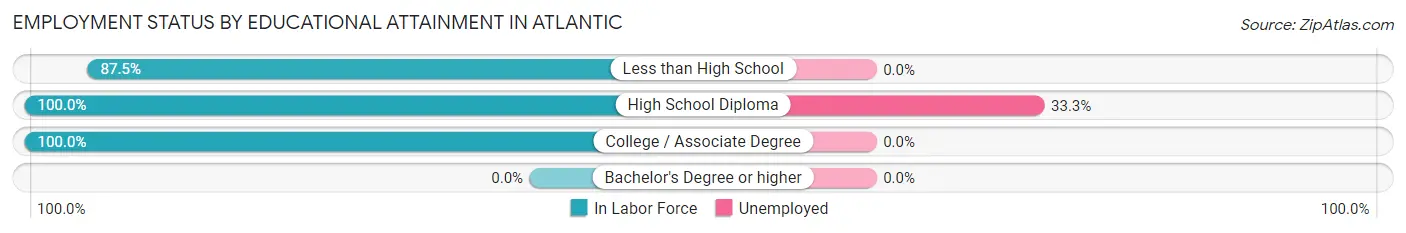
| Educational Attainment | In Labor Force | Unemployed |
| Less than High School | 7 (87.5%) | 0 (0.0%) |
| High School Diploma | 15 (100.0%) | 5 (33.3%) |
| College / Associate Degree | 7 (100.0%) | 0 (0.0%) |
| Bachelor's Degree or higher | 0 (0.0%) | 0 (0.0%) |
| Total | 29 (96.7%) | 5 (17.2%) |
Employment Occupations by Sex in Atlantic
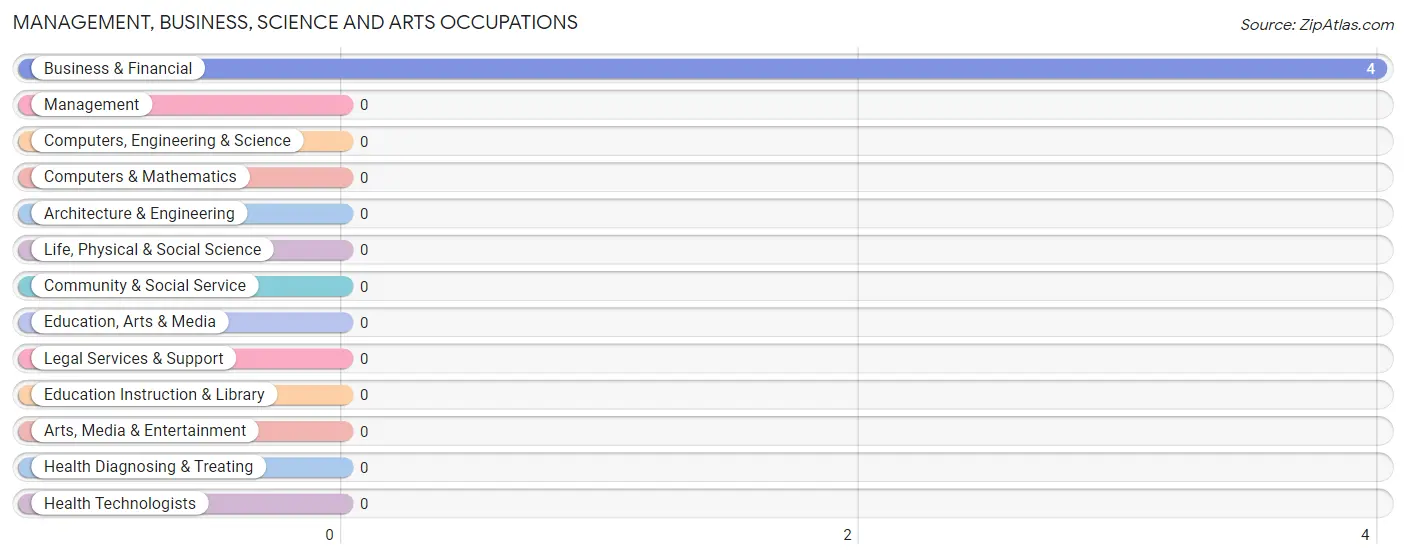
Management, Business, Science and Arts Occupations
The most common Management, Business, Science and Arts occupations in Atlantic are , and Business & Financial (4 | 16.7%).
Management, Business, Science and Arts Occupations by Sex
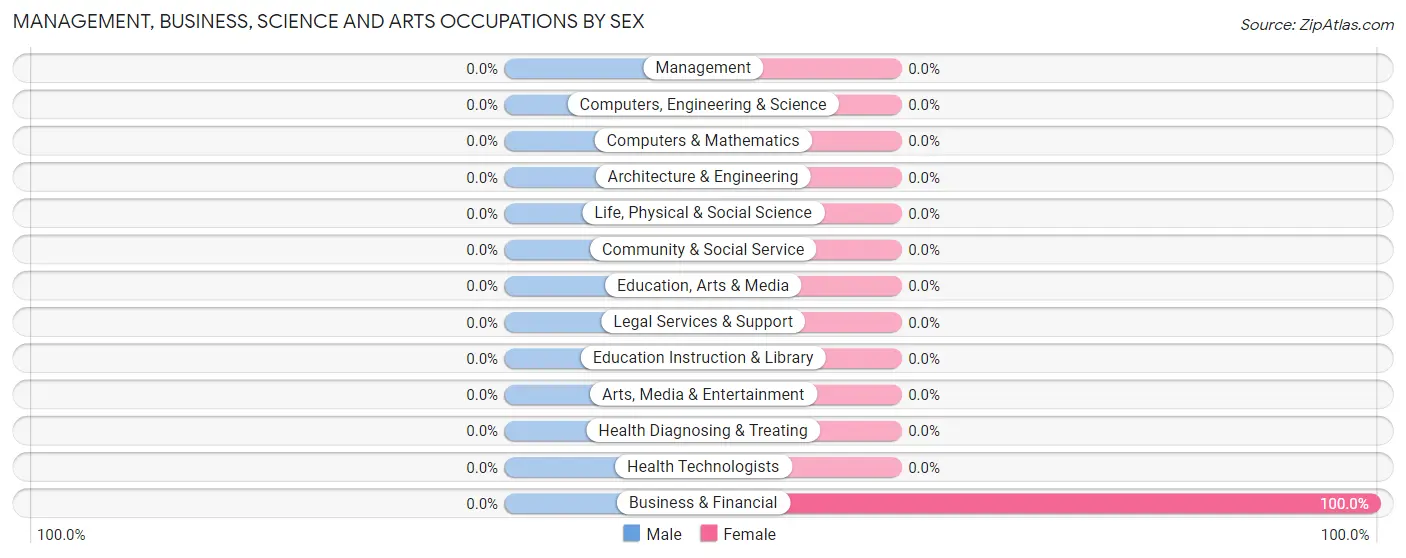
| Occupation | Male | Female |
| Management | 0 (0.0%) | 0 (0.0%) |
| Business & Financial | 0 (0.0%) | 4 (100.0%) |
| Computers, Engineering & Science | 0 (0.0%) | 0 (0.0%) |
| Computers & Mathematics | 0 (0.0%) | 0 (0.0%) |
| Architecture & Engineering | 0 (0.0%) | 0 (0.0%) |
| Life, Physical & Social Science | 0 (0.0%) | 0 (0.0%) |
| Community & Social Service | 0 (0.0%) | 0 (0.0%) |
| Education, Arts & Media | 0 (0.0%) | 0 (0.0%) |
| Legal Services & Support | 0 (0.0%) | 0 (0.0%) |
| Education Instruction & Library | 0 (0.0%) | 0 (0.0%) |
| Arts, Media & Entertainment | 0 (0.0%) | 0 (0.0%) |
| Health Diagnosing & Treating | 0 (0.0%) | 0 (0.0%) |
| Health Technologists | 0 (0.0%) | 0 (0.0%) |
| Total (Category) | 0 (0.0%) | 4 (100.0%) |
| Total (Overall) | 11 (45.8%) | 13 (54.2%) |
Services Occupations
Services Occupations by Sex
| Occupation | Male | Female |
| Healthcare Support | 0 (0.0%) | 0 (0.0%) |
| Security & Protection | 0 (0.0%) | 0 (0.0%) |
| Firefighting & Prevention | 0 (0.0%) | 0 (0.0%) |
| Law Enforcement | 0 (0.0%) | 0 (0.0%) |
| Food Preparation & Serving | 0 (0.0%) | 0 (0.0%) |
| Cleaning & Maintenance | 0 (0.0%) | 0 (0.0%) |
| Personal Care & Service | 0 (0.0%) | 0 (0.0%) |
| Total (Category) | 0 (0.0%) | 0 (0.0%) |
| Total (Overall) | 11 (45.8%) | 13 (54.2%) |
Sales and Office Occupations
The most common Sales and Office occupations in Atlantic are Sales & Related (6 | 25.0%), and Office & Administration (3 | 12.5%).

Sales and Office Occupations by Sex

| Occupation | Male | Female |
| Sales & Related | 3 (50.0%) | 3 (50.0%) |
| Office & Administration | 0 (0.0%) | 3 (100.0%) |
| Total (Category) | 3 (33.3%) | 6 (66.7%) |
| Total (Overall) | 11 (45.8%) | 13 (54.2%) |
Natural Resources, Construction and Maintenance Occupations
The most common Natural Resources, Construction and Maintenance occupations in Atlantic are , and Farming, Fishing & Forestry (9 | 37.5%).

Natural Resources, Construction and Maintenance Occupations by Sex
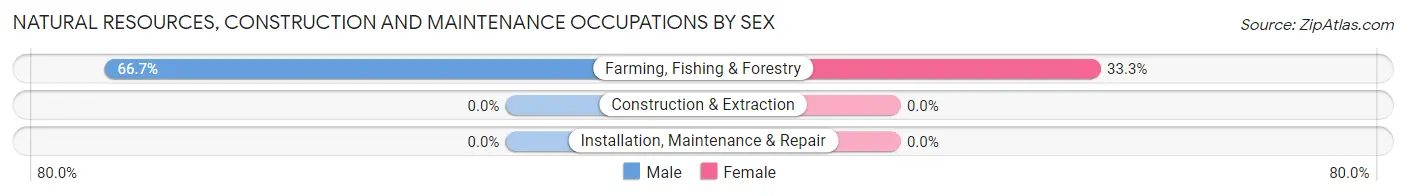
| Occupation | Male | Female |
| Farming, Fishing & Forestry | 6 (66.7%) | 3 (33.3%) |
| Construction & Extraction | 0 (0.0%) | 0 (0.0%) |
| Installation, Maintenance & Repair | 0 (0.0%) | 0 (0.0%) |
| Total (Category) | 6 (66.7%) | 3 (33.3%) |
| Total (Overall) | 11 (45.8%) | 13 (54.2%) |
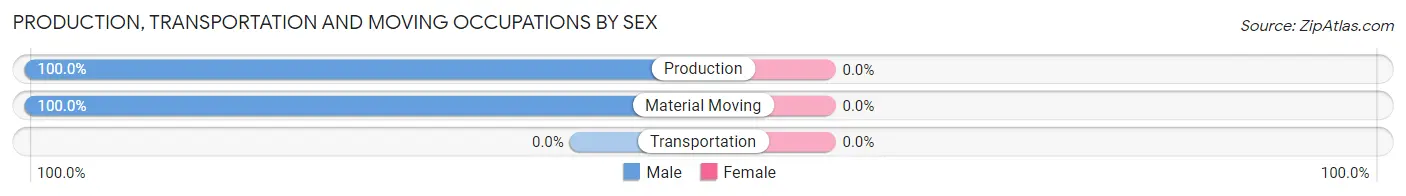
Production, Transportation and Moving Occupations
The most common Production, Transportation and Moving occupations in Atlantic are Production (1 | 4.2%), and Material Moving (1 | 4.2%).
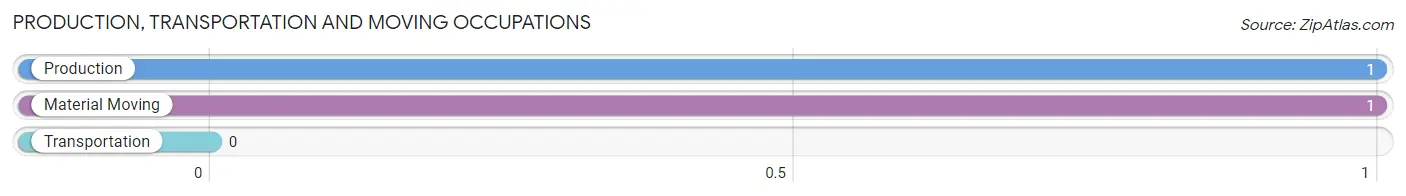
Production, Transportation and Moving Occupations by Sex
| Occupation | Male | Female |
| Production | 1 (100.0%) | 0 (0.0%) |
| Transportation | 0 (0.0%) | 0 (0.0%) |
| Material Moving | 1 (100.0%) | 0 (0.0%) |
| Total (Category) | 2 (100.0%) | 0 (0.0%) |
| Total (Overall) | 11 (45.8%) | 13 (54.2%) |
Employment Industries by Sex in Atlantic
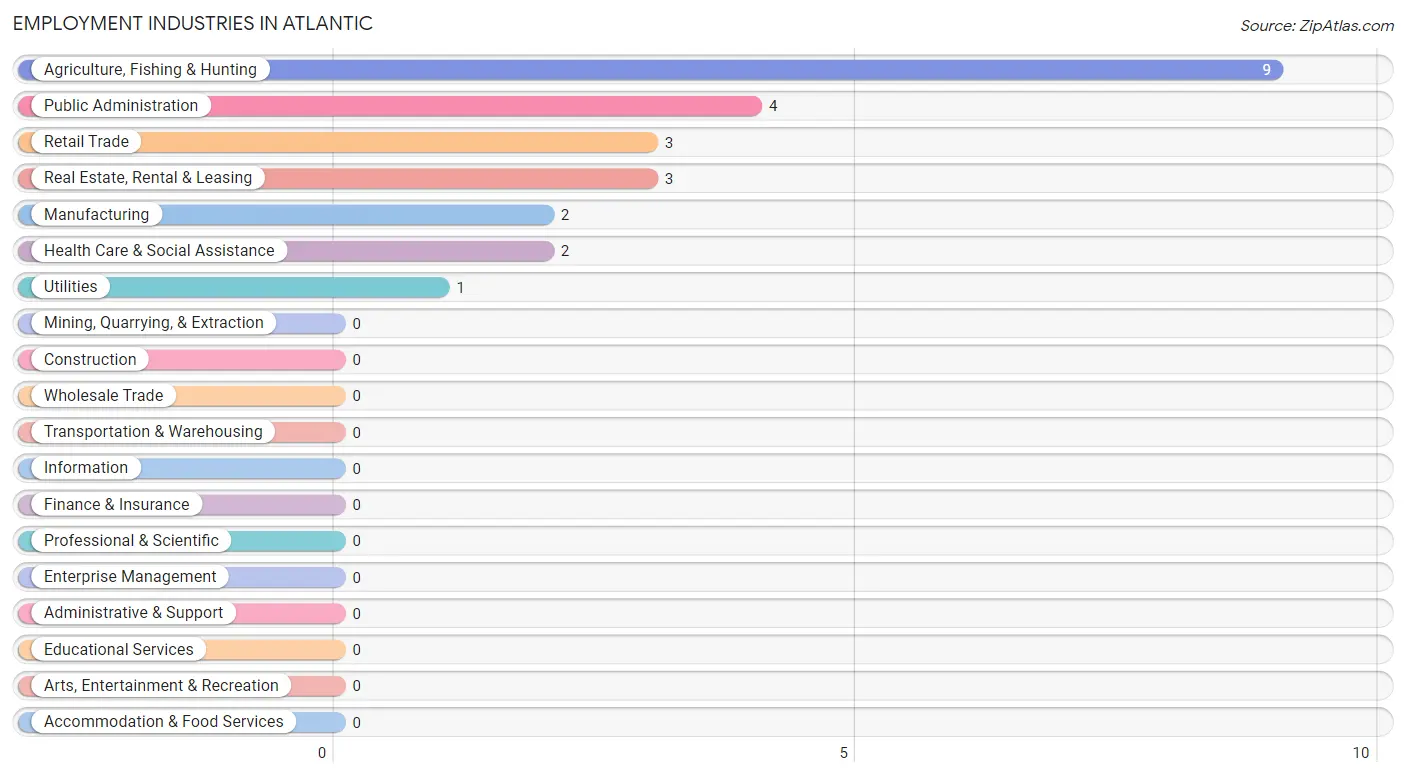
Employment Industries in Atlantic
The major employment industries in Atlantic include Agriculture, Fishing & Hunting (9 | 37.5%), Public Administration (4 | 16.7%), Retail Trade (3 | 12.5%), Real Estate, Rental & Leasing (3 | 12.5%), and Manufacturing (2 | 8.3%).
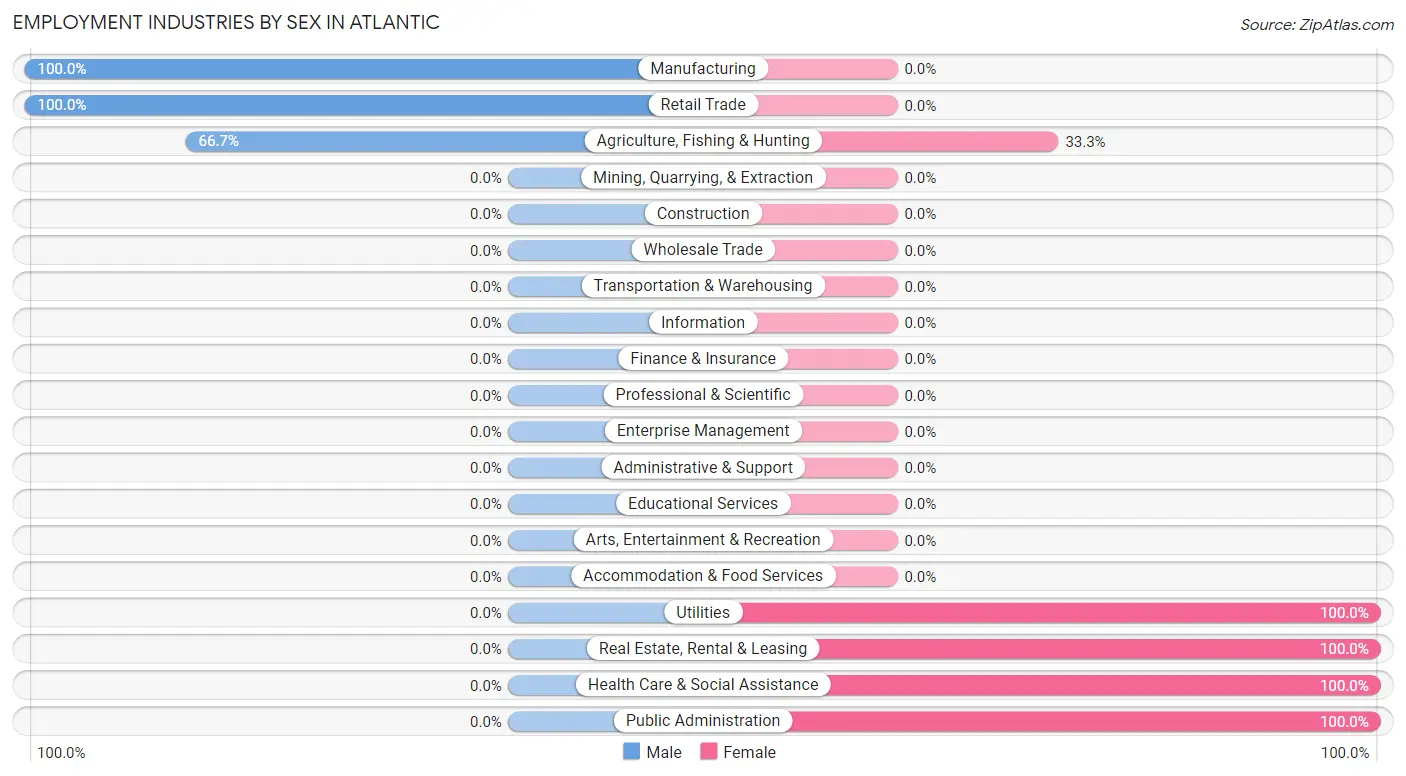
Employment Industries by Sex in Atlantic
The Atlantic industries that see more men than women are Manufacturing (100.0%), Retail Trade (100.0%), and Agriculture, Fishing & Hunting (66.7%), whereas the industries that tend to have a higher number of women are Utilities (100.0%), Real Estate, Rental & Leasing (100.0%), and Health Care & Social Assistance (100.0%).
| Industry | Male | Female |
| Agriculture, Fishing & Hunting | 6 (66.7%) | 3 (33.3%) |
| Mining, Quarrying, & Extraction | 0 (0.0%) | 0 (0.0%) |
| Construction | 0 (0.0%) | 0 (0.0%) |
| Manufacturing | 2 (100.0%) | 0 (0.0%) |
| Wholesale Trade | 0 (0.0%) | 0 (0.0%) |
| Retail Trade | 3 (100.0%) | 0 (0.0%) |
| Transportation & Warehousing | 0 (0.0%) | 0 (0.0%) |
| Utilities | 0 (0.0%) | 1 (100.0%) |
| Information | 0 (0.0%) | 0 (0.0%) |
| Finance & Insurance | 0 (0.0%) | 0 (0.0%) |
| Real Estate, Rental & Leasing | 0 (0.0%) | 3 (100.0%) |
| Professional & Scientific | 0 (0.0%) | 0 (0.0%) |
| Enterprise Management | 0 (0.0%) | 0 (0.0%) |
| Administrative & Support | 0 (0.0%) | 0 (0.0%) |
| Educational Services | 0 (0.0%) | 0 (0.0%) |
| Health Care & Social Assistance | 0 (0.0%) | 2 (100.0%) |
| Arts, Entertainment & Recreation | 0 (0.0%) | 0 (0.0%) |
| Accommodation & Food Services | 0 (0.0%) | 0 (0.0%) |
| Public Administration | 0 (0.0%) | 4 (100.0%) |
| Total | 11 (45.8%) | 13 (54.2%) |
Education in Atlantic
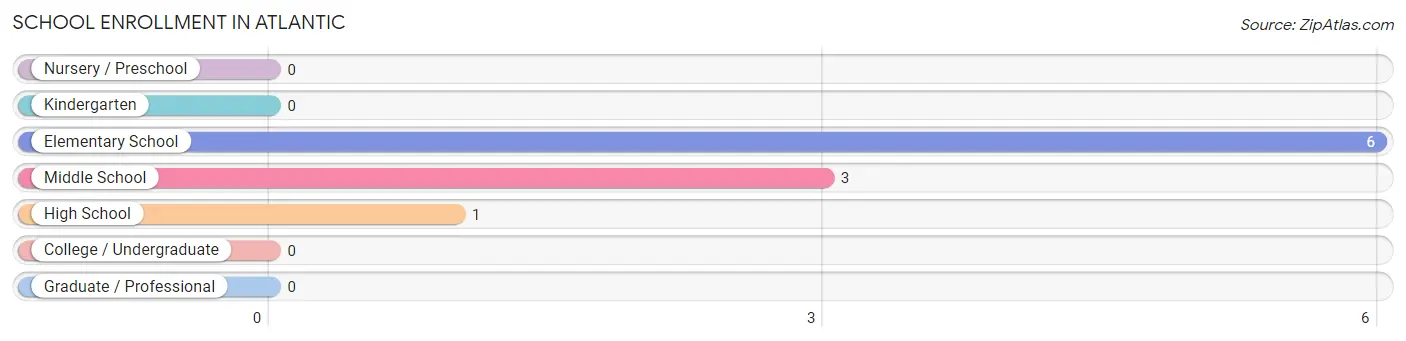
School Enrollment in Atlantic
The most common levels of schooling among the 10 students in Atlantic are elementary school (6 | 60.0%), middle school (3 | 30.0%), and high school (1 | 10.0%).
| School Level | # Students | % Students |
| Nursery / Preschool | 0 | 0.0% |
| Kindergarten | 0 | 0.0% |
| Elementary School | 6 | 60.0% |
| Middle School | 3 | 30.0% |
| High School | 1 | 10.0% |
| College / Undergraduate | 0 | 0.0% |
| Graduate / Professional | 0 | 0.0% |
| Total | 10 | 100.0% |
School Enrollment by Age by Funding Source in Atlantic
Out of a total of 10 students who are enrolled in schools in Atlantic, 9 (90.0%) attend a private institution, while the remaining 1 (10.0%) are enrolled in public schools. The age group of 5 to 9 year old has the highest likelihood of being enrolled in private schools, with 6 (100.0% in the age bracket) enrolled. Conversely, the age group of 18 to 19 year olds has the lowest likelihood of being enrolled in a private school, with 1 (100.0% in the age bracket) attending a public institution.
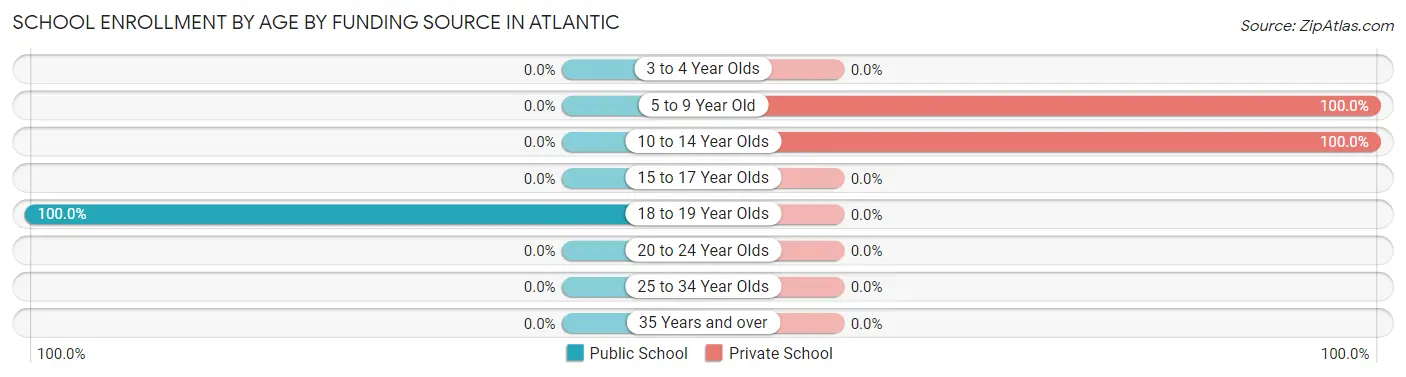
| Age Bracket | Public School | Private School |
| 3 to 4 Year Olds | 0 (0.0%) | 0 (0.0%) |
| 5 to 9 Year Old | 0 (0.0%) | 6 (100.0%) |
| 10 to 14 Year Olds | 0 (0.0%) | 3 (100.0%) |
| 15 to 17 Year Olds | 0 (0.0%) | 0 (0.0%) |
| 18 to 19 Year Olds | 1 (100.0%) | 0 (0.0%) |
| 20 to 24 Year Olds | 0 (0.0%) | 0 (0.0%) |
| 25 to 34 Year Olds | 0 (0.0%) | 0 (0.0%) |
| 35 Years and over | 0 (0.0%) | 0 (0.0%) |
| Total | 1 (10.0%) | 9 (90.0%) |
Educational Attainment by Field of Study in Atlantic
, and education (2 | 100.0%) are the most common fields of study among 2 individuals in Atlantic who have obtained a bachelor's degree or higher.
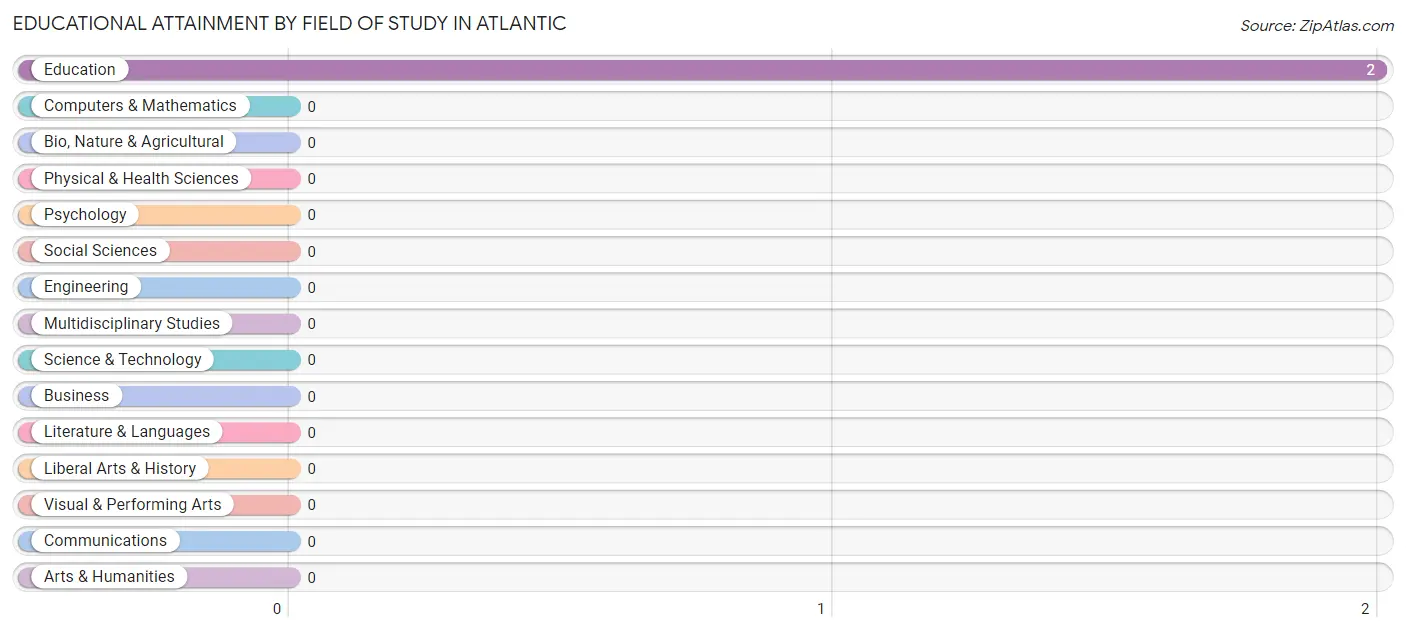
| Field of Study | # Graduates | % Graduates |
| Computers & Mathematics | 0 | 0.0% |
| Bio, Nature & Agricultural | 0 | 0.0% |
| Physical & Health Sciences | 0 | 0.0% |
| Psychology | 0 | 0.0% |
| Social Sciences | 0 | 0.0% |
| Engineering | 0 | 0.0% |
| Multidisciplinary Studies | 0 | 0.0% |
| Science & Technology | 0 | 0.0% |
| Business | 0 | 0.0% |
| Education | 2 | 100.0% |
| Literature & Languages | 0 | 0.0% |
| Liberal Arts & History | 0 | 0.0% |
| Visual & Performing Arts | 0 | 0.0% |
| Communications | 0 | 0.0% |
| Arts & Humanities | 0 | 0.0% |
| Total | 2 | 100.0% |
Transportation & Commute in Atlantic
Vehicle Availability by Sex in Atlantic
The most prevalent vehicle ownership categories in Atlantic are males with no vehicle (6, accounting for 54.5%) and females with no vehicle (10, making up 46.2%).
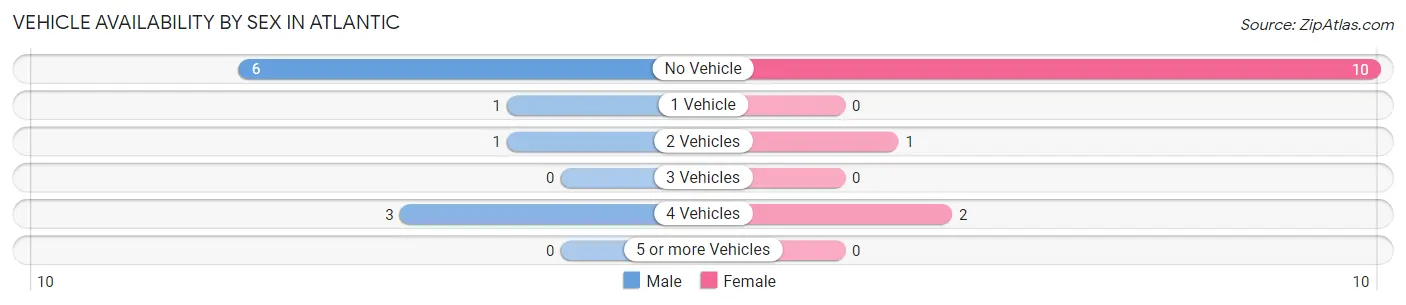
| Vehicles Available | Male | Female |
| No Vehicle | 6 (54.5%) | 10 (76.9%) |
| 1 Vehicle | 1 (9.1%) | 0 (0.0%) |
| 2 Vehicles | 1 (9.1%) | 1 (7.7%) |
| 3 Vehicles | 0 (0.0%) | 0 (0.0%) |
| 4 Vehicles | 3 (27.3%) | 2 (15.4%) |
| 5 or more Vehicles | 0 (0.0%) | 0 (0.0%) |
| Total | 11 (100.0%) | 13 (100.0%) |
Commute Time in Atlantic
The most frequently occuring commute durations in Atlantic are 30 to 34 minutes (6 commuters, 28.6%), 15 to 19 minutes (5 commuters, 23.8%), and 5 to 9 minutes (4 commuters, 19.1%).
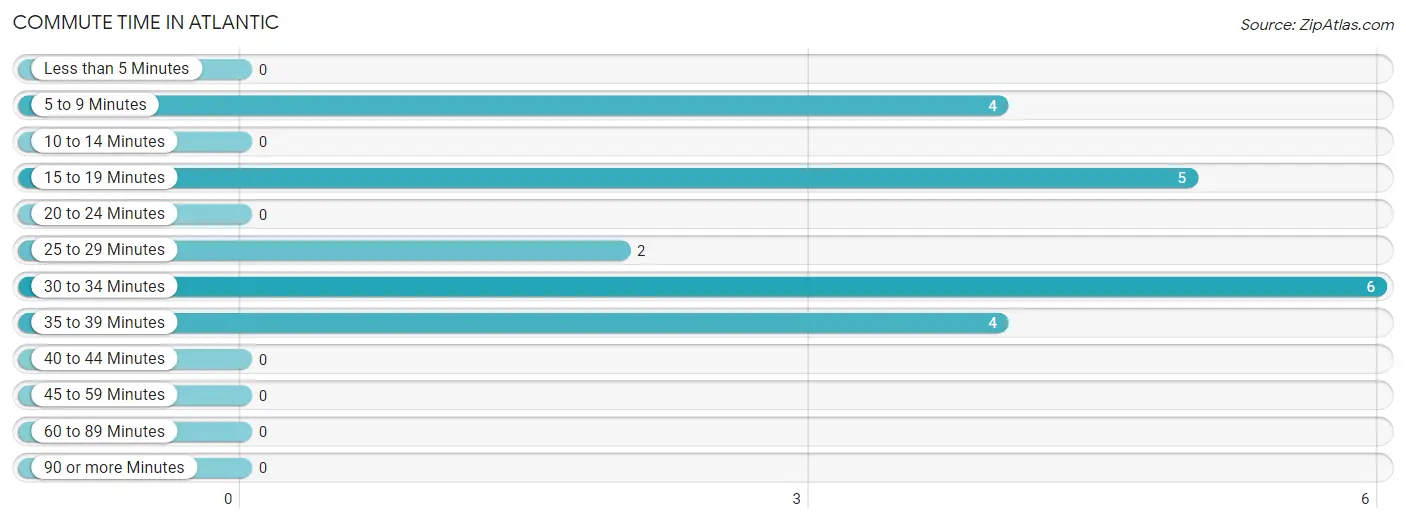
| Commute Time | # Commuters | % Commuters |
| Less than 5 Minutes | 0 | 0.0% |
| 5 to 9 Minutes | 4 | 19.1% |
| 10 to 14 Minutes | 0 | 0.0% |
| 15 to 19 Minutes | 5 | 23.8% |
| 20 to 24 Minutes | 0 | 0.0% |
| 25 to 29 Minutes | 2 | 9.5% |
| 30 to 34 Minutes | 6 | 28.6% |
| 35 to 39 Minutes | 4 | 19.1% |
| 40 to 44 Minutes | 0 | 0.0% |
| 45 to 59 Minutes | 0 | 0.0% |
| 60 to 89 Minutes | 0 | 0.0% |
| 90 or more Minutes | 0 | 0.0% |
Commute Time by Sex in Atlantic
The most common commute times in Atlantic are 30 to 34 minutes (6 commuters, 54.5%) for males and 5 to 9 minutes (4 commuters, 40.0%) for females.
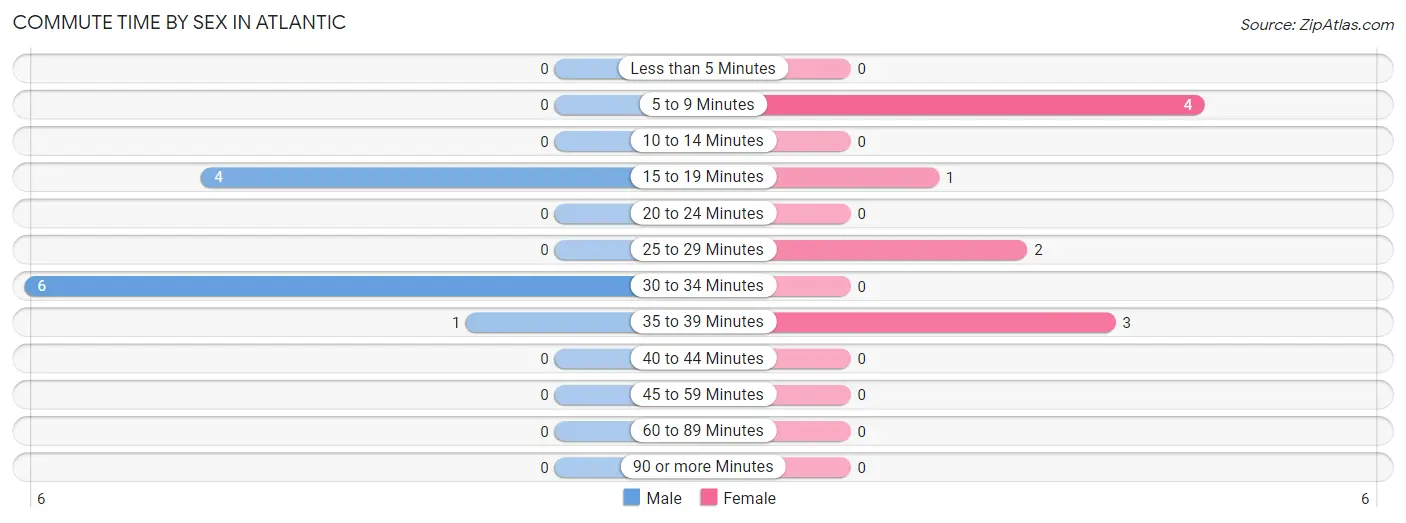
| Commute Time | Male | Female |
| Less than 5 Minutes | 0 (0.0%) | 0 (0.0%) |
| 5 to 9 Minutes | 0 (0.0%) | 4 (40.0%) |
| 10 to 14 Minutes | 0 (0.0%) | 0 (0.0%) |
| 15 to 19 Minutes | 4 (36.4%) | 1 (10.0%) |
| 20 to 24 Minutes | 0 (0.0%) | 0 (0.0%) |
| 25 to 29 Minutes | 0 (0.0%) | 2 (20.0%) |
| 30 to 34 Minutes | 6 (54.5%) | 0 (0.0%) |
| 35 to 39 Minutes | 1 (9.1%) | 3 (30.0%) |
| 40 to 44 Minutes | 0 (0.0%) | 0 (0.0%) |
| 45 to 59 Minutes | 0 (0.0%) | 0 (0.0%) |
| 60 to 89 Minutes | 0 (0.0%) | 0 (0.0%) |
| 90 or more Minutes | 0 (0.0%) | 0 (0.0%) |
Time of Departure to Work by Sex in Atlantic
The most frequent times of departure to work in Atlantic are 6:30 AM to 6:59 AM (4, 36.4%) for males and 6:30 AM to 6:59 AM (4, 40.0%) for females.
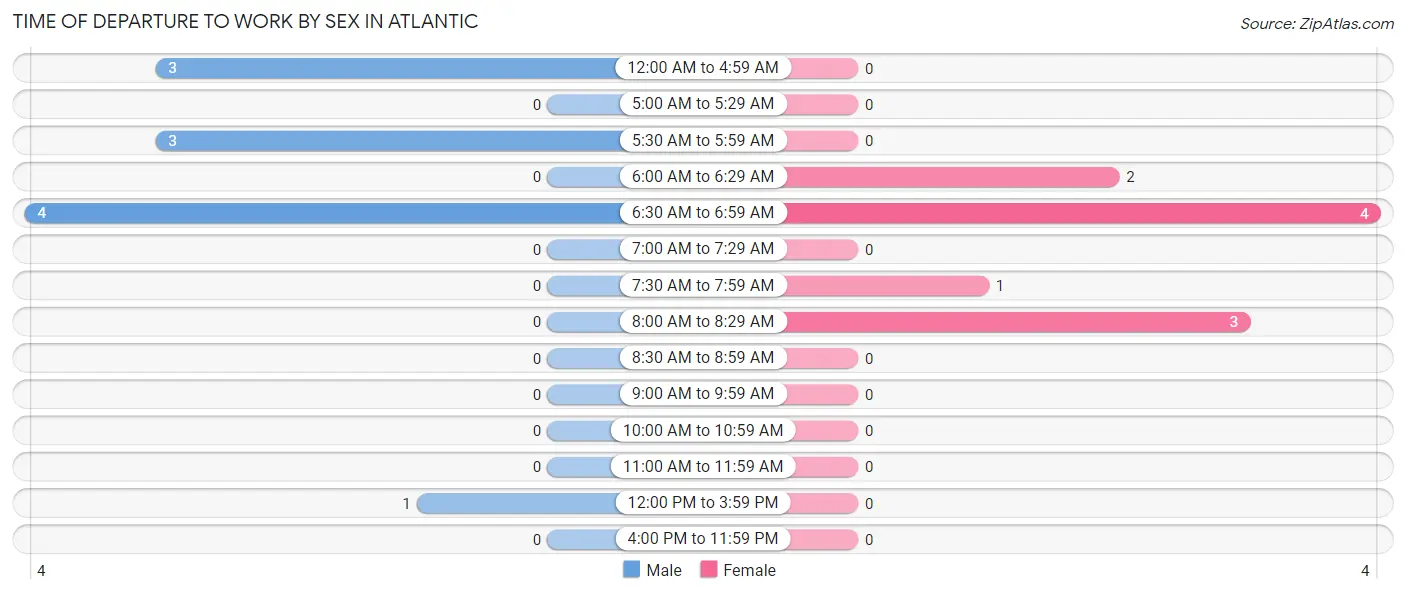
| Time of Departure | Male | Female |
| 12:00 AM to 4:59 AM | 3 (27.3%) | 0 (0.0%) |
| 5:00 AM to 5:29 AM | 0 (0.0%) | 0 (0.0%) |
| 5:30 AM to 5:59 AM | 3 (27.3%) | 0 (0.0%) |
| 6:00 AM to 6:29 AM | 0 (0.0%) | 2 (20.0%) |
| 6:30 AM to 6:59 AM | 4 (36.4%) | 4 (40.0%) |
| 7:00 AM to 7:29 AM | 0 (0.0%) | 0 (0.0%) |
| 7:30 AM to 7:59 AM | 0 (0.0%) | 1 (10.0%) |
| 8:00 AM to 8:29 AM | 0 (0.0%) | 3 (30.0%) |
| 8:30 AM to 8:59 AM | 0 (0.0%) | 0 (0.0%) |
| 9:00 AM to 9:59 AM | 0 (0.0%) | 0 (0.0%) |
| 10:00 AM to 10:59 AM | 0 (0.0%) | 0 (0.0%) |
| 11:00 AM to 11:59 AM | 0 (0.0%) | 0 (0.0%) |
| 12:00 PM to 3:59 PM | 1 (9.1%) | 0 (0.0%) |
| 4:00 PM to 11:59 PM | 0 (0.0%) | 0 (0.0%) |
| Total | 11 (100.0%) | 10 (100.0%) |
Housing Occupancy in Atlantic
Occupancy by Ownership in Atlantic
Of the total 20 dwellings in Atlantic, owner-occupied units account for 18 (90.0%), while renter-occupied units make up 2 (10.0%).
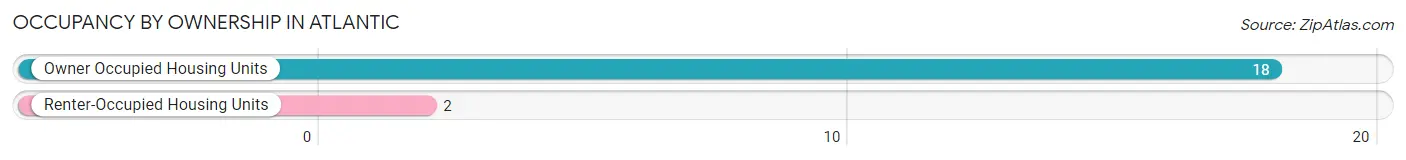
| Occupancy | # Housing Units | % Housing Units |
| Owner Occupied Housing Units | 18 | 90.0% |
| Renter-Occupied Housing Units | 2 | 10.0% |
| Total Occupied Housing Units | 20 | 100.0% |
Occupancy by Household Size in Atlantic
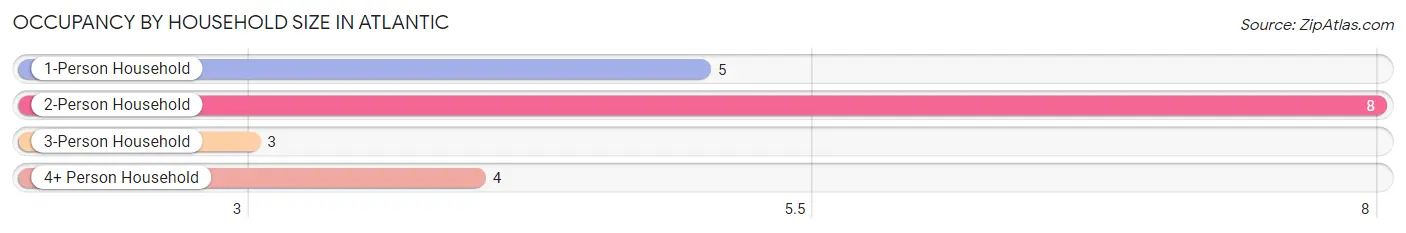
| Household Size | # Housing Units | % Housing Units |
| 1-Person Household | 5 | 25.0% |
| 2-Person Household | 8 | 40.0% |
| 3-Person Household | 3 | 15.0% |
| 4+ Person Household | 4 | 20.0% |
| Total Housing Units | 20 | 100.0% |
Occupancy by Ownership by Household Size in Atlantic
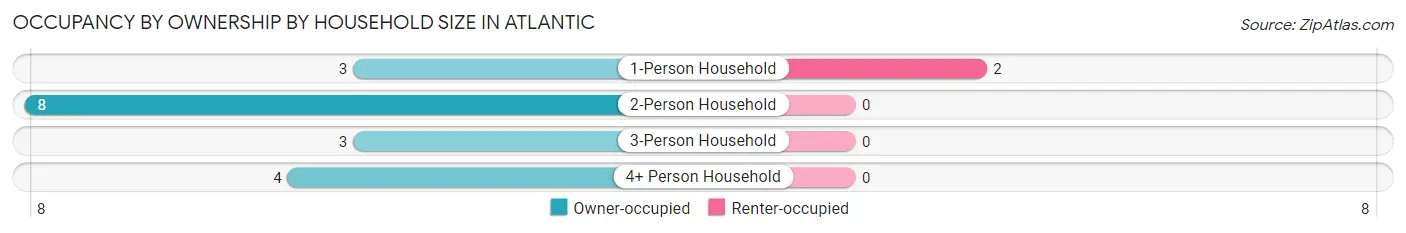
| Household Size | Owner-occupied | Renter-occupied |
| 1-Person Household | 3 (60.0%) | 2 (40.0%) |
| 2-Person Household | 8 (100.0%) | 0 (0.0%) |
| 3-Person Household | 3 (100.0%) | 0 (0.0%) |
| 4+ Person Household | 4 (100.0%) | 0 (0.0%) |
| Total Housing Units | 18 (90.0%) | 2 (10.0%) |
Occupancy by Educational Attainment in Atlantic
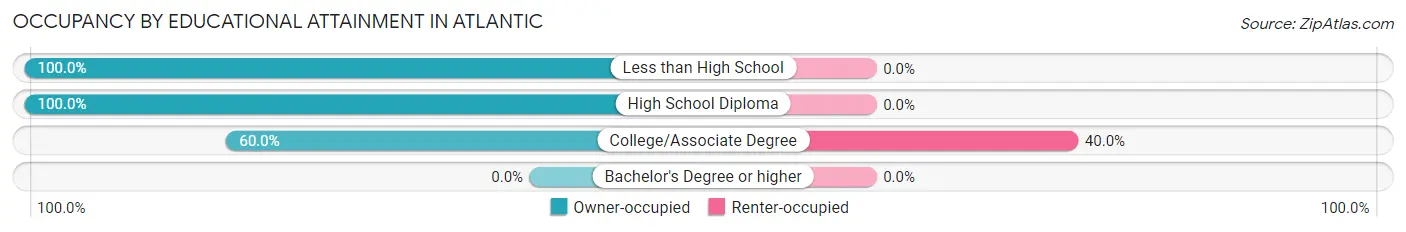
| Household Size | Owner-occupied | Renter-occupied |
| Less than High School | 4 (100.0%) | 0 (0.0%) |
| High School Diploma | 11 (100.0%) | 0 (0.0%) |
| College/Associate Degree | 3 (60.0%) | 2 (40.0%) |
| Bachelor's Degree or higher | 0 (0.0%) | 0 (0.0%) |
Occupancy by Age of Householder in Atlantic
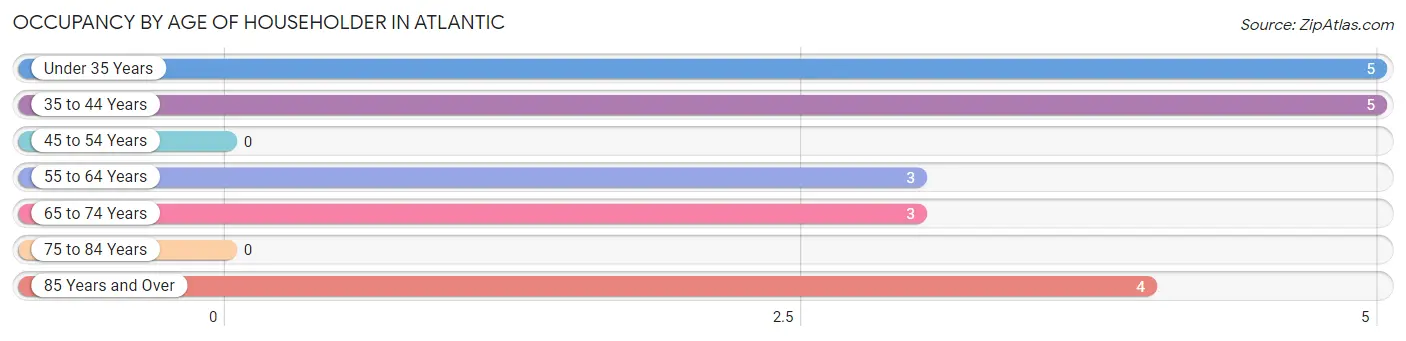
| Age Bracket | # Households | % Households |
| Under 35 Years | 5 | 25.0% |
| 35 to 44 Years | 5 | 25.0% |
| 45 to 54 Years | 0 | 0.0% |
| 55 to 64 Years | 3 | 15.0% |
| 65 to 74 Years | 3 | 15.0% |
| 75 to 84 Years | 0 | 0.0% |
| 85 Years and Over | 4 | 20.0% |
| Total | 20 | 100.0% |
Housing Finances in Atlantic
Median Income by Occupancy in Atlantic
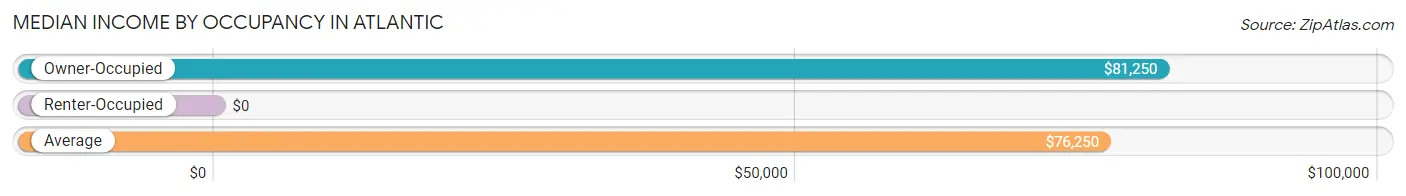
| Occupancy Type | # Households | Median Income |
| Owner-Occupied | 18 (90.0%) | $81,250 |
| Renter-Occupied | 2 (10.0%) | $0 |
| Average | 20 (100.0%) | $76,250 |
Occupancy by Householder Income Bracket in Atlantic
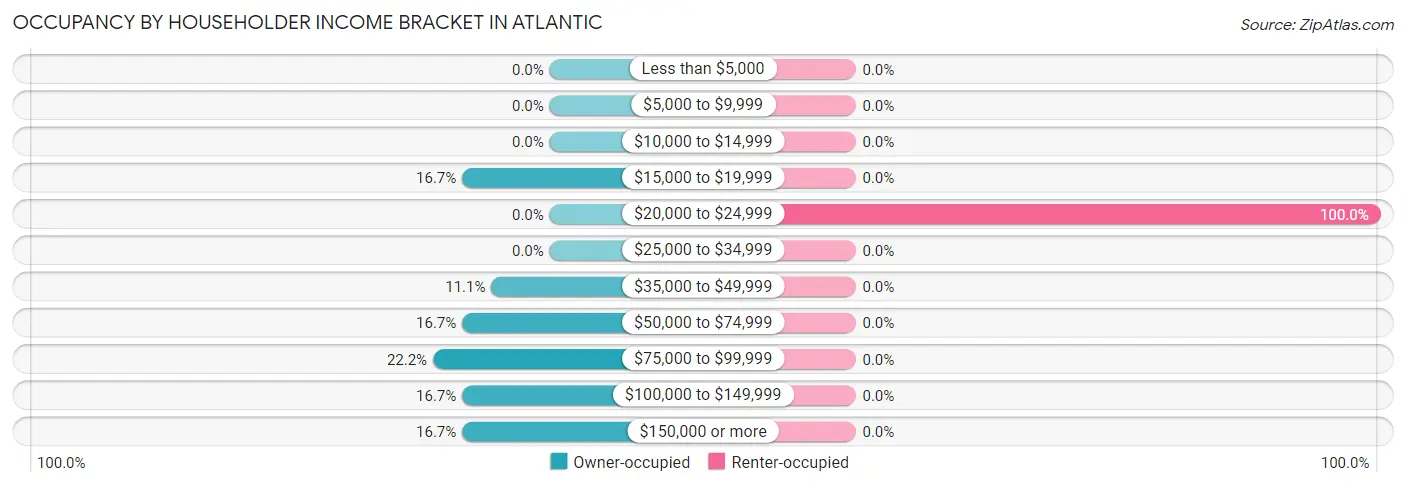
| Income Bracket | Owner-occupied | Renter-occupied |
| Less than $5,000 | 0 (0.0%) | 0 (0.0%) |
| $5,000 to $9,999 | 0 (0.0%) | 0 (0.0%) |
| $10,000 to $14,999 | 0 (0.0%) | 0 (0.0%) |
| $15,000 to $19,999 | 3 (16.7%) | 0 (0.0%) |
| $20,000 to $24,999 | 0 (0.0%) | 2 (100.0%) |
| $25,000 to $34,999 | 0 (0.0%) | 0 (0.0%) |
| $35,000 to $49,999 | 2 (11.1%) | 0 (0.0%) |
| $50,000 to $74,999 | 3 (16.7%) | 0 (0.0%) |
| $75,000 to $99,999 | 4 (22.2%) | 0 (0.0%) |
| $100,000 to $149,999 | 3 (16.7%) | 0 (0.0%) |
| $150,000 or more | 3 (16.7%) | 0 (0.0%) |
| Total | 18 (100.0%) | 2 (100.0%) |
Monthly Housing Cost Tiers in Atlantic
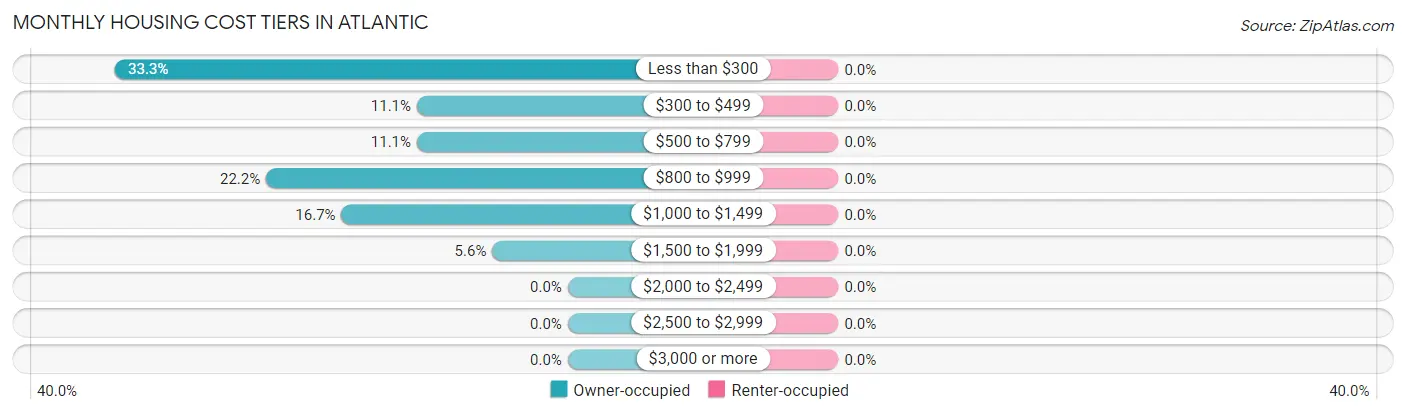
| Monthly Cost | Owner-occupied | Renter-occupied |
| Less than $300 | 6 (33.3%) | 0 (0.0%) |
| $300 to $499 | 2 (11.1%) | 0 (0.0%) |
| $500 to $799 | 2 (11.1%) | 0 (0.0%) |
| $800 to $999 | 4 (22.2%) | 0 (0.0%) |
| $1,000 to $1,499 | 3 (16.7%) | 0 (0.0%) |
| $1,500 to $1,999 | 1 (5.6%) | 0 (0.0%) |
| $2,000 to $2,499 | 0 (0.0%) | 0 (0.0%) |
| $2,500 to $2,999 | 0 (0.0%) | 0 (0.0%) |
| $3,000 or more | 0 (0.0%) | 0 (0.0%) |
| Total | 18 (100.0%) | 2 (100.0%) |
Physical Housing Characteristics in Atlantic
Housing Structures in Atlantic
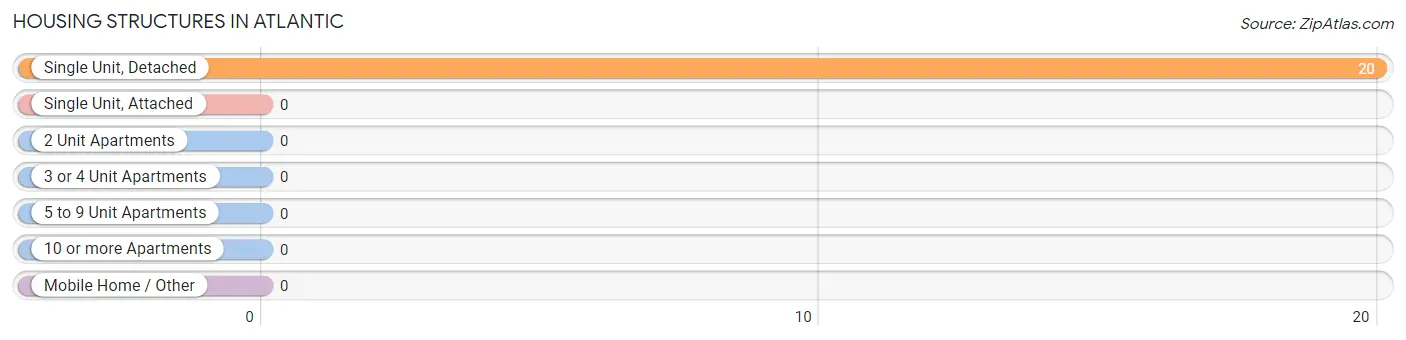
| Structure Type | # Housing Units | % Housing Units |
| Single Unit, Detached | 20 | 100.0% |
| Single Unit, Attached | 0 | 0.0% |
| 2 Unit Apartments | 0 | 0.0% |
| 3 or 4 Unit Apartments | 0 | 0.0% |
| 5 to 9 Unit Apartments | 0 | 0.0% |
| 10 or more Apartments | 0 | 0.0% |
| Mobile Home / Other | 0 | 0.0% |
| Total | 20 | 100.0% |
Housing Structures by Occupancy in Atlantic
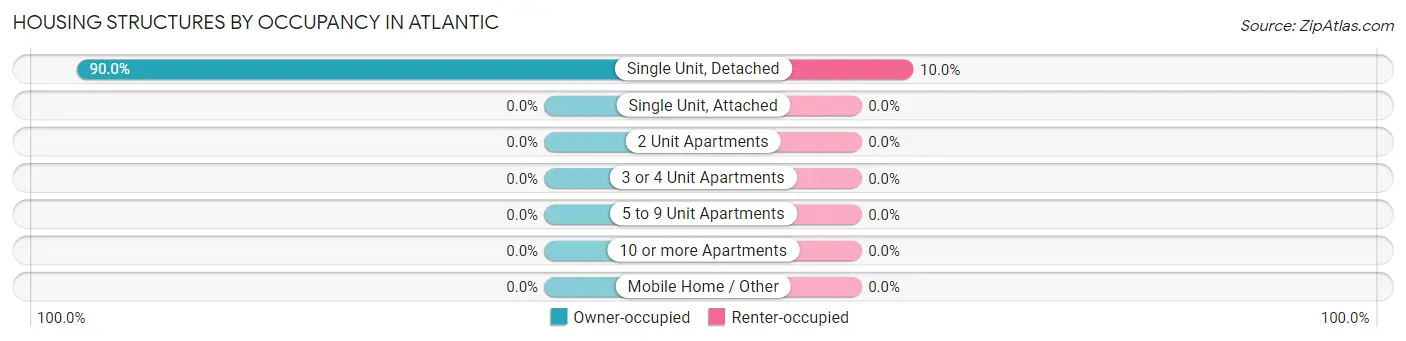
| Structure Type | Owner-occupied | Renter-occupied |
| Single Unit, Detached | 18 (90.0%) | 2 (10.0%) |
| Single Unit, Attached | 0 (0.0%) | 0 (0.0%) |
| 2 Unit Apartments | 0 (0.0%) | 0 (0.0%) |
| 3 or 4 Unit Apartments | 0 (0.0%) | 0 (0.0%) |
| 5 to 9 Unit Apartments | 0 (0.0%) | 0 (0.0%) |
| 10 or more Apartments | 0 (0.0%) | 0 (0.0%) |
| Mobile Home / Other | 0 (0.0%) | 0 (0.0%) |
| Total | 18 (90.0%) | 2 (10.0%) |
Housing Structures by Number of Rooms in Atlantic
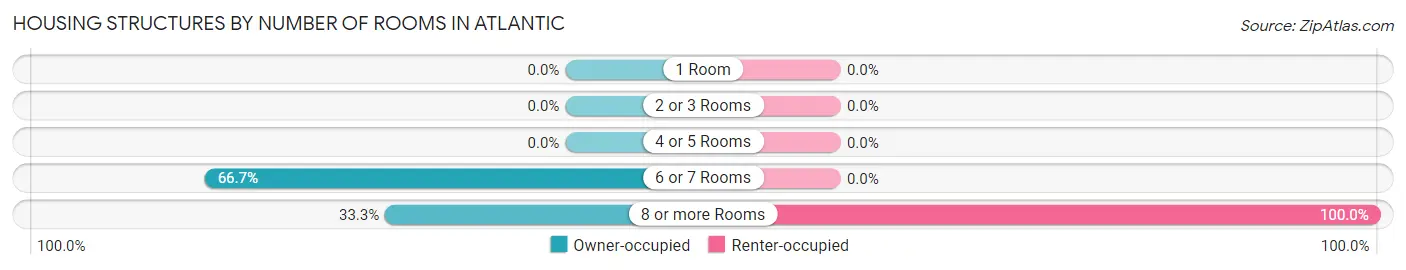
| Number of Rooms | Owner-occupied | Renter-occupied |
| 1 Room | 0 (0.0%) | 0 (0.0%) |
| 2 or 3 Rooms | 0 (0.0%) | 0 (0.0%) |
| 4 or 5 Rooms | 0 (0.0%) | 0 (0.0%) |
| 6 or 7 Rooms | 12 (66.7%) | 0 (0.0%) |
| 8 or more Rooms | 6 (33.3%) | 2 (100.0%) |
| Total | 18 (100.0%) | 2 (100.0%) |
Housing Structure by Heating Type in Atlantic
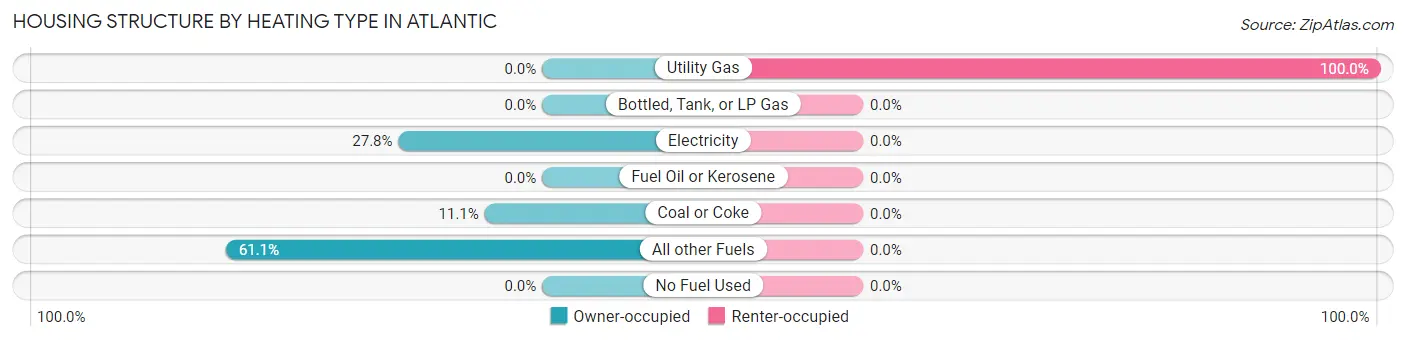
| Heating Type | Owner-occupied | Renter-occupied |
| Utility Gas | 0 (0.0%) | 2 (100.0%) |
| Bottled, Tank, or LP Gas | 0 (0.0%) | 0 (0.0%) |
| Electricity | 5 (27.8%) | 0 (0.0%) |
| Fuel Oil or Kerosene | 0 (0.0%) | 0 (0.0%) |
| Coal or Coke | 2 (11.1%) | 0 (0.0%) |
| All other Fuels | 11 (61.1%) | 0 (0.0%) |
| No Fuel Used | 0 (0.0%) | 0 (0.0%) |
| Total | 18 (100.0%) | 2 (100.0%) |
Household Vehicle Usage in Atlantic
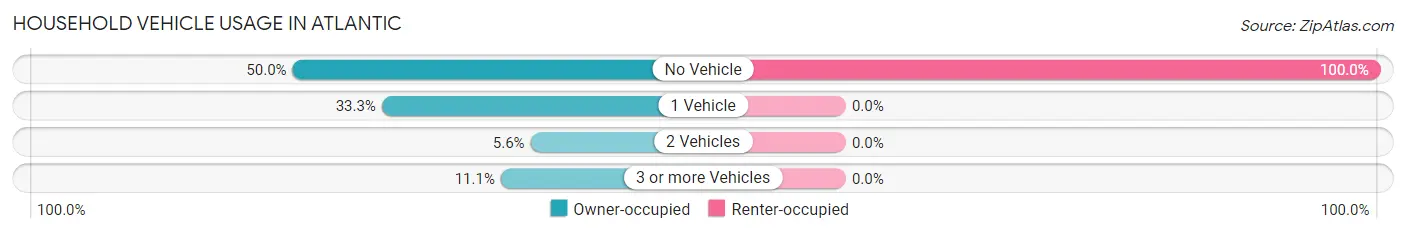
| Vehicles per Household | Owner-occupied | Renter-occupied |
| No Vehicle | 9 (50.0%) | 2 (100.0%) |
| 1 Vehicle | 6 (33.3%) | 0 (0.0%) |
| 2 Vehicles | 1 (5.6%) | 0 (0.0%) |
| 3 or more Vehicles | 2 (11.1%) | 0 (0.0%) |
| Total | 18 (100.0%) | 2 (100.0%) |
Real Estate & Mortgages in Atlantic
Real Estate and Mortgage Overview in Atlantic
| Characteristic | Without Mortgage | With Mortgage |
| Housing Units | 10 | 8 |
| Median Property Value | $150,000 | $97,500 |
| Median Household Income | $113,333 | $0 |
| Monthly Housing Costs | $292 | $0 |
| Real Estate Taxes | $2,625 | $0 |
Property Value by Mortgage Status in Atlantic
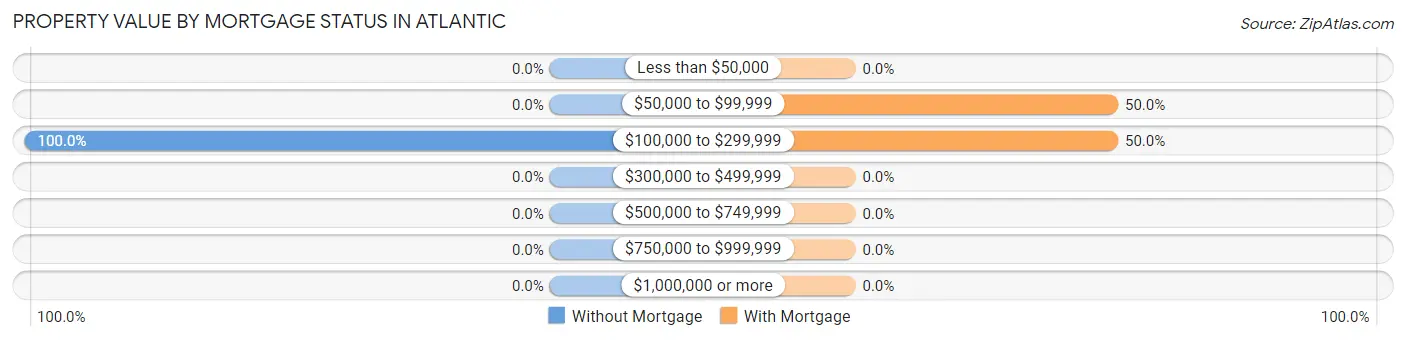
| Property Value | Without Mortgage | With Mortgage |
| Less than $50,000 | 0 (0.0%) | 0 (0.0%) |
| $50,000 to $99,999 | 0 (0.0%) | 4 (50.0%) |
| $100,000 to $299,999 | 10 (100.0%) | 4 (50.0%) |
| $300,000 to $499,999 | 0 (0.0%) | 0 (0.0%) |
| $500,000 to $749,999 | 0 (0.0%) | 0 (0.0%) |
| $750,000 to $999,999 | 0 (0.0%) | 0 (0.0%) |
| $1,000,000 or more | 0 (0.0%) | 0 (0.0%) |
| Total | 10 (100.0%) | 8 (100.0%) |
Household Income by Mortgage Status in Atlantic
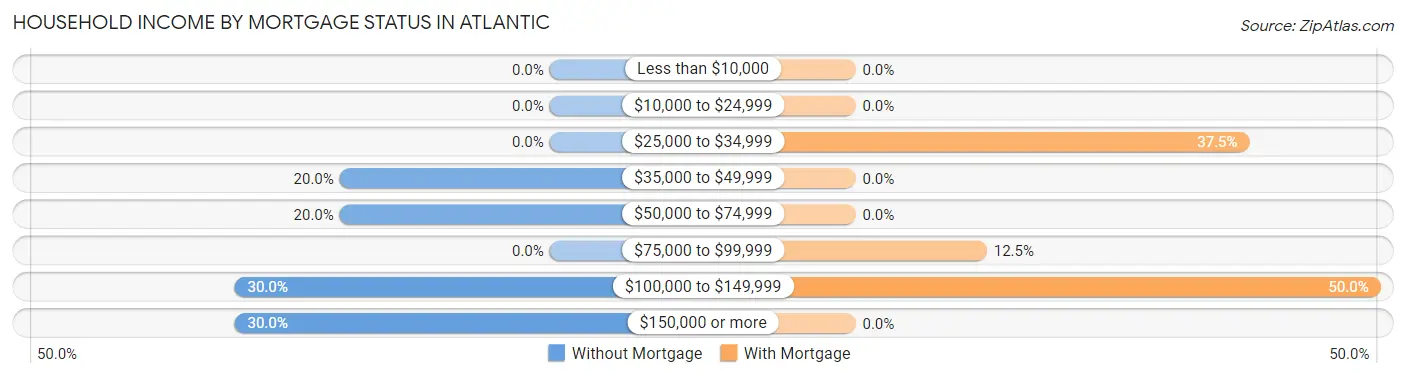
| Household Income | Without Mortgage | With Mortgage |
| Less than $10,000 | 0 (0.0%) | 0 (0.0%) |
| $10,000 to $24,999 | 0 (0.0%) | 0 (0.0%) |
| $25,000 to $34,999 | 0 (0.0%) | 3 (37.5%) |
| $35,000 to $49,999 | 2 (20.0%) | 0 (0.0%) |
| $50,000 to $74,999 | 2 (20.0%) | 0 (0.0%) |
| $75,000 to $99,999 | 0 (0.0%) | 1 (12.5%) |
| $100,000 to $149,999 | 3 (30.0%) | 4 (50.0%) |
| $150,000 or more | 3 (30.0%) | 0 (0.0%) |
| Total | 10 (100.0%) | 8 (100.0%) |
Property Value to Household Income Ratio in Atlantic
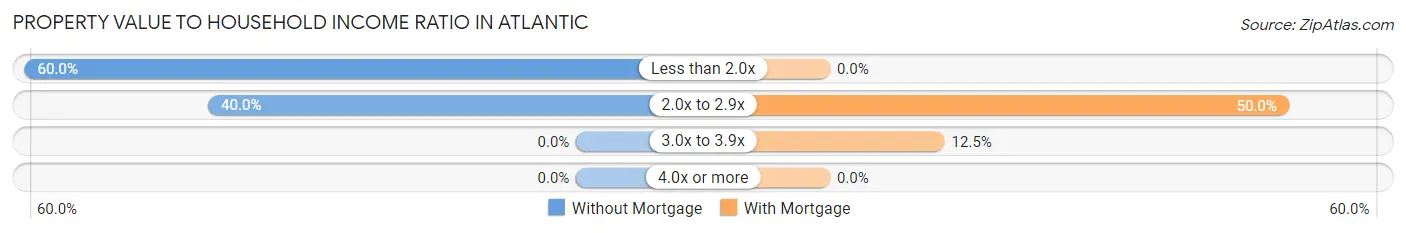
| Value-to-Income Ratio | Without Mortgage | With Mortgage |
| Less than 2.0x | 6 (60.0%) | 0 (0.0%) |
| 2.0x to 2.9x | 4 (40.0%) | 4 (50.0%) |
| 3.0x to 3.9x | 0 (0.0%) | 1 (12.5%) |
| 4.0x or more | 0 (0.0%) | 0 (0.0%) |
| Total | 10 (100.0%) | 8 (100.0%) |
Real Estate Taxes by Mortgage Status in Atlantic
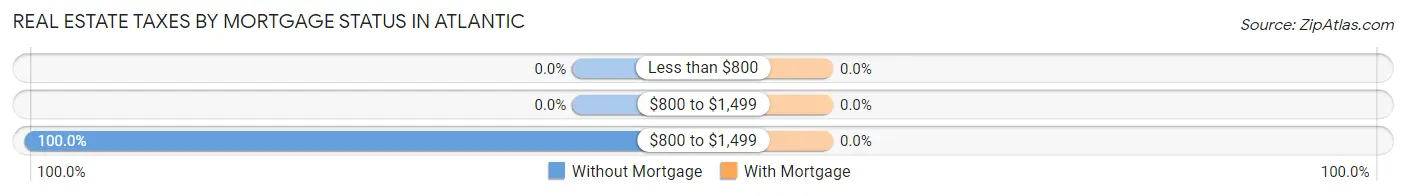
| Property Taxes | Without Mortgage | With Mortgage |
| Less than $800 | 0 (0.0%) | 0 (0.0%) |
| $800 to $1,499 | 0 (0.0%) | 0 (0.0%) |
| $800 to $1,499 | 10 (100.0%) | 0 (0.0%) |
| Total | 10 (100.0%) | 8 (100.0%) |
Health & Disability in Atlantic
Health Insurance Coverage by Age in Atlantic
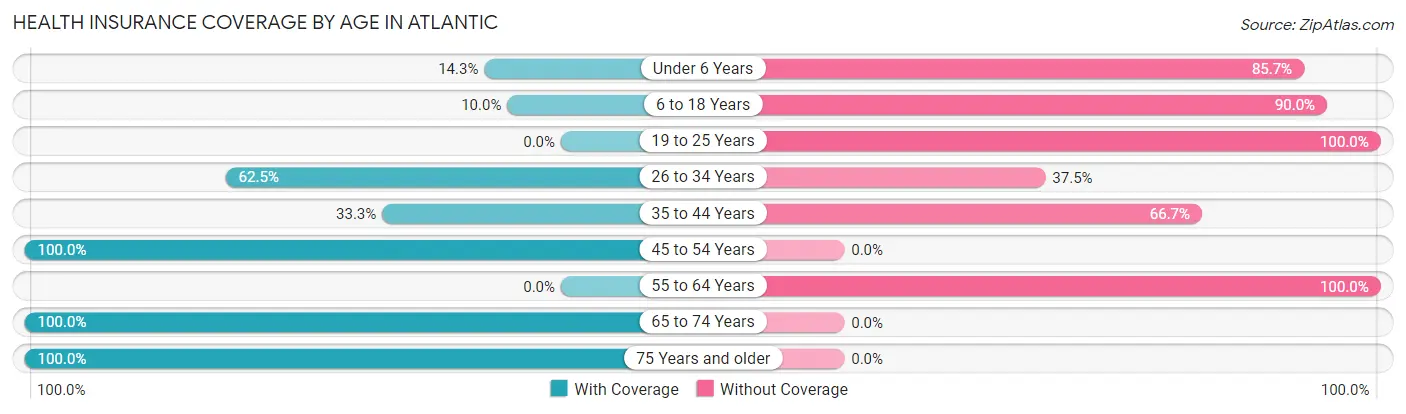
| Age Bracket | With Coverage | Without Coverage |
| Under 6 Years | 1 (14.3%) | 6 (85.7%) |
| 6 to 18 Years | 1 (10.0%) | 9 (90.0%) |
| 19 to 25 Years | 0 (0.0%) | 4 (100.0%) |
| 26 to 34 Years | 5 (62.5%) | 3 (37.5%) |
| 35 to 44 Years | 3 (33.3%) | 6 (66.7%) |
| 45 to 54 Years | 10 (100.0%) | 0 (0.0%) |
| 55 to 64 Years | 0 (0.0%) | 3 (100.0%) |
| 65 to 74 Years | 7 (100.0%) | 0 (0.0%) |
| 75 Years and older | 6 (100.0%) | 0 (0.0%) |
| Total | 33 (51.6%) | 31 (48.4%) |
Health Insurance Coverage by Citizenship Status in Atlantic
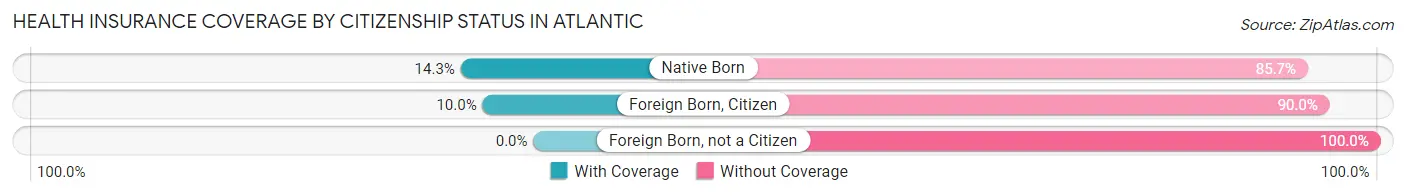
| Citizenship Status | With Coverage | Without Coverage |
| Native Born | 1 (14.3%) | 6 (85.7%) |
| Foreign Born, Citizen | 1 (10.0%) | 9 (90.0%) |
| Foreign Born, not a Citizen | 0 (0.0%) | 4 (100.0%) |
Health Insurance Coverage by Household Income in Atlantic
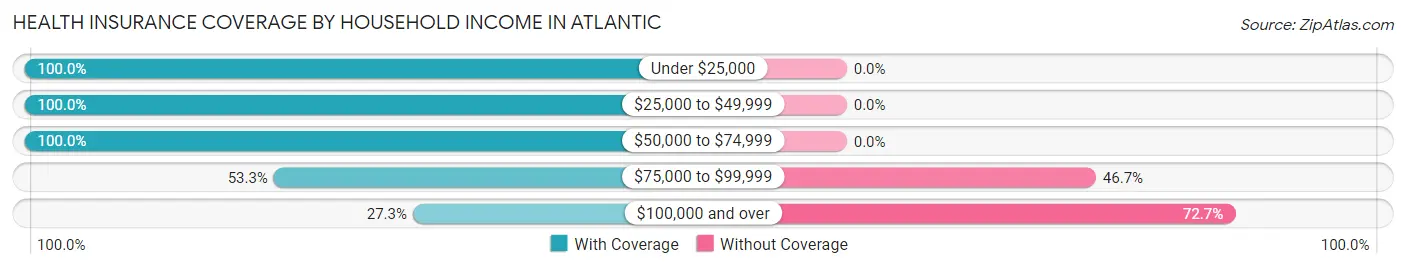
| Household Income | With Coverage | Without Coverage |
| Under $25,000 | 5 (100.0%) | 0 (0.0%) |
| $25,000 to $49,999 | 5 (100.0%) | 0 (0.0%) |
| $50,000 to $74,999 | 6 (100.0%) | 0 (0.0%) |
| $75,000 to $99,999 | 8 (53.3%) | 7 (46.7%) |
| $100,000 and over | 9 (27.3%) | 24 (72.7%) |
Public vs Private Health Insurance Coverage by Age in Atlantic
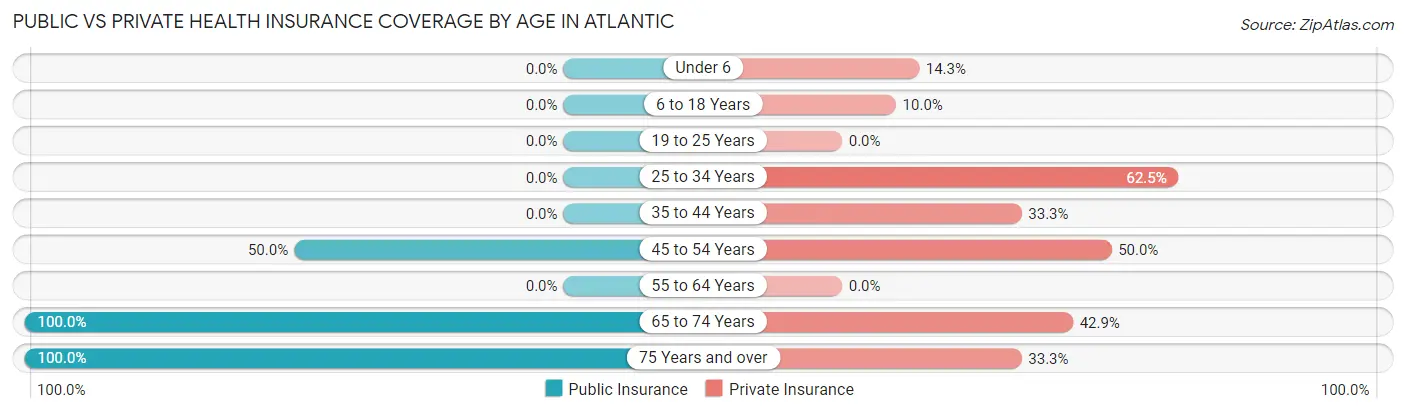
| Age Bracket | Public Insurance | Private Insurance |
| Under 6 | 0 (0.0%) | 1 (14.3%) |
| 6 to 18 Years | 0 (0.0%) | 1 (10.0%) |
| 19 to 25 Years | 0 (0.0%) | 0 (0.0%) |
| 25 to 34 Years | 0 (0.0%) | 5 (62.5%) |
| 35 to 44 Years | 0 (0.0%) | 3 (33.3%) |
| 45 to 54 Years | 5 (50.0%) | 5 (50.0%) |
| 55 to 64 Years | 0 (0.0%) | 0 (0.0%) |
| 65 to 74 Years | 7 (100.0%) | 3 (42.9%) |
| 75 Years and over | 6 (100.0%) | 2 (33.3%) |
| Total | 18 (28.1%) | 20 (31.2%) |
Disability Status by Sex by Age in Atlantic
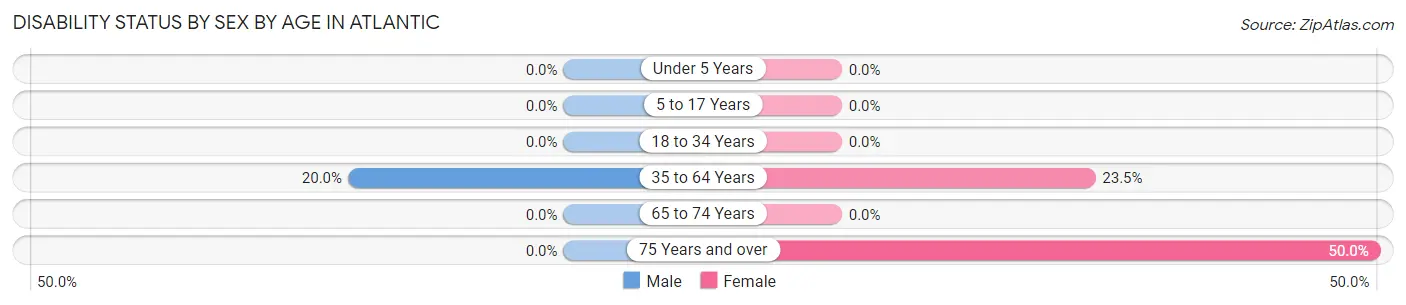
| Age Bracket | Male | Female |
| Under 5 Years | 0 (0.0%) | 0 (0.0%) |
| 5 to 17 Years | 0 (0.0%) | 0 (0.0%) |
| 18 to 34 Years | 0 (0.0%) | 0 (0.0%) |
| 35 to 64 Years | 1 (20.0%) | 4 (23.5%) |
| 65 to 74 Years | 0 (0.0%) | 0 (0.0%) |
| 75 Years and over | 0 (0.0%) | 2 (50.0%) |
Disability Class by Sex by Age in Atlantic
Disability Class: Hearing Difficulty
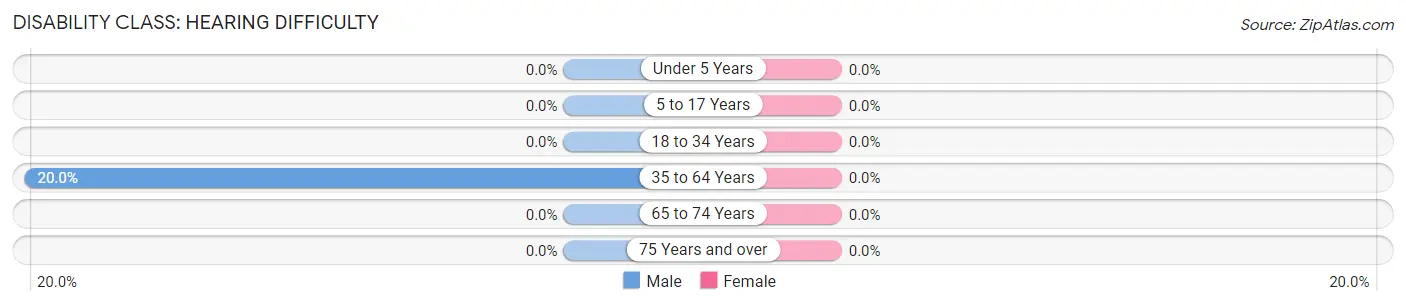
| Age Bracket | Male | Female |
| Under 5 Years | 0 (0.0%) | 0 (0.0%) |
| 5 to 17 Years | 0 (0.0%) | 0 (0.0%) |
| 18 to 34 Years | 0 (0.0%) | 0 (0.0%) |
| 35 to 64 Years | 1 (20.0%) | 0 (0.0%) |
| 65 to 74 Years | 0 (0.0%) | 0 (0.0%) |
| 75 Years and over | 0 (0.0%) | 0 (0.0%) |
Disability Class: Vision Difficulty
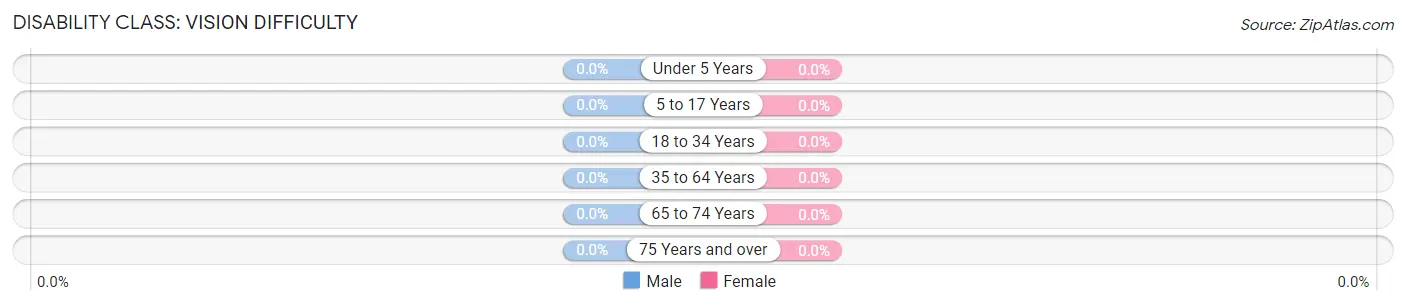
| Age Bracket | Male | Female |
| Under 5 Years | 0 (0.0%) | 0 (0.0%) |
| 5 to 17 Years | 0 (0.0%) | 0 (0.0%) |
| 18 to 34 Years | 0 (0.0%) | 0 (0.0%) |
| 35 to 64 Years | 0 (0.0%) | 0 (0.0%) |
| 65 to 74 Years | 0 (0.0%) | 0 (0.0%) |
| 75 Years and over | 0 (0.0%) | 0 (0.0%) |
Disability Class: Cognitive Difficulty
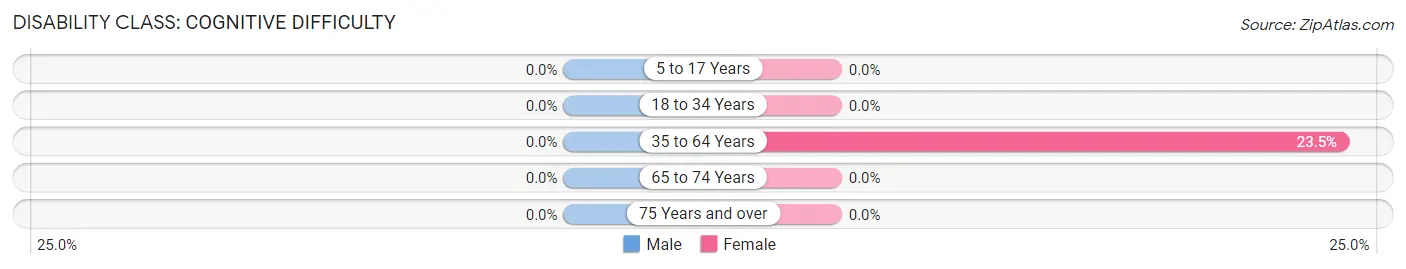
| Age Bracket | Male | Female |
| 5 to 17 Years | 0 (0.0%) | 0 (0.0%) |
| 18 to 34 Years | 0 (0.0%) | 0 (0.0%) |
| 35 to 64 Years | 0 (0.0%) | 4 (23.5%) |
| 65 to 74 Years | 0 (0.0%) | 0 (0.0%) |
| 75 Years and over | 0 (0.0%) | 0 (0.0%) |
Disability Class: Ambulatory Difficulty
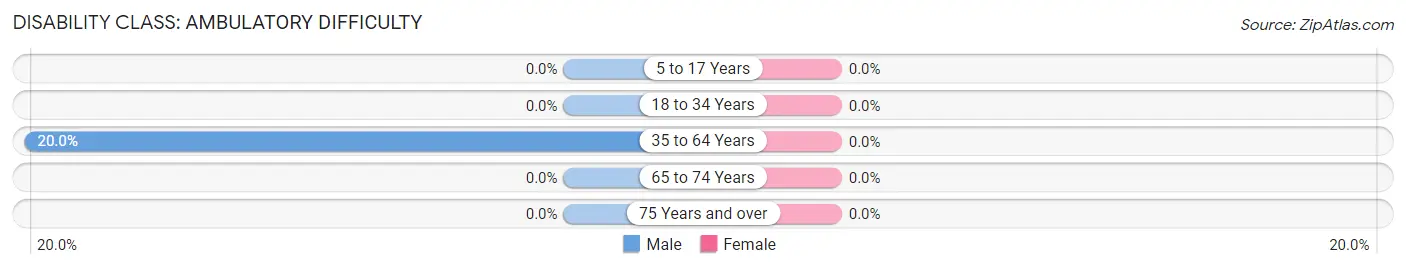
| Age Bracket | Male | Female |
| 5 to 17 Years | 0 (0.0%) | 0 (0.0%) |
| 18 to 34 Years | 0 (0.0%) | 0 (0.0%) |
| 35 to 64 Years | 1 (20.0%) | 0 (0.0%) |
| 65 to 74 Years | 0 (0.0%) | 0 (0.0%) |
| 75 Years and over | 0 (0.0%) | 0 (0.0%) |
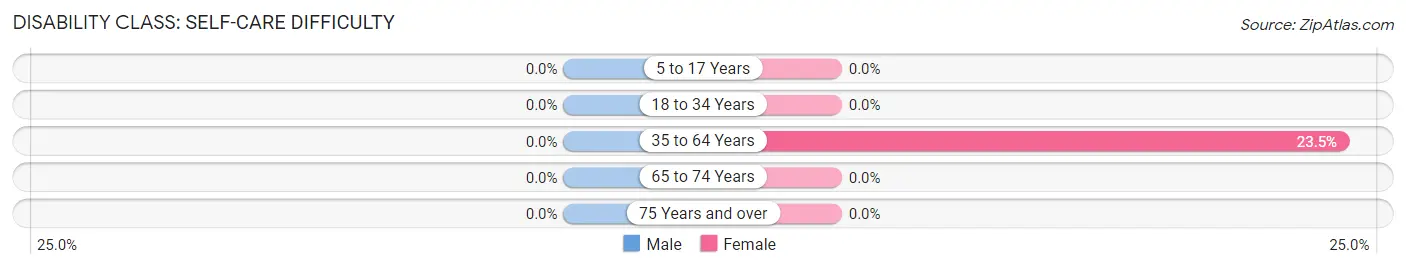
Disability Class: Self-Care Difficulty
| Age Bracket | Male | Female |
| 5 to 17 Years | 0 (0.0%) | 0 (0.0%) |
| 18 to 34 Years | 0 (0.0%) | 0 (0.0%) |
| 35 to 64 Years | 0 (0.0%) | 4 (23.5%) |
| 65 to 74 Years | 0 (0.0%) | 0 (0.0%) |
| 75 Years and over | 0 (0.0%) | 0 (0.0%) |
Technology Access in Atlantic
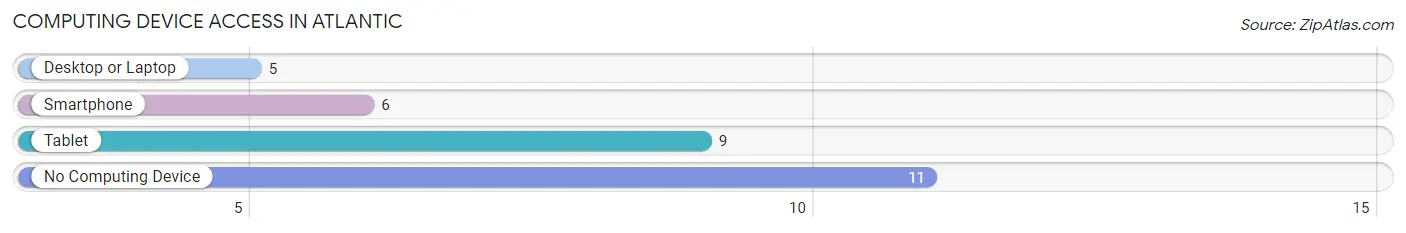
Computing Device Access in Atlantic
| Device Type | # Households | % Households |
| Desktop or Laptop | 5 | 25.0% |
| Smartphone | 6 | 30.0% |
| Tablet | 9 | 45.0% |
| No Computing Device | 11 | 55.0% |
| Total | 20 | 100.0% |
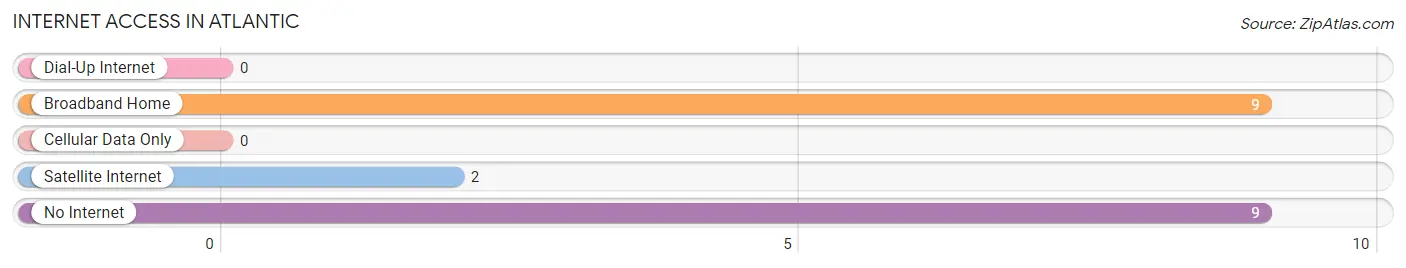
Internet Access in Atlantic
| Internet Type | # Households | % Households |
| Dial-Up Internet | 0 | 0.0% |
| Broadband Home | 9 | 45.0% |
| Cellular Data Only | 0 | 0.0% |
| Satellite Internet | 2 | 10.0% |
| No Internet | 9 | 45.0% |
| Total | 20 | 100.0% |
Atlantic Summary
Atlantic, Pennsylvania is a small borough located in the southeastern corner of the state, in the heart of the Lehigh Valley. It is situated in Northampton County, approximately 10 miles north of Allentown and about 70 miles northwest of Philadelphia. The borough is bordered by the townships of Lower Nazareth, Upper Nazareth, and Bushkill.
History
The area that is now Atlantic was first settled in the late 1700s by German immigrants. The first settler was John Fretz, who arrived in 1790 and built a log cabin near the present-day intersection of Main Street and Atlantic Avenue. The area was originally known as Fretztown, but the name was changed to Atlantic in 1845 when the post office was established.
The borough was officially incorporated in 1867, and the first mayor was elected in 1868. The population of Atlantic grew steadily throughout the 19th century, reaching a peak of 1,845 in 1900. The population has since declined, and as of the 2010 census, the population was 1,541.
Geography
Atlantic is located at 40°41'N 75°20'W. It has a total area of 0.7 square miles, all of which is land. The borough is situated in the Lehigh Valley, a region of rolling hills and valleys. The Lehigh River flows through the borough, and there are several small creeks and streams in the area.
Economy
The economy of Atlantic is largely based on agriculture and light manufacturing. The borough is home to several small businesses, including a bakery, a hardware store, and a furniture store. There are also several restaurants and bars in the area.
The largest employer in the borough is the Atlantic Manufacturing Company, which produces a variety of products, including furniture, tools, and automotive parts. The company has been in operation since 1867 and employs over 200 people.
Demographics
As of the 2010 census, the population of Atlantic was 1,541. The racial makeup of the borough was 94.3% White, 2.2% African American, 0.3% Native American, 0.7% Asian, 0.1% Pacific Islander, and 2.4% from other races. Hispanic or Latino of any race were 3.2% of the population.
The median household income in Atlantic was $45,938, and the median family income was $51,964. The per capita income was $20,945. About 8.3% of families and 10.2% of the population were below the poverty line, including 14.2% of those under age 18 and 6.2% of those age 65 or over.
Common Questions
What is Per Capita Income in Atlantic?
Per Capita income in Atlantic is $28,608.
What is the Median Family Income in Atlantic?
Median Family Income in Atlantic is $83,750.
What is the Median Household income in Atlantic?
Median Household Income in Atlantic is $76,250.
What is Inequality or Gini Index in Atlantic?
Inequality or Gini Index in Atlantic is 0.34.
What is the Total Population of Atlantic?
Total Population of Atlantic is 64.
What is the Total Male Population of Atlantic?
Total Male Population of Atlantic is 20.
What is the Total Female Population of Atlantic?
Total Female Population of Atlantic is 44.
What is the Ratio of Males per 100 Females in Atlantic?
There are 45.45 Males per 100 Females in Atlantic.
What is the Ratio of Females per 100 Males in Atlantic?
There are 220.00 Females per 100 Males in Atlantic.
What is the Median Population Age in Atlantic?
Median Population Age in Atlantic is 36.8 Years.
What is the Average Family Size in Atlantic
Average Family Size in Atlantic is 3.9 People.
What is the Average Household Size in Atlantic
Average Household Size in Atlantic is 3.2 People.
How Large is the Labor Force in Atlantic?
There are 29 People in the Labor Forcein in Atlantic.
What is the Percentage of People in the Labor Force in Atlantic?
60.4% of People are in the Labor Force in Atlantic.
What is the Unemployment Rate in Atlantic?
Unemployment Rate in Atlantic is 17.2%.