Aspers, PA Map & Demographics
Aspers Map
Aspers Overview
$35,786
PER CAPITA INCOME
$92,727
AVG FAMILY INCOME
$76,875
AVG HOUSEHOLD INCOME
0.31
INEQUALITY / GINI INDEX
234
TOTAL POPULATION
101
MALE POPULATION
133
FEMALE POPULATION
75.94
MALES / 100 FEMALES
131.68
FEMALES / 100 MALES
57.2
MEDIAN AGE
3.2
AVG FAMILY SIZE
2.9
AVG HOUSEHOLD SIZE
150
LABOR FORCE [ PEOPLE ]
64.1%
PERCENT IN LABOR FORCE
6.0%
UNEMPLOYMENT RATE
Aspers Zip Codes
Aspers Area Codes
Income in Aspers
Income Overview in Aspers
Per Capita Income in Aspers is $35,786, while median incomes of families and households are $92,727 and $76,875 respectively.
| Characteristic | Number | Measure |
| Per Capita Income | 234 | $35,786 |
| Median Family Income | 62 | $92,727 |
| Mean Family Income | 62 | $106,898 |
| Median Household Income | 82 | $76,875 |
| Mean Household Income | 82 | $93,257 |
| Income Deficit | 62 | $0 |
| Wage / Income Gap (%) | 234 | 0.00% |
| Wage / Income Gap ($) | 234 | 100.00¢ per $1 |
| Gini / Inequality Index | 234 | 0.31 |
Earnings by Sex in Aspers
| Sex | Number | Average Earnings |
| Male | 73 (48.7%) | $0 |
| Female | 77 (51.3%) | $0 |
| Total | 150 (100.0%) | $0 |
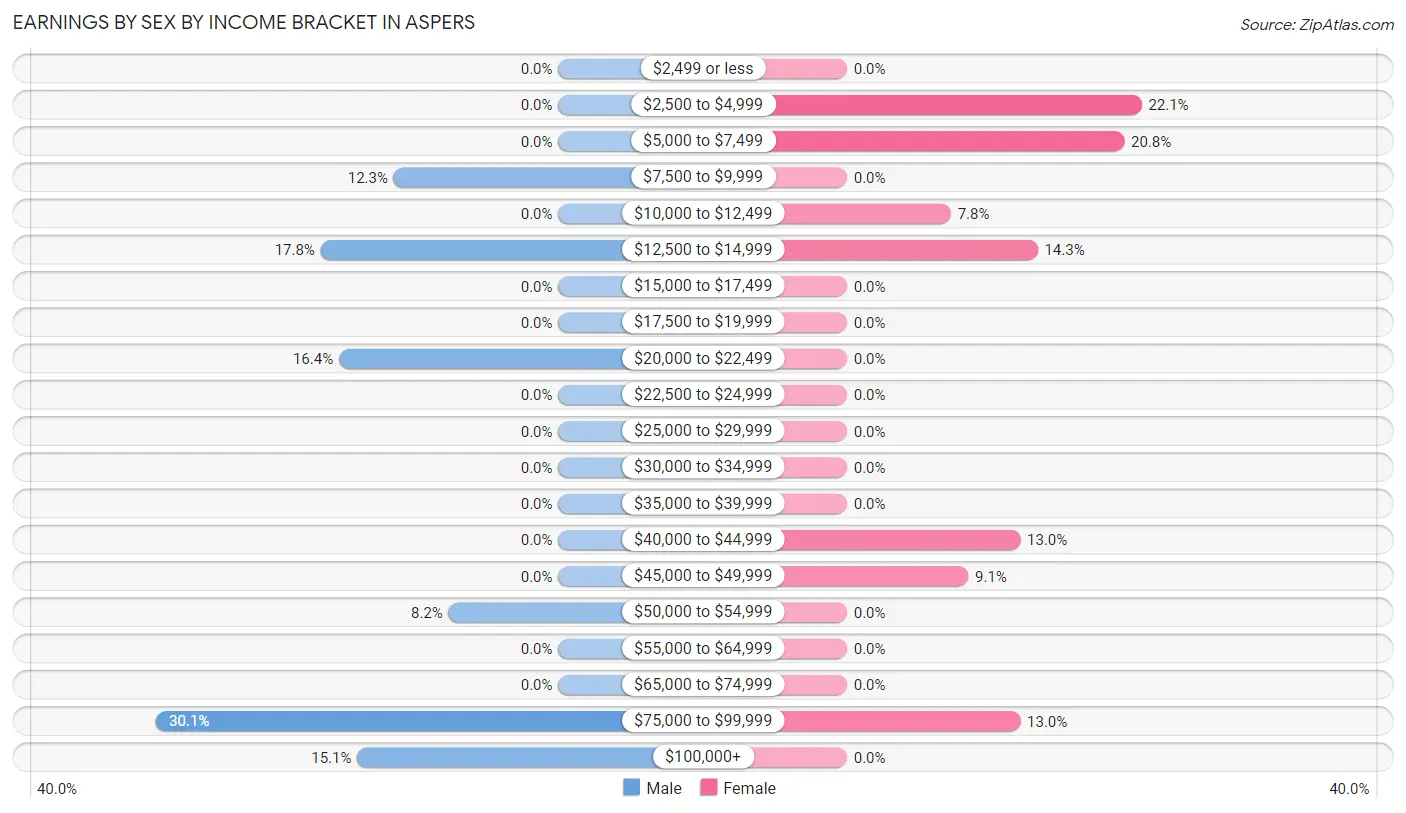
Earnings by Sex by Income Bracket in Aspers
The most common earnings brackets in Aspers are $75,000 to $99,999 for men (22 | 30.1%) and $2,500 to $4,999 for women (17 | 22.1%).
| Income | Male | Female |
| $2,499 or less | 0 (0.0%) | 0 (0.0%) |
| $2,500 to $4,999 | 0 (0.0%) | 17 (22.1%) |
| $5,000 to $7,499 | 0 (0.0%) | 16 (20.8%) |
| $7,500 to $9,999 | 9 (12.3%) | 0 (0.0%) |
| $10,000 to $12,499 | 0 (0.0%) | 6 (7.8%) |
| $12,500 to $14,999 | 13 (17.8%) | 11 (14.3%) |
| $15,000 to $17,499 | 0 (0.0%) | 0 (0.0%) |
| $17,500 to $19,999 | 0 (0.0%) | 0 (0.0%) |
| $20,000 to $22,499 | 12 (16.4%) | 0 (0.0%) |
| $22,500 to $24,999 | 0 (0.0%) | 0 (0.0%) |
| $25,000 to $29,999 | 0 (0.0%) | 0 (0.0%) |
| $30,000 to $34,999 | 0 (0.0%) | 0 (0.0%) |
| $35,000 to $39,999 | 0 (0.0%) | 0 (0.0%) |
| $40,000 to $44,999 | 0 (0.0%) | 10 (13.0%) |
| $45,000 to $49,999 | 0 (0.0%) | 7 (9.1%) |
| $50,000 to $54,999 | 6 (8.2%) | 0 (0.0%) |
| $55,000 to $64,999 | 0 (0.0%) | 0 (0.0%) |
| $65,000 to $74,999 | 0 (0.0%) | 0 (0.0%) |
| $75,000 to $99,999 | 22 (30.1%) | 10 (13.0%) |
| $100,000+ | 11 (15.1%) | 0 (0.0%) |
| Total | 73 (100.0%) | 77 (100.0%) |
Earnings by Sex by Educational Attainment in Aspers
| Educational Attainment | Male Income | Female Income |
| Less than High School | - | - |
| High School Diploma | - | - |
| College or Associate's Degree | - | - |
| Bachelor's Degree | - | - |
| Graduate Degree | - | - |
| Total | $80,227 | $0 |
Family Income in Aspers
Family Income Brackets in Aspers
According to the Aspers family income data, there are 23 families falling into the $75,000 to $99,999 income range, which is the most common income bracket and makes up 37.1% of all families.
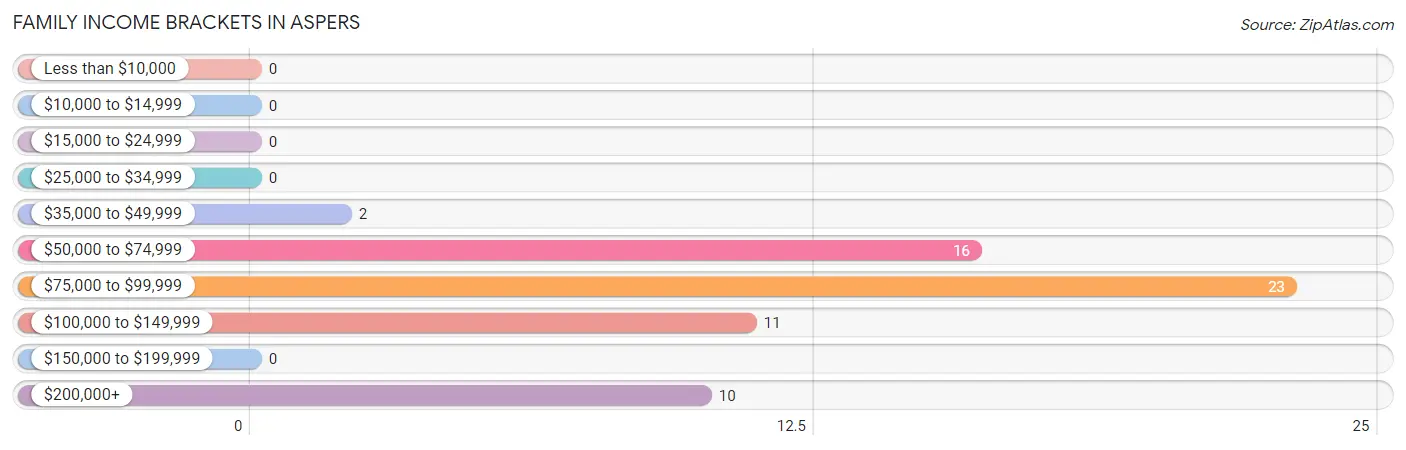
| Income Bracket | # Families | % Families |
| Less than $10,000 | 0 | 0.0% |
| $10,000 to $14,999 | 0 | 0.0% |
| $15,000 to $24,999 | 0 | 0.0% |
| $25,000 to $34,999 | 0 | 0.0% |
| $35,000 to $49,999 | 2 | 3.2% |
| $50,000 to $74,999 | 16 | 25.8% |
| $75,000 to $99,999 | 23 | 37.1% |
| $100,000 to $149,999 | 11 | 17.7% |
| $150,000 to $199,999 | 0 | 0.0% |
| $200,000+ | 10 | 16.1% |
Family Income by Famaliy Size in Aspers
2-person families (40 | 64.5%) account for the highest median family income in Aspers with $92,955 per family, while 2-person families (40 | 64.5%) have the highest median income of $46,478 per family member.
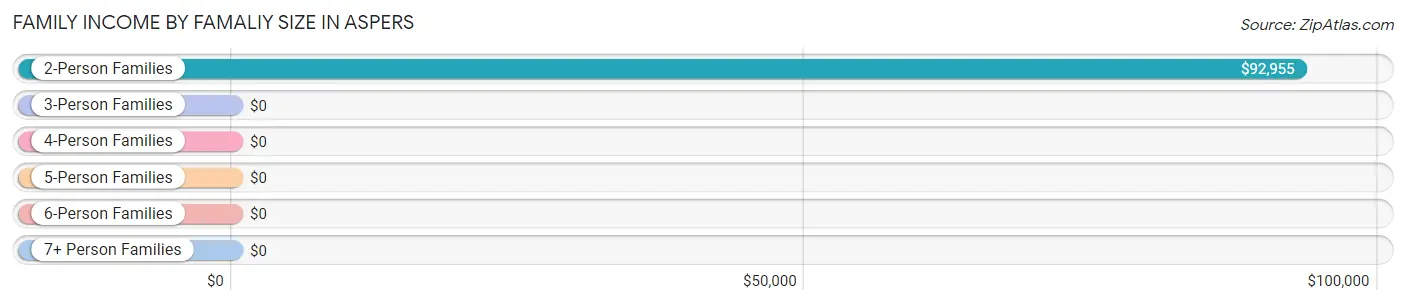
| Income Bracket | # Families | Median Income |
| 2-Person Families | 40 (64.5%) | $92,955 |
| 3-Person Families | 10 (16.1%) | $0 |
| 4-Person Families | 0 (0.0%) | $0 |
| 5-Person Families | 12 (19.4%) | $0 |
| 6-Person Families | 0 (0.0%) | $0 |
| 7+ Person Families | 0 (0.0%) | $0 |
| Total | 62 (100.0%) | $92,727 |
Family Income by Number of Earners in Aspers
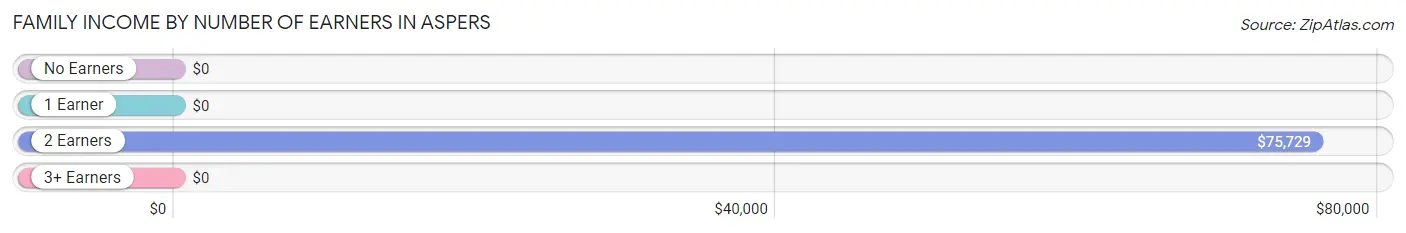
| Number of Earners | # Families | Median Income |
| No Earners | 0 (0.0%) | $0 |
| 1 Earner | 13 (21.0%) | $0 |
| 2 Earners | 39 (62.9%) | $75,729 |
| 3+ Earners | 10 (16.1%) | $0 |
| Total | 62 (100.0%) | $92,727 |
Household Income in Aspers
Household Income Brackets in Aspers
With 29 households falling in the category, the $75,000 to $99,999 income range is the most frequent in Aspers, accounting for 35.4% of all households.
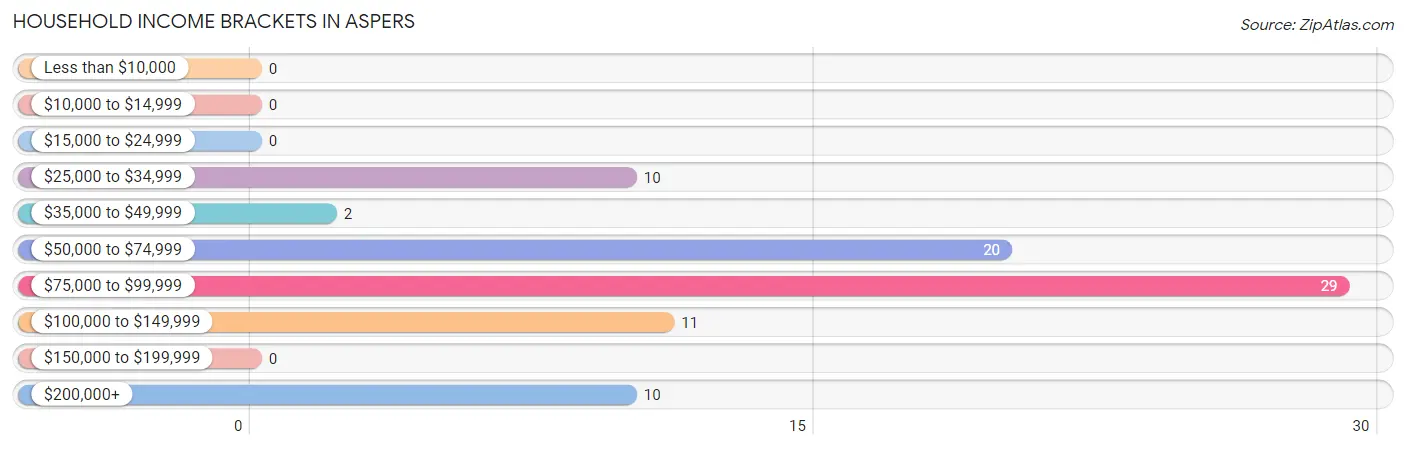
| Income Bracket | # Households | % Households |
| Less than $10,000 | 0 | 0.0% |
| $10,000 to $14,999 | 0 | 0.0% |
| $15,000 to $24,999 | 0 | 0.0% |
| $25,000 to $34,999 | 10 | 12.2% |
| $35,000 to $49,999 | 2 | 2.4% |
| $50,000 to $74,999 | 20 | 24.4% |
| $75,000 to $99,999 | 29 | 35.4% |
| $100,000 to $149,999 | 11 | 13.4% |
| $150,000 to $199,999 | 0 | 0.0% |
| $200,000+ | 10 | 12.2% |
Household Income by Householder Age in Aspers
The median household income in Aspers is $76,875, with the highest median household income of $94,318 found in the 45 to 64 years age bracket for the primary householder. A total of 48 households (58.5%) fall into this category.
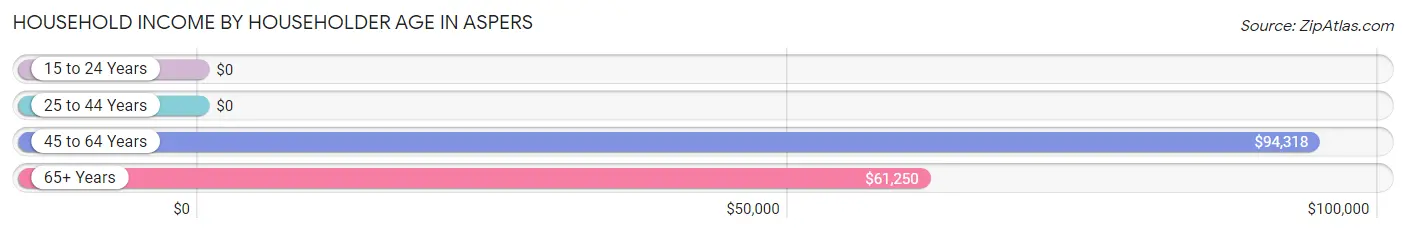
| Income Bracket | # Households | Median Income |
| 15 to 24 Years | 0 (0.0%) | $0 |
| 25 to 44 Years | 0 (0.0%) | $0 |
| 45 to 64 Years | 48 (58.5%) | $94,318 |
| 65+ Years | 34 (41.5%) | $61,250 |
| Total | 82 (100.0%) | $76,875 |
Poverty in Aspers
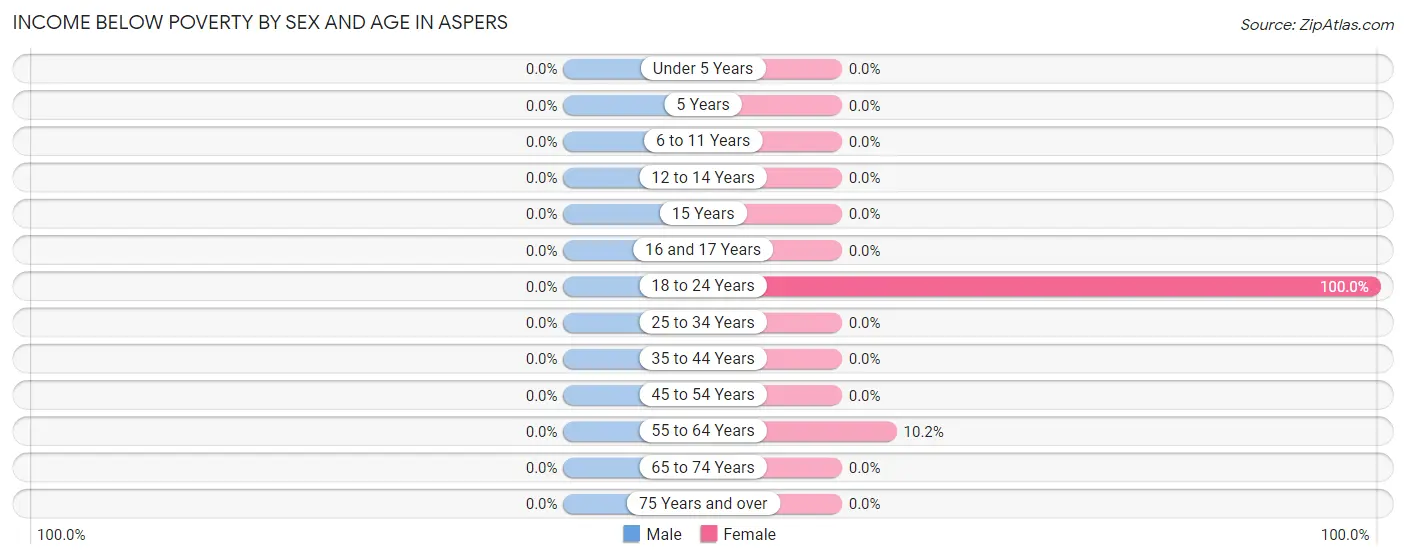
Income Below Poverty by Sex and Age in Aspers
| Age Bracket | Male | Female |
| Under 5 Years | 0 (0.0%) | 0 (0.0%) |
| 5 Years | 0 (0.0%) | 0 (0.0%) |
| 6 to 11 Years | 0 (0.0%) | 0 (0.0%) |
| 12 to 14 Years | 0 (0.0%) | 0 (0.0%) |
| 15 Years | 0 (0.0%) | 0 (0.0%) |
| 16 and 17 Years | 0 (0.0%) | 0 (0.0%) |
| 18 to 24 Years | 0 (0.0%) | 8 (100.0%) |
| 25 to 34 Years | 0 (0.0%) | 0 (0.0%) |
| 35 to 44 Years | 0 (0.0%) | 0 (0.0%) |
| 45 to 54 Years | 0 (0.0%) | 0 (0.0%) |
| 55 to 64 Years | 0 (0.0%) | 6 (10.2%) |
| 65 to 74 Years | 0 (0.0%) | 0 (0.0%) |
| 75 Years and over | 0 (0.0%) | 0 (0.0%) |
| Total | 0 (0.0%) | 14 (10.5%) |
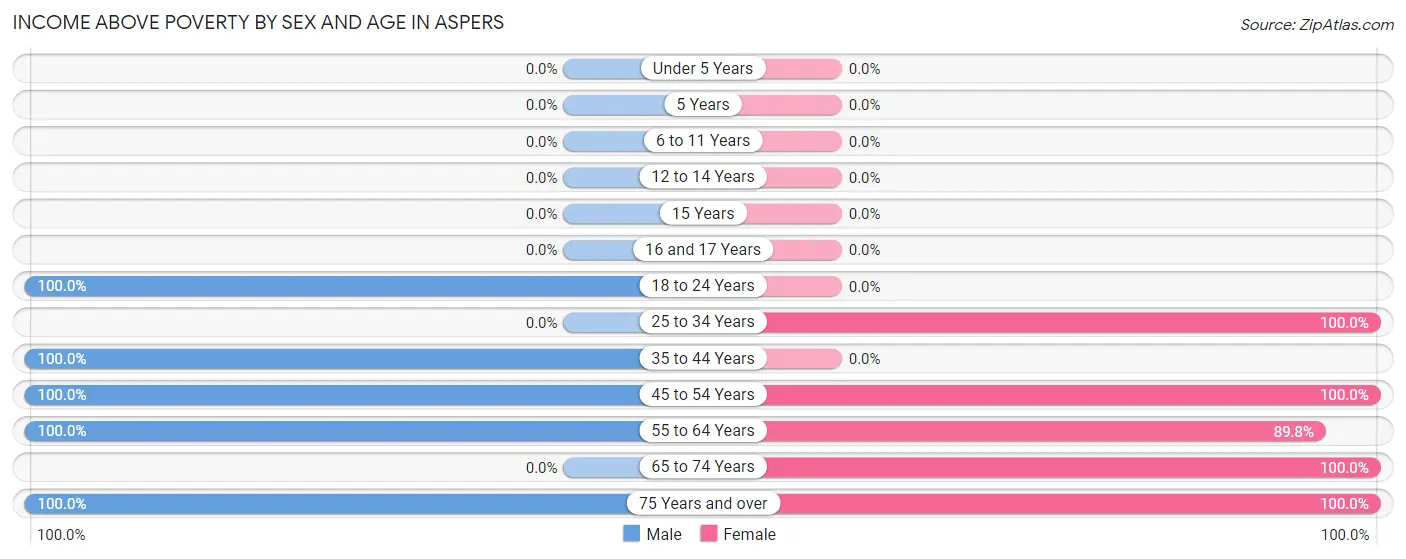
Income Above Poverty by Sex and Age in Aspers
According to the poverty statistics in Aspers, males aged 18 to 24 years and females aged 25 to 34 years are the age groups that are most secure financially, with 100.0% of males and 100.0% of females in these age groups living above the poverty line.
| Age Bracket | Male | Female |
| Under 5 Years | 0 (0.0%) | 0 (0.0%) |
| 5 Years | 0 (0.0%) | 0 (0.0%) |
| 6 to 11 Years | 0 (0.0%) | 0 (0.0%) |
| 12 to 14 Years | 0 (0.0%) | 0 (0.0%) |
| 15 Years | 0 (0.0%) | 0 (0.0%) |
| 16 and 17 Years | 0 (0.0%) | 0 (0.0%) |
| 18 to 24 Years | 9 (100.0%) | 0 (0.0%) |
| 25 to 34 Years | 0 (0.0%) | 33 (100.0%) |
| 35 to 44 Years | 25 (100.0%) | 0 (0.0%) |
| 45 to 54 Years | 11 (100.0%) | 11 (100.0%) |
| 55 to 64 Years | 44 (100.0%) | 53 (89.8%) |
| 65 to 74 Years | 0 (0.0%) | 10 (100.0%) |
| 75 Years and over | 12 (100.0%) | 12 (100.0%) |
| Total | 101 (100.0%) | 119 (89.5%) |
Income Below Poverty Among Married-Couple Families in Aspers
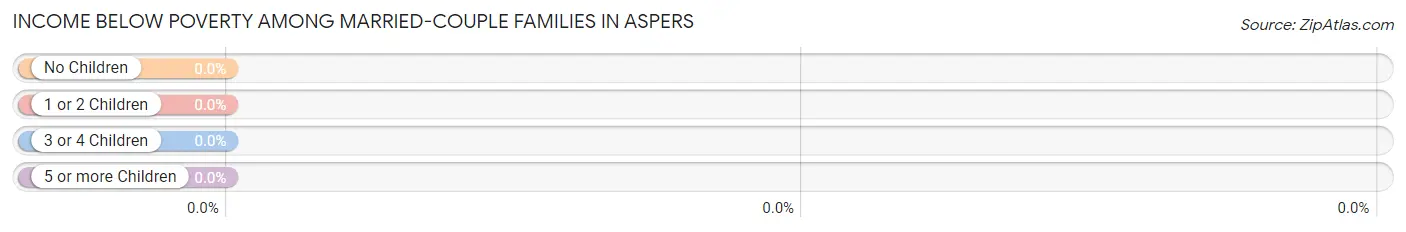
| Children | Above Poverty | Below Poverty |
| No Children | 32 (100.0%) | 0 (0.0%) |
| 1 or 2 Children | 0 (0.0%) | 0 (0.0%) |
| 3 or 4 Children | 0 (0.0%) | 0 (0.0%) |
| 5 or more Children | 0 (0.0%) | 0 (0.0%) |
| Total | 32 (100.0%) | 0 (0.0%) |
Income Below Poverty Among Single-Parent Households in Aspers
| Children | Single Father | Single Mother |
| No Children | 0 (0.0%) | 0 (0.0%) |
| 1 or 2 Children | 0 (0.0%) | 0 (0.0%) |
| 3 or 4 Children | 0 (0.0%) | 0 (0.0%) |
| 5 or more Children | 0 (0.0%) | 0 (0.0%) |
| Total | 0 (0.0%) | 0 (0.0%) |
Income Below Poverty Among Married-Couple vs Single-Parent Households in Aspers
| Children | Married-Couple Families | Single-Parent Households |
| No Children | 0 (0.0%) | 0 (0.0%) |
| 1 or 2 Children | 0 (0.0%) | 0 (0.0%) |
| 3 or 4 Children | 0 (0.0%) | 0 (0.0%) |
| 5 or more Children | 0 (0.0%) | 0 (0.0%) |
| Total | 0 (0.0%) | 0 (0.0%) |
Race in Aspers
The most populous races in Aspers are , and White / Caucasian (234 | 100.0%).
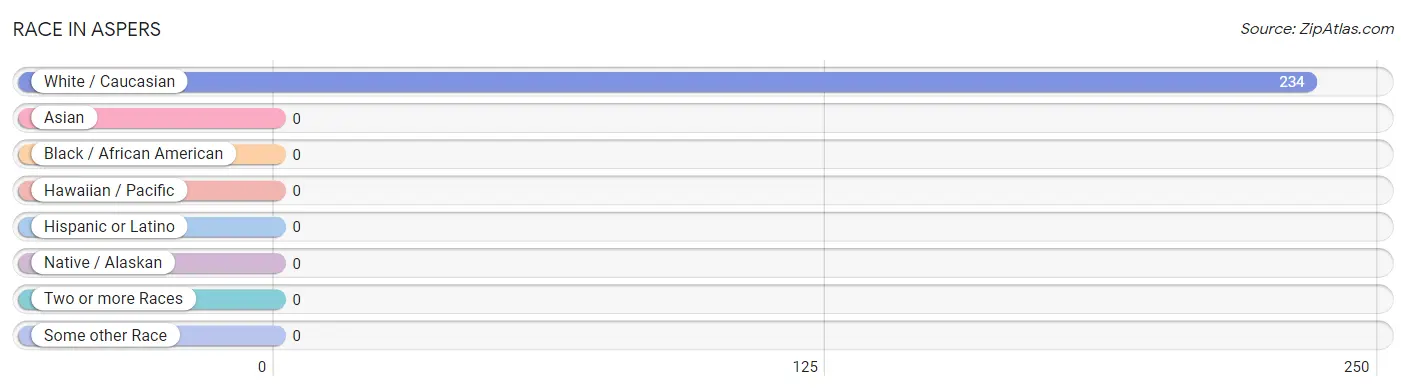
| Race | # Population | % Population |
| Asian | 0 | 0.0% |
| Black / African American | 0 | 0.0% |
| Hawaiian / Pacific | 0 | 0.0% |
| Hispanic or Latino | 0 | 0.0% |
| Native / Alaskan | 0 | 0.0% |
| White / Caucasian | 234 | 100.0% |
| Two or more Races | 0 | 0.0% |
| Some other Race | 0 | 0.0% |
| Total | 234 | 100.0% |
Ancestry in Aspers
The most populous ancestries reported in Aspers are American (85 | 36.3%), German (79 | 33.8%), English (70 | 29.9%), Welsh (12 | 5.1%), and Italian (8 | 3.4%), together accounting for 108.5% of all Aspers residents.
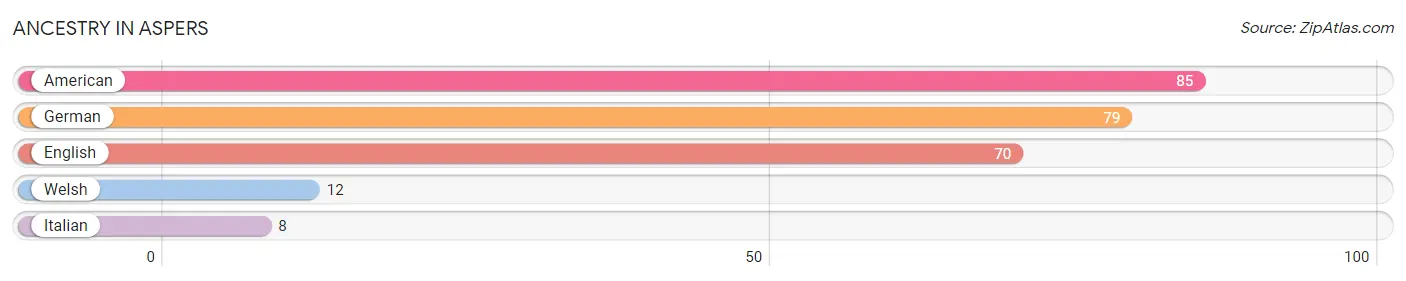
| Ancestry | # Population | % Population |
| American | 85 | 36.3% |
| English | 70 | 29.9% |
| German | 79 | 33.8% |
| Italian | 8 | 3.4% |
| Welsh | 12 | 5.1% | View All 5 Rows |
Immigrants in Aspers

| Immigration Origin | # Population | % Population | View All 0 Rows |
Sex and Age in Aspers
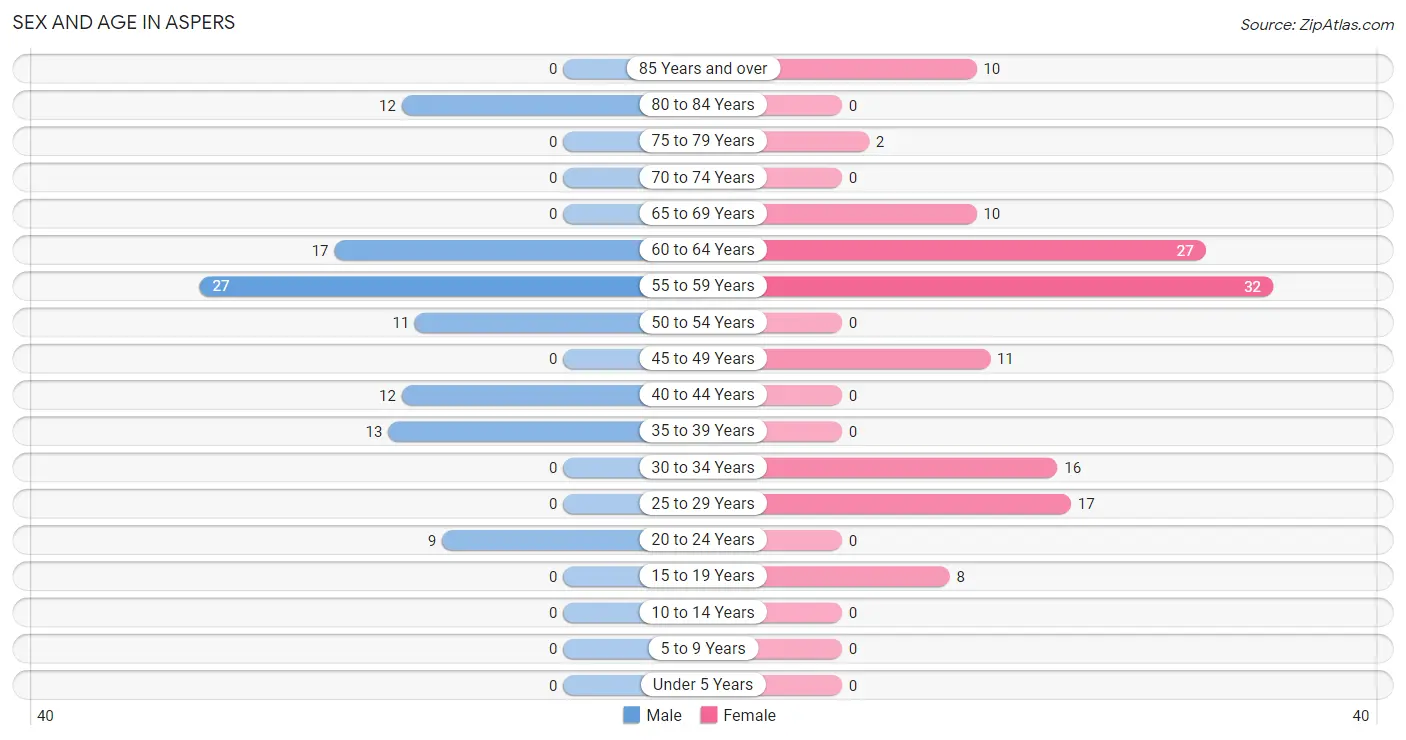
Sex and Age in Aspers
The most populous age groups in Aspers are 55 to 59 Years (27 | 26.7%) for men and 55 to 59 Years (32 | 24.1%) for women.
| Age Bracket | Male | Female |
| Under 5 Years | 0 (0.0%) | 0 (0.0%) |
| 5 to 9 Years | 0 (0.0%) | 0 (0.0%) |
| 10 to 14 Years | 0 (0.0%) | 0 (0.0%) |
| 15 to 19 Years | 0 (0.0%) | 8 (6.0%) |
| 20 to 24 Years | 9 (8.9%) | 0 (0.0%) |
| 25 to 29 Years | 0 (0.0%) | 17 (12.8%) |
| 30 to 34 Years | 0 (0.0%) | 16 (12.0%) |
| 35 to 39 Years | 13 (12.9%) | 0 (0.0%) |
| 40 to 44 Years | 12 (11.9%) | 0 (0.0%) |
| 45 to 49 Years | 0 (0.0%) | 11 (8.3%) |
| 50 to 54 Years | 11 (10.9%) | 0 (0.0%) |
| 55 to 59 Years | 27 (26.7%) | 32 (24.1%) |
| 60 to 64 Years | 17 (16.8%) | 27 (20.3%) |
| 65 to 69 Years | 0 (0.0%) | 10 (7.5%) |
| 70 to 74 Years | 0 (0.0%) | 0 (0.0%) |
| 75 to 79 Years | 0 (0.0%) | 2 (1.5%) |
| 80 to 84 Years | 12 (11.9%) | 0 (0.0%) |
| 85 Years and over | 0 (0.0%) | 10 (7.5%) |
| Total | 101 (100.0%) | 133 (100.0%) |
Families and Households in Aspers
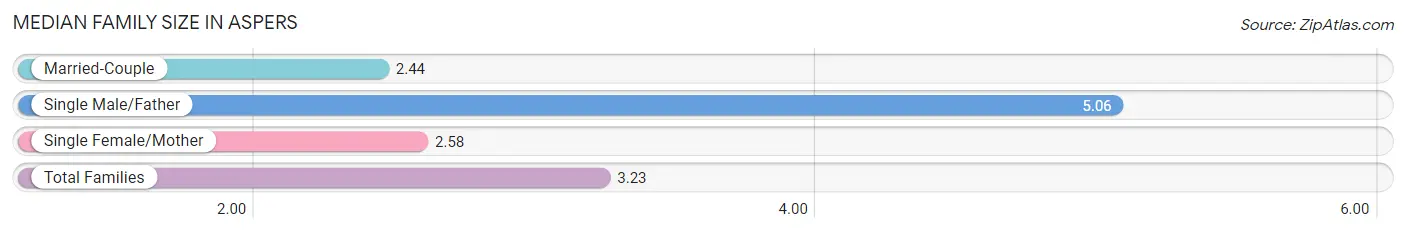
Median Family Size in Aspers
The median family size in Aspers is 3.23 persons per family, with single male/father families (18 | 29.0%) accounting for the largest median family size of 5.06 persons per family. On the other hand, married-couple families (32 | 51.6%) represent the smallest median family size with 2.44 persons per family.
| Family Type | # Families | Family Size |
| Married-Couple | 32 (51.6%) | 2.44 |
| Single Male/Father | 18 (29.0%) | 5.06 |
| Single Female/Mother | 12 (19.4%) | 2.58 |
| Total Families | 62 (100.0%) | 3.23 |
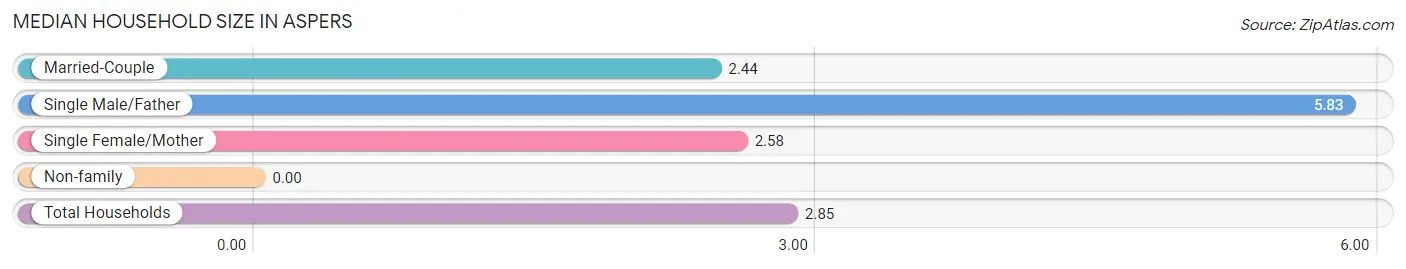
Median Household Size in Aspers
| Household Type | # Households | Household Size |
| Married-Couple | 32 (39.0%) | 2.44 |
| Single Male/Father | 18 (22.0%) | 5.83 |
| Single Female/Mother | 12 (14.6%) | 2.58 |
| Non-family | 20 (24.4%) | - |
| Total Households | 82 (100.0%) | 2.85 |
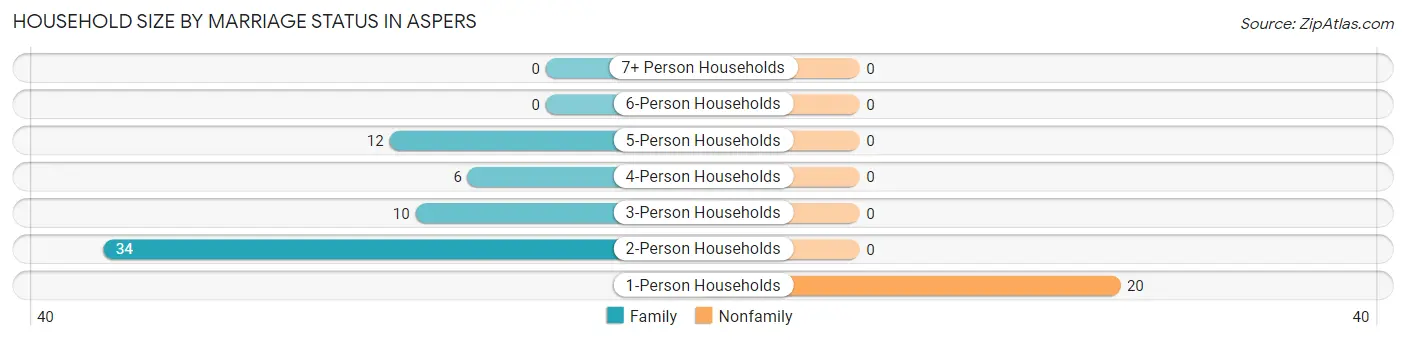
Household Size by Marriage Status in Aspers
Out of a total of 82 households in Aspers, 62 (75.6%) are family households, while 20 (24.4%) are nonfamily households. The most numerous type of family households are 2-person households, comprising 34, and the most common type of nonfamily households are 1-person households, comprising 20.
| Household Size | Family Households | Nonfamily Households |
| 1-Person Households | - | 20 (24.4%) |
| 2-Person Households | 34 (41.5%) | 0 (0.0%) |
| 3-Person Households | 10 (12.2%) | 0 (0.0%) |
| 4-Person Households | 6 (7.3%) | 0 (0.0%) |
| 5-Person Households | 12 (14.6%) | 0 (0.0%) |
| 6-Person Households | 0 (0.0%) | 0 (0.0%) |
| 7+ Person Households | 0 (0.0%) | 0 (0.0%) |
| Total | 62 (75.6%) | 20 (24.4%) |
Female Fertility in Aspers
Fertility by Age in Aspers
| Age Bracket | Women with Births | Births / 1,000 Women |
| 15 to 19 years | 0 (0.0%) | 0.0 |
| 20 to 34 years | 0 (0.0%) | 0.0 |
| 35 to 50 years | 0 (0.0%) | 0.0 |
| Total | 0 (0.0%) | 0.0 |
Fertility by Age by Marriage Status in Aspers
| Age Bracket | Married | Unmarried |
| 15 to 19 years | 0 (0.0%) | 0 (0.0%) |
| 20 to 34 years | 0 (0.0%) | 0 (0.0%) |
| 35 to 50 years | 0 (0.0%) | 0 (0.0%) |
| Total | 0 (0.0%) | 0 (0.0%) |
Fertility by Education in Aspers
| Educational Attainment | Women with Births | Births / 1,000 Women |
| Less than High School | 0 (0.0%) | 0.0 |
| High School Diploma | 0 (0.0%) | 0.0 |
| College or Associate's Degree | 0 (0.0%) | 0.0 |
| Bachelor's Degree | 0 (0.0%) | 0.0 |
| Graduate Degree | 0 (0.0%) | 0.0 |
| Total | 0 (0.0%) | 0.0 |
Fertility by Education by Marriage Status in Aspers
| Educational Attainment | Married | Unmarried |
| Less than High School | 0 (0.0%) | 0 (0.0%) |
| High School Diploma | 0 (0.0%) | 0 (0.0%) |
| College or Associate's Degree | 0 (0.0%) | 0 (0.0%) |
| Bachelor's Degree | 0 (0.0%) | 0 (0.0%) |
| Graduate Degree | 0 (0.0%) | 0 (0.0%) |
| Total | 0 (0.0%) | 0 (0.0%) |
Employment Characteristics in Aspers
Employment by Class of Employer in Aspers
Among the 141 employed individuals in Aspers, private company employees (109 | 77.3%), not-for-profit organizations (11 | 7.8%), and federal government employees (11 | 7.8%) make up the most common classes of employment.
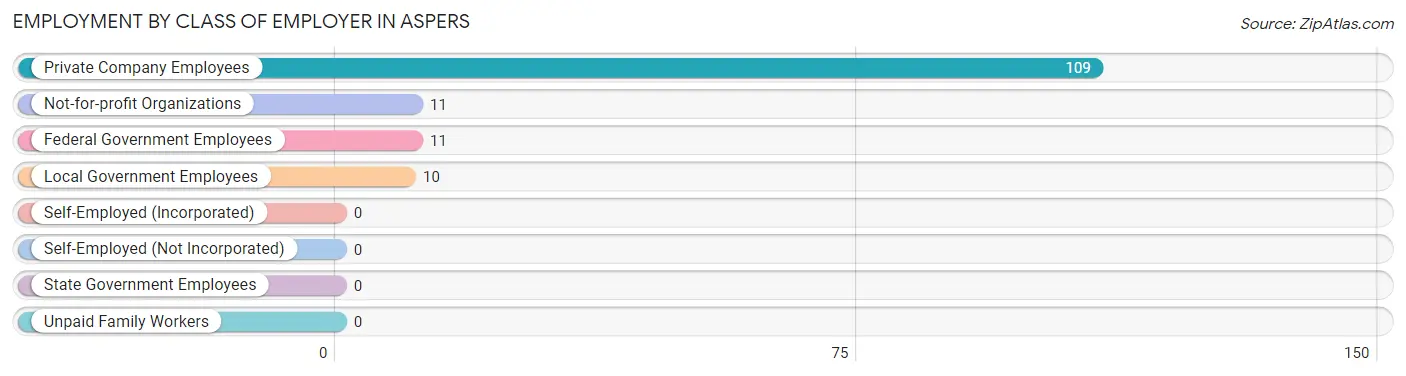
| Employer Class | # Employees | % Employees |
| Private Company Employees | 109 | 77.3% |
| Self-Employed (Incorporated) | 0 | 0.0% |
| Self-Employed (Not Incorporated) | 0 | 0.0% |
| Not-for-profit Organizations | 11 | 7.8% |
| Local Government Employees | 10 | 7.1% |
| State Government Employees | 0 | 0.0% |
| Federal Government Employees | 11 | 7.8% |
| Unpaid Family Workers | 0 | 0.0% |
| Total | 141 | 100.0% |
Employment Status by Age in Aspers
According to the labor force statistics for Aspers, out of the total population over 16 years of age (234), 64.1% or 150 individuals are in the labor force, with 6.0% or 9 of them unemployed. The age group with the highest labor force participation rate is 20 to 24 years, with 100.0% or 9 individuals in the labor force. Within the labor force, the 20 to 24 years age range has the highest percentage of unemployed individuals, with 100.0% or 9 of them being unemployed.
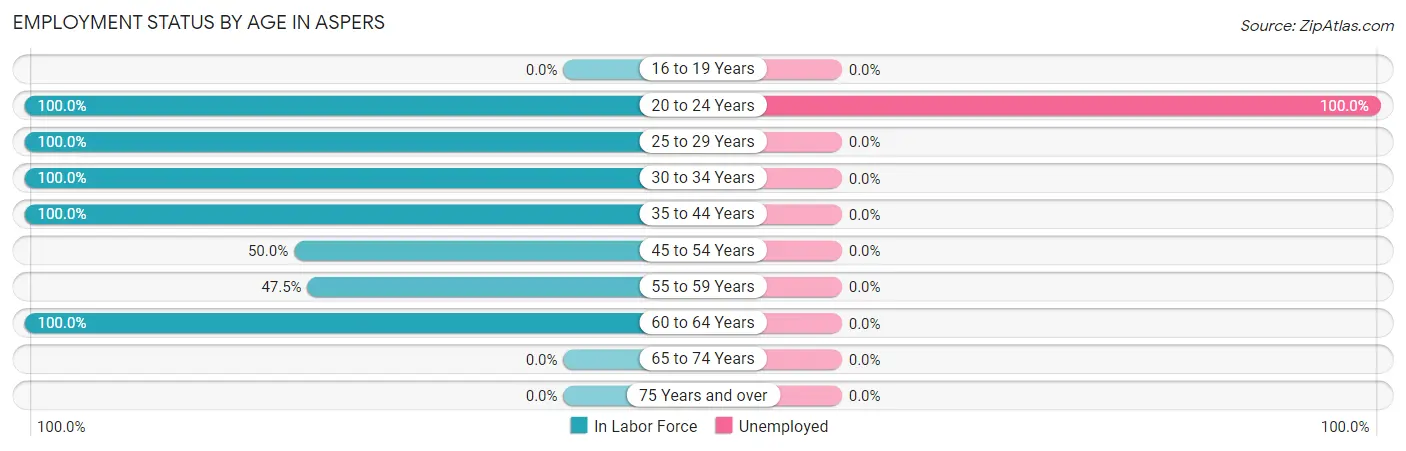
| Age Bracket | In Labor Force | Unemployed |
| 16 to 19 Years | 0 (0.0%) | 0 (0.0%) |
| 20 to 24 Years | 9 (100.0%) | 9 (100.0%) |
| 25 to 29 Years | 17 (100.0%) | 0 (0.0%) |
| 30 to 34 Years | 16 (100.0%) | 0 (0.0%) |
| 35 to 44 Years | 25 (100.0%) | 0 (0.0%) |
| 45 to 54 Years | 11 (50.0%) | 0 (0.0%) |
| 55 to 59 Years | 28 (47.5%) | 0 (0.0%) |
| 60 to 64 Years | 44 (100.0%) | 0 (0.0%) |
| 65 to 74 Years | 0 (0.0%) | 0 (0.0%) |
| 75 Years and over | 0 (0.0%) | 0 (0.0%) |
| Total | 150 (64.1%) | 9 (6.0%) |
Employment Status by Educational Attainment in Aspers
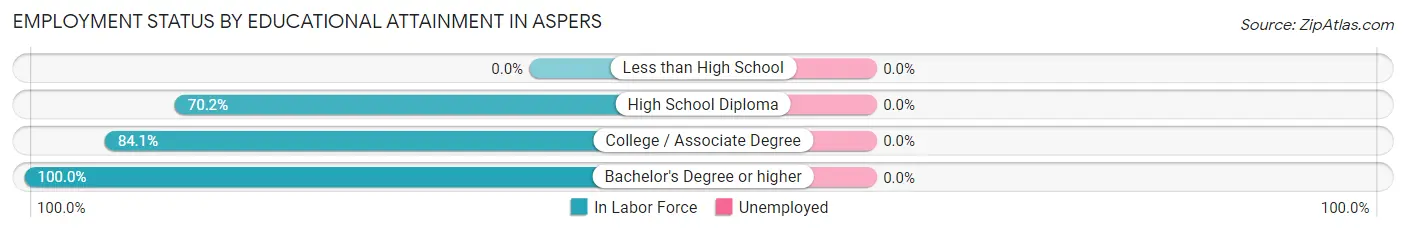
| Educational Attainment | In Labor Force | Unemployed |
| Less than High School | 0 (0.0%) | 0 (0.0%) |
| High School Diploma | 73 (70.2%) | 0 (0.0%) |
| College / Associate Degree | 58 (84.1%) | 0 (0.0%) |
| Bachelor's Degree or higher | 10 (100.0%) | 0 (0.0%) |
| Total | 141 (77.0%) | 0 (0.0%) |
Employment Occupations by Sex in Aspers
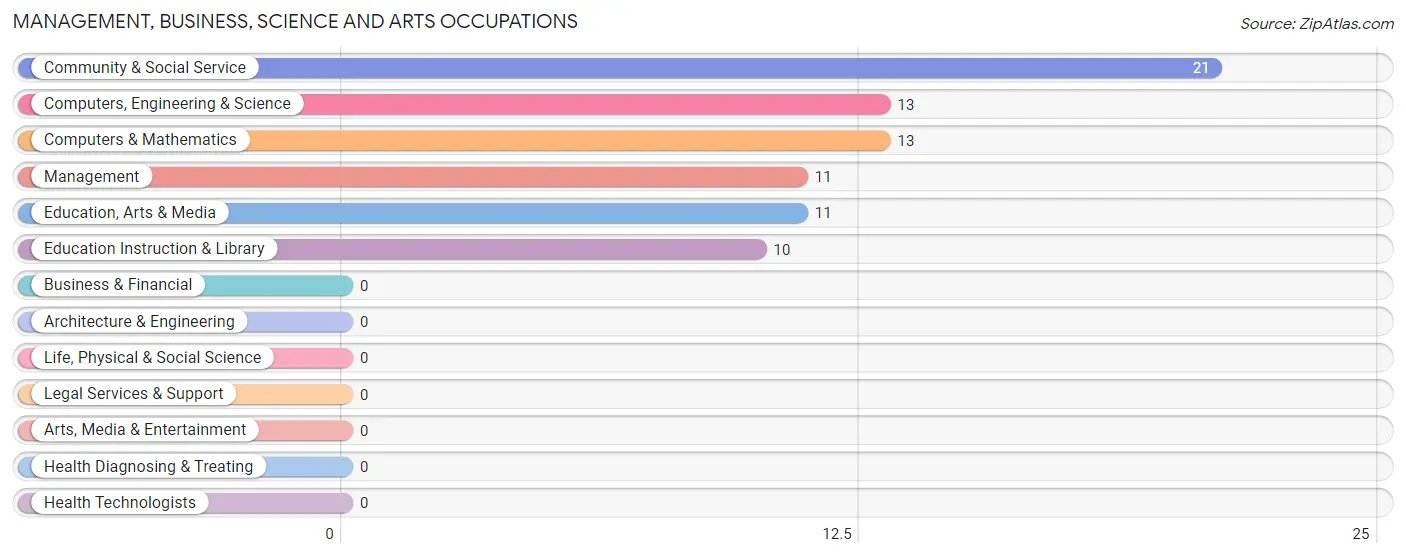
Management, Business, Science and Arts Occupations
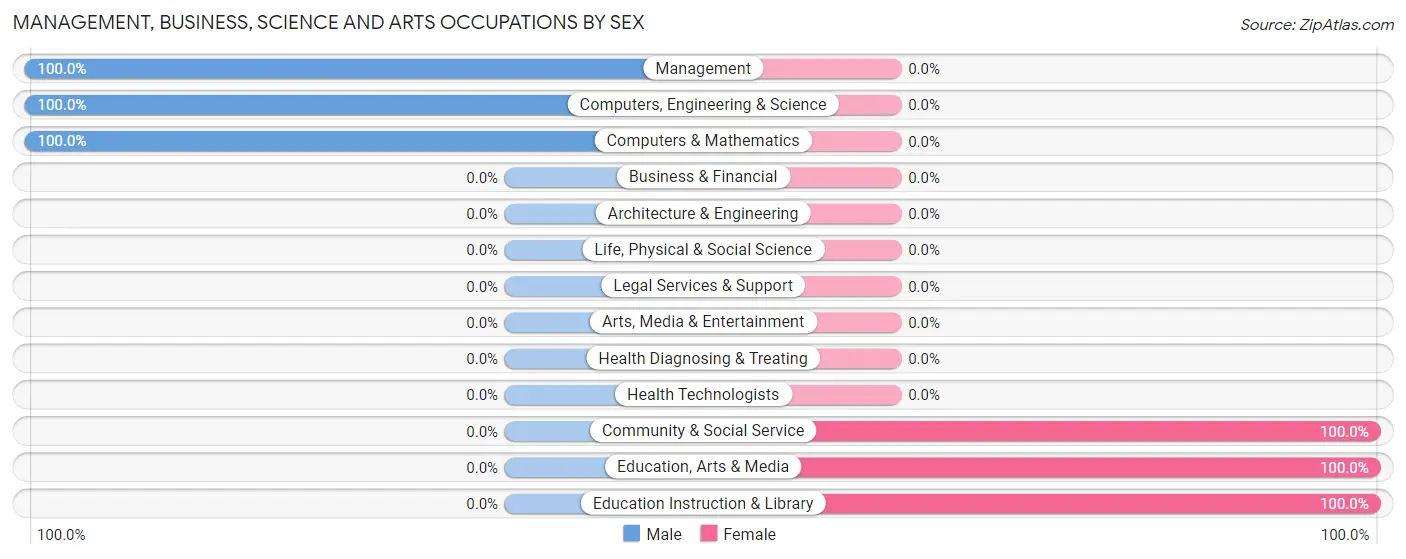
The most common Management, Business, Science and Arts occupations in Aspers are Community & Social Service (21 | 14.9%), Computers, Engineering & Science (13 | 9.2%), Computers & Mathematics (13 | 9.2%), Management (11 | 7.8%), and Education, Arts & Media (11 | 7.8%).
Management, Business, Science and Arts Occupations by Sex
Within the Management, Business, Science and Arts occupations in Aspers, the most male-oriented occupations are Management (100.0%), Computers, Engineering & Science (100.0%), and Computers & Mathematics (100.0%), while the most female-oriented occupations are Community & Social Service (100.0%), Education, Arts & Media (100.0%), and Education Instruction & Library (100.0%).
| Occupation | Male | Female |
| Management | 11 (100.0%) | 0 (0.0%) |
| Business & Financial | 0 (0.0%) | 0 (0.0%) |
| Computers, Engineering & Science | 13 (100.0%) | 0 (0.0%) |
| Computers & Mathematics | 13 (100.0%) | 0 (0.0%) |
| Architecture & Engineering | 0 (0.0%) | 0 (0.0%) |
| Life, Physical & Social Science | 0 (0.0%) | 0 (0.0%) |
| Community & Social Service | 0 (0.0%) | 21 (100.0%) |
| Education, Arts & Media | 0 (0.0%) | 11 (100.0%) |
| Legal Services & Support | 0 (0.0%) | 0 (0.0%) |
| Education Instruction & Library | 0 (0.0%) | 10 (100.0%) |
| Arts, Media & Entertainment | 0 (0.0%) | 0 (0.0%) |
| Health Diagnosing & Treating | 0 (0.0%) | 0 (0.0%) |
| Health Technologists | 0 (0.0%) | 0 (0.0%) |
| Total (Category) | 24 (53.3%) | 21 (46.7%) |
| Total (Overall) | 64 (45.4%) | 77 (54.6%) |
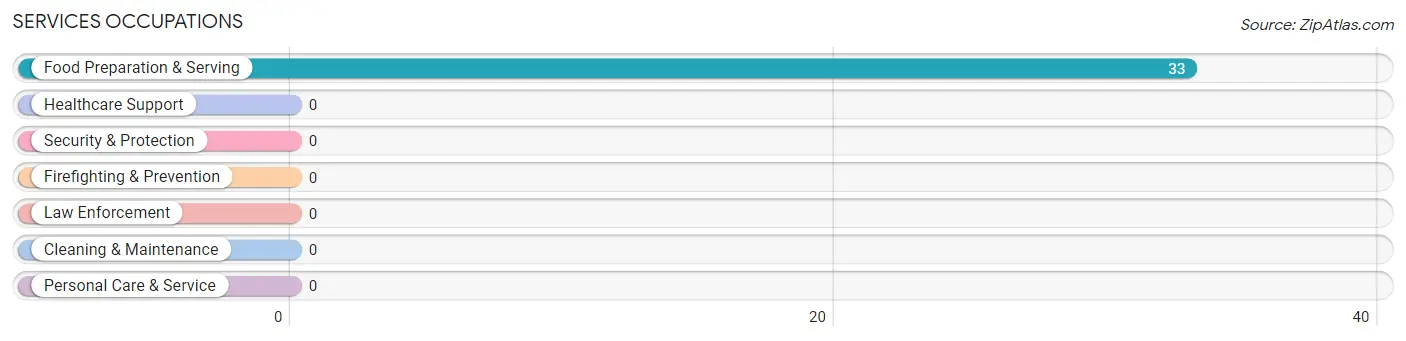
Services Occupations
The most common Services occupations in Aspers are , and Food Preparation & Serving (33 | 23.4%).
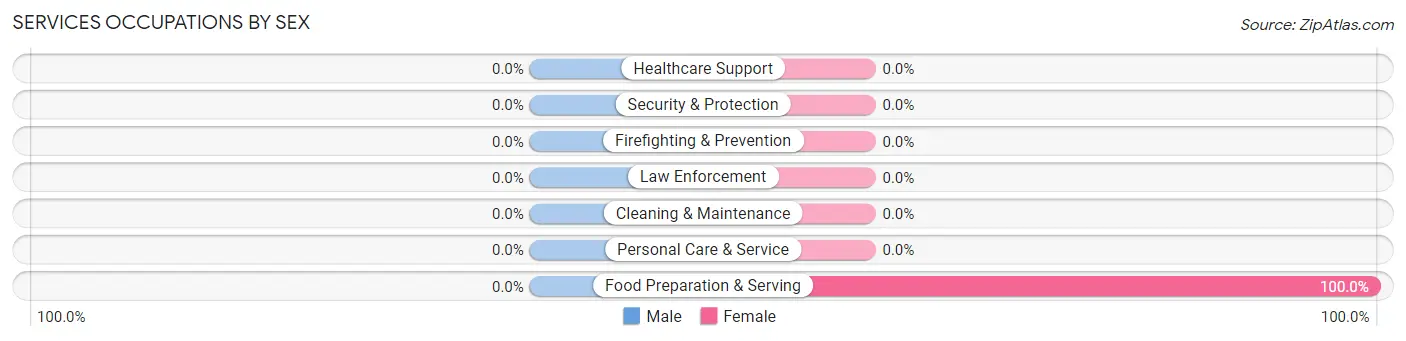
Services Occupations by Sex
| Occupation | Male | Female |
| Healthcare Support | 0 (0.0%) | 0 (0.0%) |
| Security & Protection | 0 (0.0%) | 0 (0.0%) |
| Firefighting & Prevention | 0 (0.0%) | 0 (0.0%) |
| Law Enforcement | 0 (0.0%) | 0 (0.0%) |
| Food Preparation & Serving | 0 (0.0%) | 33 (100.0%) |
| Cleaning & Maintenance | 0 (0.0%) | 0 (0.0%) |
| Personal Care & Service | 0 (0.0%) | 0 (0.0%) |
| Total (Category) | 0 (0.0%) | 33 (100.0%) |
| Total (Overall) | 64 (45.4%) | 77 (54.6%) |
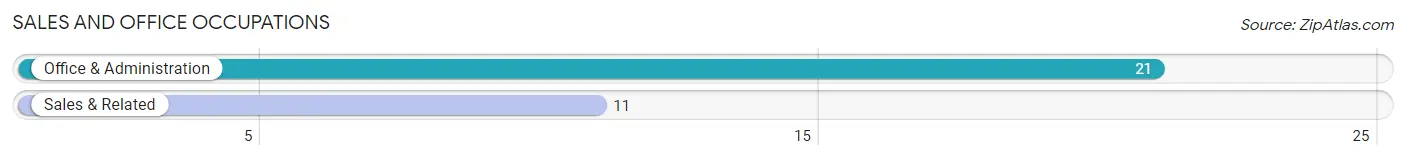
Sales and Office Occupations
The most common Sales and Office occupations in Aspers are Office & Administration (21 | 14.9%), and Sales & Related (11 | 7.8%).
Sales and Office Occupations by Sex
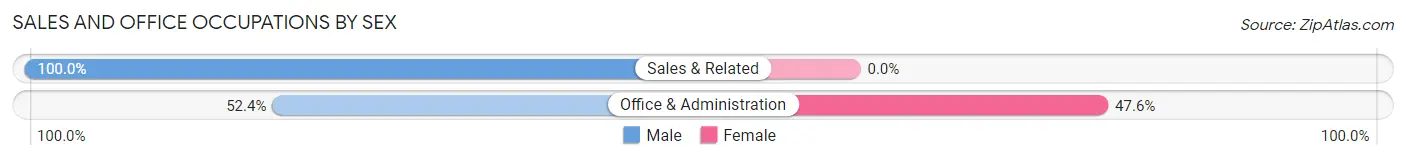
| Occupation | Male | Female |
| Sales & Related | 11 (100.0%) | 0 (0.0%) |
| Office & Administration | 11 (52.4%) | 10 (47.6%) |
| Total (Category) | 22 (68.8%) | 10 (31.2%) |
| Total (Overall) | 64 (45.4%) | 77 (54.6%) |
Natural Resources, Construction and Maintenance Occupations
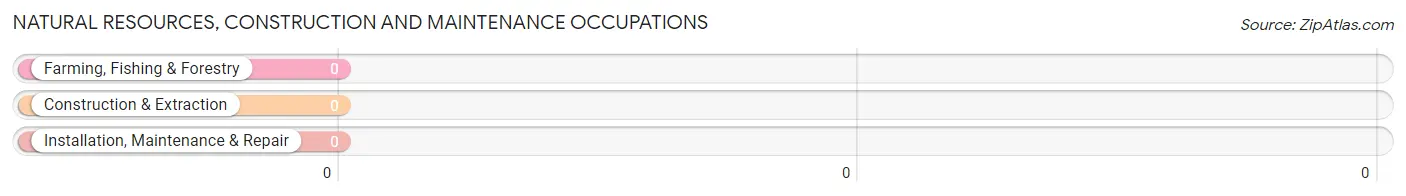
Natural Resources, Construction and Maintenance Occupations by Sex
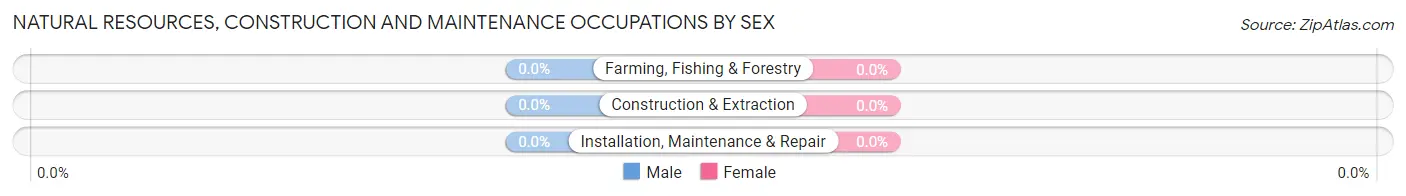
| Occupation | Male | Female |
| Farming, Fishing & Forestry | 0 (0.0%) | 0 (0.0%) |
| Construction & Extraction | 0 (0.0%) | 0 (0.0%) |
| Installation, Maintenance & Repair | 0 (0.0%) | 0 (0.0%) |
| Total (Category) | 0 (0.0%) | 0 (0.0%) |
| Total (Overall) | 64 (45.4%) | 77 (54.6%) |
Production, Transportation and Moving Occupations
The most common Production, Transportation and Moving occupations in Aspers are Material Moving (19 | 13.5%), Production (6 | 4.3%), and Transportation (6 | 4.3%).
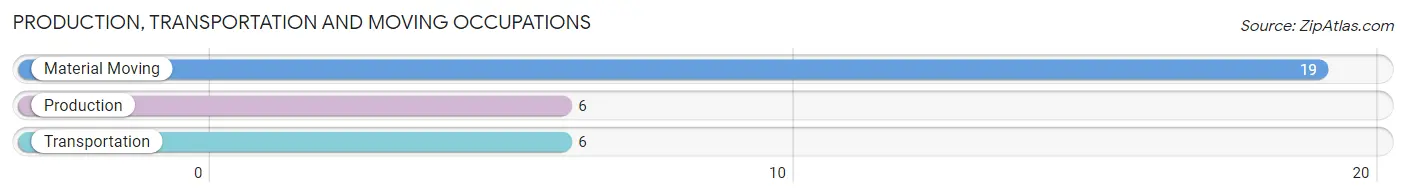
Production, Transportation and Moving Occupations by Sex
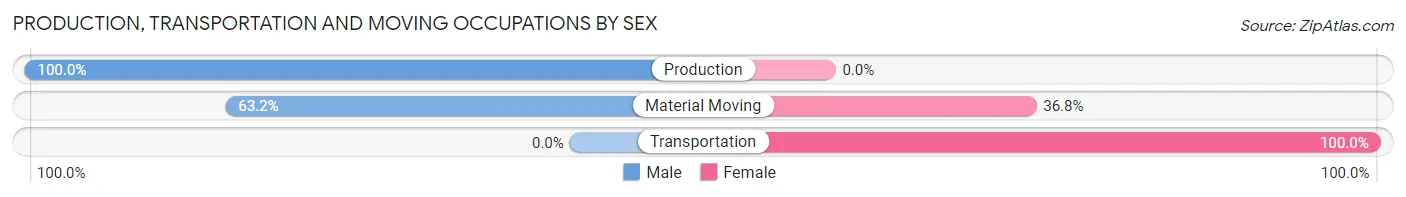
| Occupation | Male | Female |
| Production | 6 (100.0%) | 0 (0.0%) |
| Transportation | 0 (0.0%) | 6 (100.0%) |
| Material Moving | 12 (63.2%) | 7 (36.8%) |
| Total (Category) | 18 (58.1%) | 13 (41.9%) |
| Total (Overall) | 64 (45.4%) | 77 (54.6%) |
Employment Industries by Sex in Aspers
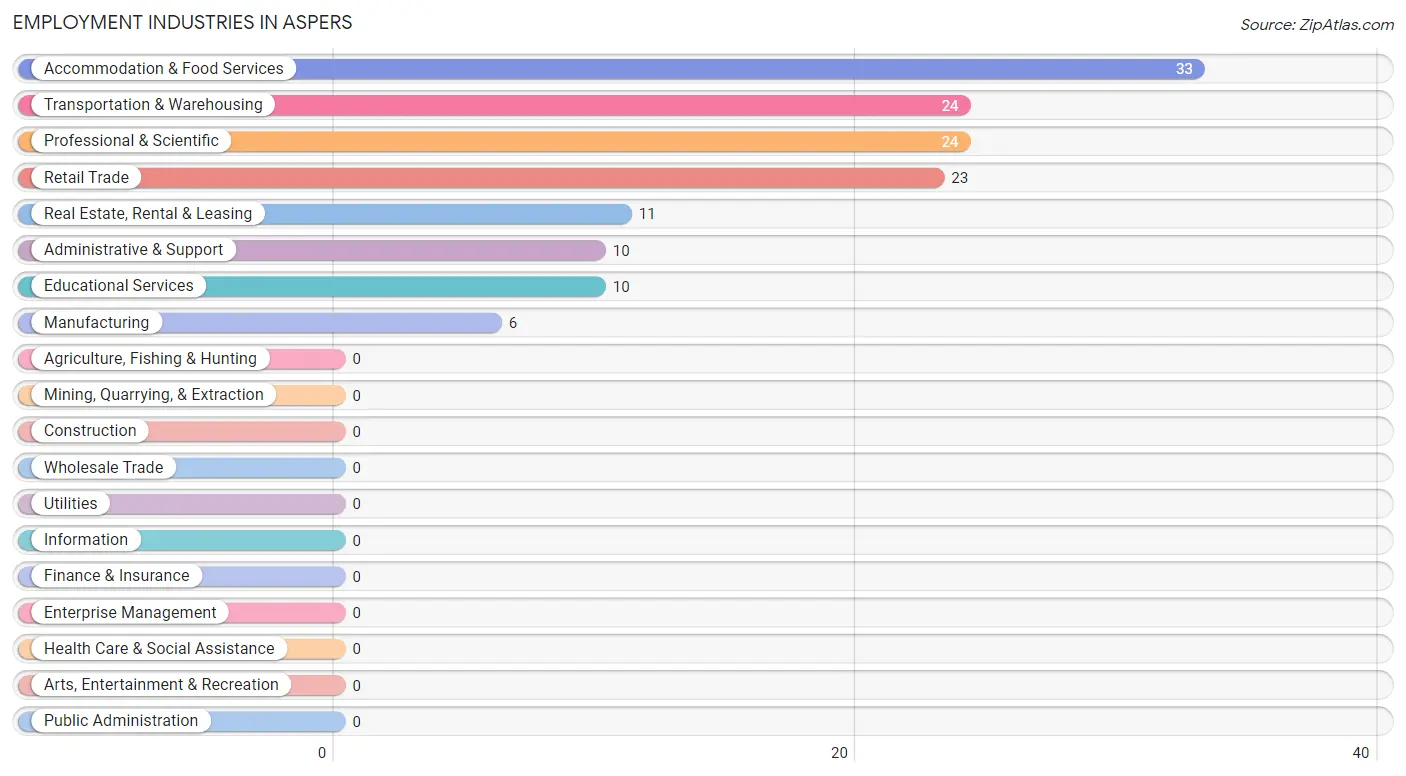
Employment Industries in Aspers
The major employment industries in Aspers include Accommodation & Food Services (33 | 23.4%), Transportation & Warehousing (24 | 17.0%), Professional & Scientific (24 | 17.0%), Retail Trade (23 | 16.3%), and Real Estate, Rental & Leasing (11 | 7.8%).
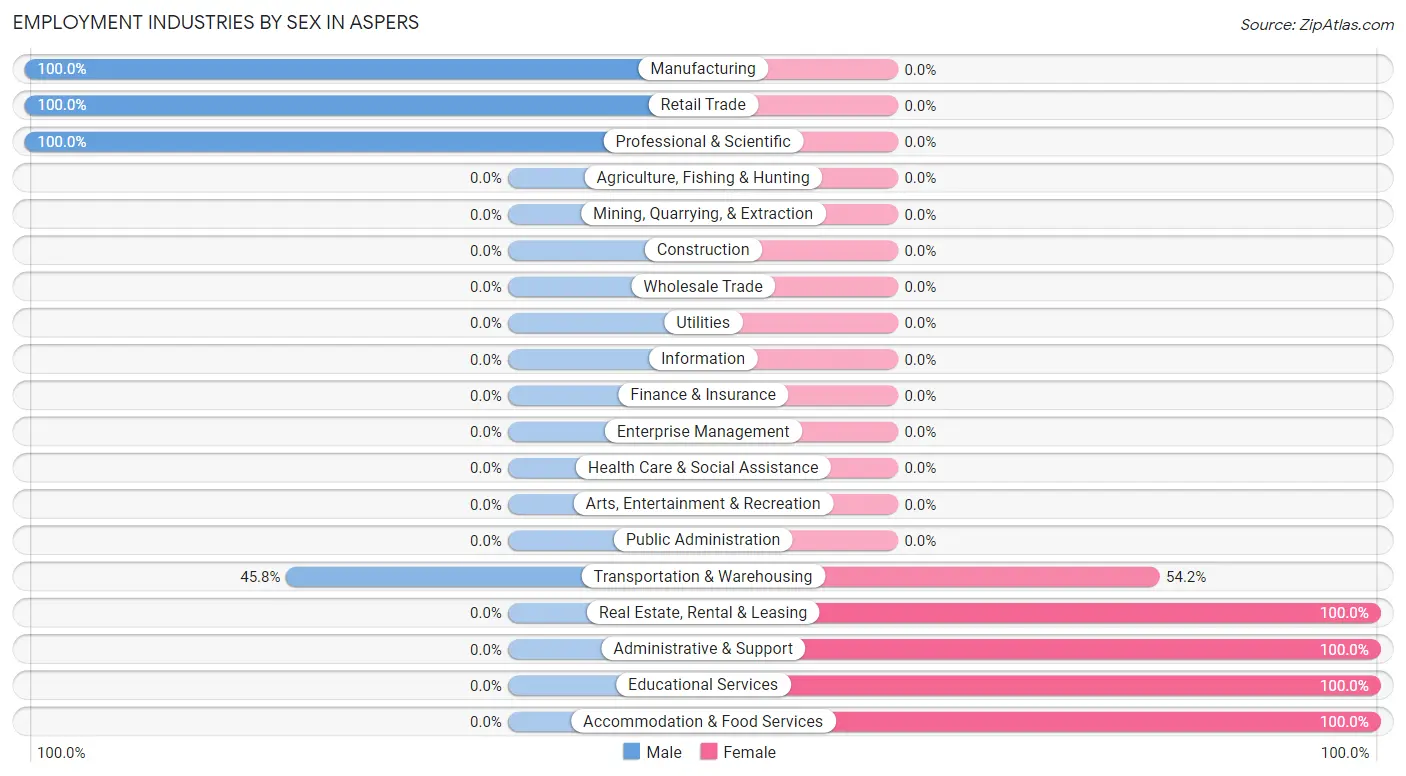
Employment Industries by Sex in Aspers
The Aspers industries that see more men than women are Manufacturing (100.0%), Retail Trade (100.0%), and Professional & Scientific (100.0%), whereas the industries that tend to have a higher number of women are Real Estate, Rental & Leasing (100.0%), Administrative & Support (100.0%), and Educational Services (100.0%).
| Industry | Male | Female |
| Agriculture, Fishing & Hunting | 0 (0.0%) | 0 (0.0%) |
| Mining, Quarrying, & Extraction | 0 (0.0%) | 0 (0.0%) |
| Construction | 0 (0.0%) | 0 (0.0%) |
| Manufacturing | 6 (100.0%) | 0 (0.0%) |
| Wholesale Trade | 0 (0.0%) | 0 (0.0%) |
| Retail Trade | 23 (100.0%) | 0 (0.0%) |
| Transportation & Warehousing | 11 (45.8%) | 13 (54.2%) |
| Utilities | 0 (0.0%) | 0 (0.0%) |
| Information | 0 (0.0%) | 0 (0.0%) |
| Finance & Insurance | 0 (0.0%) | 0 (0.0%) |
| Real Estate, Rental & Leasing | 0 (0.0%) | 11 (100.0%) |
| Professional & Scientific | 24 (100.0%) | 0 (0.0%) |
| Enterprise Management | 0 (0.0%) | 0 (0.0%) |
| Administrative & Support | 0 (0.0%) | 10 (100.0%) |
| Educational Services | 0 (0.0%) | 10 (100.0%) |
| Health Care & Social Assistance | 0 (0.0%) | 0 (0.0%) |
| Arts, Entertainment & Recreation | 0 (0.0%) | 0 (0.0%) |
| Accommodation & Food Services | 0 (0.0%) | 33 (100.0%) |
| Public Administration | 0 (0.0%) | 0 (0.0%) |
| Total | 64 (45.4%) | 77 (54.6%) |
Education in Aspers
School Enrollment in Aspers
| School Level | # Students | % Students |
| Nursery / Preschool | 0 | 0.0% |
| Kindergarten | 0 | 0.0% |
| Elementary School | 0 | 0.0% |
| Middle School | 0 | 0.0% |
| High School | 0 | 0.0% |
| College / Undergraduate | 0 | 0.0% |
| Graduate / Professional | 0 | 0.0% |
| Total | 0 | 0.0% |
School Enrollment by Age by Funding Source in Aspers
| Age Bracket | Public School | Private School |
| 3 to 4 Year Olds | 0 (0.0%) | 0 (0.0%) |
| 5 to 9 Year Old | 0 (0.0%) | 0 (0.0%) |
| 10 to 14 Year Olds | 0 (0.0%) | 0 (0.0%) |
| 15 to 17 Year Olds | 0 (0.0%) | 0 (0.0%) |
| 18 to 19 Year Olds | 0 (0.0%) | 0 (0.0%) |
| 20 to 24 Year Olds | 0 (0.0%) | 0 (0.0%) |
| 25 to 34 Year Olds | 0 (0.0%) | 0 (0.0%) |
| 35 Years and over | 0 (0.0%) | 0 (0.0%) |
| Total | 0 (0.0%) | 0 (0.0%) |
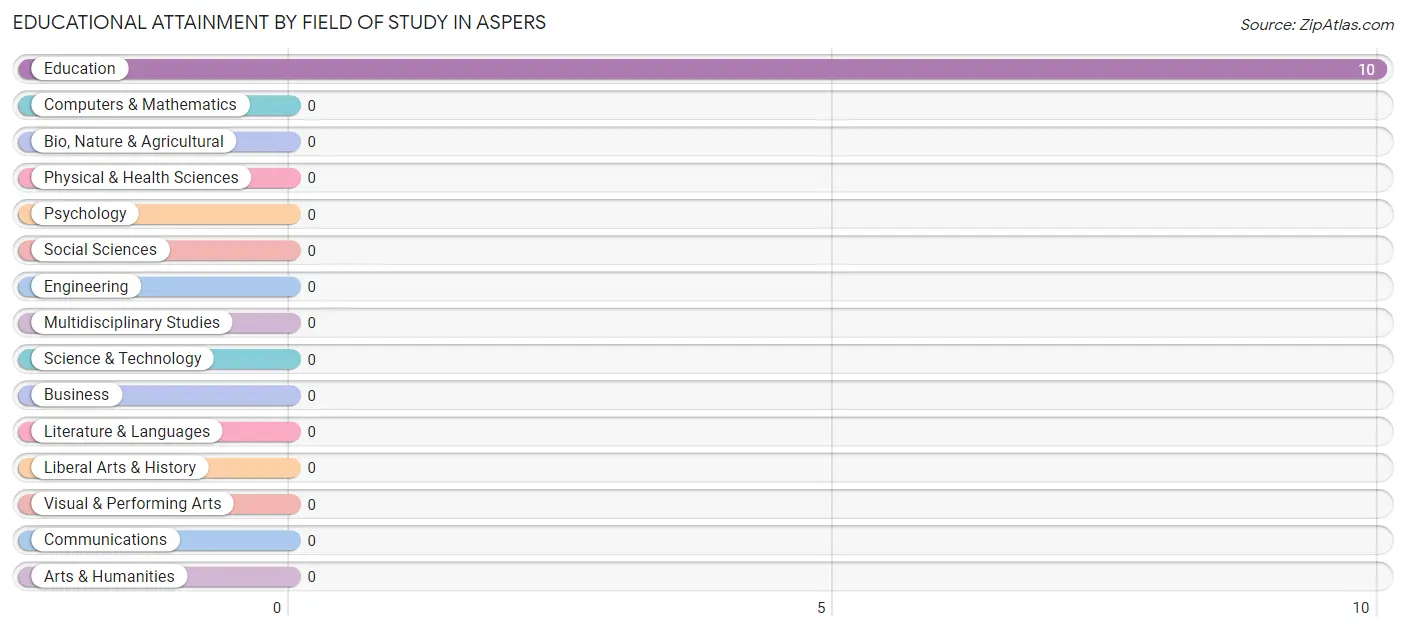
Educational Attainment by Field of Study in Aspers
, and education (10 | 100.0%) are the most common fields of study among 10 individuals in Aspers who have obtained a bachelor's degree or higher.
| Field of Study | # Graduates | % Graduates |
| Computers & Mathematics | 0 | 0.0% |
| Bio, Nature & Agricultural | 0 | 0.0% |
| Physical & Health Sciences | 0 | 0.0% |
| Psychology | 0 | 0.0% |
| Social Sciences | 0 | 0.0% |
| Engineering | 0 | 0.0% |
| Multidisciplinary Studies | 0 | 0.0% |
| Science & Technology | 0 | 0.0% |
| Business | 0 | 0.0% |
| Education | 10 | 100.0% |
| Literature & Languages | 0 | 0.0% |
| Liberal Arts & History | 0 | 0.0% |
| Visual & Performing Arts | 0 | 0.0% |
| Communications | 0 | 0.0% |
| Arts & Humanities | 0 | 0.0% |
| Total | 10 | 100.0% |
Transportation & Commute in Aspers
Vehicle Availability by Sex in Aspers
The most prevalent vehicle ownership categories in Aspers are males with 3 vehicles (24, accounting for 37.5%) and females with 3 vehicles (50, making up 31.2%).
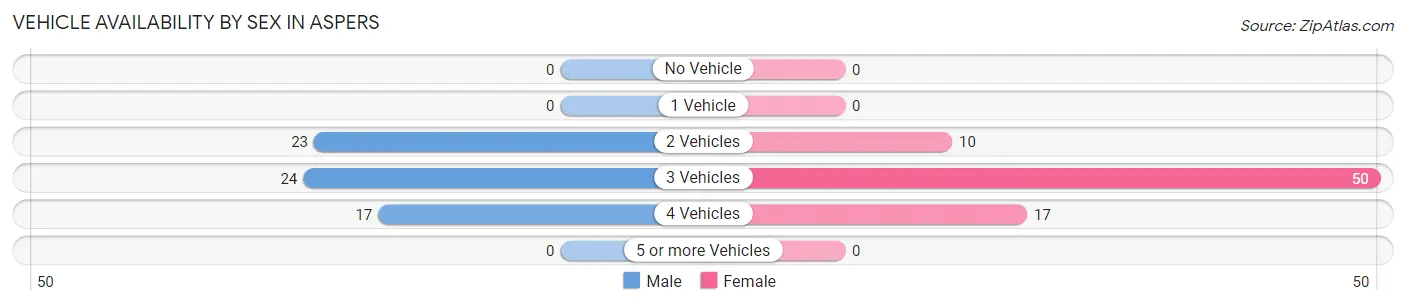
| Vehicles Available | Male | Female |
| No Vehicle | 0 (0.0%) | 0 (0.0%) |
| 1 Vehicle | 0 (0.0%) | 0 (0.0%) |
| 2 Vehicles | 23 (35.9%) | 10 (13.0%) |
| 3 Vehicles | 24 (37.5%) | 50 (64.9%) |
| 4 Vehicles | 17 (26.6%) | 17 (22.1%) |
| 5 or more Vehicles | 0 (0.0%) | 0 (0.0%) |
| Total | 64 (100.0%) | 77 (100.0%) |
Commute Time in Aspers
The most frequently occuring commute durations in Aspers are 30 to 34 minutes (33 commuters, 25.8%), 90 or more minutes (22 commuters, 17.2%), and 5 to 9 minutes (13 commuters, 10.2%).
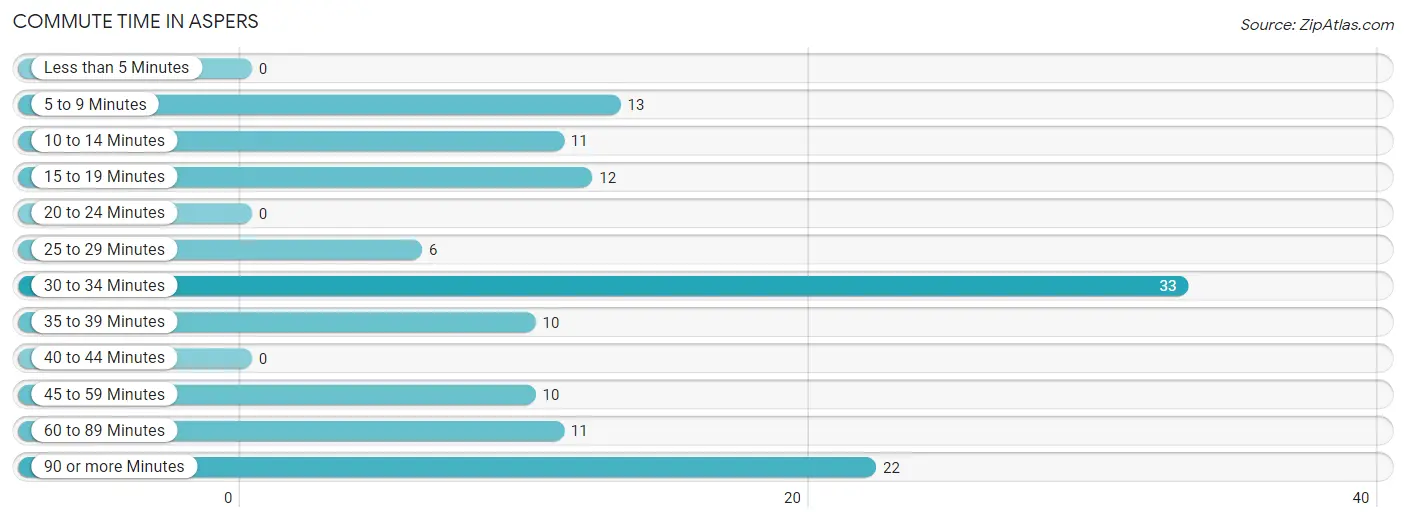
| Commute Time | # Commuters | % Commuters |
| Less than 5 Minutes | 0 | 0.0% |
| 5 to 9 Minutes | 13 | 10.2% |
| 10 to 14 Minutes | 11 | 8.6% |
| 15 to 19 Minutes | 12 | 9.4% |
| 20 to 24 Minutes | 0 | 0.0% |
| 25 to 29 Minutes | 6 | 4.7% |
| 30 to 34 Minutes | 33 | 25.8% |
| 35 to 39 Minutes | 10 | 7.8% |
| 40 to 44 Minutes | 0 | 0.0% |
| 45 to 59 Minutes | 10 | 7.8% |
| 60 to 89 Minutes | 11 | 8.6% |
| 90 or more Minutes | 22 | 17.2% |
Commute Time by Sex in Aspers
The most common commute times in Aspers are 15 to 19 minutes (12 commuters, 23.5%) for males and 30 to 34 minutes (33 commuters, 42.9%) for females.
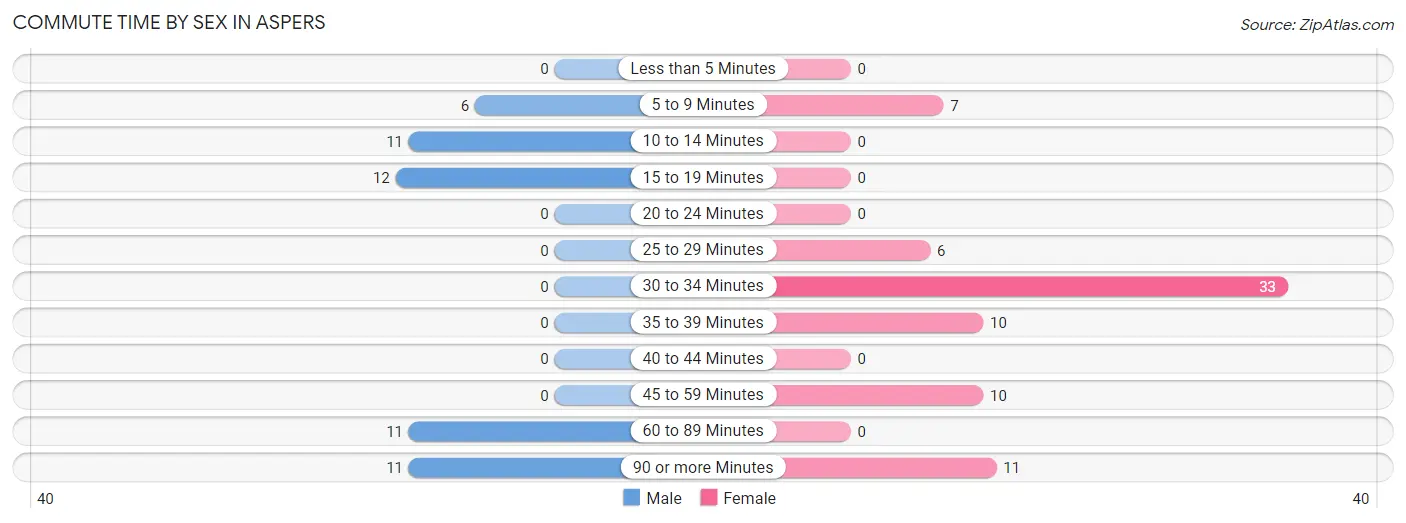
| Commute Time | Male | Female |
| Less than 5 Minutes | 0 (0.0%) | 0 (0.0%) |
| 5 to 9 Minutes | 6 (11.8%) | 7 (9.1%) |
| 10 to 14 Minutes | 11 (21.6%) | 0 (0.0%) |
| 15 to 19 Minutes | 12 (23.5%) | 0 (0.0%) |
| 20 to 24 Minutes | 0 (0.0%) | 0 (0.0%) |
| 25 to 29 Minutes | 0 (0.0%) | 6 (7.8%) |
| 30 to 34 Minutes | 0 (0.0%) | 33 (42.9%) |
| 35 to 39 Minutes | 0 (0.0%) | 10 (13.0%) |
| 40 to 44 Minutes | 0 (0.0%) | 0 (0.0%) |
| 45 to 59 Minutes | 0 (0.0%) | 10 (13.0%) |
| 60 to 89 Minutes | 11 (21.6%) | 0 (0.0%) |
| 90 or more Minutes | 11 (21.6%) | 11 (14.3%) |
Time of Departure to Work by Sex in Aspers
The most frequent times of departure to work in Aspers are 7:00 AM to 7:29 AM (12, 23.5%) for males and 12:00 PM to 3:59 PM (33, 42.9%) for females.
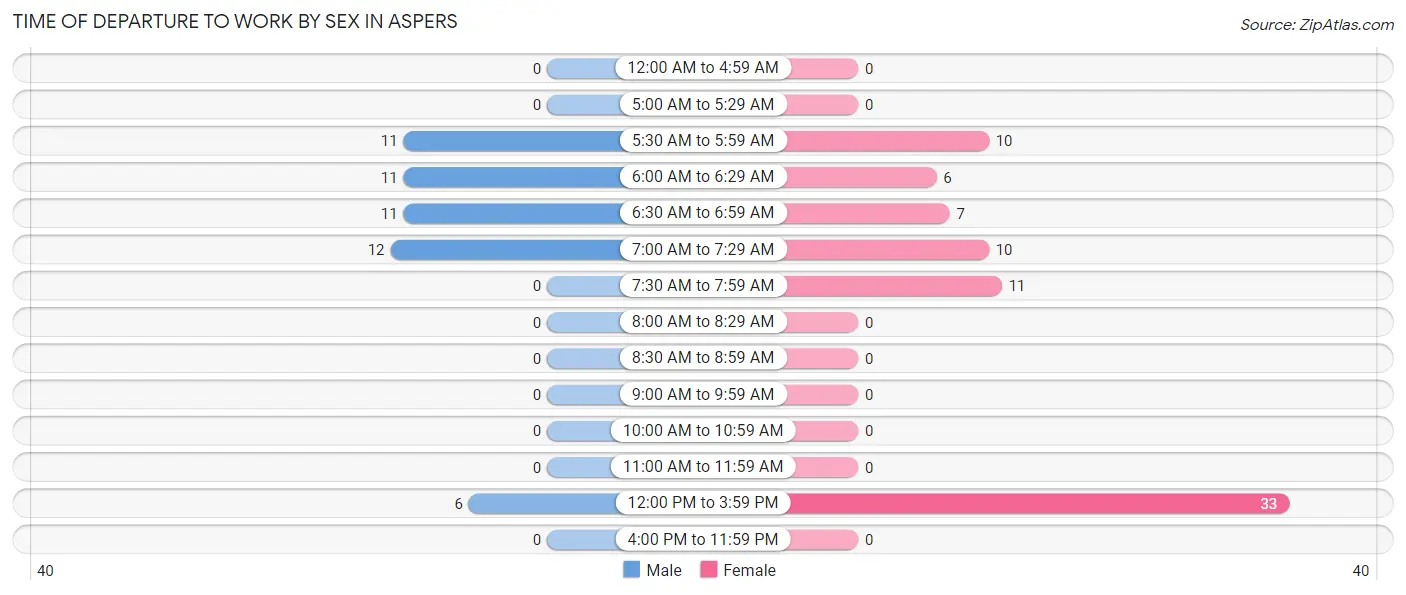
| Time of Departure | Male | Female |
| 12:00 AM to 4:59 AM | 0 (0.0%) | 0 (0.0%) |
| 5:00 AM to 5:29 AM | 0 (0.0%) | 0 (0.0%) |
| 5:30 AM to 5:59 AM | 11 (21.6%) | 10 (13.0%) |
| 6:00 AM to 6:29 AM | 11 (21.6%) | 6 (7.8%) |
| 6:30 AM to 6:59 AM | 11 (21.6%) | 7 (9.1%) |
| 7:00 AM to 7:29 AM | 12 (23.5%) | 10 (13.0%) |
| 7:30 AM to 7:59 AM | 0 (0.0%) | 11 (14.3%) |
| 8:00 AM to 8:29 AM | 0 (0.0%) | 0 (0.0%) |
| 8:30 AM to 8:59 AM | 0 (0.0%) | 0 (0.0%) |
| 9:00 AM to 9:59 AM | 0 (0.0%) | 0 (0.0%) |
| 10:00 AM to 10:59 AM | 0 (0.0%) | 0 (0.0%) |
| 11:00 AM to 11:59 AM | 0 (0.0%) | 0 (0.0%) |
| 12:00 PM to 3:59 PM | 6 (11.8%) | 33 (42.9%) |
| 4:00 PM to 11:59 PM | 0 (0.0%) | 0 (0.0%) |
| Total | 51 (100.0%) | 77 (100.0%) |
Housing Occupancy in Aspers
Occupancy by Ownership in Aspers
Of the total 82 dwellings in Aspers, owner-occupied units account for 80 (97.6%), while renter-occupied units make up 2 (2.4%).
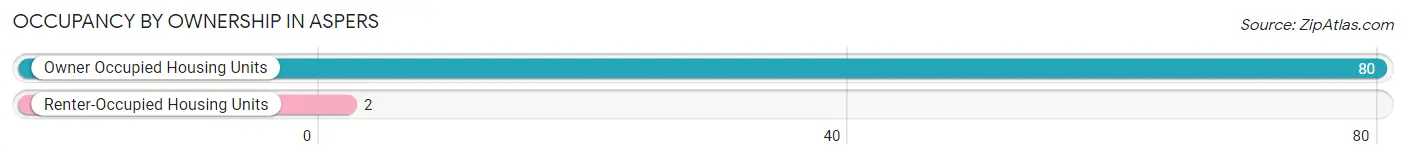
| Occupancy | # Housing Units | % Housing Units |
| Owner Occupied Housing Units | 80 | 97.6% |
| Renter-Occupied Housing Units | 2 | 2.4% |
| Total Occupied Housing Units | 82 | 100.0% |
Occupancy by Household Size in Aspers
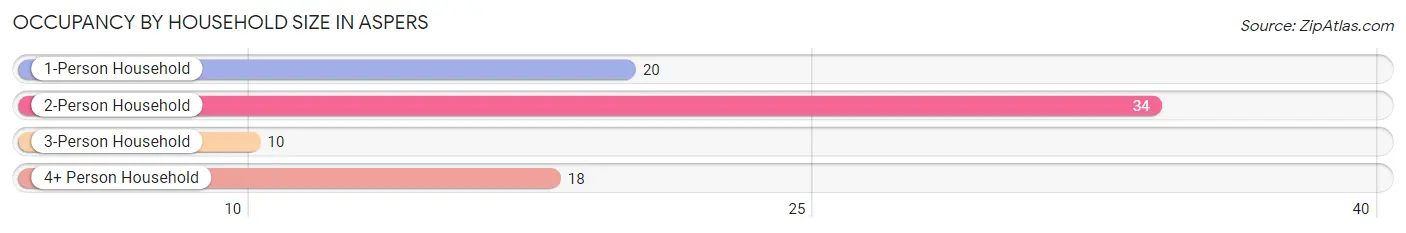
| Household Size | # Housing Units | % Housing Units |
| 1-Person Household | 20 | 24.4% |
| 2-Person Household | 34 | 41.5% |
| 3-Person Household | 10 | 12.2% |
| 4+ Person Household | 18 | 22.0% |
| Total Housing Units | 82 | 100.0% |
Occupancy by Ownership by Household Size in Aspers
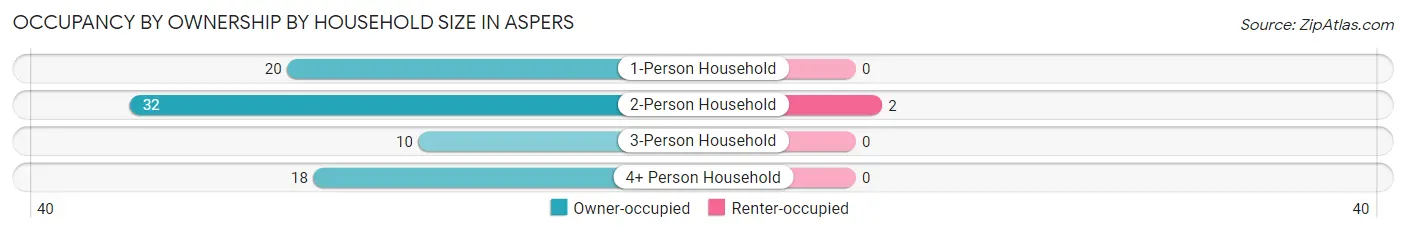
| Household Size | Owner-occupied | Renter-occupied |
| 1-Person Household | 20 (100.0%) | 0 (0.0%) |
| 2-Person Household | 32 (94.1%) | 2 (5.9%) |
| 3-Person Household | 10 (100.0%) | 0 (0.0%) |
| 4+ Person Household | 18 (100.0%) | 0 (0.0%) |
| Total Housing Units | 80 (97.6%) | 2 (2.4%) |
Occupancy by Educational Attainment in Aspers
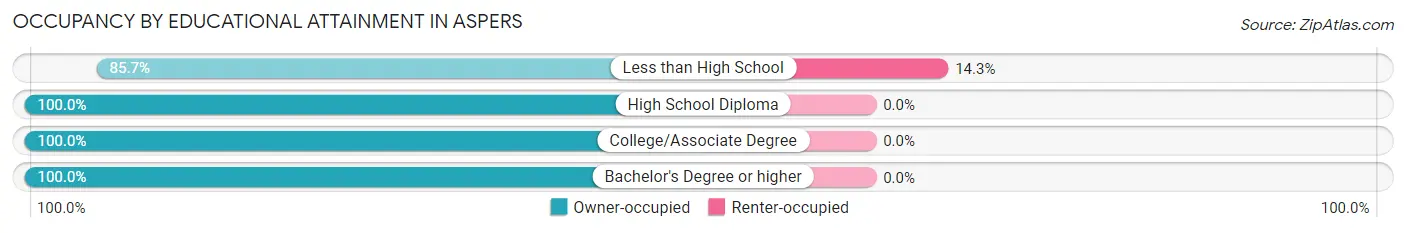
| Household Size | Owner-occupied | Renter-occupied |
| Less than High School | 12 (85.7%) | 2 (14.3%) |
| High School Diploma | 26 (100.0%) | 0 (0.0%) |
| College/Associate Degree | 32 (100.0%) | 0 (0.0%) |
| Bachelor's Degree or higher | 10 (100.0%) | 0 (0.0%) |
Occupancy by Age of Householder in Aspers
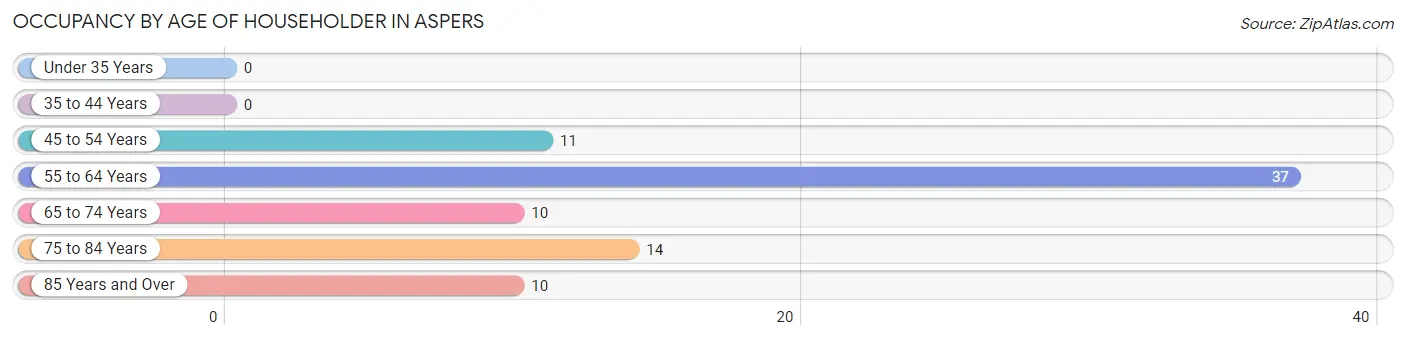
| Age Bracket | # Households | % Households |
| Under 35 Years | 0 | 0.0% |
| 35 to 44 Years | 0 | 0.0% |
| 45 to 54 Years | 11 | 13.4% |
| 55 to 64 Years | 37 | 45.1% |
| 65 to 74 Years | 10 | 12.2% |
| 75 to 84 Years | 14 | 17.1% |
| 85 Years and Over | 10 | 12.2% |
| Total | 82 | 100.0% |
Housing Finances in Aspers
Median Income by Occupancy in Aspers
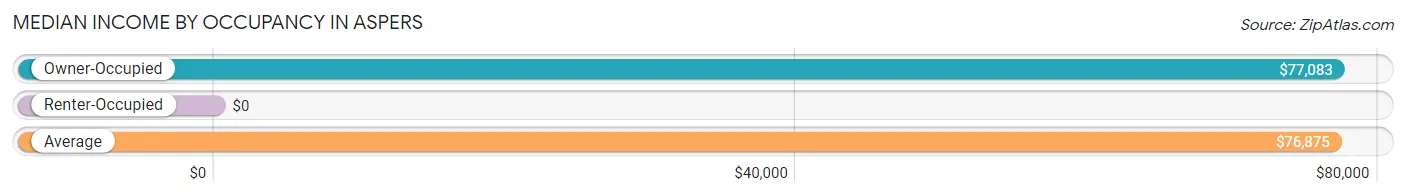
| Occupancy Type | # Households | Median Income |
| Owner-Occupied | 80 (97.6%) | $77,083 |
| Renter-Occupied | 2 (2.4%) | $0 |
| Average | 82 (100.0%) | $76,875 |
Occupancy by Householder Income Bracket in Aspers
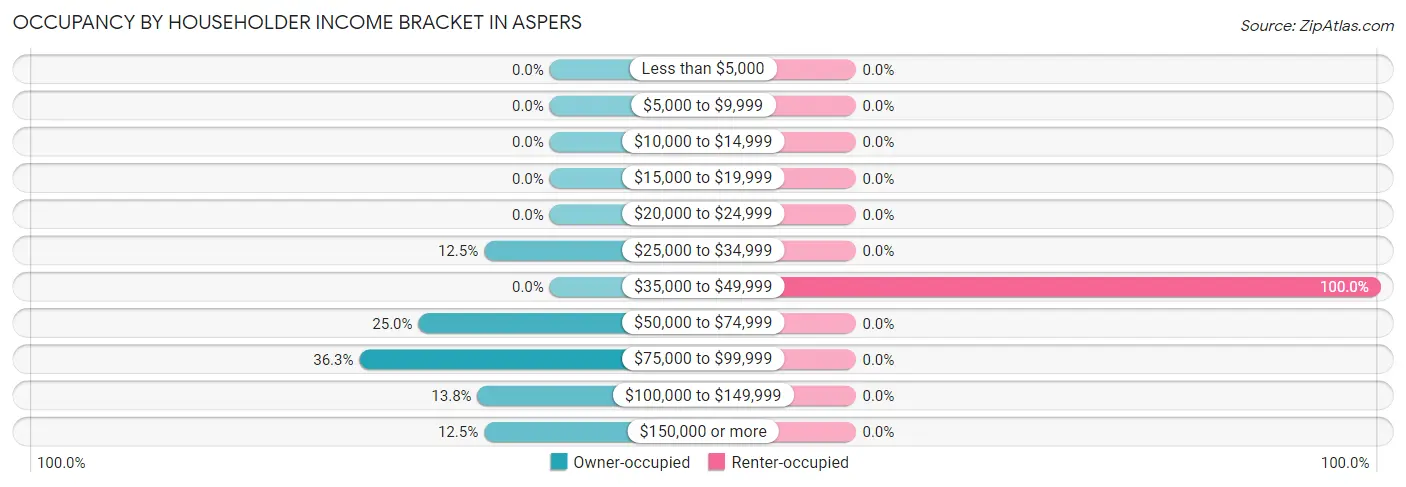
| Income Bracket | Owner-occupied | Renter-occupied |
| Less than $5,000 | 0 (0.0%) | 0 (0.0%) |
| $5,000 to $9,999 | 0 (0.0%) | 0 (0.0%) |
| $10,000 to $14,999 | 0 (0.0%) | 0 (0.0%) |
| $15,000 to $19,999 | 0 (0.0%) | 0 (0.0%) |
| $20,000 to $24,999 | 0 (0.0%) | 0 (0.0%) |
| $25,000 to $34,999 | 10 (12.5%) | 0 (0.0%) |
| $35,000 to $49,999 | 0 (0.0%) | 2 (100.0%) |
| $50,000 to $74,999 | 20 (25.0%) | 0 (0.0%) |
| $75,000 to $99,999 | 29 (36.2%) | 0 (0.0%) |
| $100,000 to $149,999 | 11 (13.8%) | 0 (0.0%) |
| $150,000 or more | 10 (12.5%) | 0 (0.0%) |
| Total | 80 (100.0%) | 2 (100.0%) |
Monthly Housing Cost Tiers in Aspers
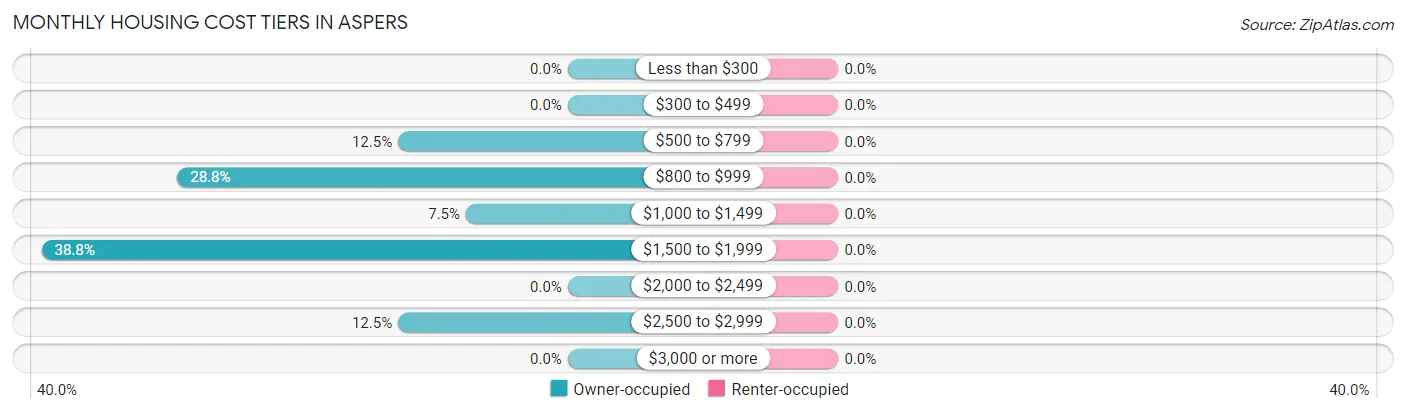
| Monthly Cost | Owner-occupied | Renter-occupied |
| Less than $300 | 0 (0.0%) | 0 (0.0%) |
| $300 to $499 | 0 (0.0%) | 0 (0.0%) |
| $500 to $799 | 10 (12.5%) | 0 (0.0%) |
| $800 to $999 | 23 (28.7%) | 0 (0.0%) |
| $1,000 to $1,499 | 6 (7.5%) | 0 (0.0%) |
| $1,500 to $1,999 | 31 (38.8%) | 0 (0.0%) |
| $2,000 to $2,499 | 0 (0.0%) | 0 (0.0%) |
| $2,500 to $2,999 | 10 (12.5%) | 0 (0.0%) |
| $3,000 or more | 0 (0.0%) | 0 (0.0%) |
| Total | 80 (100.0%) | 2 (100.0%) |
Physical Housing Characteristics in Aspers
Housing Structures in Aspers
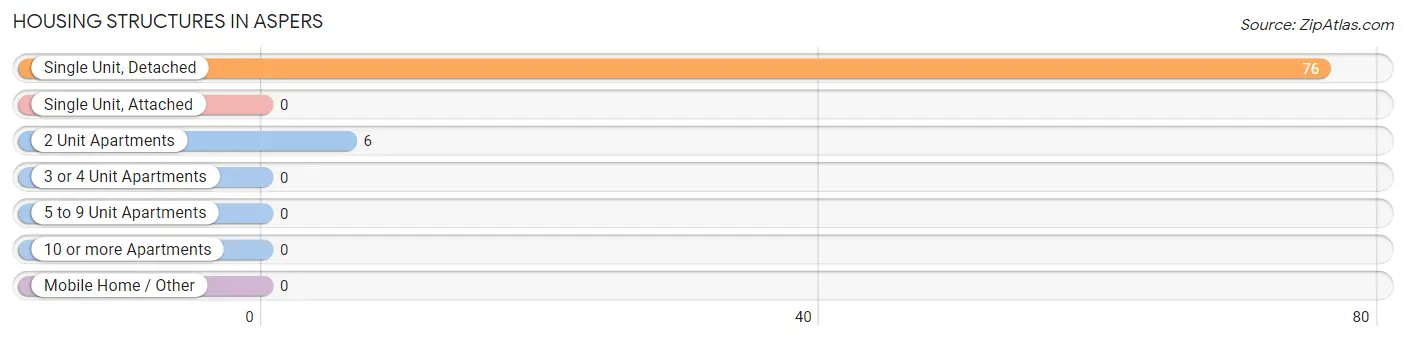
| Structure Type | # Housing Units | % Housing Units |
| Single Unit, Detached | 76 | 92.7% |
| Single Unit, Attached | 0 | 0.0% |
| 2 Unit Apartments | 6 | 7.3% |
| 3 or 4 Unit Apartments | 0 | 0.0% |
| 5 to 9 Unit Apartments | 0 | 0.0% |
| 10 or more Apartments | 0 | 0.0% |
| Mobile Home / Other | 0 | 0.0% |
| Total | 82 | 100.0% |
Housing Structures by Occupancy in Aspers
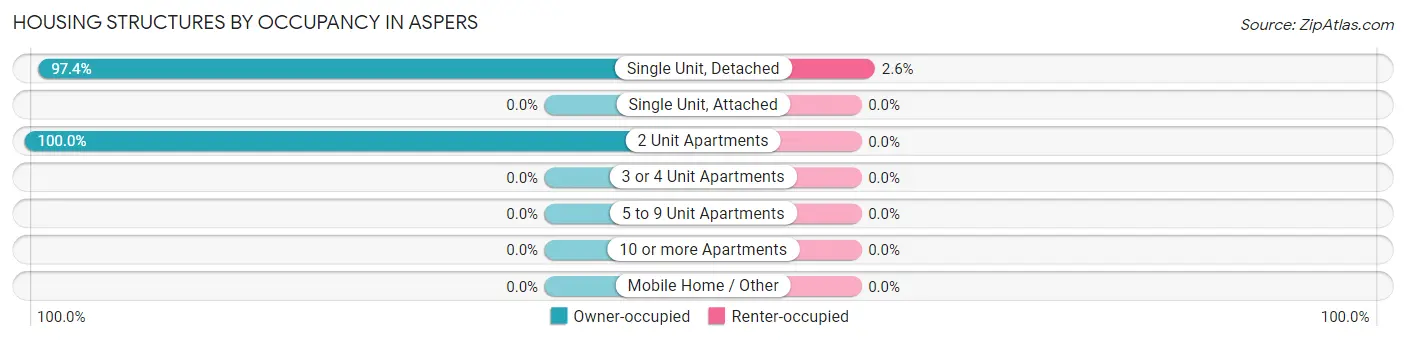
| Structure Type | Owner-occupied | Renter-occupied |
| Single Unit, Detached | 74 (97.4%) | 2 (2.6%) |
| Single Unit, Attached | 0 (0.0%) | 0 (0.0%) |
| 2 Unit Apartments | 6 (100.0%) | 0 (0.0%) |
| 3 or 4 Unit Apartments | 0 (0.0%) | 0 (0.0%) |
| 5 to 9 Unit Apartments | 0 (0.0%) | 0 (0.0%) |
| 10 or more Apartments | 0 (0.0%) | 0 (0.0%) |
| Mobile Home / Other | 0 (0.0%) | 0 (0.0%) |
| Total | 80 (97.6%) | 2 (2.4%) |
Housing Structures by Number of Rooms in Aspers
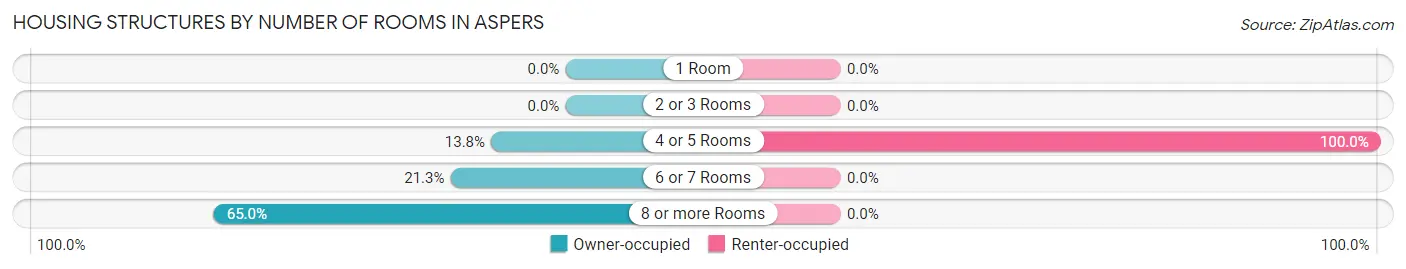
| Number of Rooms | Owner-occupied | Renter-occupied |
| 1 Room | 0 (0.0%) | 0 (0.0%) |
| 2 or 3 Rooms | 0 (0.0%) | 0 (0.0%) |
| 4 or 5 Rooms | 11 (13.8%) | 2 (100.0%) |
| 6 or 7 Rooms | 17 (21.2%) | 0 (0.0%) |
| 8 or more Rooms | 52 (65.0%) | 0 (0.0%) |
| Total | 80 (100.0%) | 2 (100.0%) |
Housing Structure by Heating Type in Aspers
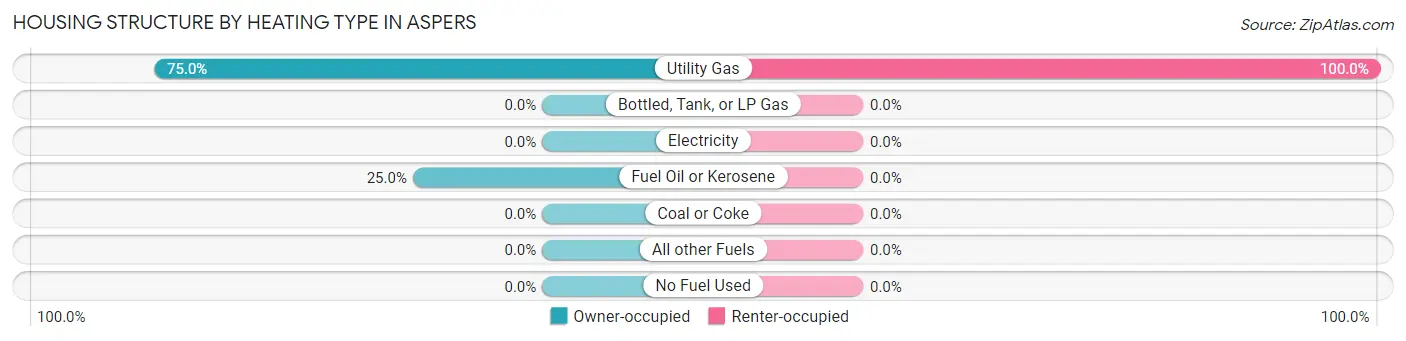
| Heating Type | Owner-occupied | Renter-occupied |
| Utility Gas | 60 (75.0%) | 2 (100.0%) |
| Bottled, Tank, or LP Gas | 0 (0.0%) | 0 (0.0%) |
| Electricity | 0 (0.0%) | 0 (0.0%) |
| Fuel Oil or Kerosene | 20 (25.0%) | 0 (0.0%) |
| Coal or Coke | 0 (0.0%) | 0 (0.0%) |
| All other Fuels | 0 (0.0%) | 0 (0.0%) |
| No Fuel Used | 0 (0.0%) | 0 (0.0%) |
| Total | 80 (100.0%) | 2 (100.0%) |
Household Vehicle Usage in Aspers
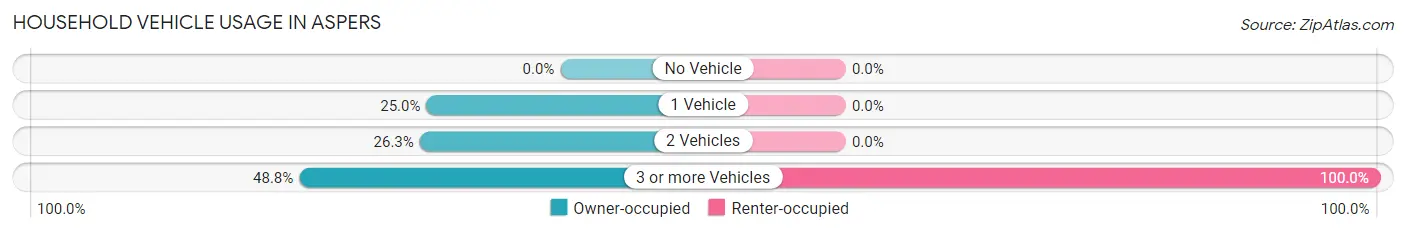
| Vehicles per Household | Owner-occupied | Renter-occupied |
| No Vehicle | 0 (0.0%) | 0 (0.0%) |
| 1 Vehicle | 20 (25.0%) | 0 (0.0%) |
| 2 Vehicles | 21 (26.3%) | 0 (0.0%) |
| 3 or more Vehicles | 39 (48.7%) | 2 (100.0%) |
| Total | 80 (100.0%) | 2 (100.0%) |
Real Estate & Mortgages in Aspers
Real Estate and Mortgage Overview in Aspers
| Characteristic | Without Mortgage | With Mortgage |
| Housing Units | 29 | 51 |
| Median Property Value | - | - |
| Median Household Income | $86,042 | $10 |
| Monthly Housing Costs | $863 | $0 |
| Real Estate Taxes | - | - |
Property Value by Mortgage Status in Aspers
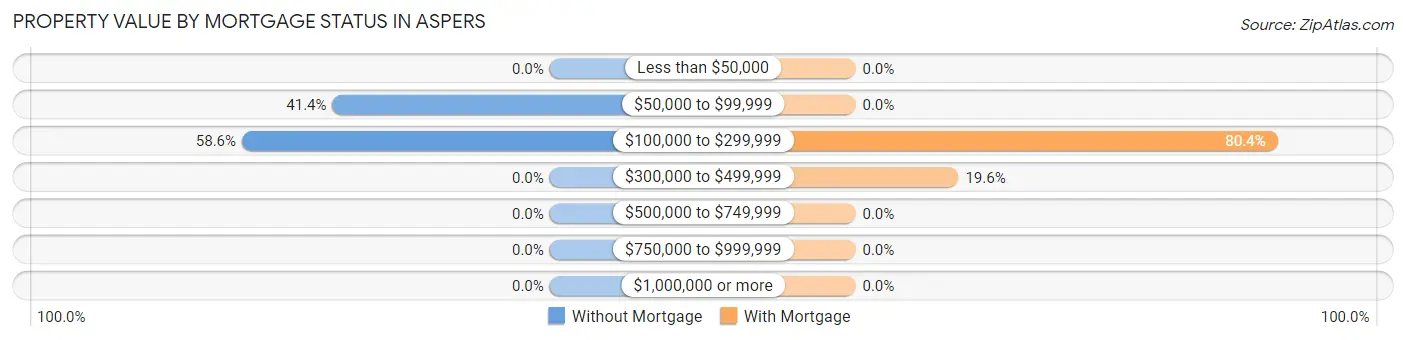
| Property Value | Without Mortgage | With Mortgage |
| Less than $50,000 | 0 (0.0%) | 0 (0.0%) |
| $50,000 to $99,999 | 12 (41.4%) | 0 (0.0%) |
| $100,000 to $299,999 | 17 (58.6%) | 41 (80.4%) |
| $300,000 to $499,999 | 0 (0.0%) | 10 (19.6%) |
| $500,000 to $749,999 | 0 (0.0%) | 0 (0.0%) |
| $750,000 to $999,999 | 0 (0.0%) | 0 (0.0%) |
| $1,000,000 or more | 0 (0.0%) | 0 (0.0%) |
| Total | 29 (100.0%) | 51 (100.0%) |
Household Income by Mortgage Status in Aspers
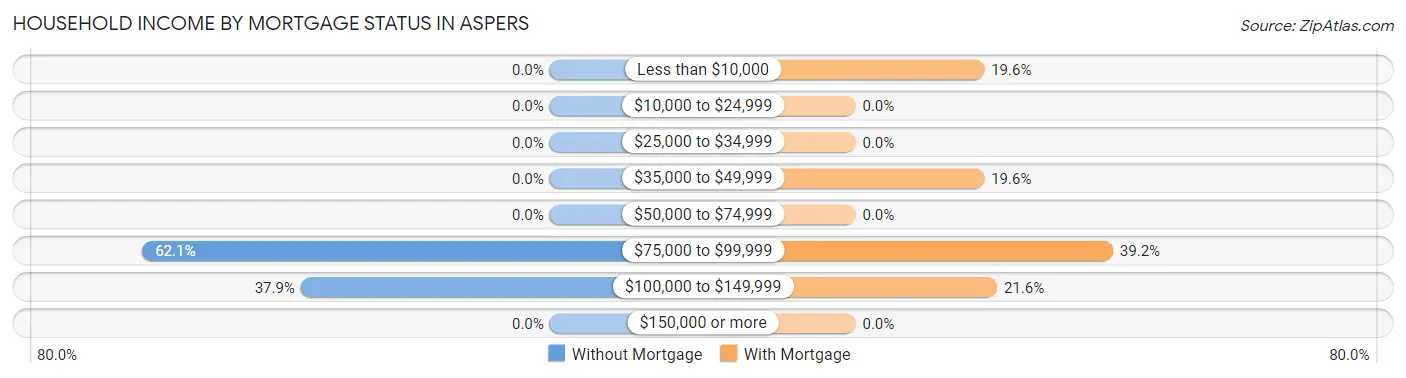
| Household Income | Without Mortgage | With Mortgage |
| Less than $10,000 | 0 (0.0%) | 10 (19.6%) |
| $10,000 to $24,999 | 0 (0.0%) | 0 (0.0%) |
| $25,000 to $34,999 | 0 (0.0%) | 0 (0.0%) |
| $35,000 to $49,999 | 0 (0.0%) | 10 (19.6%) |
| $50,000 to $74,999 | 0 (0.0%) | 0 (0.0%) |
| $75,000 to $99,999 | 18 (62.1%) | 20 (39.2%) |
| $100,000 to $149,999 | 11 (37.9%) | 11 (21.6%) |
| $150,000 or more | 0 (0.0%) | 0 (0.0%) |
| Total | 29 (100.0%) | 51 (100.0%) |
Property Value to Household Income Ratio in Aspers
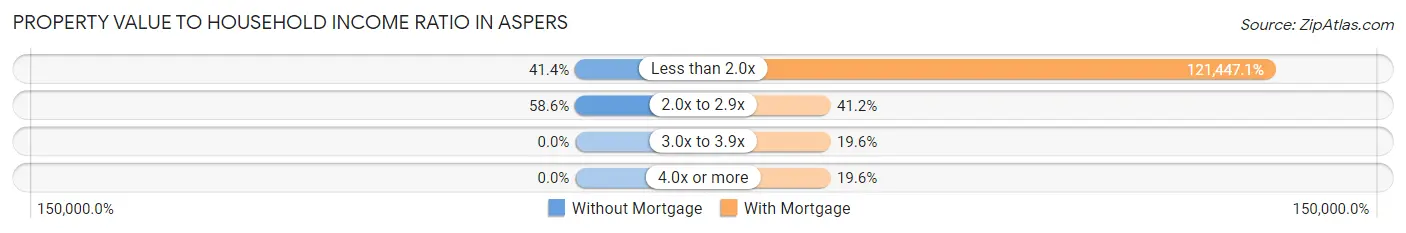
| Value-to-Income Ratio | Without Mortgage | With Mortgage |
| Less than 2.0x | 12 (41.4%) | 61,938 (121,447.1%) |
| 2.0x to 2.9x | 17 (58.6%) | 21 (41.2%) |
| 3.0x to 3.9x | 0 (0.0%) | 10 (19.6%) |
| 4.0x or more | 0 (0.0%) | 10 (19.6%) |
| Total | 29 (100.0%) | 51 (100.0%) |
Real Estate Taxes by Mortgage Status in Aspers
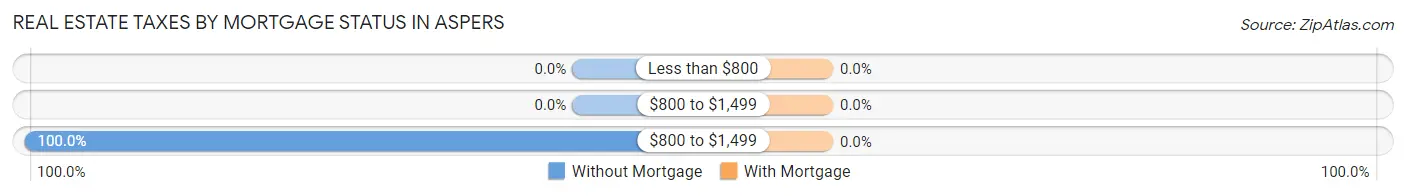
| Property Taxes | Without Mortgage | With Mortgage |
| Less than $800 | 0 (0.0%) | 0 (0.0%) |
| $800 to $1,499 | 0 (0.0%) | 0 (0.0%) |
| $800 to $1,499 | 29 (100.0%) | 0 (0.0%) |
| Total | 29 (100.0%) | 51 (100.0%) |
Health & Disability in Aspers
Health Insurance Coverage by Age in Aspers
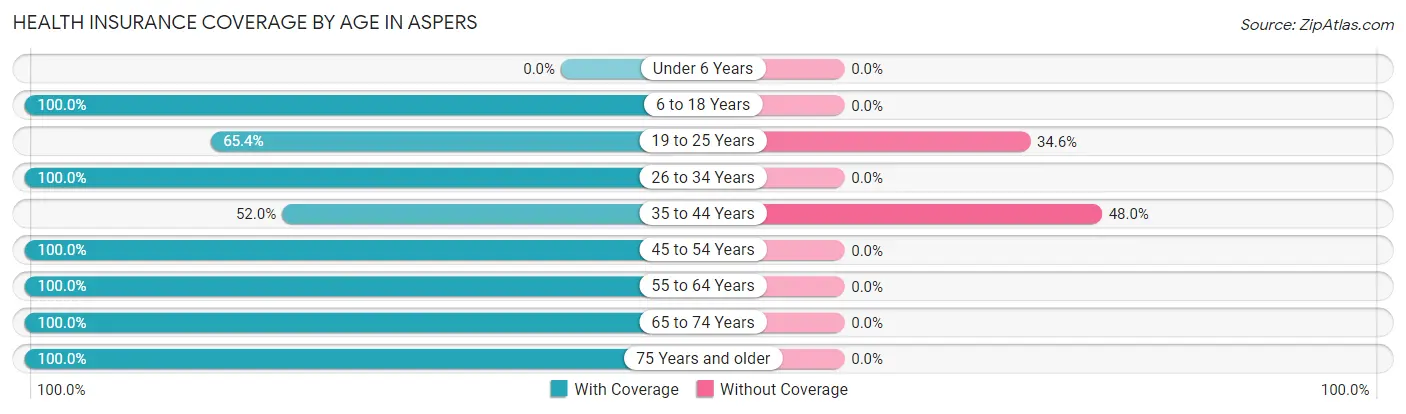
| Age Bracket | With Coverage | Without Coverage |
| Under 6 Years | 0 (0.0%) | 0 (0.0%) |
| 6 to 18 Years | 8 (100.0%) | 0 (0.0%) |
| 19 to 25 Years | 17 (65.4%) | 9 (34.6%) |
| 26 to 34 Years | 16 (100.0%) | 0 (0.0%) |
| 35 to 44 Years | 13 (52.0%) | 12 (48.0%) |
| 45 to 54 Years | 22 (100.0%) | 0 (0.0%) |
| 55 to 64 Years | 103 (100.0%) | 0 (0.0%) |
| 65 to 74 Years | 10 (100.0%) | 0 (0.0%) |
| 75 Years and older | 24 (100.0%) | 0 (0.0%) |
| Total | 213 (91.0%) | 21 (9.0%) |
Health Insurance Coverage by Citizenship Status in Aspers

| Citizenship Status | With Coverage | Without Coverage |
| Native Born | 0 (0.0%) | 0 (0.0%) |
| Foreign Born, Citizen | 8 (100.0%) | 0 (0.0%) |
| Foreign Born, not a Citizen | 17 (65.4%) | 9 (34.6%) |
Health Insurance Coverage by Household Income in Aspers
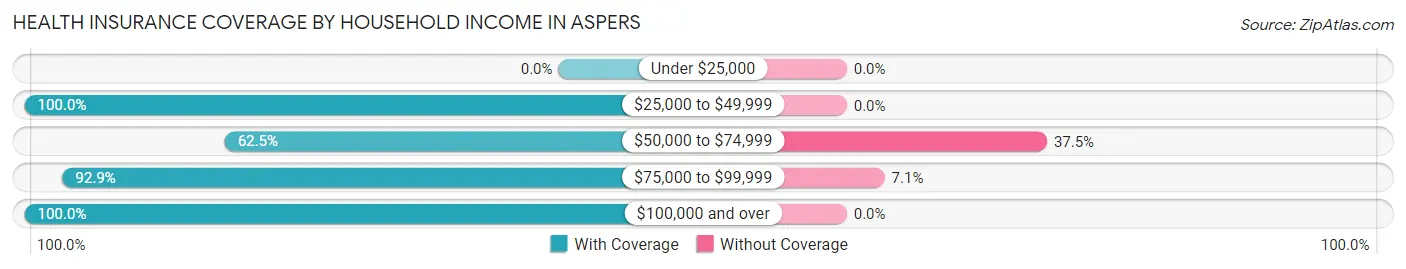
| Household Income | With Coverage | Without Coverage |
| Under $25,000 | 0 (0.0%) | 0 (0.0%) |
| $25,000 to $49,999 | 19 (100.0%) | 0 (0.0%) |
| $50,000 to $74,999 | 20 (62.5%) | 12 (37.5%) |
| $75,000 to $99,999 | 118 (92.9%) | 9 (7.1%) |
| $100,000 and over | 56 (100.0%) | 0 (0.0%) |
Public vs Private Health Insurance Coverage by Age in Aspers
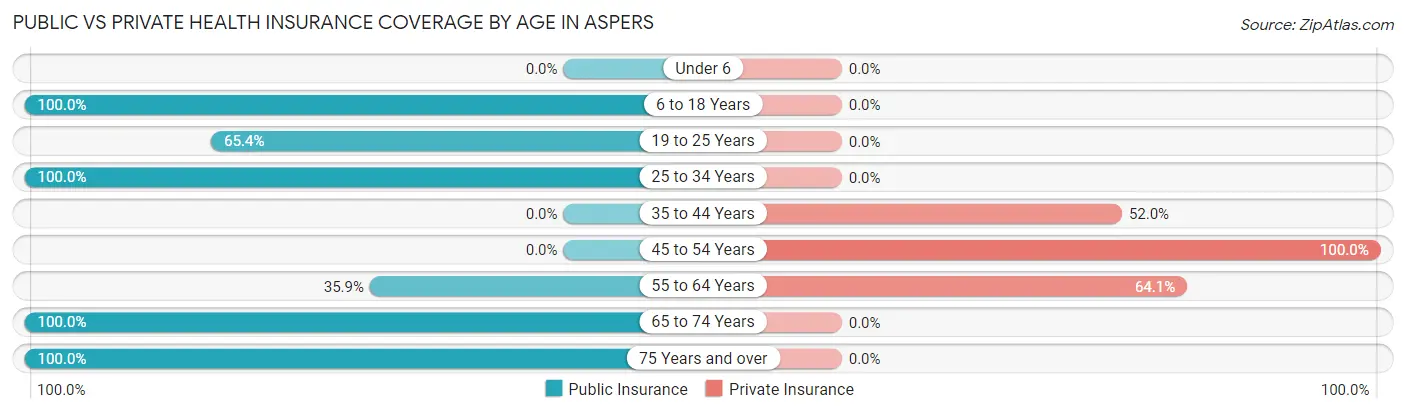
| Age Bracket | Public Insurance | Private Insurance |
| Under 6 | 0 (0.0%) | 0 (0.0%) |
| 6 to 18 Years | 8 (100.0%) | 0 (0.0%) |
| 19 to 25 Years | 17 (65.4%) | 0 (0.0%) |
| 25 to 34 Years | 16 (100.0%) | 0 (0.0%) |
| 35 to 44 Years | 0 (0.0%) | 13 (52.0%) |
| 45 to 54 Years | 0 (0.0%) | 22 (100.0%) |
| 55 to 64 Years | 37 (35.9%) | 66 (64.1%) |
| 65 to 74 Years | 10 (100.0%) | 0 (0.0%) |
| 75 Years and over | 24 (100.0%) | 0 (0.0%) |
| Total | 112 (47.9%) | 101 (43.2%) |
Disability Status by Sex by Age in Aspers
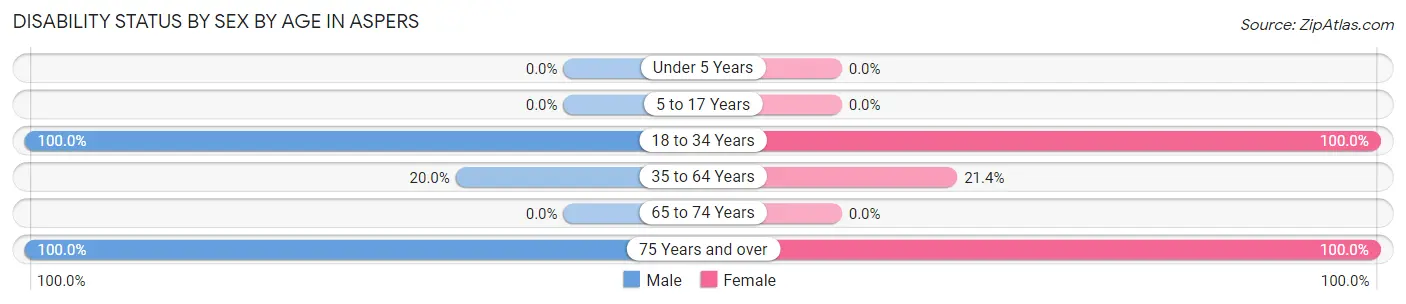
| Age Bracket | Male | Female |
| Under 5 Years | 0 (0.0%) | 0 (0.0%) |
| 5 to 17 Years | 0 (0.0%) | 0 (0.0%) |
| 18 to 34 Years | 9 (100.0%) | 41 (100.0%) |
| 35 to 64 Years | 16 (20.0%) | 15 (21.4%) |
| 65 to 74 Years | 0 (0.0%) | 0 (0.0%) |
| 75 Years and over | 12 (100.0%) | 12 (100.0%) |
Disability Class by Sex by Age in Aspers
Disability Class: Hearing Difficulty
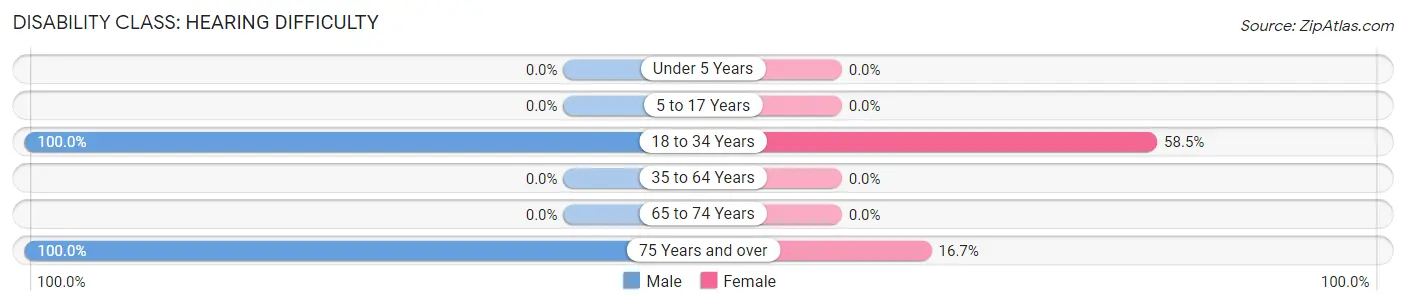
| Age Bracket | Male | Female |
| Under 5 Years | 0 (0.0%) | 0 (0.0%) |
| 5 to 17 Years | 0 (0.0%) | 0 (0.0%) |
| 18 to 34 Years | 9 (100.0%) | 24 (58.5%) |
| 35 to 64 Years | 0 (0.0%) | 0 (0.0%) |
| 65 to 74 Years | 0 (0.0%) | 0 (0.0%) |
| 75 Years and over | 12 (100.0%) | 2 (16.7%) |
Disability Class: Vision Difficulty
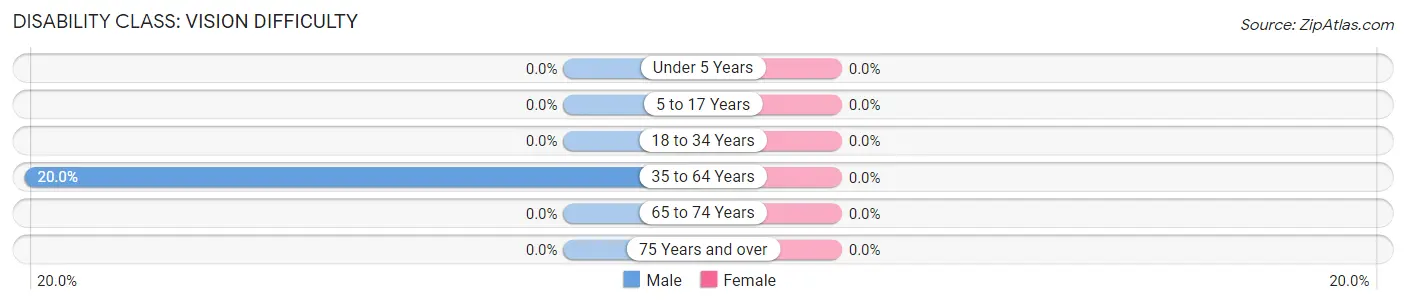
| Age Bracket | Male | Female |
| Under 5 Years | 0 (0.0%) | 0 (0.0%) |
| 5 to 17 Years | 0 (0.0%) | 0 (0.0%) |
| 18 to 34 Years | 0 (0.0%) | 0 (0.0%) |
| 35 to 64 Years | 16 (20.0%) | 0 (0.0%) |
| 65 to 74 Years | 0 (0.0%) | 0 (0.0%) |
| 75 Years and over | 0 (0.0%) | 0 (0.0%) |
Disability Class: Cognitive Difficulty
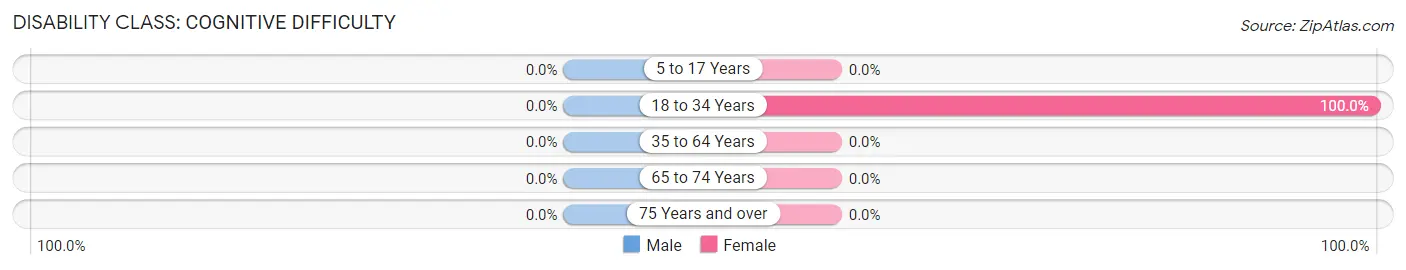
| Age Bracket | Male | Female |
| 5 to 17 Years | 0 (0.0%) | 0 (0.0%) |
| 18 to 34 Years | 0 (0.0%) | 41 (100.0%) |
| 35 to 64 Years | 0 (0.0%) | 0 (0.0%) |
| 65 to 74 Years | 0 (0.0%) | 0 (0.0%) |
| 75 Years and over | 0 (0.0%) | 0 (0.0%) |
Disability Class: Ambulatory Difficulty
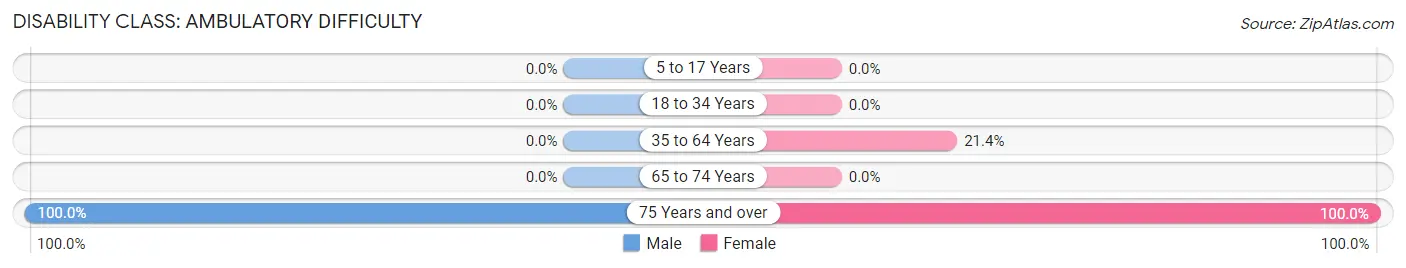
| Age Bracket | Male | Female |
| 5 to 17 Years | 0 (0.0%) | 0 (0.0%) |
| 18 to 34 Years | 0 (0.0%) | 0 (0.0%) |
| 35 to 64 Years | 0 (0.0%) | 15 (21.4%) |
| 65 to 74 Years | 0 (0.0%) | 0 (0.0%) |
| 75 Years and over | 12 (100.0%) | 12 (100.0%) |
Disability Class: Self-Care Difficulty

| Age Bracket | Male | Female |
| 5 to 17 Years | 0 (0.0%) | 0 (0.0%) |
| 18 to 34 Years | 0 (0.0%) | 0 (0.0%) |
| 35 to 64 Years | 0 (0.0%) | 15 (21.4%) |
| 65 to 74 Years | 0 (0.0%) | 0 (0.0%) |
| 75 Years and over | 0 (0.0%) | 0 (0.0%) |
Technology Access in Aspers
Computing Device Access in Aspers
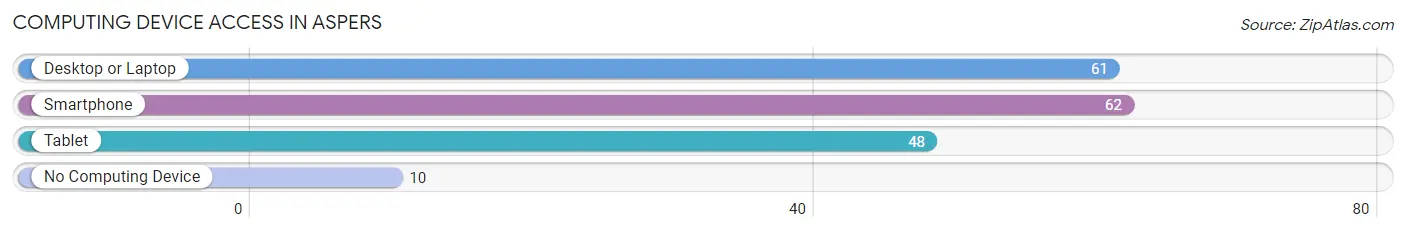
| Device Type | # Households | % Households |
| Desktop or Laptop | 61 | 74.4% |
| Smartphone | 62 | 75.6% |
| Tablet | 48 | 58.5% |
| No Computing Device | 10 | 12.2% |
| Total | 82 | 100.0% |
Internet Access in Aspers
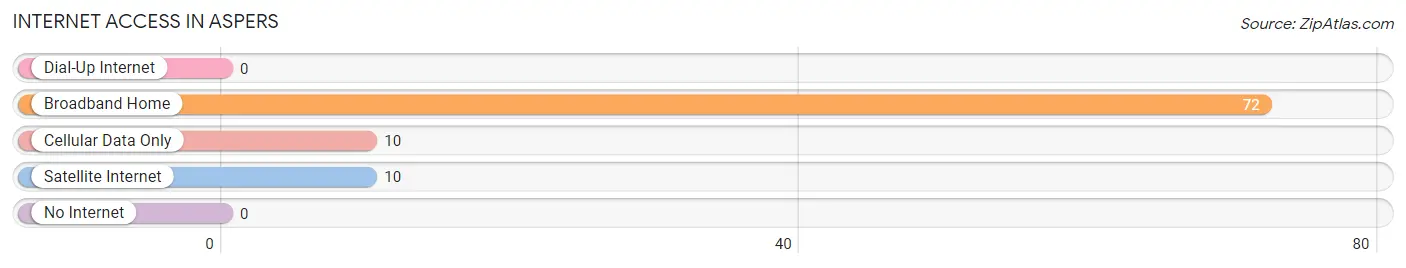
| Internet Type | # Households | % Households |
| Dial-Up Internet | 0 | 0.0% |
| Broadband Home | 72 | 87.8% |
| Cellular Data Only | 10 | 12.2% |
| Satellite Internet | 10 | 12.2% |
| No Internet | 0 | 0.0% |
| Total | 82 | 100.0% |
Aspers Summary
Aspers is a small borough located in Adams County, Pennsylvania. It is situated in the south-central part of the state, approximately 20 miles west of Gettysburg and 30 miles east of Chambersburg. As of the 2010 census, the population of Aspers was 1,093.
History
Aspers was founded in 1790 by a group of German settlers who had migrated from the Palatinate region of Germany. The town was originally known as “Asper’s Town”, named after the first settler, John Asper. The town was officially incorporated in 1845.
In the late 19th century, Aspers was a thriving agricultural community. The town was home to several mills, including a flour mill, a saw mill, and a grist mill. The town also had a blacksmith shop, a general store, and a post office.
In the early 20th century, Aspers began to experience a decline in population as many of its residents moved away in search of better economic opportunities. The town’s population decreased from 1,400 in 1900 to just over 1,000 in 1950.
Geography
Aspers is located in south-central Pennsylvania, approximately 20 miles west of Gettysburg and 30 miles east of Chambersburg. The town is situated in the Cumberland Valley, which is part of the Ridge and Valley physiographic province. The town is located at an elevation of 590 feet above sea level.
The town is situated on the banks of the Conodoguinet Creek, which flows through the center of town. The creek is a tributary of the Susquehanna River, which is located approximately 10 miles to the east.
The town is located in a rural area, with the majority of the land being used for agricultural purposes. The town is surrounded by rolling hills and farmland, with the Appalachian Mountains located to the west.
Economy
Aspers is a small, rural community with a limited economy. The town’s primary economic activity is agriculture, with the majority of the land being used for farming. The town is also home to several small businesses, including a general store, a post office, and a few restaurants.
The town is also home to a few light manufacturing businesses, including a furniture factory and a plastics factory. The town is also home to a few small service businesses, including a gas station and a few auto repair shops.
Demographics
As of the 2010 census, the population of Aspers was 1,093. The town has a total area of 1.2 square miles, with a population density of 890 people per square mile.
The racial makeup of the town is 97.3% White, 0.7% African American, 0.2% Native American, 0.2% Asian, and 1.6% from other races. The median household income is $41,250, and the median family income is $50,000.
The town has a high rate of poverty, with 24.3% of the population living below the poverty line. The town also has a high rate of unemployment, with 8.3% of the population being unemployed. The town’s largest employer is the local school district, which employs approximately 200 people.
Common Questions
What is Per Capita Income in Aspers?
Per Capita income in Aspers is $35,786.
What is the Median Family Income in Aspers?
Median Family Income in Aspers is $92,727.
What is the Median Household income in Aspers?
Median Household Income in Aspers is $76,875.
What is Inequality or Gini Index in Aspers?
Inequality or Gini Index in Aspers is 0.31.
What is the Total Population of Aspers?
Total Population of Aspers is 234.
What is the Total Male Population of Aspers?
Total Male Population of Aspers is 101.
What is the Total Female Population of Aspers?
Total Female Population of Aspers is 133.
What is the Ratio of Males per 100 Females in Aspers?
There are 75.94 Males per 100 Females in Aspers.
What is the Ratio of Females per 100 Males in Aspers?
There are 131.68 Females per 100 Males in Aspers.
What is the Median Population Age in Aspers?
Median Population Age in Aspers is 57.2 Years.
What is the Average Family Size in Aspers
Average Family Size in Aspers is 3.2 People.
What is the Average Household Size in Aspers
Average Household Size in Aspers is 2.9 People.
How Large is the Labor Force in Aspers?
There are 150 People in the Labor Forcein in Aspers.
What is the Percentage of People in the Labor Force in Aspers?
64.1% of People are in the Labor Force in Aspers.
What is the Unemployment Rate in Aspers?
Unemployment Rate in Aspers is 6.0%.