Verona borough, PA Map & Demographics
Verona borough Overview
$34,874
PER CAPITA INCOME
$71,065
AVG FAMILY INCOME
$46,610
AVG HOUSEHOLD INCOME
27.9%
WAGE / INCOME GAP [ % ]
72.1¢/ $1
WAGE / INCOME GAP [ $ ]
$10,843
FAMILY INCOME DEFICIT
0.49
INEQUALITY / GINI INDEX
2,629
TOTAL POPULATION
1,305
MALE POPULATION
1,324
FEMALE POPULATION
98.56
MALES / 100 FEMALES
101.46
FEMALES / 100 MALES
38.8
MEDIAN AGE
3.1
AVG FAMILY SIZE
2.2
AVG HOUSEHOLD SIZE
1,519
LABOR FORCE [ PEOPLE ]
68.7%
PERCENT IN LABOR FORCE
7.8%
UNEMPLOYMENT RATE
Income in Verona borough
Income Overview in Verona borough
Per Capita Income in Verona borough is $34,874, while median incomes of families and households are $71,065 and $46,610 respectively.
| Characteristic | Number | Measure |
| Per Capita Income | 2,629 | $34,874 |
| Median Family Income | 589 | $71,065 |
| Mean Family Income | 589 | $101,305 |
| Median Household Income | 1,208 | $46,610 |
| Mean Household Income | 1,208 | $72,292 |
| Income Deficit | 589 | $10,843 |
| Wage / Income Gap (%) | 2,629 | 27.89% |
| Wage / Income Gap ($) | 2,629 | 72.11¢ per $1 |
| Gini / Inequality Index | 2,629 | 0.49 |
Earnings by Sex in Verona borough
Average Earnings in Verona borough are $29,612, $34,619 for men and $24,964 for women, a difference of 27.9%.
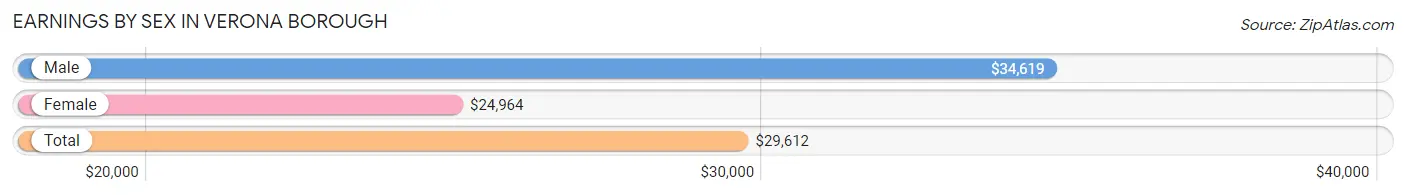
| Sex | Number | Average Earnings |
| Male | 728 (46.8%) | $34,619 |
| Female | 828 (53.2%) | $24,964 |
| Total | 1,556 (100.0%) | $29,612 |
Earnings by Sex by Income Bracket in Verona borough
The most common earnings brackets in Verona borough are $30,000 to $34,999 for men (131 | 18.0%) and $22,500 to $24,999 for women (138 | 16.7%).
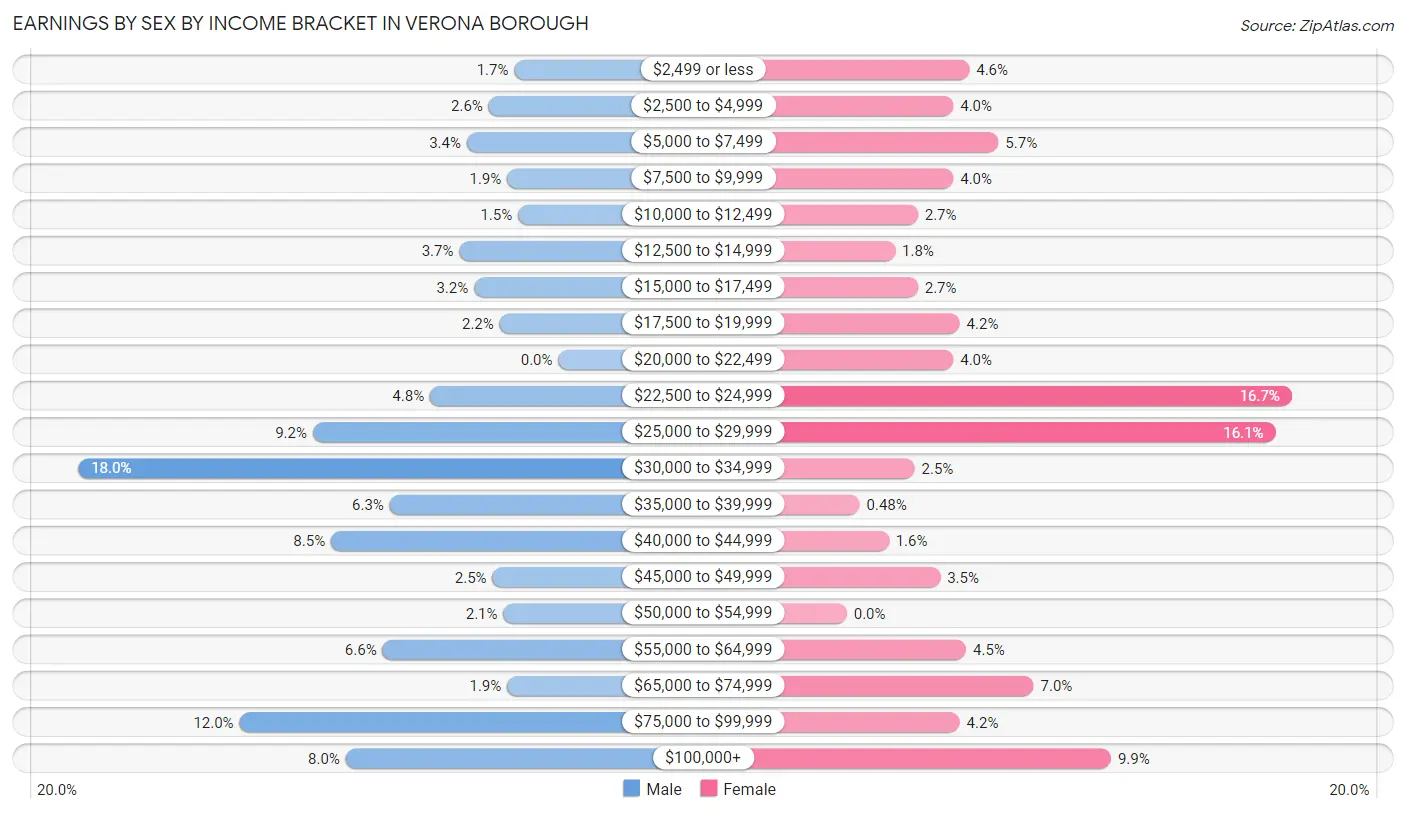
| Income | Male | Female |
| $2,499 or less | 12 (1.7%) | 38 (4.6%) |
| $2,500 to $4,999 | 19 (2.6%) | 33 (4.0%) |
| $5,000 to $7,499 | 25 (3.4%) | 47 (5.7%) |
| $7,500 to $9,999 | 14 (1.9%) | 33 (4.0%) |
| $10,000 to $12,499 | 11 (1.5%) | 22 (2.7%) |
| $12,500 to $14,999 | 27 (3.7%) | 15 (1.8%) |
| $15,000 to $17,499 | 23 (3.2%) | 22 (2.7%) |
| $17,500 to $19,999 | 16 (2.2%) | 35 (4.2%) |
| $20,000 to $22,499 | 0 (0.0%) | 33 (4.0%) |
| $22,500 to $24,999 | 35 (4.8%) | 138 (16.7%) |
| $25,000 to $29,999 | 67 (9.2%) | 133 (16.1%) |
| $30,000 to $34,999 | 131 (18.0%) | 21 (2.5%) |
| $35,000 to $39,999 | 46 (6.3%) | 4 (0.5%) |
| $40,000 to $44,999 | 62 (8.5%) | 13 (1.6%) |
| $45,000 to $49,999 | 18 (2.5%) | 29 (3.5%) |
| $50,000 to $54,999 | 15 (2.1%) | 0 (0.0%) |
| $55,000 to $64,999 | 48 (6.6%) | 37 (4.5%) |
| $65,000 to $74,999 | 14 (1.9%) | 58 (7.0%) |
| $75,000 to $99,999 | 87 (11.9%) | 35 (4.2%) |
| $100,000+ | 58 (8.0%) | 82 (9.9%) |
| Total | 728 (100.0%) | 828 (100.0%) |
Earnings by Sex by Educational Attainment in Verona borough
Average earnings in Verona borough are $36,810 for men and $24,946 for women, a difference of 32.2%. Men with an educational attainment of graduate degree enjoy the highest average annual earnings of $115,714, while those with college or associate's degree education earn the least with $33,373. Women with an educational attainment of graduate degree earn the most with the average annual earnings of $93,854, while those with less than high school education have the smallest earnings of $12,386.
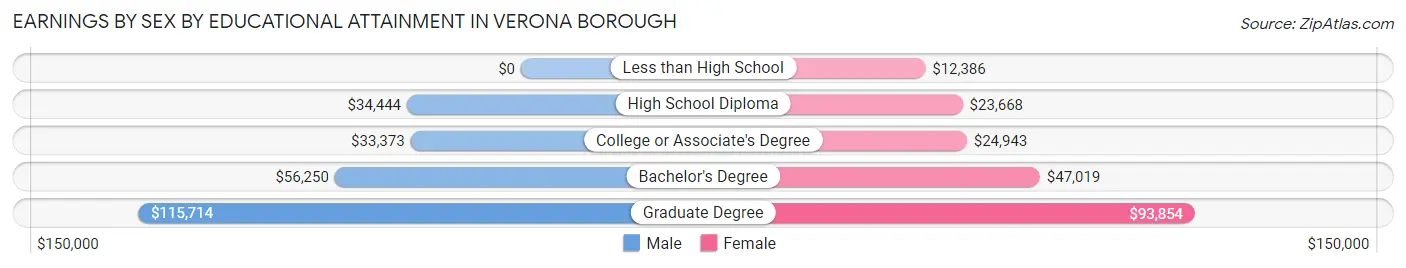
| Educational Attainment | Male Income | Female Income |
| Less than High School | - | - |
| High School Diploma | $34,444 | $23,668 |
| College or Associate's Degree | $33,373 | $24,943 |
| Bachelor's Degree | $56,250 | $47,019 |
| Graduate Degree | $115,714 | $93,854 |
| Total | $36,810 | $24,946 |
Family Income in Verona borough
Family Income Brackets in Verona borough
According to the Verona borough family income data, there are 121 families falling into the $100,000 to $149,999 income range, which is the most common income bracket and makes up 20.5% of all families.
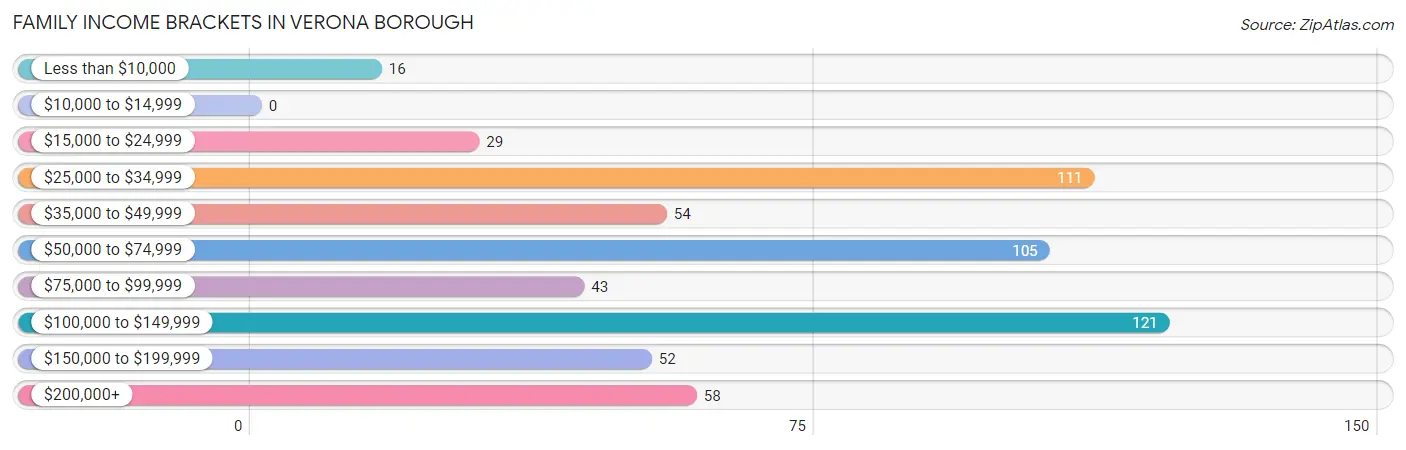
| Income Bracket | # Families | % Families |
| Less than $10,000 | 16 | 2.7% |
| $10,000 to $14,999 | 0 | 0.0% |
| $15,000 to $24,999 | 29 | 4.9% |
| $25,000 to $34,999 | 111 | 18.8% |
| $35,000 to $49,999 | 54 | 9.2% |
| $50,000 to $74,999 | 105 | 17.8% |
| $75,000 to $99,999 | 43 | 7.3% |
| $100,000 to $149,999 | 121 | 20.5% |
| $150,000 to $199,999 | 52 | 8.8% |
| $200,000+ | 58 | 9.8% |
Family Income by Famaliy Size in Verona borough
5-person families (35 | 5.9%) account for the highest median family income in Verona borough with $104,219 per family, while 2-person families (244 | 41.4%) have the highest median income of $29,844 per family member.
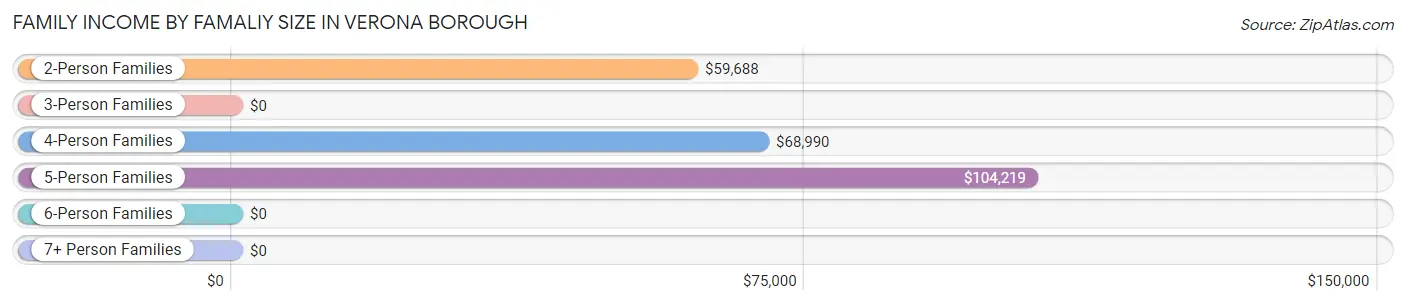
| Income Bracket | # Families | Median Income |
| 2-Person Families | 244 (41.4%) | $59,688 |
| 3-Person Families | 152 (25.8%) | $0 |
| 4-Person Families | 141 (23.9%) | $68,990 |
| 5-Person Families | 35 (5.9%) | $104,219 |
| 6-Person Families | 4 (0.7%) | $0 |
| 7+ Person Families | 13 (2.2%) | $0 |
| Total | 589 (100.0%) | $71,065 |
Family Income by Number of Earners in Verona borough
The median family income in Verona borough is $71,065, with families comprising 3+ earners (131) having the highest median family income of $162,679, while families with no earners (56) have the lowest median family income of $31,667, accounting for 22.2% and 9.5% of families, respectively.
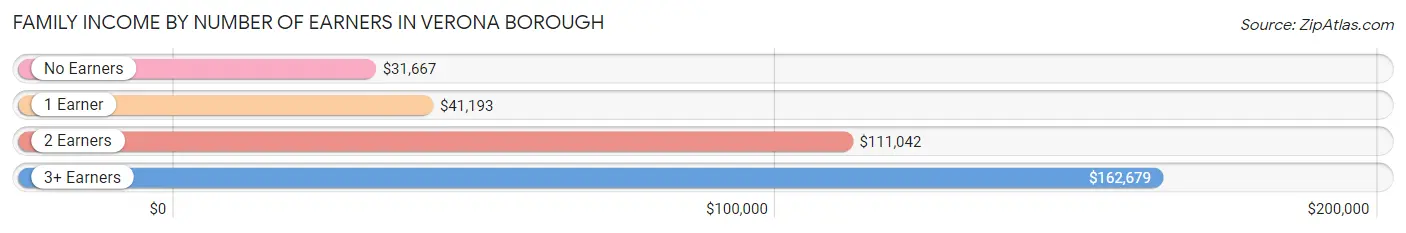
| Number of Earners | # Families | Median Income |
| No Earners | 56 (9.5%) | $31,667 |
| 1 Earner | 232 (39.4%) | $41,193 |
| 2 Earners | 170 (28.9%) | $111,042 |
| 3+ Earners | 131 (22.2%) | $162,679 |
| Total | 589 (100.0%) | $71,065 |
Household Income in Verona borough
Household Income Brackets in Verona borough
With 234 households falling in the category, the $50,000 to $74,999 income range is the most frequent in Verona borough, accounting for 19.4% of all households. In contrast, only 48 households (4.0%) fall into the less than $10,000 income bracket, making it the least populous group.
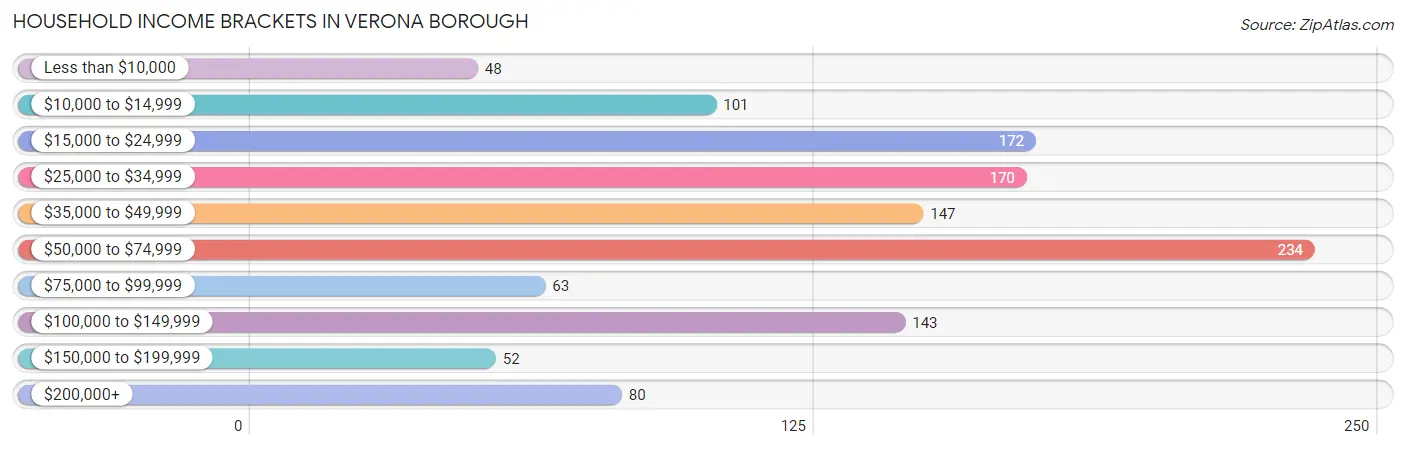
| Income Bracket | # Households | % Households |
| Less than $10,000 | 48 | 4.0% |
| $10,000 to $14,999 | 101 | 8.4% |
| $15,000 to $24,999 | 172 | 14.2% |
| $25,000 to $34,999 | 170 | 14.1% |
| $35,000 to $49,999 | 147 | 12.2% |
| $50,000 to $74,999 | 234 | 19.4% |
| $75,000 to $99,999 | 63 | 5.2% |
| $100,000 to $149,999 | 143 | 11.8% |
| $150,000 to $199,999 | 52 | 4.3% |
| $200,000+ | 80 | 6.6% |
Household Income by Householder Age in Verona borough
The median household income in Verona borough is $46,610, with the highest median household income of $69,756 found in the 45 to 64 years age bracket for the primary householder. A total of 362 households (30.0%) fall into this category. Meanwhile, the 65+ years age bracket for the primary householder has the lowest median household income of $27,875, with 429 households (35.5%) in this group.
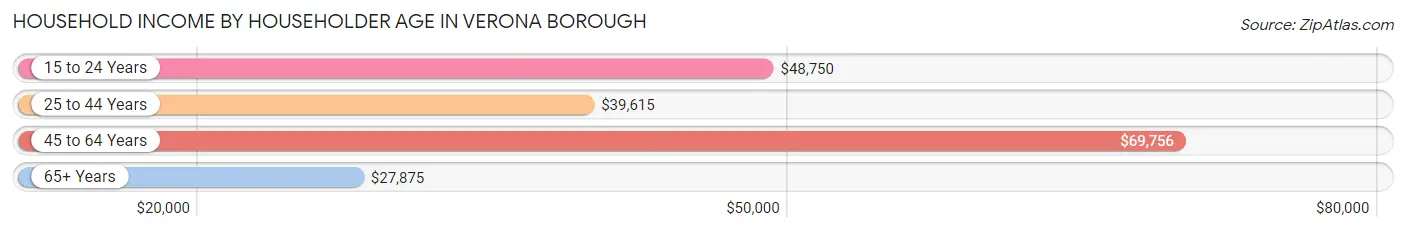
| Income Bracket | # Households | Median Income |
| 15 to 24 Years | 49 (4.1%) | $48,750 |
| 25 to 44 Years | 368 (30.5%) | $39,615 |
| 45 to 64 Years | 362 (30.0%) | $69,756 |
| 65+ Years | 429 (35.5%) | $27,875 |
| Total | 1,208 (100.0%) | $46,610 |
Poverty in Verona borough
Income Below Poverty by Sex and Age in Verona borough
With 6.7% poverty level for males and 12.1% for females among the residents of Verona borough, 6 to 11 year old males and 75 year old and over females are the most vulnerable to poverty, with 28 males (31.5%) and 37 females (44.1%) in their respective age groups living below the poverty level.
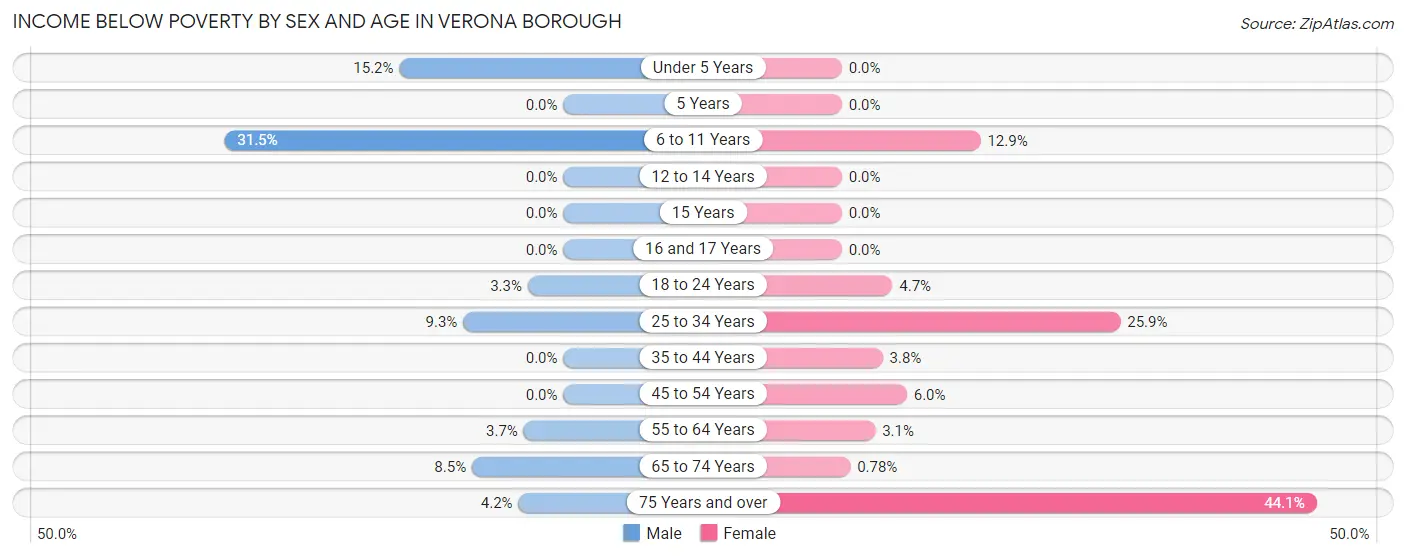
| Age Bracket | Male | Female |
| Under 5 Years | 14 (15.2%) | 0 (0.0%) |
| 5 Years | 0 (0.0%) | 0 (0.0%) |
| 6 to 11 Years | 28 (31.5%) | 13 (12.9%) |
| 12 to 14 Years | 0 (0.0%) | 0 (0.0%) |
| 15 Years | 0 (0.0%) | 0 (0.0%) |
| 16 and 17 Years | 0 (0.0%) | 0 (0.0%) |
| 18 to 24 Years | 3 (3.3%) | 6 (4.7%) |
| 25 to 34 Years | 16 (9.3%) | 84 (25.9%) |
| 35 to 44 Years | 0 (0.0%) | 5 (3.8%) |
| 45 to 54 Years | 0 (0.0%) | 7 (6.0%) |
| 55 to 64 Years | 6 (3.7%) | 7 (3.1%) |
| 65 to 74 Years | 14 (8.5%) | 1 (0.8%) |
| 75 Years and over | 6 (4.2%) | 37 (44.1%) |
| Total | 87 (6.7%) | 160 (12.1%) |
Income Above Poverty by Sex and Age in Verona borough
According to the poverty statistics in Verona borough, males aged 5 years and females aged under 5 years are the age groups that are most secure financially, with 100.0% of males and 100.0% of females in these age groups living above the poverty line.
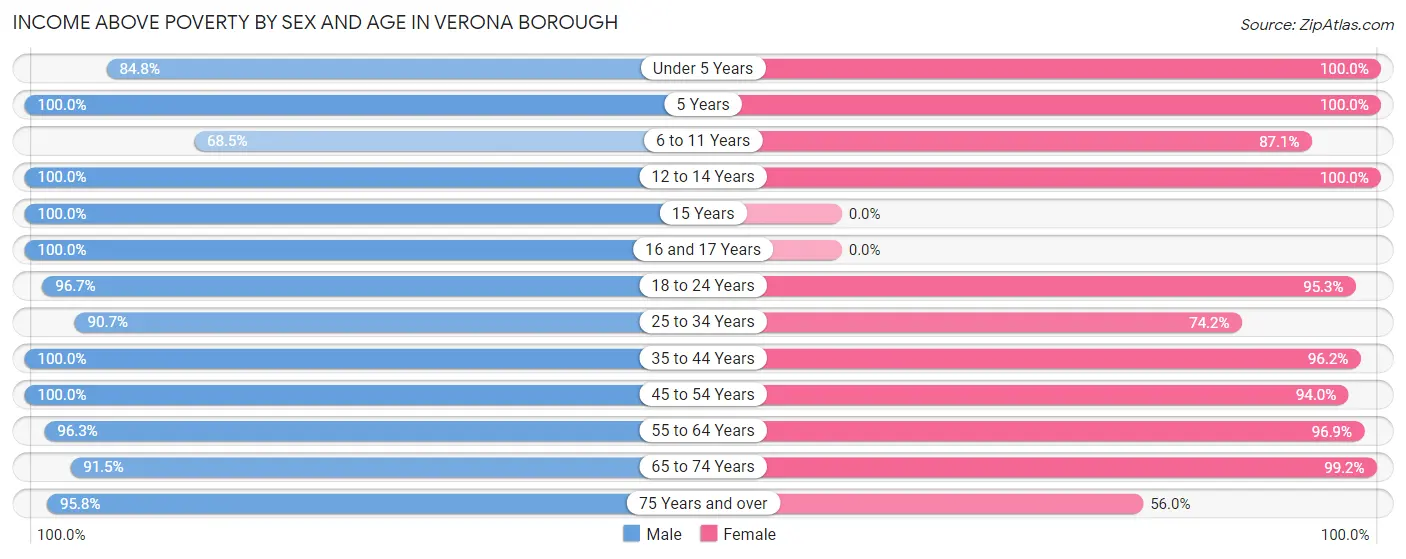
| Age Bracket | Male | Female |
| Under 5 Years | 78 (84.8%) | 36 (100.0%) |
| 5 Years | 11 (100.0%) | 27 (100.0%) |
| 6 to 11 Years | 61 (68.5%) | 88 (87.1%) |
| 12 to 14 Years | 34 (100.0%) | 21 (100.0%) |
| 15 Years | 7 (100.0%) | 0 (0.0%) |
| 16 and 17 Years | 56 (100.0%) | 0 (0.0%) |
| 18 to 24 Years | 88 (96.7%) | 122 (95.3%) |
| 25 to 34 Years | 156 (90.7%) | 241 (74.2%) |
| 35 to 44 Years | 126 (100.0%) | 127 (96.2%) |
| 45 to 54 Years | 155 (100.0%) | 109 (94.0%) |
| 55 to 64 Years | 157 (96.3%) | 219 (96.9%) |
| 65 to 74 Years | 151 (91.5%) | 127 (99.2%) |
| 75 Years and over | 138 (95.8%) | 47 (55.9%) |
| Total | 1,218 (93.3%) | 1,164 (87.9%) |
Income Below Poverty Among Married-Couple Families in Verona borough
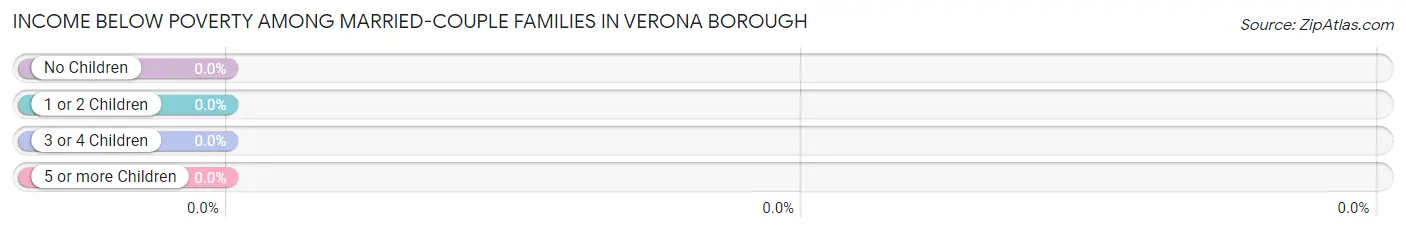
| Children | Above Poverty | Below Poverty |
| No Children | 244 (100.0%) | 0 (0.0%) |
| 1 or 2 Children | 104 (100.0%) | 0 (0.0%) |
| 3 or 4 Children | 15 (100.0%) | 0 (0.0%) |
| 5 or more Children | 0 (0.0%) | 0 (0.0%) |
| Total | 363 (100.0%) | 0 (0.0%) |
Income Below Poverty Among Single-Parent Households in Verona borough
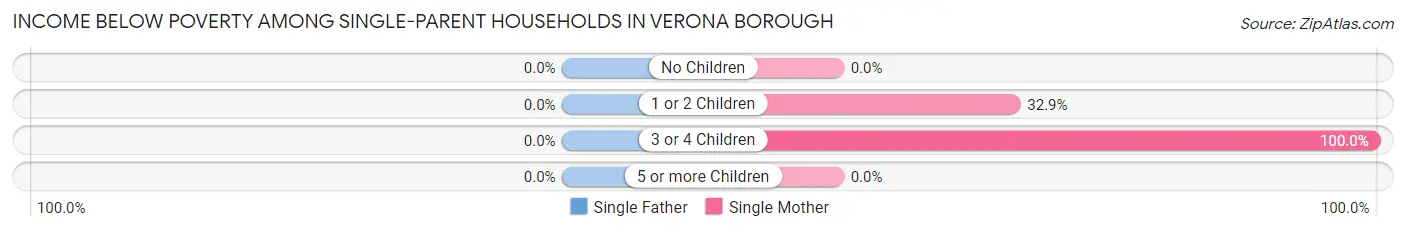
| Children | Single Father | Single Mother |
| No Children | 0 (0.0%) | 0 (0.0%) |
| 1 or 2 Children | 0 (0.0%) | 26 (32.9%) |
| 3 or 4 Children | 0 (0.0%) | 11 (100.0%) |
| 5 or more Children | 0 (0.0%) | 0 (0.0%) |
| Total | 0 (0.0%) | 37 (30.8%) |
Income Below Poverty Among Married-Couple vs Single-Parent Households in Verona borough
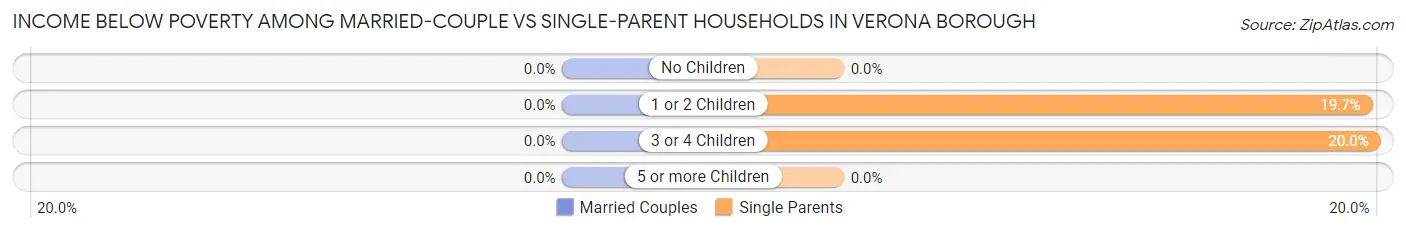
| Children | Married-Couple Families | Single-Parent Households |
| No Children | 0 (0.0%) | 0 (0.0%) |
| 1 or 2 Children | 0 (0.0%) | 26 (19.7%) |
| 3 or 4 Children | 0 (0.0%) | 11 (20.0%) |
| 5 or more Children | 0 (0.0%) | 0 (0.0%) |
| Total | 0 (0.0%) | 37 (16.4%) |
Race in Verona borough
The most populous races in Verona borough are White / Caucasian (2,164 | 82.3%), Black / African American (328 | 12.5%), and Two or more Races (136 | 5.2%).
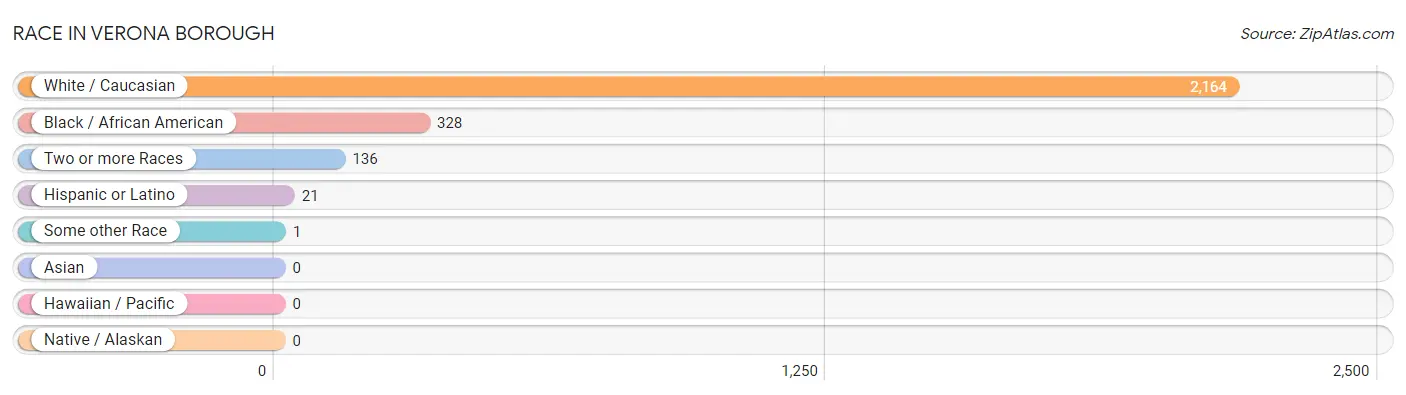
| Race | # Population | % Population |
| Asian | 0 | 0.0% |
| Black / African American | 328 | 12.5% |
| Hawaiian / Pacific | 0 | 0.0% |
| Hispanic or Latino | 21 | 0.8% |
| Native / Alaskan | 0 | 0.0% |
| White / Caucasian | 2,164 | 82.3% |
| Two or more Races | 136 | 5.2% |
| Some other Race | 1 | 0.0% |
| Total | 2,629 | 100.0% |
Ancestry in Verona borough
The most populous ancestries reported in Verona borough are Italian (535 | 20.3%), German (488 | 18.6%), Irish (384 | 14.6%), English (186 | 7.1%), and American (144 | 5.5%), together accounting for 66.1% of all Verona borough residents.
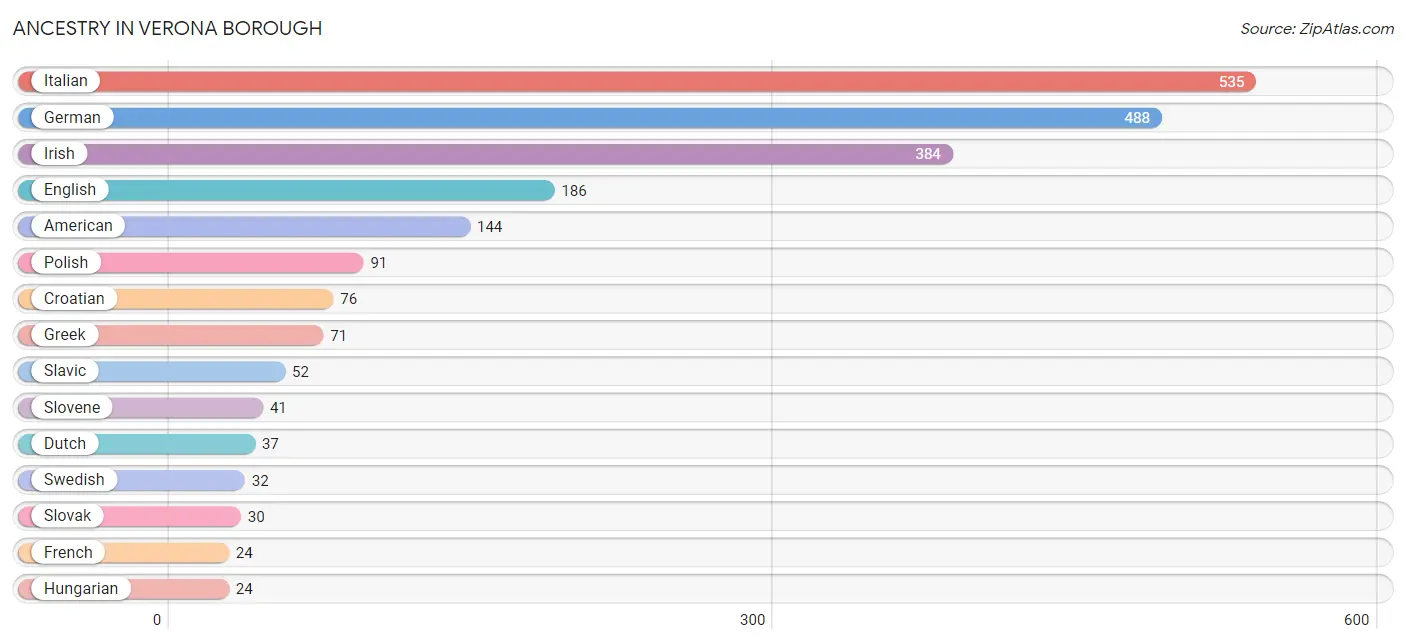
| Ancestry | # Population | % Population |
| American | 144 | 5.5% |
| Argentinean | 8 | 0.3% |
| British | 22 | 0.8% |
| Croatian | 76 | 2.9% |
| Czechoslovakian | 5 | 0.2% |
| Dutch | 37 | 1.4% |
| English | 186 | 7.1% |
| European | 8 | 0.3% |
| French | 24 | 0.9% |
| French Canadian | 11 | 0.4% |
| German | 488 | 18.6% |
| Greek | 71 | 2.7% |
| Hungarian | 24 | 0.9% |
| Irish | 384 | 14.6% |
| Italian | 535 | 20.3% |
| Lithuanian | 22 | 0.8% |
| Mexican | 13 | 0.5% |
| Polish | 91 | 3.5% |
| Russian | 3 | 0.1% |
| Scotch-Irish | 24 | 0.9% |
| Scottish | 16 | 0.6% |
| Slavic | 52 | 2.0% |
| Slovak | 30 | 1.1% |
| Slovene | 41 | 1.6% |
| South American | 8 | 0.3% |
| Swedish | 32 | 1.2% |
| Welsh | 6 | 0.2% | View All 27 Rows |
Immigrants in Verona borough
The most numerous immigrant groups reported in Verona borough came from Europe (35 | 1.3%), Greece (24 | 0.9%), Southern Europe (24 | 0.9%), England (11 | 0.4%), and Northern Europe (11 | 0.4%), together accounting for 4.0% of all Verona borough residents.
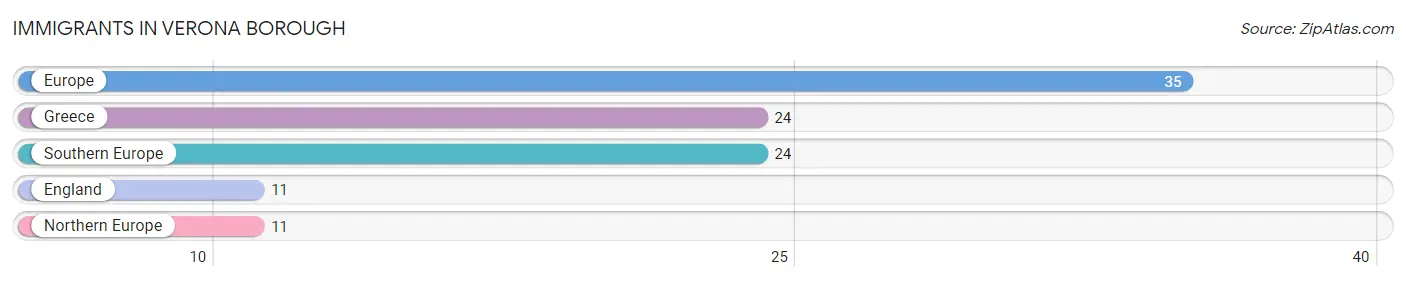
| Immigration Origin | # Population | % Population |
| England | 11 | 0.4% |
| Europe | 35 | 1.3% |
| Greece | 24 | 0.9% |
| Northern Europe | 11 | 0.4% |
| Southern Europe | 24 | 0.9% | View All 5 Rows |
Sex and Age in Verona borough
Sex and Age in Verona borough
The most populous age groups in Verona borough are 65 to 69 Years (120 | 9.2%) for men and 25 to 29 Years (171 | 12.9%) for women.
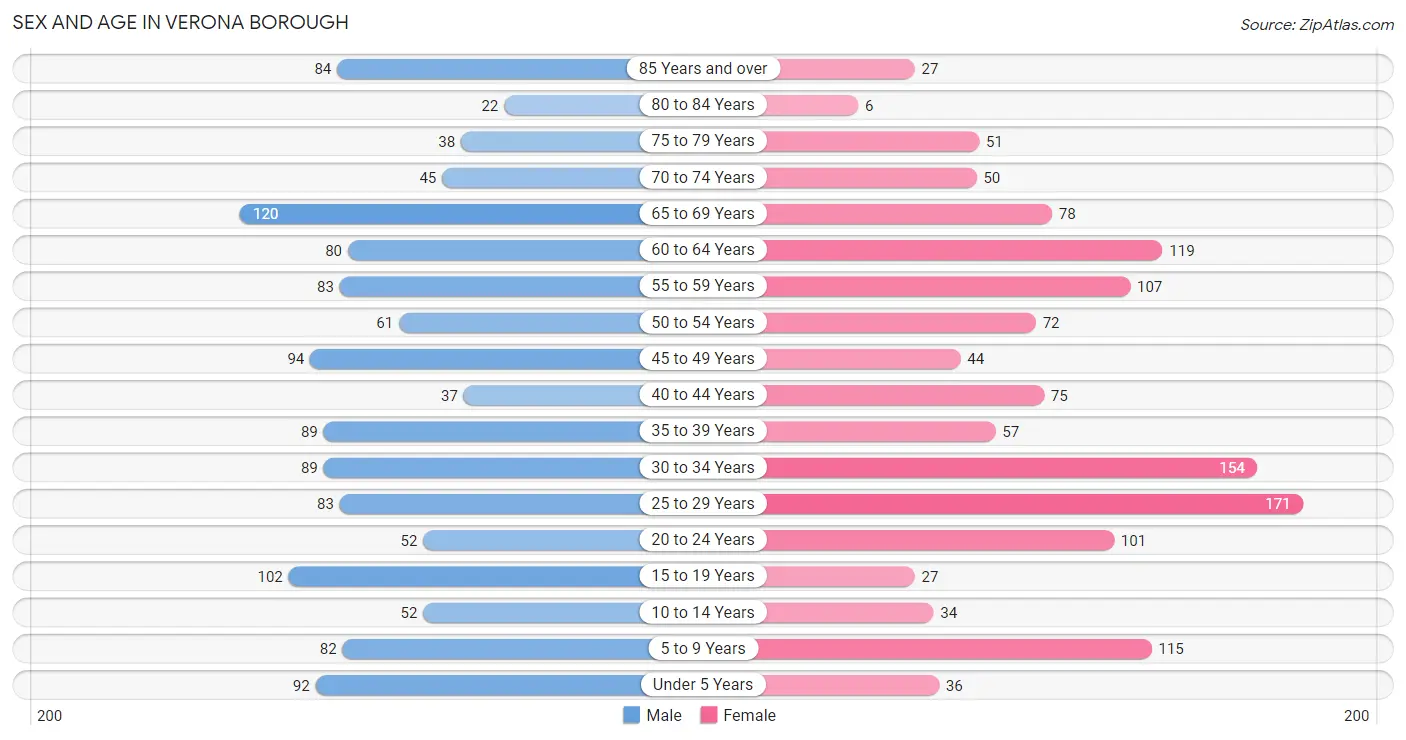
| Age Bracket | Male | Female |
| Under 5 Years | 92 (7.0%) | 36 (2.7%) |
| 5 to 9 Years | 82 (6.3%) | 115 (8.7%) |
| 10 to 14 Years | 52 (4.0%) | 34 (2.6%) |
| 15 to 19 Years | 102 (7.8%) | 27 (2.0%) |
| 20 to 24 Years | 52 (4.0%) | 101 (7.6%) |
| 25 to 29 Years | 83 (6.4%) | 171 (12.9%) |
| 30 to 34 Years | 89 (6.8%) | 154 (11.6%) |
| 35 to 39 Years | 89 (6.8%) | 57 (4.3%) |
| 40 to 44 Years | 37 (2.8%) | 75 (5.7%) |
| 45 to 49 Years | 94 (7.2%) | 44 (3.3%) |
| 50 to 54 Years | 61 (4.7%) | 72 (5.4%) |
| 55 to 59 Years | 83 (6.4%) | 107 (8.1%) |
| 60 to 64 Years | 80 (6.1%) | 119 (9.0%) |
| 65 to 69 Years | 120 (9.2%) | 78 (5.9%) |
| 70 to 74 Years | 45 (3.5%) | 50 (3.8%) |
| 75 to 79 Years | 38 (2.9%) | 51 (3.8%) |
| 80 to 84 Years | 22 (1.7%) | 6 (0.4%) |
| 85 Years and over | 84 (6.4%) | 27 (2.0%) |
| Total | 1,305 (100.0%) | 1,324 (100.0%) |
Families and Households in Verona borough
Median Family Size in Verona borough
The median family size in Verona borough is 3.06 persons per family, with married-couple families (363 | 61.6%) accounting for the largest median family size of 3.23 persons per family. On the other hand, single female/mother families (120 | 20.4%) represent the smallest median family size with 2.64 persons per family.
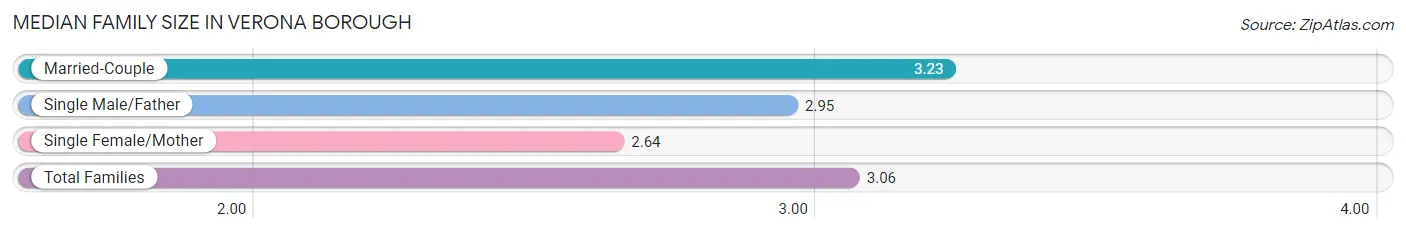
| Family Type | # Families | Family Size |
| Married-Couple | 363 (61.6%) | 3.23 |
| Single Male/Father | 106 (18.0%) | 2.95 |
| Single Female/Mother | 120 (20.4%) | 2.64 |
| Total Families | 589 (100.0%) | 3.06 |
Median Household Size in Verona borough
The median household size in Verona borough is 2.17 persons per household, with single male/father households (106 | 8.8%) accounting for the largest median household size of 3.44 persons per household. non-family households (619 | 51.2%) represent the smallest median household size with 1.20 persons per household.
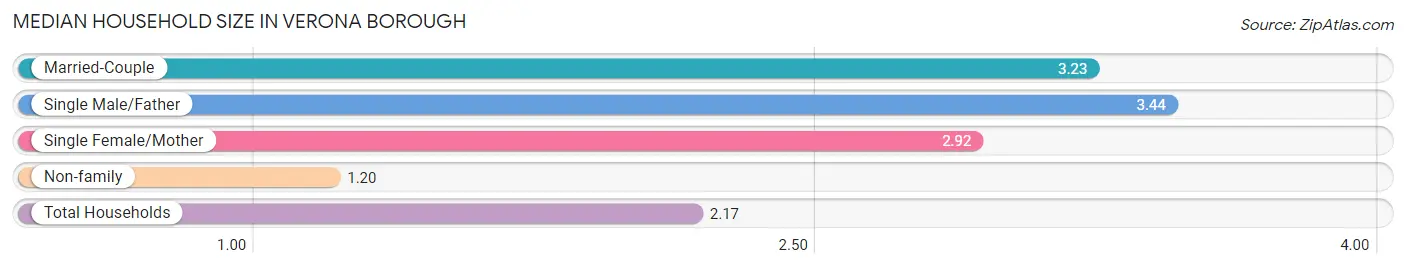
| Household Type | # Households | Household Size |
| Married-Couple | 363 (30.0%) | 3.23 |
| Single Male/Father | 106 (8.8%) | 3.44 |
| Single Female/Mother | 120 (9.9%) | 2.92 |
| Non-family | 619 (51.2%) | 1.20 |
| Total Households | 1,208 (100.0%) | 2.17 |
Household Size by Marriage Status in Verona borough
Out of a total of 1,208 households in Verona borough, 589 (48.8%) are family households, while 619 (51.2%) are nonfamily households. The most numerous type of family households are 3-person households, comprising 200, and the most common type of nonfamily households are 1-person households, comprising 518.
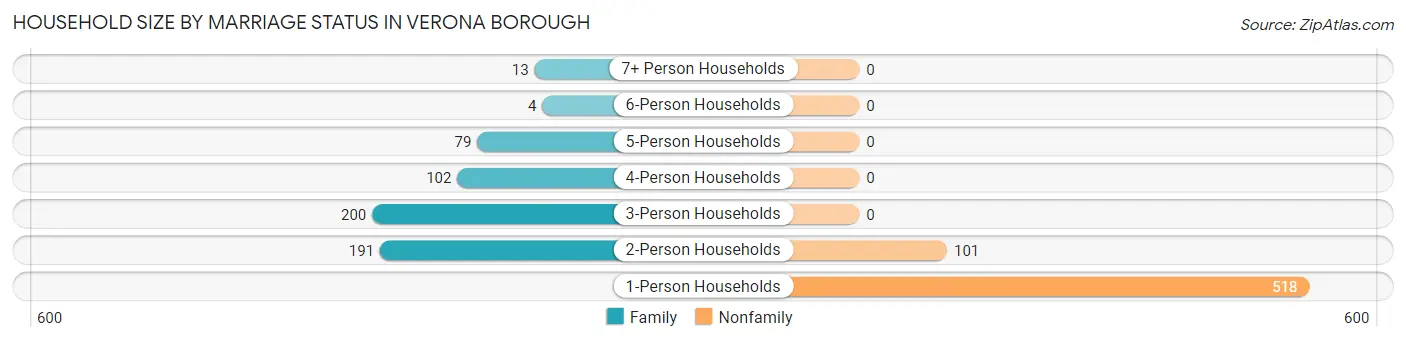
| Household Size | Family Households | Nonfamily Households |
| 1-Person Households | - | 518 (42.9%) |
| 2-Person Households | 191 (15.8%) | 101 (8.4%) |
| 3-Person Households | 200 (16.6%) | 0 (0.0%) |
| 4-Person Households | 102 (8.4%) | 0 (0.0%) |
| 5-Person Households | 79 (6.5%) | 0 (0.0%) |
| 6-Person Households | 4 (0.3%) | 0 (0.0%) |
| 7+ Person Households | 13 (1.1%) | 0 (0.0%) |
| Total | 589 (48.8%) | 619 (51.2%) |
Female Fertility in Verona borough
Fertility by Age in Verona borough
Average fertility rate in Verona borough is 30.0 births per 1,000 women. Women in the age bracket of 20 to 34 years have the highest fertility rate with 45.0 births per 1,000 women. Women in the age bracket of 20 to 34 years acount for 100.0% of all women with births.
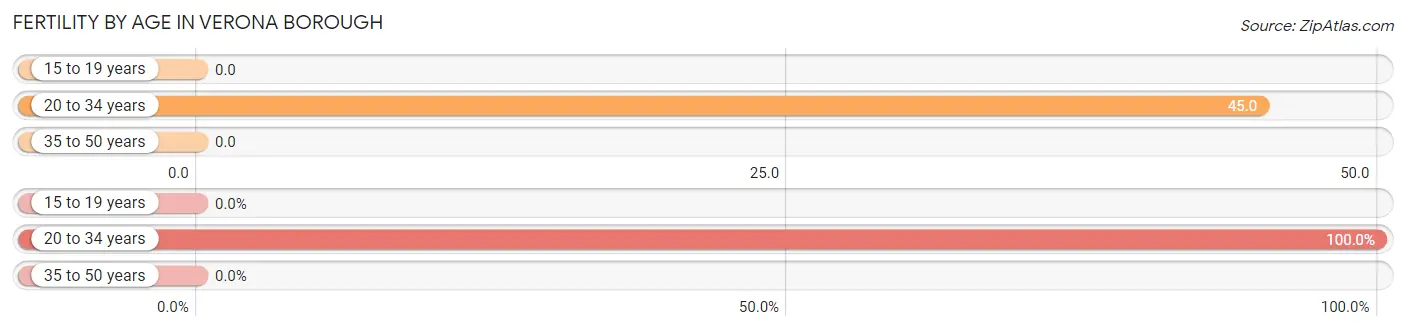
| Age Bracket | Women with Births | Births / 1,000 Women |
| 15 to 19 years | 0 (0.0%) | 0.0 |
| 20 to 34 years | 19 (100.0%) | 45.0 |
| 35 to 50 years | 0 (0.0%) | 0.0 |
| Total | 19 (100.0%) | 30.0 |
Fertility by Age by Marriage Status in Verona borough
42.1% of women with births (19) in Verona borough are married. The highest percentage of unmarried women with births falls into 20 to 34 years age bracket with 57.9% of them unmarried at the time of birth, while the lowest percentage of unmarried women with births belong to 20 to 34 years age bracket with 57.9% of them unmarried.
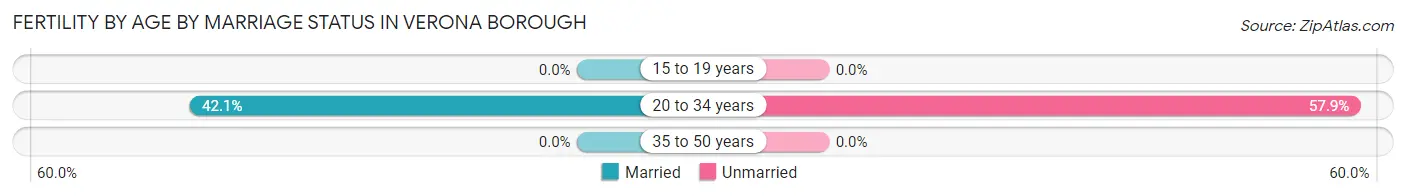
| Age Bracket | Married | Unmarried |
| 15 to 19 years | 0 (0.0%) | 0 (0.0%) |
| 20 to 34 years | 8 (42.1%) | 11 (57.9%) |
| 35 to 50 years | 0 (0.0%) | 0 (0.0%) |
| Total | 8 (42.1%) | 11 (57.9%) |
Fertility by Education in Verona borough
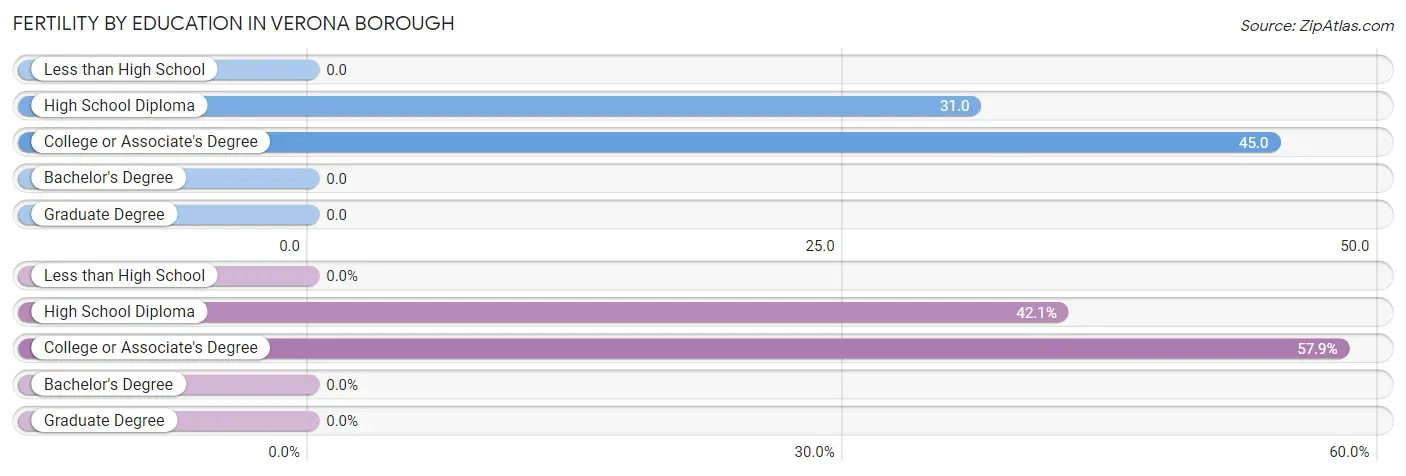
| Educational Attainment | Women with Births | Births / 1,000 Women |
| Less than High School | 0 (0.0%) | 0.0 |
| High School Diploma | 8 (42.1%) | 31.0 |
| College or Associate's Degree | 11 (57.9%) | 45.0 |
| Bachelor's Degree | 0 (0.0%) | 0.0 |
| Graduate Degree | 0 (0.0%) | 0.0 |
| Total | 19 (100.0%) | 30.0 |
Fertility by Education by Marriage Status in Verona borough
57.9% of women with births in Verona borough are unmarried. Women with the educational attainment of high school diploma are most likely to be married with 100.0% of them married at childbirth, while women with the educational attainment of college or associate's degree are least likely to be married with 100.0% of them unmarried at childbirth.
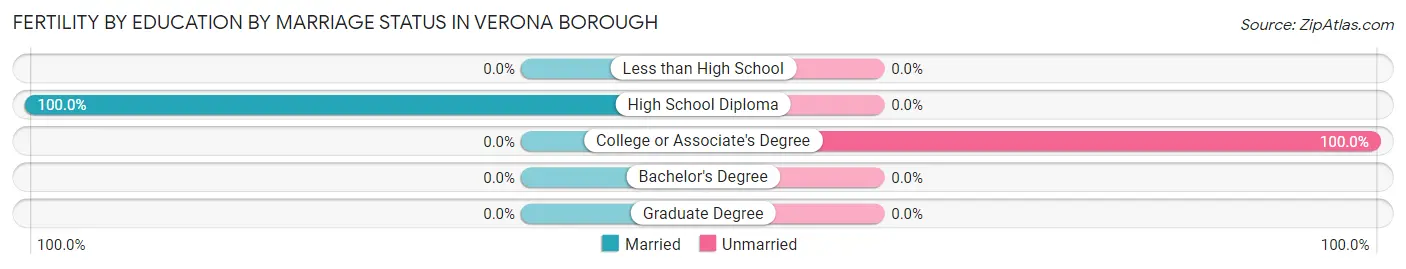
| Educational Attainment | Married | Unmarried |
| Less than High School | 0 (0.0%) | 0 (0.0%) |
| High School Diploma | 8 (100.0%) | 0 (0.0%) |
| College or Associate's Degree | 0 (0.0%) | 11 (100.0%) |
| Bachelor's Degree | 0 (0.0%) | 0 (0.0%) |
| Graduate Degree | 0 (0.0%) | 0 (0.0%) |
| Total | 8 (42.1%) | 11 (57.9%) |
Employment Characteristics in Verona borough
Employment by Class of Employer in Verona borough
Among the 1,321 employed individuals in Verona borough, private company employees (1,044 | 79.0%), not-for-profit organizations (152 | 11.5%), and local government employees (66 | 5.0%) make up the most common classes of employment.
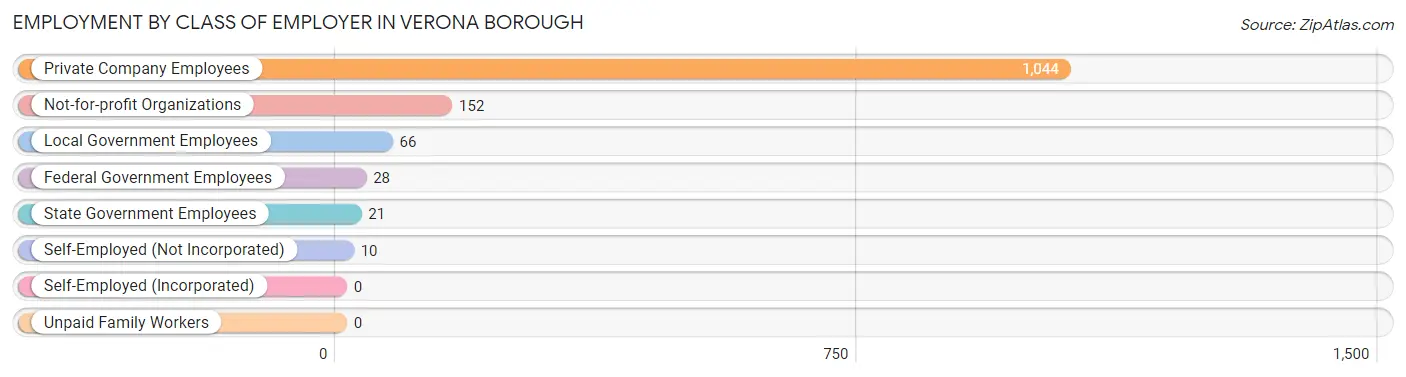
| Employer Class | # Employees | % Employees |
| Private Company Employees | 1,044 | 79.0% |
| Self-Employed (Incorporated) | 0 | 0.0% |
| Self-Employed (Not Incorporated) | 10 | 0.8% |
| Not-for-profit Organizations | 152 | 11.5% |
| Local Government Employees | 66 | 5.0% |
| State Government Employees | 21 | 1.6% |
| Federal Government Employees | 28 | 2.1% |
| Unpaid Family Workers | 0 | 0.0% |
| Total | 1,321 | 100.0% |
Employment Status by Age in Verona borough
According to the labor force statistics for Verona borough, out of the total population over 16 years of age (2,211), 68.7% or 1,519 individuals are in the labor force, with 7.8% or 118 of them unemployed. The age group with the highest labor force participation rate is 45 to 54 years, with 97.4% or 264 individuals in the labor force. Within the labor force, the 75 years and over age range has the highest percentage of unemployed individuals, with 84.8% or 28 of them being unemployed.
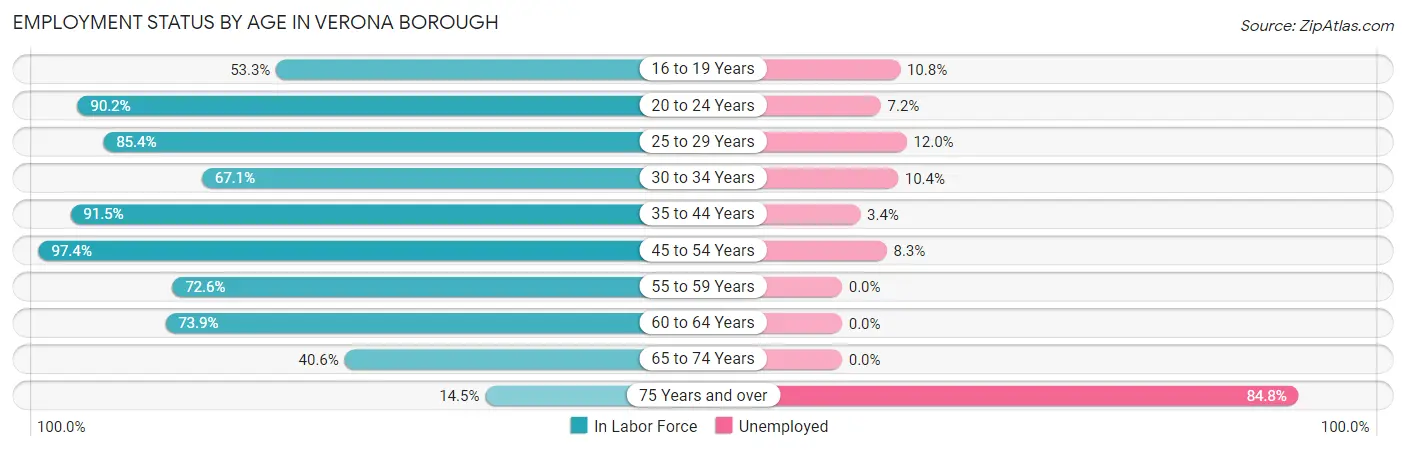
| Age Bracket | In Labor Force | Unemployed |
| 16 to 19 Years | 65 (53.3%) | 7 (10.8%) |
| 20 to 24 Years | 138 (90.2%) | 10 (7.2%) |
| 25 to 29 Years | 217 (85.4%) | 26 (12.0%) |
| 30 to 34 Years | 163 (67.1%) | 17 (10.4%) |
| 35 to 44 Years | 236 (91.5%) | 8 (3.4%) |
| 45 to 54 Years | 264 (97.4%) | 22 (8.3%) |
| 55 to 59 Years | 138 (72.6%) | 0 (0.0%) |
| 60 to 64 Years | 147 (73.9%) | 0 (0.0%) |
| 65 to 74 Years | 119 (40.6%) | 0 (0.0%) |
| 75 Years and over | 33 (14.5%) | 28 (84.8%) |
| Total | 1,519 (68.7%) | 118 (7.8%) |
Employment Status by Educational Attainment in Verona borough
According to labor force statistics for Verona borough, 82.3% of individuals (1,165) out of the total population between 25 and 64 years of age (1,415) are in the labor force, with 6.3% or 73 of them being unemployed. The group with the highest labor force participation rate are those with the educational attainment of bachelor's degree or higher, with 95.0% or 320 individuals in the labor force. Within the labor force, individuals with less than high school education have the highest percentage of unemployment, with 27.9% or 17 of them being unemployed.
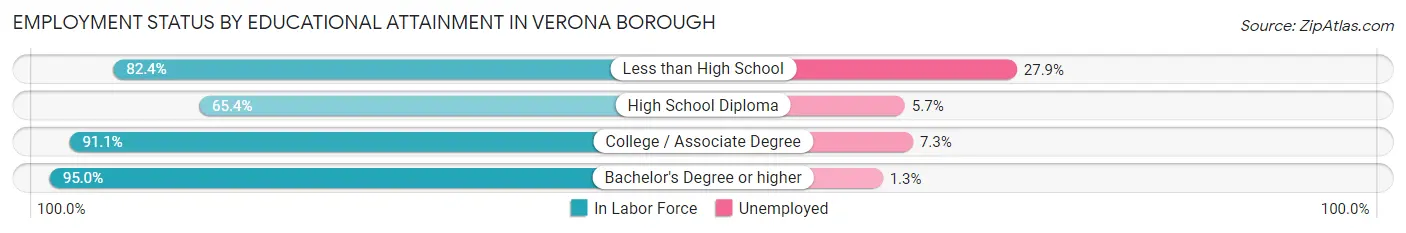
| Educational Attainment | In Labor Force | Unemployed |
| Less than High School | 61 (82.4%) | 21 (27.9%) |
| High School Diploma | 332 (65.4%) | 29 (5.7%) |
| College / Associate Degree | 452 (91.1%) | 36 (7.3%) |
| Bachelor's Degree or higher | 320 (95.0%) | 4 (1.3%) |
| Total | 1,165 (82.3%) | 89 (6.3%) |
Employment Occupations by Sex in Verona borough
Management, Business, Science and Arts Occupations
The most common Management, Business, Science and Arts occupations in Verona borough are Health Diagnosing & Treating (152 | 10.8%), Community & Social Service (135 | 9.6%), Health Technologists (104 | 7.4%), Management (90 | 6.4%), and Education Instruction & Library (75 | 5.3%).
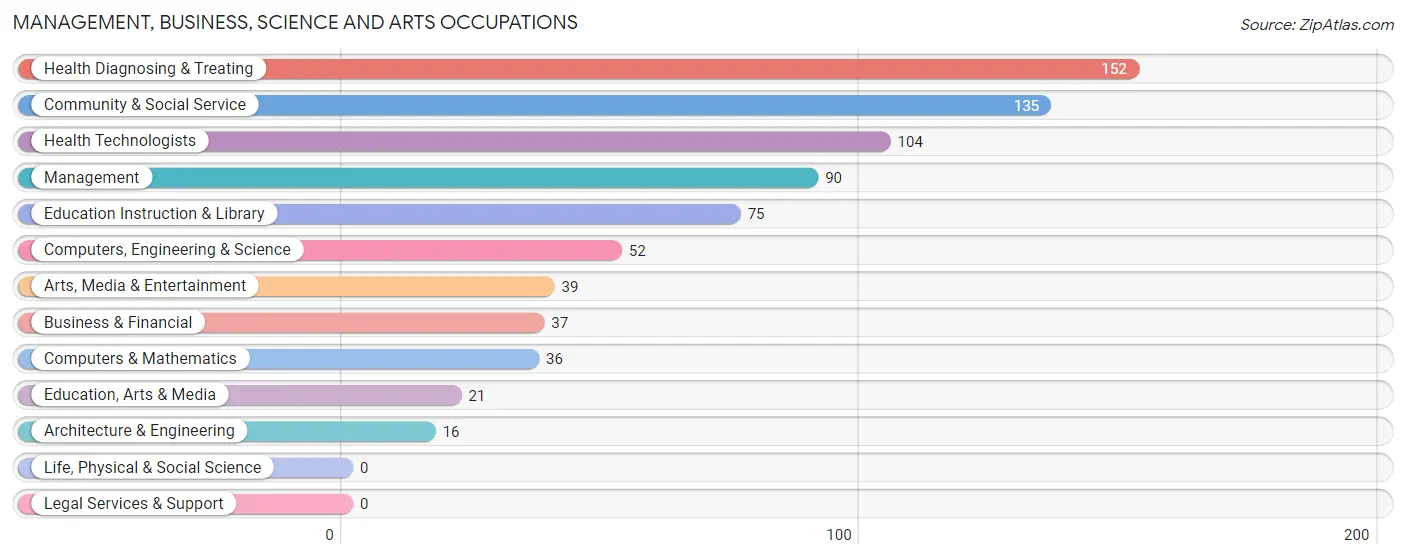
Management, Business, Science and Arts Occupations by Sex
Within the Management, Business, Science and Arts occupations in Verona borough, the most male-oriented occupations are Architecture & Engineering (100.0%), Computers, Engineering & Science (75.0%), and Management (67.8%), while the most female-oriented occupations are Health Technologists (100.0%), Health Diagnosing & Treating (92.8%), and Education Instruction & Library (92.0%).
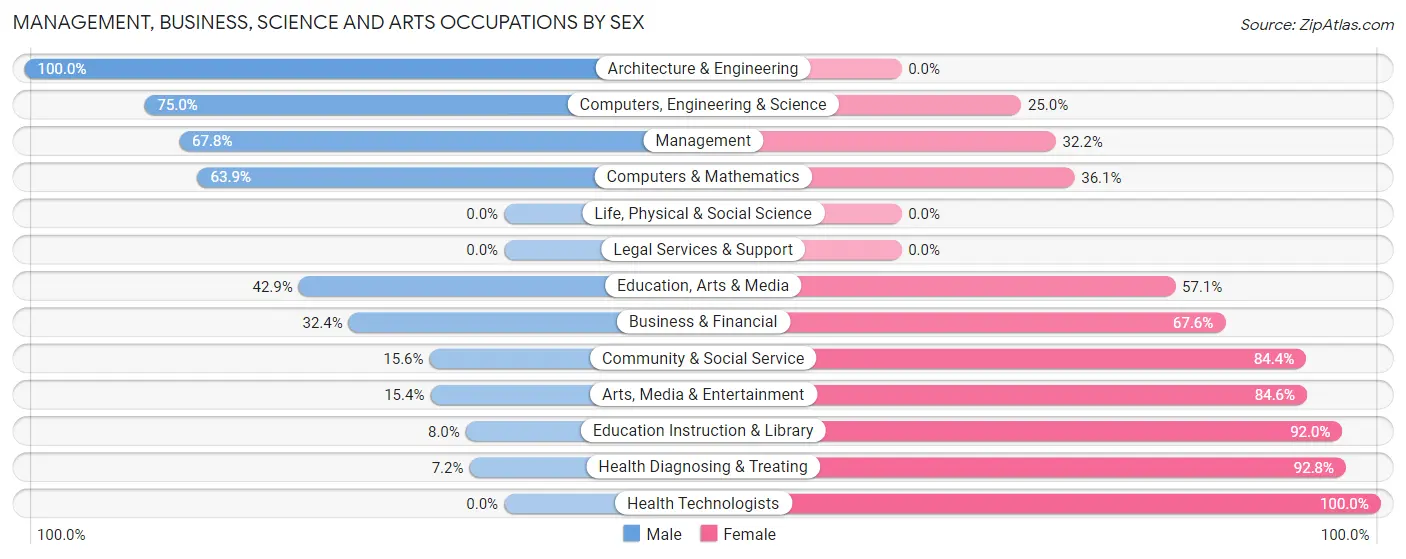
| Occupation | Male | Female |
| Management | 61 (67.8%) | 29 (32.2%) |
| Business & Financial | 12 (32.4%) | 25 (67.6%) |
| Computers, Engineering & Science | 39 (75.0%) | 13 (25.0%) |
| Computers & Mathematics | 23 (63.9%) | 13 (36.1%) |
| Architecture & Engineering | 16 (100.0%) | 0 (0.0%) |
| Life, Physical & Social Science | 0 (0.0%) | 0 (0.0%) |
| Community & Social Service | 21 (15.6%) | 114 (84.4%) |
| Education, Arts & Media | 9 (42.9%) | 12 (57.1%) |
| Legal Services & Support | 0 (0.0%) | 0 (0.0%) |
| Education Instruction & Library | 6 (8.0%) | 69 (92.0%) |
| Arts, Media & Entertainment | 6 (15.4%) | 33 (84.6%) |
| Health Diagnosing & Treating | 11 (7.2%) | 141 (92.8%) |
| Health Technologists | 0 (0.0%) | 104 (100.0%) |
| Total (Category) | 144 (30.9%) | 322 (69.1%) |
| Total (Overall) | 685 (48.9%) | 717 (51.1%) |
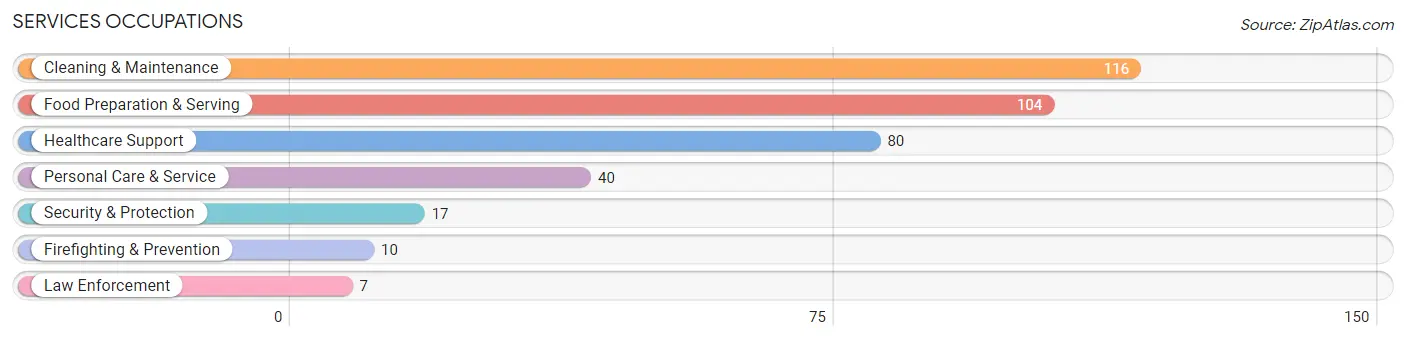
Services Occupations
The most common Services occupations in Verona borough are Cleaning & Maintenance (116 | 8.3%), Food Preparation & Serving (104 | 7.4%), Healthcare Support (80 | 5.7%), Personal Care & Service (40 | 2.9%), and Security & Protection (17 | 1.2%).
Services Occupations by Sex
Within the Services occupations in Verona borough, the most male-oriented occupations are Law Enforcement (100.0%), Security & Protection (76.5%), and Firefighting & Prevention (60.0%), while the most female-oriented occupations are Cleaning & Maintenance (77.6%), Personal Care & Service (60.0%), and Food Preparation & Serving (55.8%).
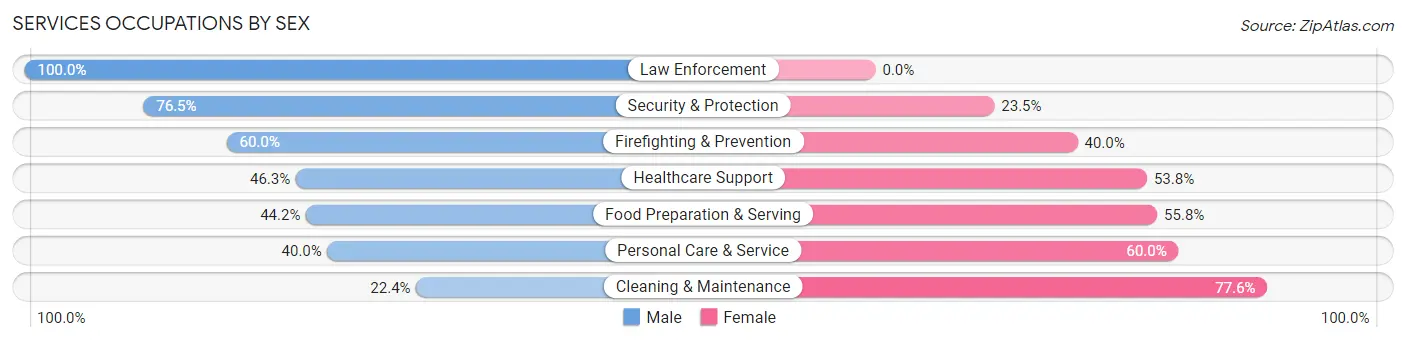
| Occupation | Male | Female |
| Healthcare Support | 37 (46.3%) | 43 (53.7%) |
| Security & Protection | 13 (76.5%) | 4 (23.5%) |
| Firefighting & Prevention | 6 (60.0%) | 4 (40.0%) |
| Law Enforcement | 7 (100.0%) | 0 (0.0%) |
| Food Preparation & Serving | 46 (44.2%) | 58 (55.8%) |
| Cleaning & Maintenance | 26 (22.4%) | 90 (77.6%) |
| Personal Care & Service | 16 (40.0%) | 24 (60.0%) |
| Total (Category) | 138 (38.7%) | 219 (61.3%) |
| Total (Overall) | 685 (48.9%) | 717 (51.1%) |
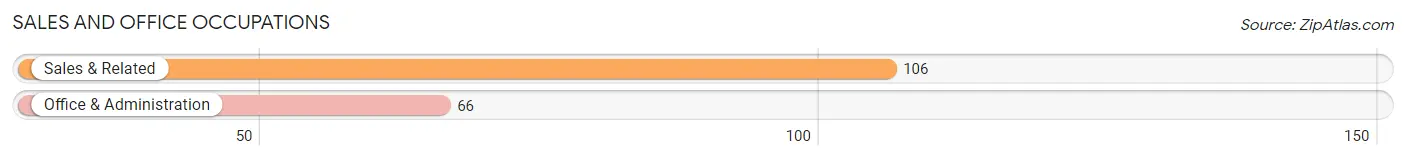
Sales and Office Occupations
The most common Sales and Office occupations in Verona borough are Sales & Related (106 | 7.6%), and Office & Administration (66 | 4.7%).
Sales and Office Occupations by Sex
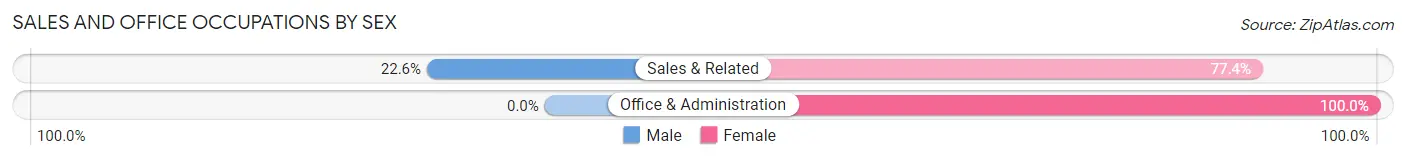
| Occupation | Male | Female |
| Sales & Related | 24 (22.6%) | 82 (77.4%) |
| Office & Administration | 0 (0.0%) | 66 (100.0%) |
| Total (Category) | 24 (14.0%) | 148 (86.1%) |
| Total (Overall) | 685 (48.9%) | 717 (51.1%) |
Natural Resources, Construction and Maintenance Occupations
The most common Natural Resources, Construction and Maintenance occupations in Verona borough are Installation, Maintenance & Repair (90 | 6.4%), and Construction & Extraction (65 | 4.6%).
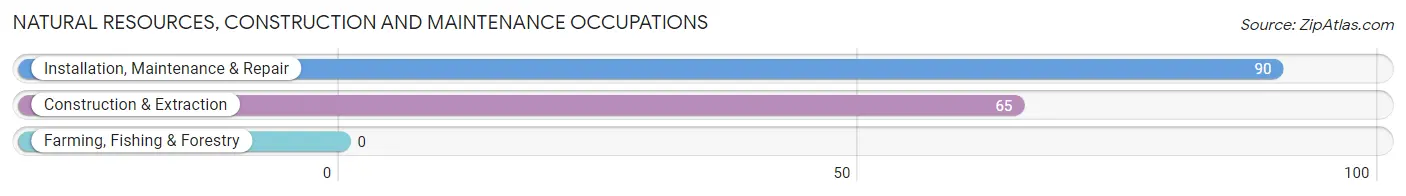
Natural Resources, Construction and Maintenance Occupations by Sex
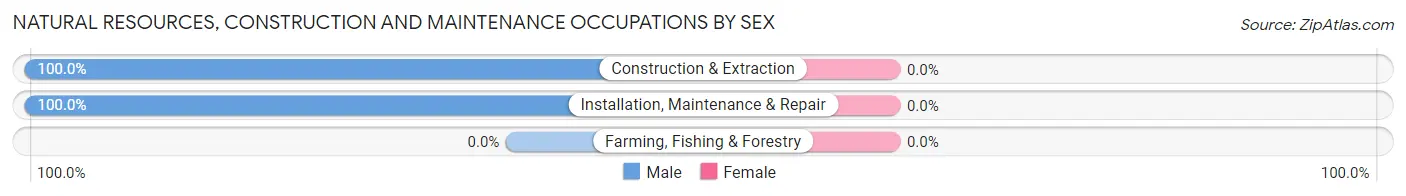
| Occupation | Male | Female |
| Farming, Fishing & Forestry | 0 (0.0%) | 0 (0.0%) |
| Construction & Extraction | 65 (100.0%) | 0 (0.0%) |
| Installation, Maintenance & Repair | 90 (100.0%) | 0 (0.0%) |
| Total (Category) | 155 (100.0%) | 0 (0.0%) |
| Total (Overall) | 685 (48.9%) | 717 (51.1%) |
Production, Transportation and Moving Occupations
The most common Production, Transportation and Moving occupations in Verona borough are Transportation (100 | 7.1%), Production (89 | 6.4%), and Material Moving (63 | 4.5%).
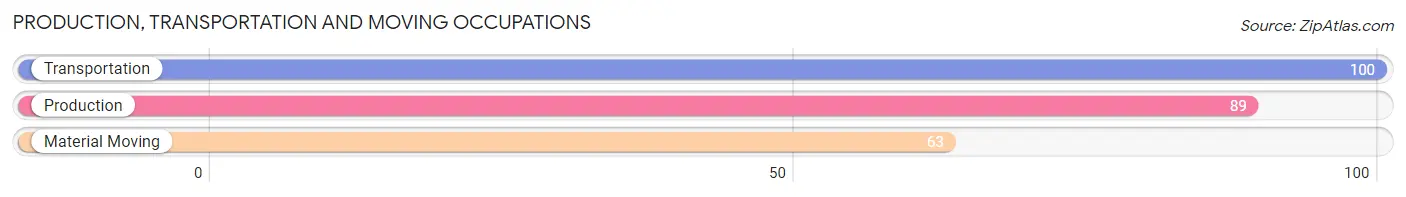
Production, Transportation and Moving Occupations by Sex
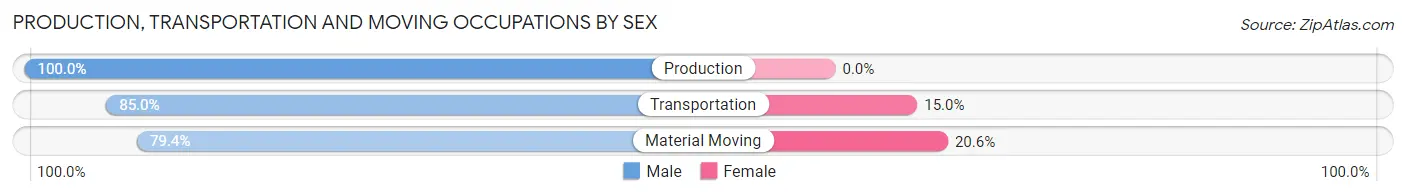
| Occupation | Male | Female |
| Production | 89 (100.0%) | 0 (0.0%) |
| Transportation | 85 (85.0%) | 15 (15.0%) |
| Material Moving | 50 (79.4%) | 13 (20.6%) |
| Total (Category) | 224 (88.9%) | 28 (11.1%) |
| Total (Overall) | 685 (48.9%) | 717 (51.1%) |
Employment Industries by Sex in Verona borough
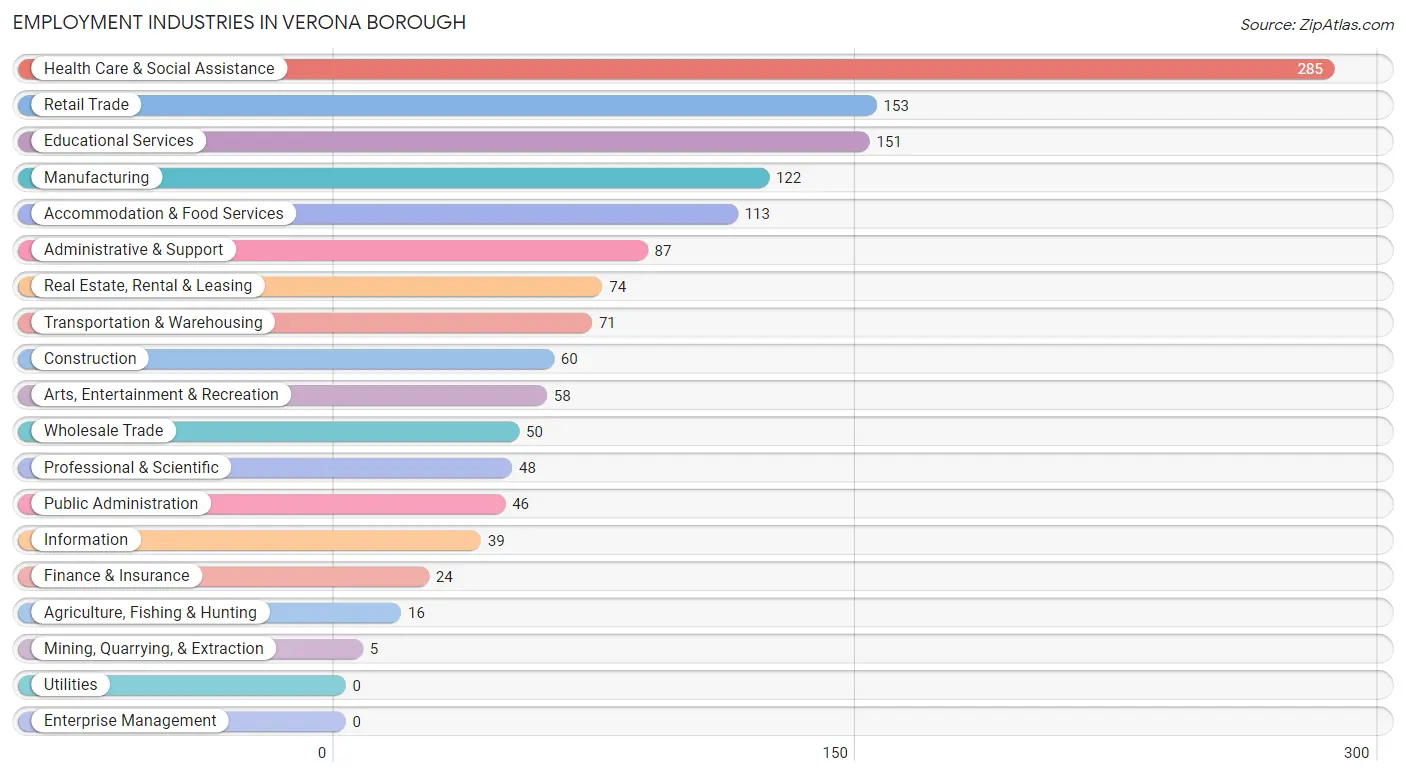
Employment Industries in Verona borough
The major employment industries in Verona borough include Health Care & Social Assistance (285 | 20.3%), Retail Trade (153 | 10.9%), Educational Services (151 | 10.8%), Manufacturing (122 | 8.7%), and Accommodation & Food Services (113 | 8.1%).
Employment Industries by Sex in Verona borough
The Verona borough industries that see more men than women are Agriculture, Fishing & Hunting (100.0%), Mining, Quarrying, & Extraction (100.0%), and Construction (100.0%), whereas the industries that tend to have a higher number of women are Information (100.0%), Accommodation & Food Services (74.3%), and Retail Trade (73.2%).
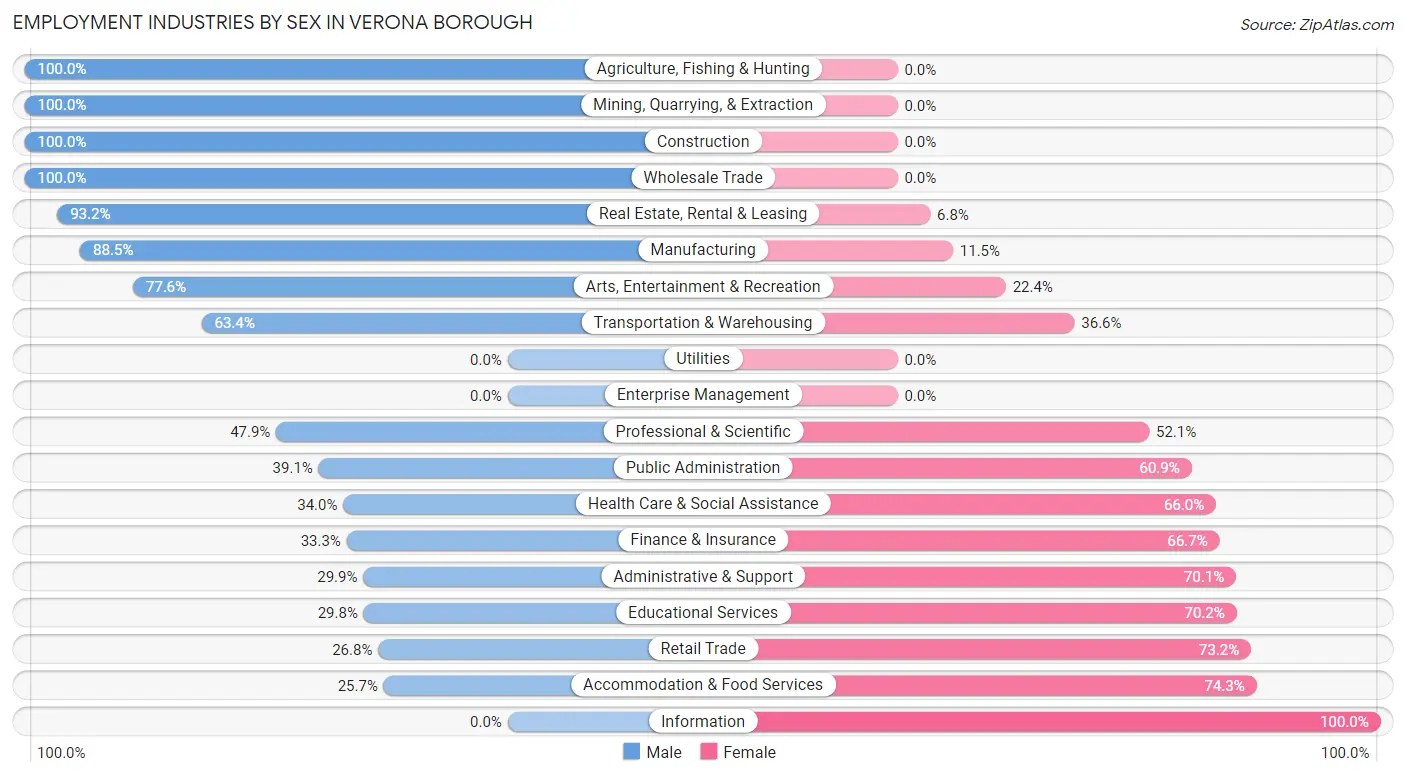
| Industry | Male | Female |
| Agriculture, Fishing & Hunting | 16 (100.0%) | 0 (0.0%) |
| Mining, Quarrying, & Extraction | 5 (100.0%) | 0 (0.0%) |
| Construction | 60 (100.0%) | 0 (0.0%) |
| Manufacturing | 108 (88.5%) | 14 (11.5%) |
| Wholesale Trade | 50 (100.0%) | 0 (0.0%) |
| Retail Trade | 41 (26.8%) | 112 (73.2%) |
| Transportation & Warehousing | 45 (63.4%) | 26 (36.6%) |
| Utilities | 0 (0.0%) | 0 (0.0%) |
| Information | 0 (0.0%) | 39 (100.0%) |
| Finance & Insurance | 8 (33.3%) | 16 (66.7%) |
| Real Estate, Rental & Leasing | 69 (93.2%) | 5 (6.8%) |
| Professional & Scientific | 23 (47.9%) | 25 (52.1%) |
| Enterprise Management | 0 (0.0%) | 0 (0.0%) |
| Administrative & Support | 26 (29.9%) | 61 (70.1%) |
| Educational Services | 45 (29.8%) | 106 (70.2%) |
| Health Care & Social Assistance | 97 (34.0%) | 188 (66.0%) |
| Arts, Entertainment & Recreation | 45 (77.6%) | 13 (22.4%) |
| Accommodation & Food Services | 29 (25.7%) | 84 (74.3%) |
| Public Administration | 18 (39.1%) | 28 (60.9%) |
| Total | 685 (48.9%) | 717 (51.1%) |
Education in Verona borough
School Enrollment in Verona borough
The most common levels of schooling among the 458 students in Verona borough are elementary school (134 | 29.3%), college / undergraduate (113 | 24.7%), and high school (112 | 24.4%).
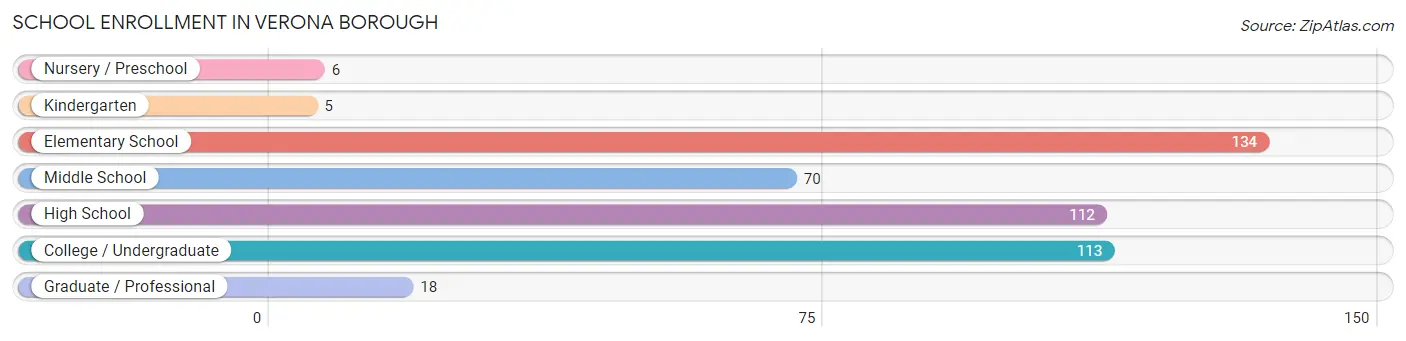
| School Level | # Students | % Students |
| Nursery / Preschool | 6 | 1.3% |
| Kindergarten | 5 | 1.1% |
| Elementary School | 134 | 29.3% |
| Middle School | 70 | 15.3% |
| High School | 112 | 24.4% |
| College / Undergraduate | 113 | 24.7% |
| Graduate / Professional | 18 | 3.9% |
| Total | 458 | 100.0% |
School Enrollment by Age by Funding Source in Verona borough
Out of a total of 458 students who are enrolled in schools in Verona borough, 37 (8.1%) attend a private institution, while the remaining 421 (91.9%) are enrolled in public schools. The age group of 20 to 24 year olds has the highest likelihood of being enrolled in private schools, with 9 (16.4% in the age bracket) enrolled. Conversely, the age group of 18 to 19 year olds has the lowest likelihood of being enrolled in a private school, with 57 (100.0% in the age bracket) attending a public institution.
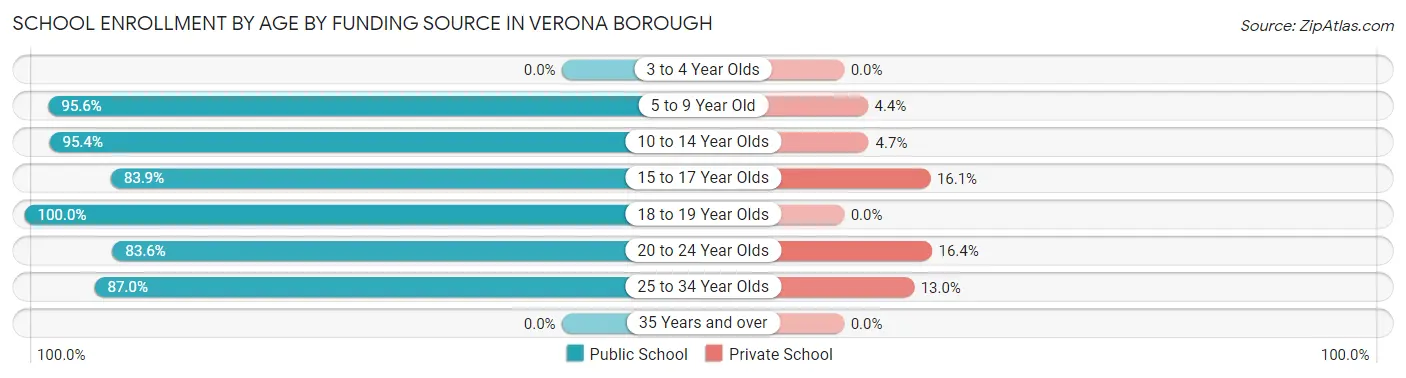
| Age Bracket | Public School | Private School |
| 3 to 4 Year Olds | 0 (0.0%) | 0 (0.0%) |
| 5 to 9 Year Old | 129 (95.6%) | 6 (4.4%) |
| 10 to 14 Year Olds | 82 (95.4%) | 4 (4.6%) |
| 15 to 17 Year Olds | 47 (83.9%) | 9 (16.1%) |
| 18 to 19 Year Olds | 57 (100.0%) | 0 (0.0%) |
| 20 to 24 Year Olds | 46 (83.6%) | 9 (16.4%) |
| 25 to 34 Year Olds | 60 (87.0%) | 9 (13.0%) |
| 35 Years and over | 0 (0.0%) | 0 (0.0%) |
| Total | 421 (91.9%) | 37 (8.1%) |
Educational Attainment by Field of Study in Verona borough
Business (110 | 23.1%), education (84 | 17.6%), communications (77 | 16.2%), science & technology (50 | 10.5%), and arts & humanities (38 | 8.0%) are the most common fields of study among 476 individuals in Verona borough who have obtained a bachelor's degree or higher.
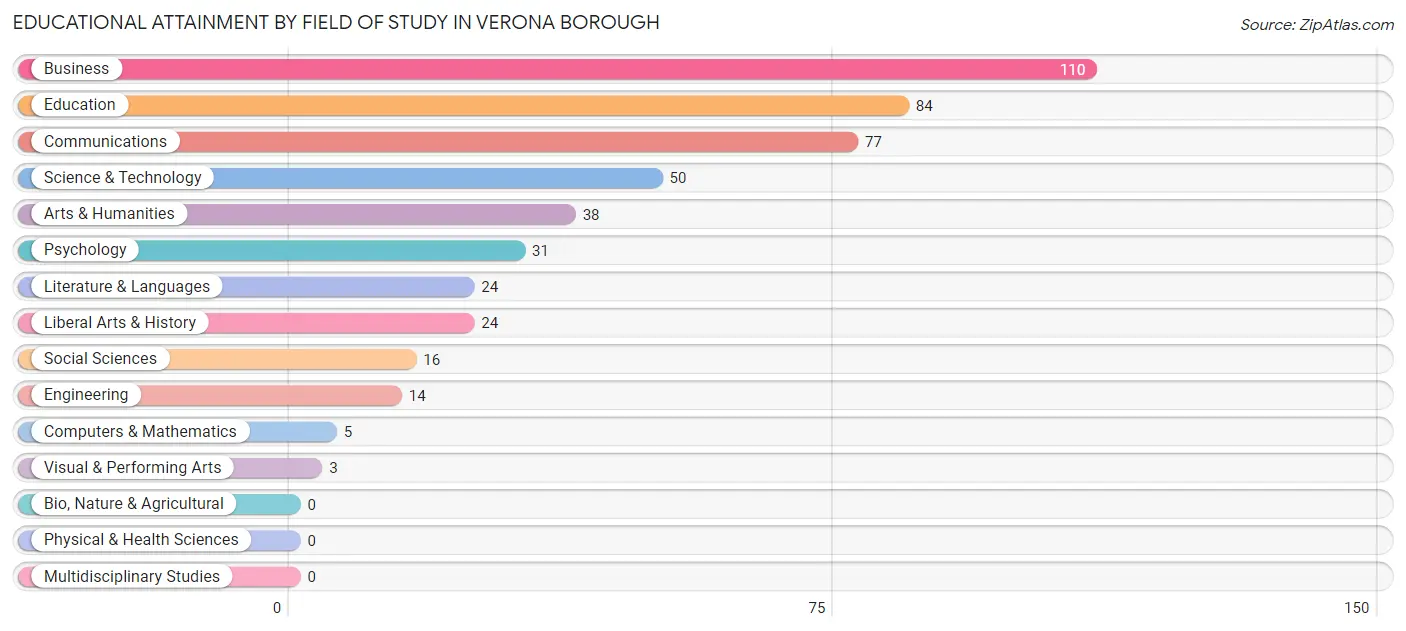
| Field of Study | # Graduates | % Graduates |
| Computers & Mathematics | 5 | 1.1% |
| Bio, Nature & Agricultural | 0 | 0.0% |
| Physical & Health Sciences | 0 | 0.0% |
| Psychology | 31 | 6.5% |
| Social Sciences | 16 | 3.4% |
| Engineering | 14 | 2.9% |
| Multidisciplinary Studies | 0 | 0.0% |
| Science & Technology | 50 | 10.5% |
| Business | 110 | 23.1% |
| Education | 84 | 17.6% |
| Literature & Languages | 24 | 5.0% |
| Liberal Arts & History | 24 | 5.0% |
| Visual & Performing Arts | 3 | 0.6% |
| Communications | 77 | 16.2% |
| Arts & Humanities | 38 | 8.0% |
| Total | 476 | 100.0% |
Transportation & Commute in Verona borough
Vehicle Availability by Sex in Verona borough
The most prevalent vehicle ownership categories in Verona borough are males with 2 vehicles (241, accounting for 37.2%) and females with 2 vehicles (213, making up 35.8%).
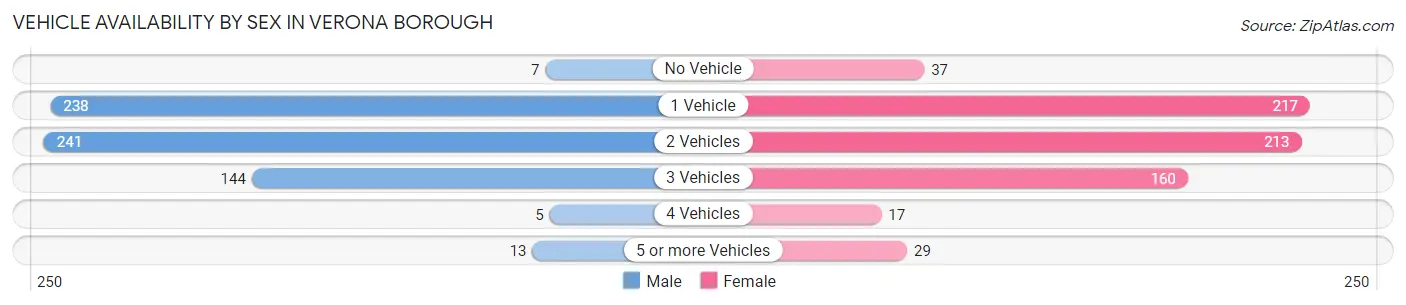
| Vehicles Available | Male | Female |
| No Vehicle | 7 (1.1%) | 37 (5.5%) |
| 1 Vehicle | 238 (36.7%) | 217 (32.2%) |
| 2 Vehicles | 241 (37.2%) | 213 (31.7%) |
| 3 Vehicles | 144 (22.2%) | 160 (23.8%) |
| 4 Vehicles | 5 (0.8%) | 17 (2.5%) |
| 5 or more Vehicles | 13 (2.0%) | 29 (4.3%) |
| Total | 648 (100.0%) | 673 (100.0%) |
Commute Time in Verona borough
The most frequently occuring commute durations in Verona borough are 10 to 14 minutes (196 commuters, 16.9%), 20 to 24 minutes (193 commuters, 16.6%), and 15 to 19 minutes (192 commuters, 16.5%).

| Commute Time | # Commuters | % Commuters |
| Less than 5 Minutes | 50 | 4.3% |
| 5 to 9 Minutes | 110 | 9.5% |
| 10 to 14 Minutes | 196 | 16.9% |
| 15 to 19 Minutes | 192 | 16.5% |
| 20 to 24 Minutes | 193 | 16.6% |
| 25 to 29 Minutes | 58 | 5.0% |
| 30 to 34 Minutes | 154 | 13.3% |
| 35 to 39 Minutes | 6 | 0.5% |
| 40 to 44 Minutes | 55 | 4.7% |
| 45 to 59 Minutes | 82 | 7.1% |
| 60 to 89 Minutes | 57 | 4.9% |
| 90 or more Minutes | 9 | 0.8% |
Commute Time by Sex in Verona borough
The most common commute times in Verona borough are 15 to 19 minutes (133 commuters, 23.7%) for males and 30 to 34 minutes (138 commuters, 22.9%) for females.
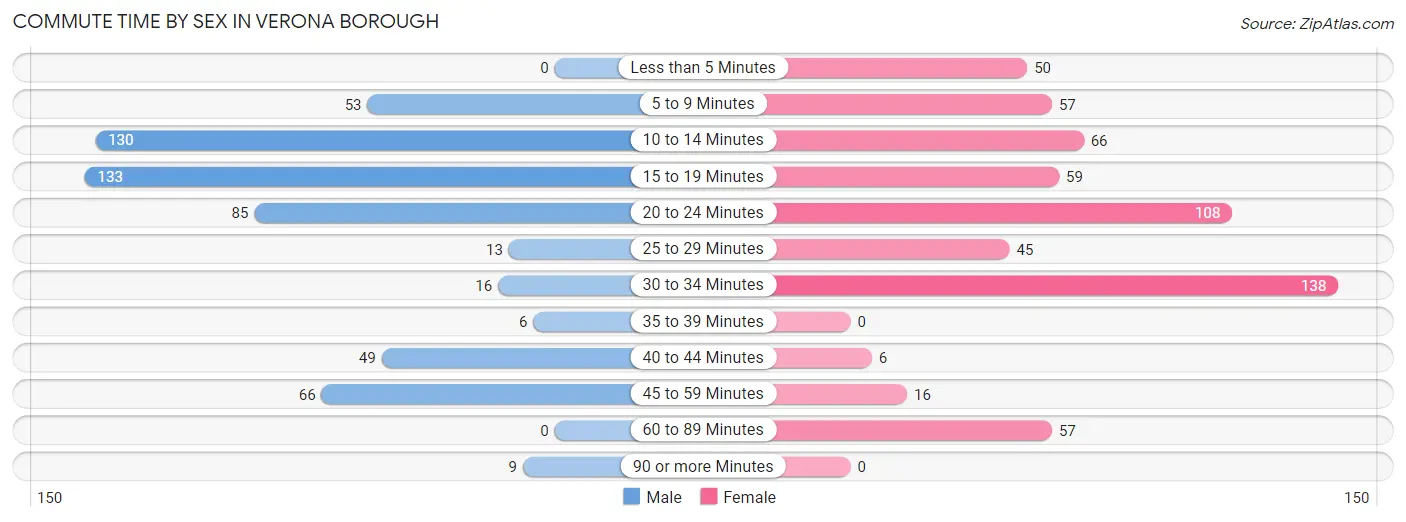
| Commute Time | Male | Female |
| Less than 5 Minutes | 0 (0.0%) | 50 (8.3%) |
| 5 to 9 Minutes | 53 (9.5%) | 57 (9.5%) |
| 10 to 14 Minutes | 130 (23.2%) | 66 (11.0%) |
| 15 to 19 Minutes | 133 (23.7%) | 59 (9.8%) |
| 20 to 24 Minutes | 85 (15.2%) | 108 (17.9%) |
| 25 to 29 Minutes | 13 (2.3%) | 45 (7.5%) |
| 30 to 34 Minutes | 16 (2.9%) | 138 (22.9%) |
| 35 to 39 Minutes | 6 (1.1%) | 0 (0.0%) |
| 40 to 44 Minutes | 49 (8.7%) | 6 (1.0%) |
| 45 to 59 Minutes | 66 (11.8%) | 16 (2.7%) |
| 60 to 89 Minutes | 0 (0.0%) | 57 (9.5%) |
| 90 or more Minutes | 9 (1.6%) | 0 (0.0%) |
Time of Departure to Work by Sex in Verona borough
The most frequent times of departure to work in Verona borough are 4:00 PM to 11:59 PM (100, 17.9%) for males and 8:00 AM to 8:29 AM (125, 20.8%) for females.
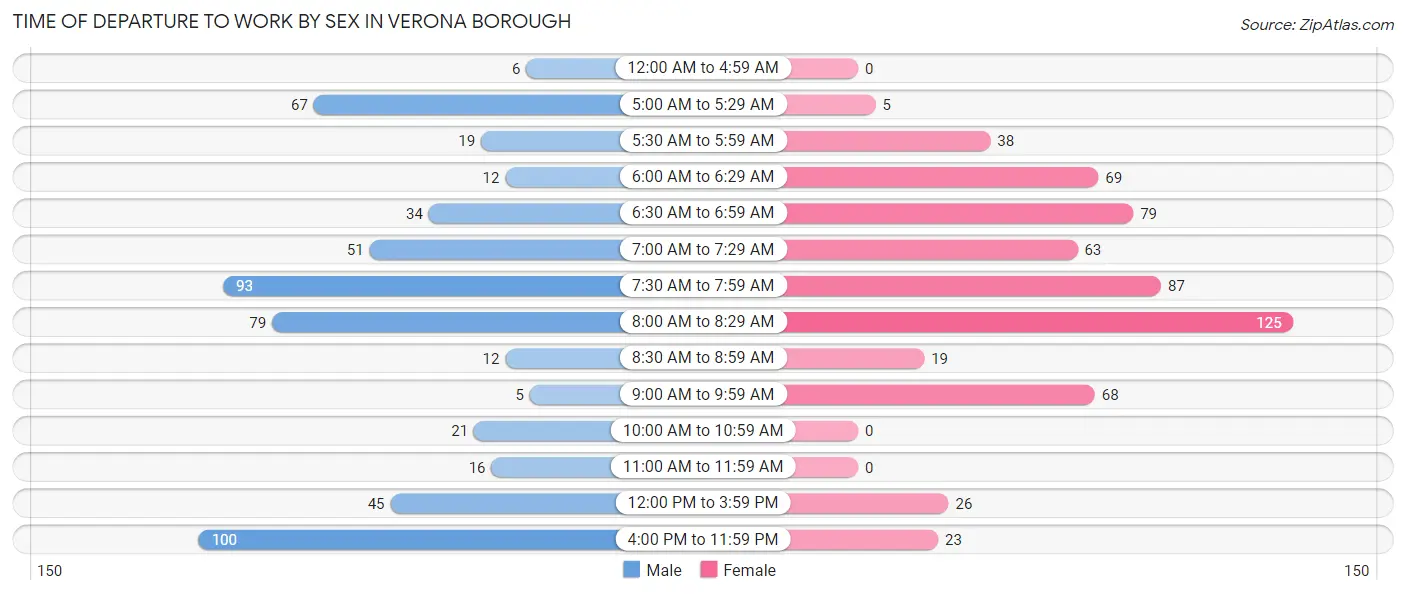
| Time of Departure | Male | Female |
| 12:00 AM to 4:59 AM | 6 (1.1%) | 0 (0.0%) |
| 5:00 AM to 5:29 AM | 67 (12.0%) | 5 (0.8%) |
| 5:30 AM to 5:59 AM | 19 (3.4%) | 38 (6.3%) |
| 6:00 AM to 6:29 AM | 12 (2.1%) | 69 (11.5%) |
| 6:30 AM to 6:59 AM | 34 (6.1%) | 79 (13.1%) |
| 7:00 AM to 7:29 AM | 51 (9.1%) | 63 (10.5%) |
| 7:30 AM to 7:59 AM | 93 (16.6%) | 87 (14.4%) |
| 8:00 AM to 8:29 AM | 79 (14.1%) | 125 (20.8%) |
| 8:30 AM to 8:59 AM | 12 (2.1%) | 19 (3.2%) |
| 9:00 AM to 9:59 AM | 5 (0.9%) | 68 (11.3%) |
| 10:00 AM to 10:59 AM | 21 (3.7%) | 0 (0.0%) |
| 11:00 AM to 11:59 AM | 16 (2.9%) | 0 (0.0%) |
| 12:00 PM to 3:59 PM | 45 (8.0%) | 26 (4.3%) |
| 4:00 PM to 11:59 PM | 100 (17.9%) | 23 (3.8%) |
| Total | 560 (100.0%) | 602 (100.0%) |
Housing Occupancy in Verona borough
Occupancy by Ownership in Verona borough
Of the total 1,208 dwellings in Verona borough, owner-occupied units account for 486 (40.2%), while renter-occupied units make up 722 (59.8%).
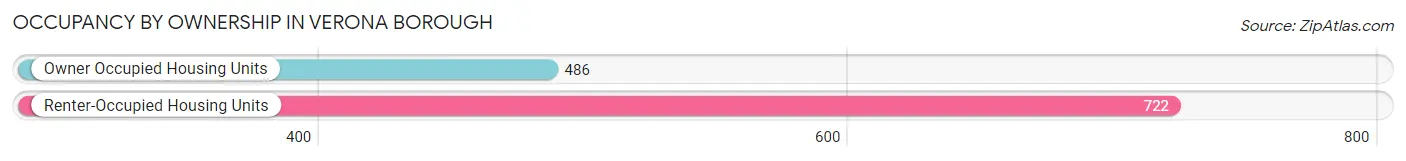
| Occupancy | # Housing Units | % Housing Units |
| Owner Occupied Housing Units | 486 | 40.2% |
| Renter-Occupied Housing Units | 722 | 59.8% |
| Total Occupied Housing Units | 1,208 | 100.0% |
Occupancy by Household Size in Verona borough
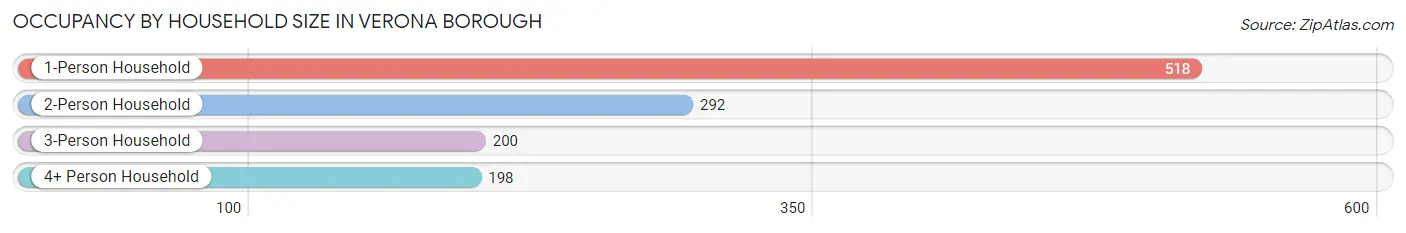
| Household Size | # Housing Units | % Housing Units |
| 1-Person Household | 518 | 42.9% |
| 2-Person Household | 292 | 24.2% |
| 3-Person Household | 200 | 16.6% |
| 4+ Person Household | 198 | 16.4% |
| Total Housing Units | 1,208 | 100.0% |
Occupancy by Ownership by Household Size in Verona borough
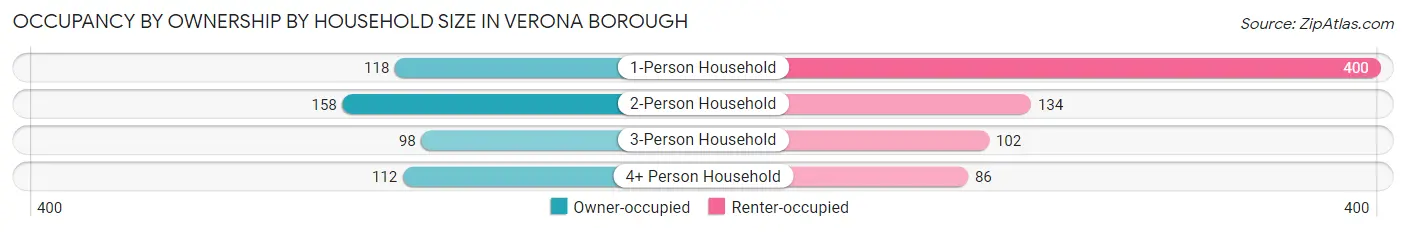
| Household Size | Owner-occupied | Renter-occupied |
| 1-Person Household | 118 (22.8%) | 400 (77.2%) |
| 2-Person Household | 158 (54.1%) | 134 (45.9%) |
| 3-Person Household | 98 (49.0%) | 102 (51.0%) |
| 4+ Person Household | 112 (56.6%) | 86 (43.4%) |
| Total Housing Units | 486 (40.2%) | 722 (59.8%) |
Occupancy by Educational Attainment in Verona borough
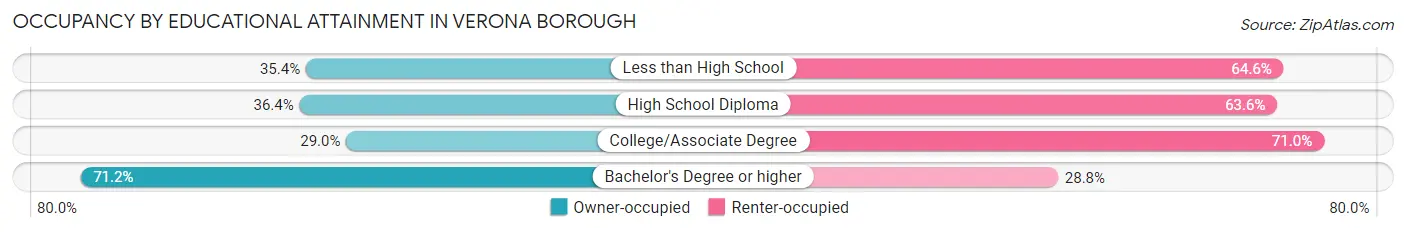
| Household Size | Owner-occupied | Renter-occupied |
| Less than High School | 52 (35.4%) | 95 (64.6%) |
| High School Diploma | 147 (36.4%) | 257 (63.6%) |
| College/Associate Degree | 124 (29.0%) | 304 (71.0%) |
| Bachelor's Degree or higher | 163 (71.2%) | 66 (28.8%) |
Occupancy by Age of Householder in Verona borough
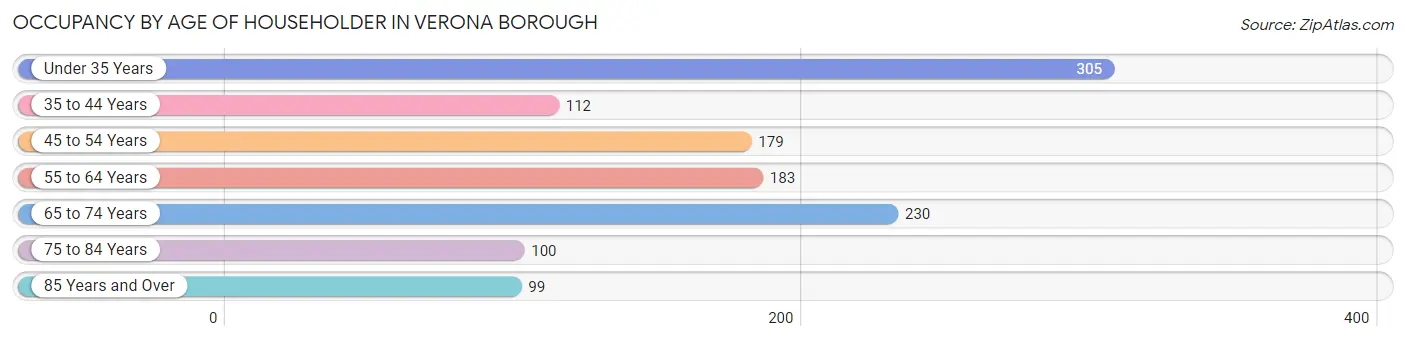
| Age Bracket | # Households | % Households |
| Under 35 Years | 305 | 25.3% |
| 35 to 44 Years | 112 | 9.3% |
| 45 to 54 Years | 179 | 14.8% |
| 55 to 64 Years | 183 | 15.1% |
| 65 to 74 Years | 230 | 19.0% |
| 75 to 84 Years | 100 | 8.3% |
| 85 Years and Over | 99 | 8.2% |
| Total | 1,208 | 100.0% |
Housing Finances in Verona borough
Median Income by Occupancy in Verona borough
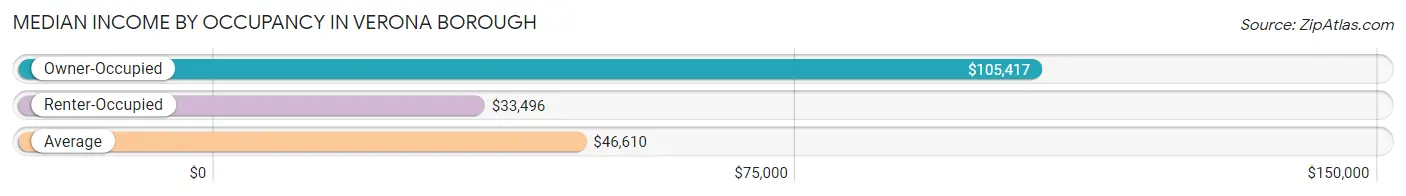
| Occupancy Type | # Households | Median Income |
| Owner-Occupied | 486 (40.2%) | $105,417 |
| Renter-Occupied | 722 (59.8%) | $33,496 |
| Average | 1,208 (100.0%) | $46,610 |
Occupancy by Householder Income Bracket in Verona borough
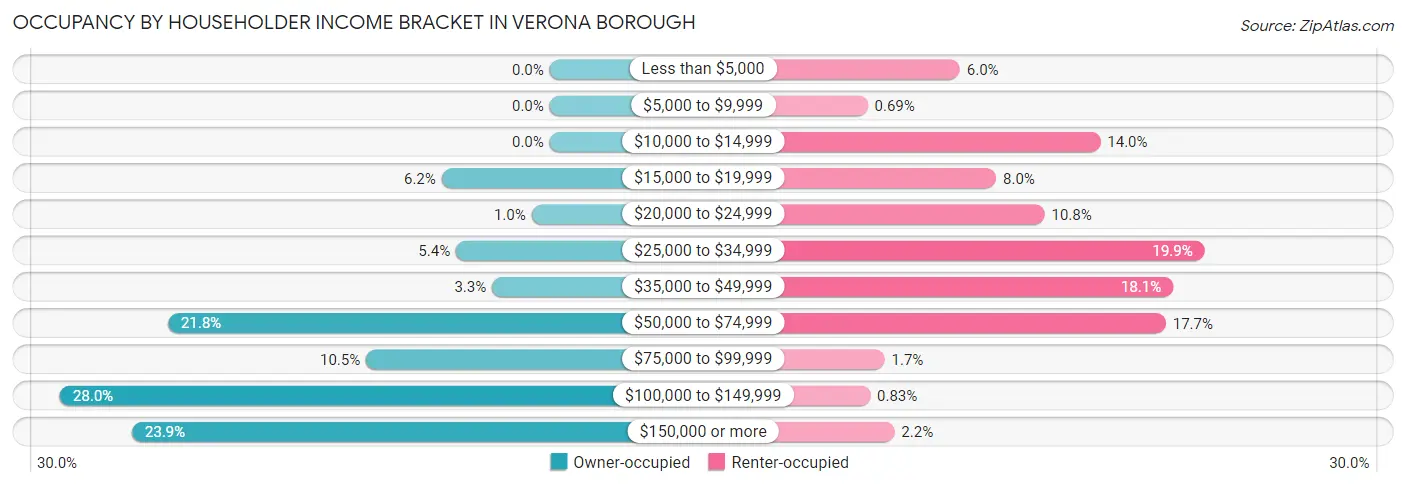
| Income Bracket | Owner-occupied | Renter-occupied |
| Less than $5,000 | 0 (0.0%) | 43 (6.0%) |
| $5,000 to $9,999 | 0 (0.0%) | 5 (0.7%) |
| $10,000 to $14,999 | 0 (0.0%) | 101 (14.0%) |
| $15,000 to $19,999 | 30 (6.2%) | 58 (8.0%) |
| $20,000 to $24,999 | 5 (1.0%) | 78 (10.8%) |
| $25,000 to $34,999 | 26 (5.3%) | 144 (19.9%) |
| $35,000 to $49,999 | 16 (3.3%) | 131 (18.1%) |
| $50,000 to $74,999 | 106 (21.8%) | 128 (17.7%) |
| $75,000 to $99,999 | 51 (10.5%) | 12 (1.7%) |
| $100,000 to $149,999 | 136 (28.0%) | 6 (0.8%) |
| $150,000 or more | 116 (23.9%) | 16 (2.2%) |
| Total | 486 (100.0%) | 722 (100.0%) |
Monthly Housing Cost Tiers in Verona borough
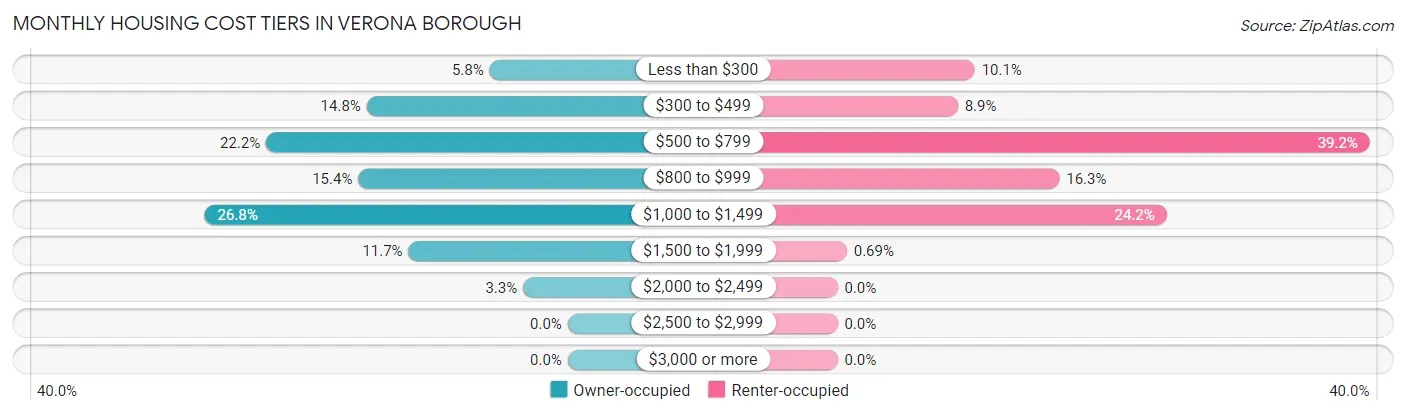
| Monthly Cost | Owner-occupied | Renter-occupied |
| Less than $300 | 28 (5.8%) | 73 (10.1%) |
| $300 to $499 | 72 (14.8%) | 64 (8.9%) |
| $500 to $799 | 108 (22.2%) | 283 (39.2%) |
| $800 to $999 | 75 (15.4%) | 118 (16.3%) |
| $1,000 to $1,499 | 130 (26.8%) | 175 (24.2%) |
| $1,500 to $1,999 | 57 (11.7%) | 5 (0.7%) |
| $2,000 to $2,499 | 16 (3.3%) | 0 (0.0%) |
| $2,500 to $2,999 | 0 (0.0%) | 0 (0.0%) |
| $3,000 or more | 0 (0.0%) | 0 (0.0%) |
| Total | 486 (100.0%) | 722 (100.0%) |
Physical Housing Characteristics in Verona borough
Housing Structures in Verona borough
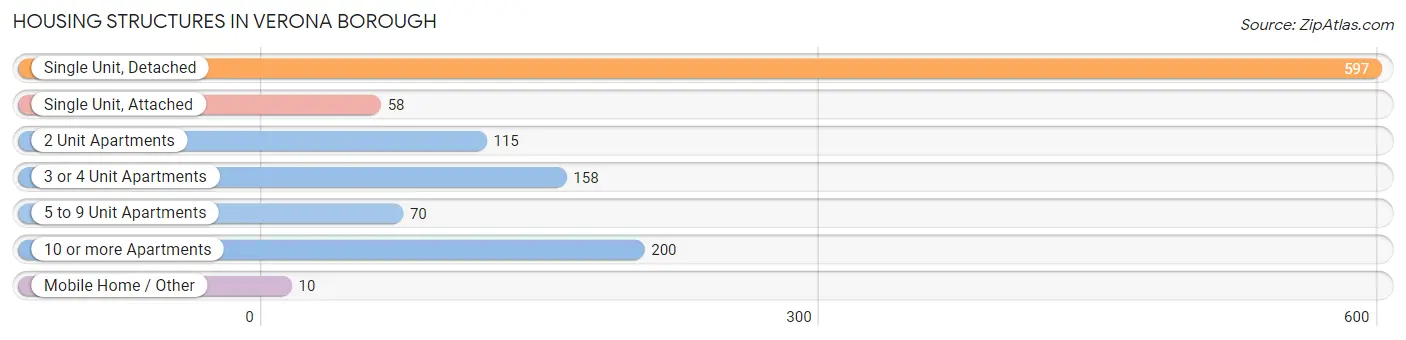
| Structure Type | # Housing Units | % Housing Units |
| Single Unit, Detached | 597 | 49.4% |
| Single Unit, Attached | 58 | 4.8% |
| 2 Unit Apartments | 115 | 9.5% |
| 3 or 4 Unit Apartments | 158 | 13.1% |
| 5 to 9 Unit Apartments | 70 | 5.8% |
| 10 or more Apartments | 200 | 16.6% |
| Mobile Home / Other | 10 | 0.8% |
| Total | 1,208 | 100.0% |
Housing Structures by Occupancy in Verona borough
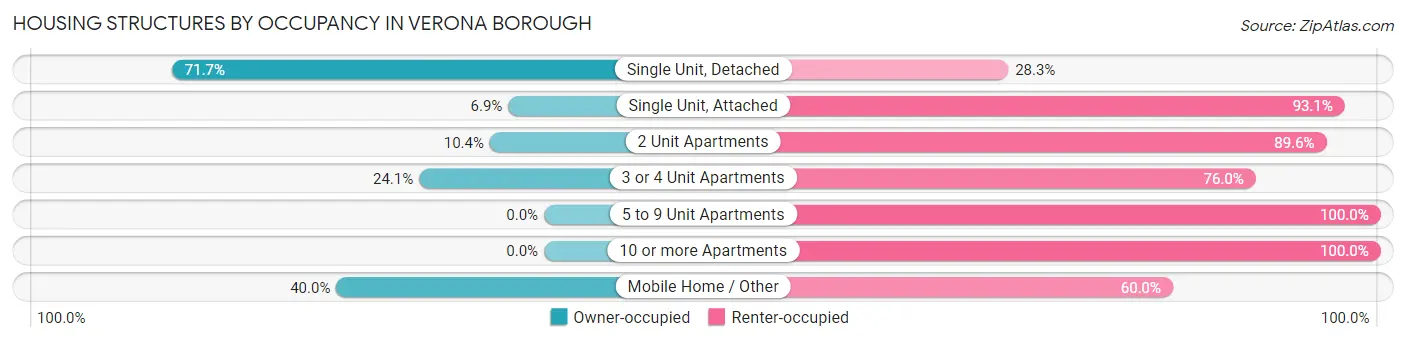
| Structure Type | Owner-occupied | Renter-occupied |
| Single Unit, Detached | 428 (71.7%) | 169 (28.3%) |
| Single Unit, Attached | 4 (6.9%) | 54 (93.1%) |
| 2 Unit Apartments | 12 (10.4%) | 103 (89.6%) |
| 3 or 4 Unit Apartments | 38 (24.0%) | 120 (75.9%) |
| 5 to 9 Unit Apartments | 0 (0.0%) | 70 (100.0%) |
| 10 or more Apartments | 0 (0.0%) | 200 (100.0%) |
| Mobile Home / Other | 4 (40.0%) | 6 (60.0%) |
| Total | 486 (40.2%) | 722 (59.8%) |
Housing Structures by Number of Rooms in Verona borough
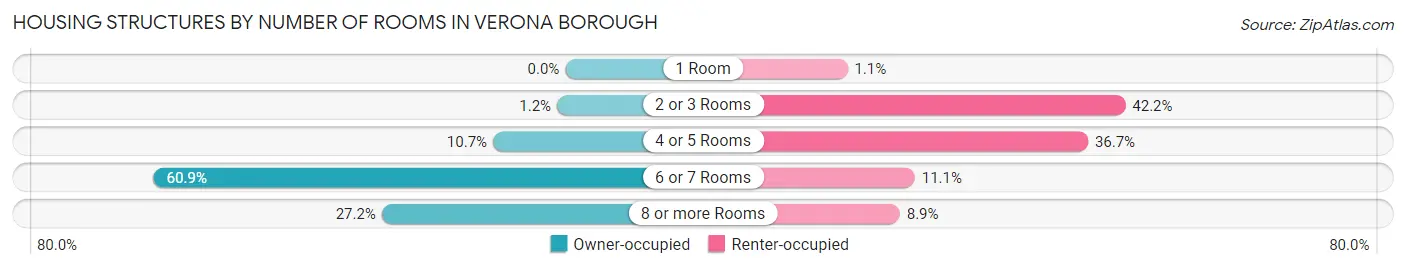
| Number of Rooms | Owner-occupied | Renter-occupied |
| 1 Room | 0 (0.0%) | 8 (1.1%) |
| 2 or 3 Rooms | 6 (1.2%) | 305 (42.2%) |
| 4 or 5 Rooms | 52 (10.7%) | 265 (36.7%) |
| 6 or 7 Rooms | 296 (60.9%) | 80 (11.1%) |
| 8 or more Rooms | 132 (27.2%) | 64 (8.9%) |
| Total | 486 (100.0%) | 722 (100.0%) |
Housing Structure by Heating Type in Verona borough
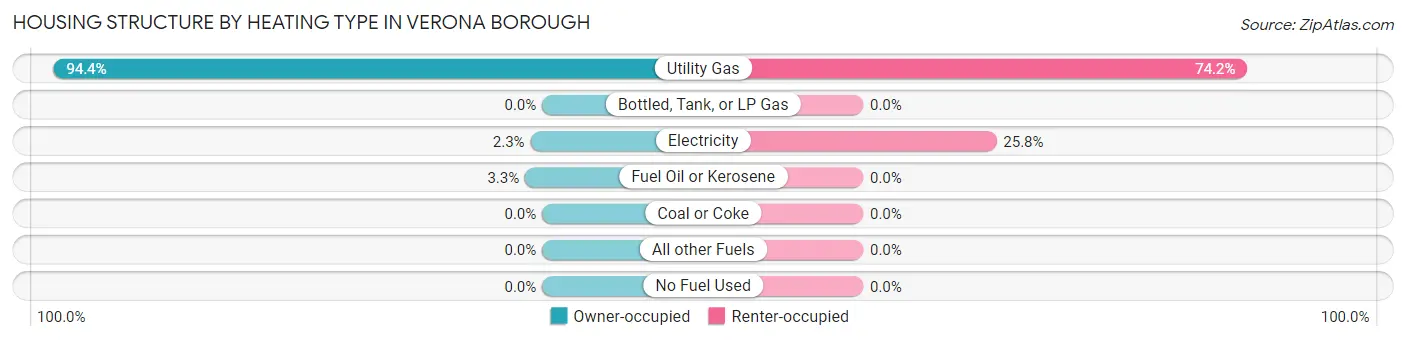
| Heating Type | Owner-occupied | Renter-occupied |
| Utility Gas | 459 (94.4%) | 536 (74.2%) |
| Bottled, Tank, or LP Gas | 0 (0.0%) | 0 (0.0%) |
| Electricity | 11 (2.3%) | 186 (25.8%) |
| Fuel Oil or Kerosene | 16 (3.3%) | 0 (0.0%) |
| Coal or Coke | 0 (0.0%) | 0 (0.0%) |
| All other Fuels | 0 (0.0%) | 0 (0.0%) |
| No Fuel Used | 0 (0.0%) | 0 (0.0%) |
| Total | 486 (100.0%) | 722 (100.0%) |
Household Vehicle Usage in Verona borough
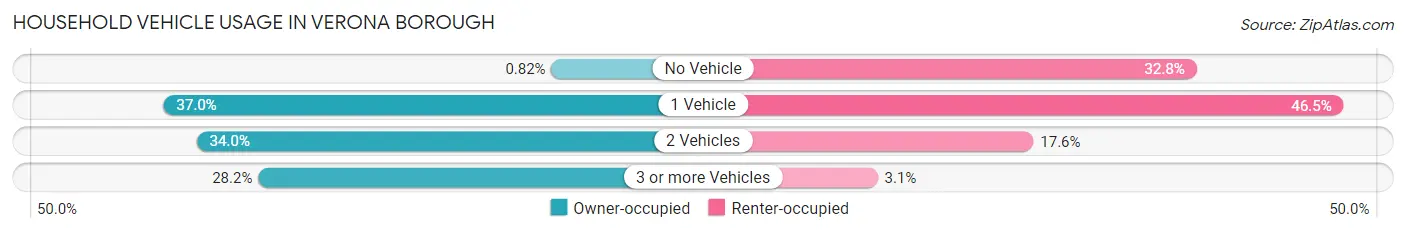
| Vehicles per Household | Owner-occupied | Renter-occupied |
| No Vehicle | 4 (0.8%) | 237 (32.8%) |
| 1 Vehicle | 180 (37.0%) | 336 (46.5%) |
| 2 Vehicles | 165 (34.0%) | 127 (17.6%) |
| 3 or more Vehicles | 137 (28.2%) | 22 (3.0%) |
| Total | 486 (100.0%) | 722 (100.0%) |
Real Estate & Mortgages in Verona borough
Real Estate and Mortgage Overview in Verona borough
| Characteristic | Without Mortgage | With Mortgage |
| Housing Units | 213 | 273 |
| Median Property Value | $134,600 | $128,800 |
| Median Household Income | $69,656 | $86 |
| Monthly Housing Costs | $511 | $0 |
| Real Estate Taxes | $1,660 | $4 |
Property Value by Mortgage Status in Verona borough
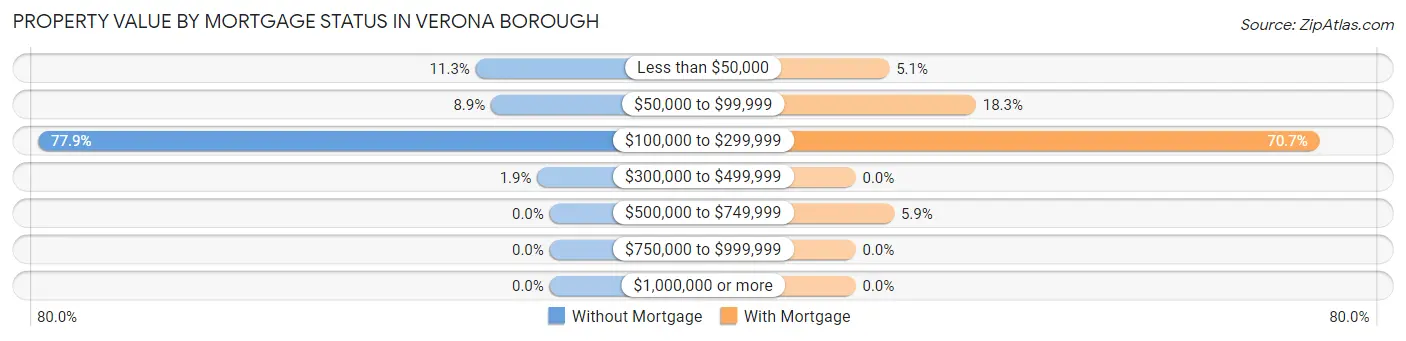
| Property Value | Without Mortgage | With Mortgage |
| Less than $50,000 | 24 (11.3%) | 14 (5.1%) |
| $50,000 to $99,999 | 19 (8.9%) | 50 (18.3%) |
| $100,000 to $299,999 | 166 (77.9%) | 193 (70.7%) |
| $300,000 to $499,999 | 4 (1.9%) | 0 (0.0%) |
| $500,000 to $749,999 | 0 (0.0%) | 16 (5.9%) |
| $750,000 to $999,999 | 0 (0.0%) | 0 (0.0%) |
| $1,000,000 or more | 0 (0.0%) | 0 (0.0%) |
| Total | 213 (100.0%) | 273 (100.0%) |
Household Income by Mortgage Status in Verona borough
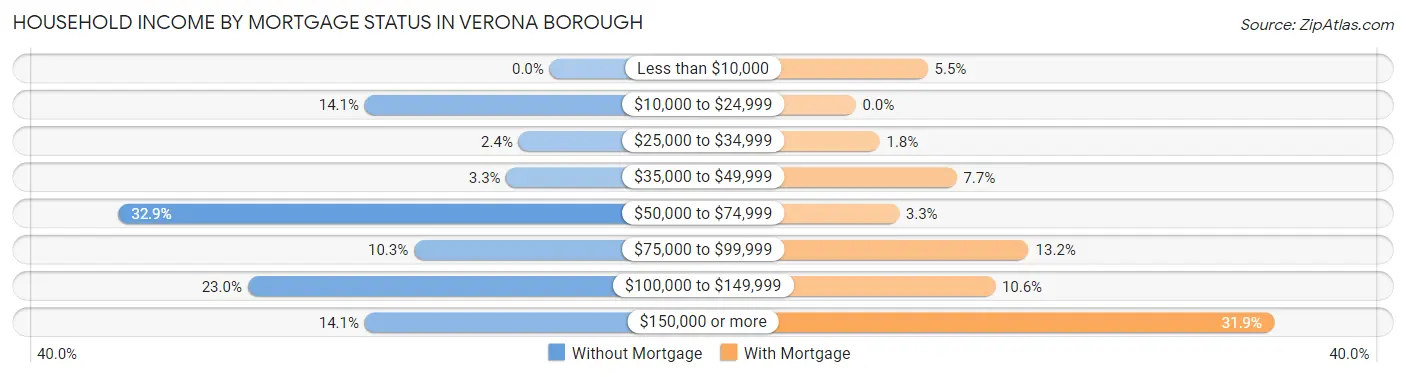
| Household Income | Without Mortgage | With Mortgage |
| Less than $10,000 | 0 (0.0%) | 15 (5.5%) |
| $10,000 to $24,999 | 30 (14.1%) | 0 (0.0%) |
| $25,000 to $34,999 | 5 (2.4%) | 5 (1.8%) |
| $35,000 to $49,999 | 7 (3.3%) | 21 (7.7%) |
| $50,000 to $74,999 | 70 (32.9%) | 9 (3.3%) |
| $75,000 to $99,999 | 22 (10.3%) | 36 (13.2%) |
| $100,000 to $149,999 | 49 (23.0%) | 29 (10.6%) |
| $150,000 or more | 30 (14.1%) | 87 (31.9%) |
| Total | 213 (100.0%) | 273 (100.0%) |
Property Value to Household Income Ratio in Verona borough
| Value-to-Income Ratio | Without Mortgage | With Mortgage |
| Less than 2.0x | 120 (56.3%) | 117,375 (42,994.5%) |
| 2.0x to 2.9x | 44 (20.7%) | 220 (80.6%) |
| 3.0x to 3.9x | 11 (5.2%) | 21 (7.7%) |
| 4.0x or more | 38 (17.8%) | 16 (5.9%) |
| Total | 213 (100.0%) | 273 (100.0%) |
Real Estate Taxes by Mortgage Status in Verona borough
| Property Taxes | Without Mortgage | With Mortgage |
| Less than $800 | 79 (37.1%) | 0 (0.0%) |
| $800 to $1,499 | 7 (3.3%) | 14 (5.1%) |
| $800 to $1,499 | 127 (59.6%) | 58 (21.2%) |
| Total | 213 (100.0%) | 273 (100.0%) |
Health & Disability in Verona borough
Health Insurance Coverage by Age in Verona borough
| Age Bracket | With Coverage | Without Coverage |
| Under 6 Years | 166 (100.0%) | 0 (0.0%) |
| 6 to 18 Years | 365 (100.0%) | 0 (0.0%) |
| 19 to 25 Years | 210 (97.7%) | 5 (2.3%) |
| 26 to 34 Years | 371 (83.6%) | 73 (16.4%) |
| 35 to 44 Years | 258 (100.0%) | 0 (0.0%) |
| 45 to 54 Years | 255 (94.1%) | 16 (5.9%) |
| 55 to 64 Years | 347 (89.2%) | 42 (10.8%) |
| 65 to 74 Years | 293 (100.0%) | 0 (0.0%) |
| 75 Years and older | 228 (100.0%) | 0 (0.0%) |
| Total | 2,493 (94.8%) | 136 (5.2%) |
Health Insurance Coverage by Citizenship Status in Verona borough
| Citizenship Status | With Coverage | Without Coverage |
| Native Born | 166 (100.0%) | 0 (0.0%) |
| Foreign Born, Citizen | 365 (100.0%) | 0 (0.0%) |
| Foreign Born, not a Citizen | 210 (97.7%) | 5 (2.3%) |
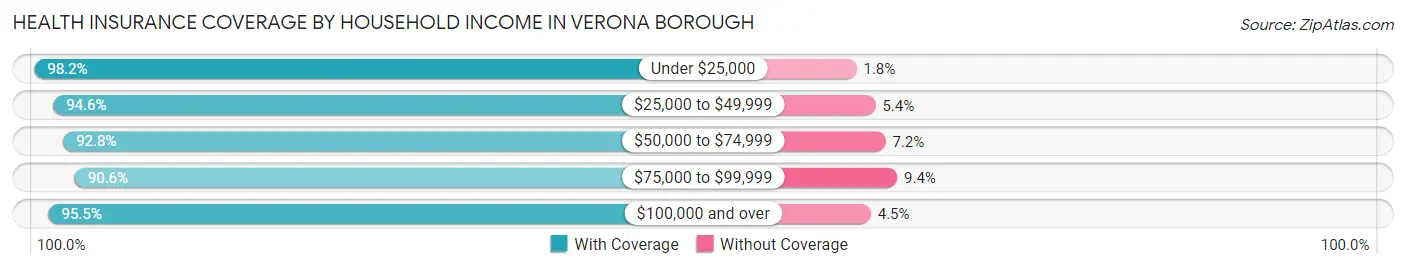
Health Insurance Coverage by Household Income in Verona borough
| Household Income | With Coverage | Without Coverage |
| Under $25,000 | 378 (98.2%) | 7 (1.8%) |
| $25,000 to $49,999 | 564 (94.6%) | 32 (5.4%) |
| $50,000 to $74,999 | 551 (92.8%) | 43 (7.2%) |
| $75,000 to $99,999 | 125 (90.6%) | 13 (9.4%) |
| $100,000 and over | 872 (95.5%) | 41 (4.5%) |
Public vs Private Health Insurance Coverage by Age in Verona borough
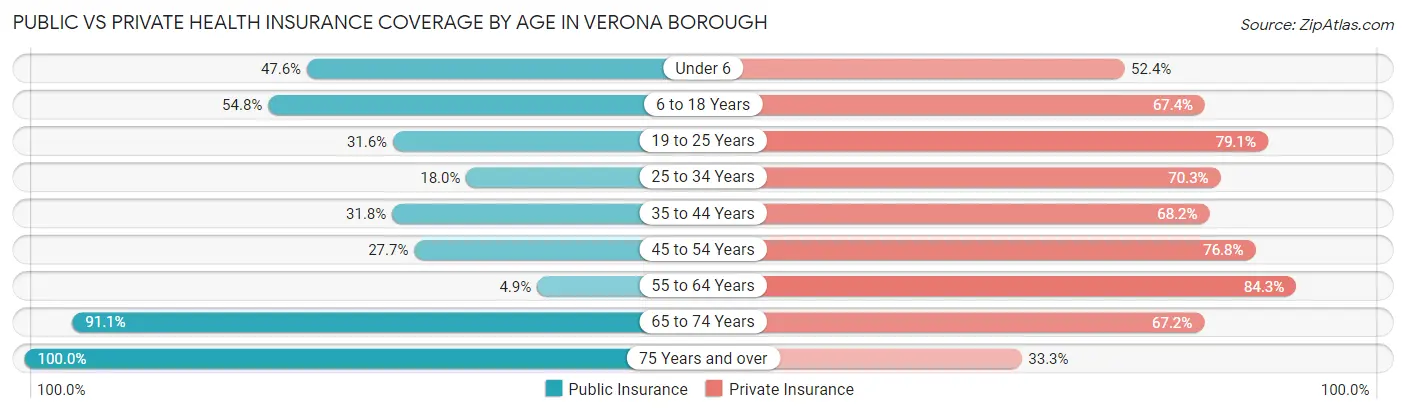
| Age Bracket | Public Insurance | Private Insurance |
| Under 6 | 79 (47.6%) | 87 (52.4%) |
| 6 to 18 Years | 200 (54.8%) | 246 (67.4%) |
| 19 to 25 Years | 68 (31.6%) | 170 (79.1%) |
| 25 to 34 Years | 80 (18.0%) | 312 (70.3%) |
| 35 to 44 Years | 82 (31.8%) | 176 (68.2%) |
| 45 to 54 Years | 75 (27.7%) | 208 (76.7%) |
| 55 to 64 Years | 19 (4.9%) | 328 (84.3%) |
| 65 to 74 Years | 267 (91.1%) | 197 (67.2%) |
| 75 Years and over | 228 (100.0%) | 76 (33.3%) |
| Total | 1,098 (41.8%) | 1,800 (68.5%) |
Disability Status by Sex by Age in Verona borough
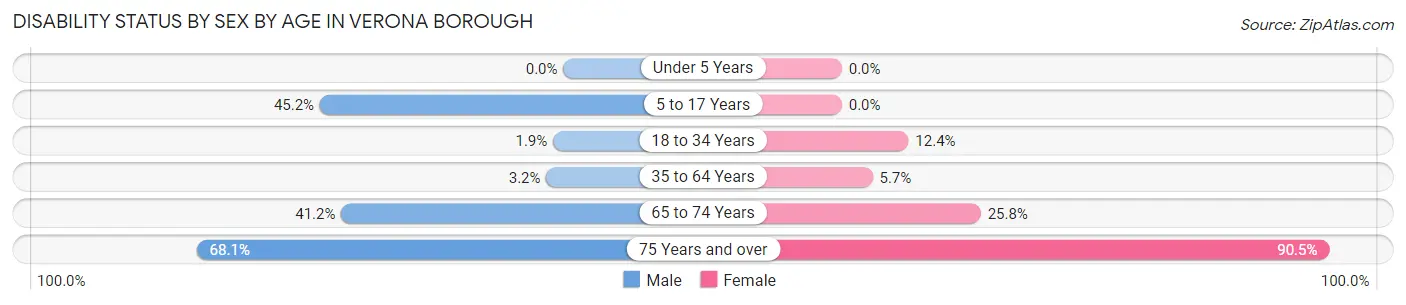
| Age Bracket | Male | Female |
| Under 5 Years | 0 (0.0%) | 0 (0.0%) |
| 5 to 17 Years | 89 (45.2%) | 0 (0.0%) |
| 18 to 34 Years | 5 (1.9%) | 56 (12.4%) |
| 35 to 64 Years | 14 (3.2%) | 27 (5.7%) |
| 65 to 74 Years | 68 (41.2%) | 33 (25.8%) |
| 75 Years and over | 98 (68.1%) | 76 (90.5%) |
Disability Class by Sex by Age in Verona borough
Disability Class: Hearing Difficulty
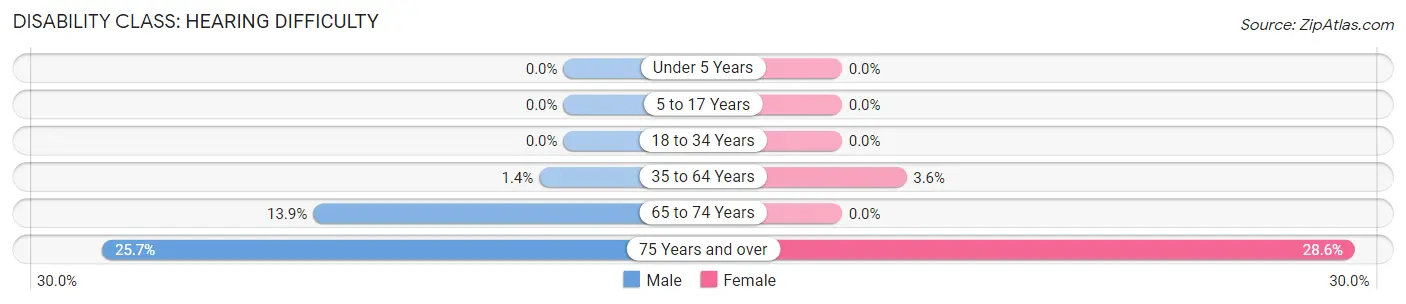
| Age Bracket | Male | Female |
| Under 5 Years | 0 (0.0%) | 0 (0.0%) |
| 5 to 17 Years | 0 (0.0%) | 0 (0.0%) |
| 18 to 34 Years | 0 (0.0%) | 0 (0.0%) |
| 35 to 64 Years | 6 (1.3%) | 17 (3.6%) |
| 65 to 74 Years | 23 (13.9%) | 0 (0.0%) |
| 75 Years and over | 37 (25.7%) | 24 (28.6%) |
Disability Class: Vision Difficulty
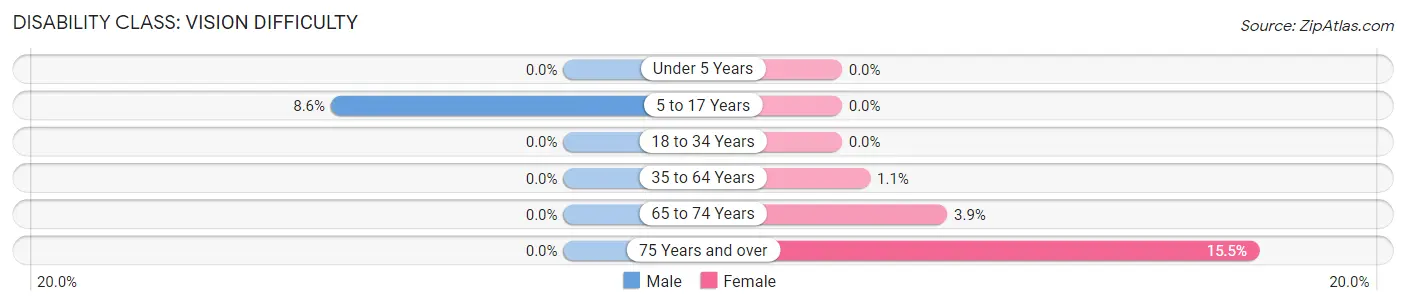
| Age Bracket | Male | Female |
| Under 5 Years | 0 (0.0%) | 0 (0.0%) |
| 5 to 17 Years | 17 (8.6%) | 0 (0.0%) |
| 18 to 34 Years | 0 (0.0%) | 0 (0.0%) |
| 35 to 64 Years | 0 (0.0%) | 5 (1.1%) |
| 65 to 74 Years | 0 (0.0%) | 5 (3.9%) |
| 75 Years and over | 0 (0.0%) | 13 (15.5%) |
Disability Class: Cognitive Difficulty
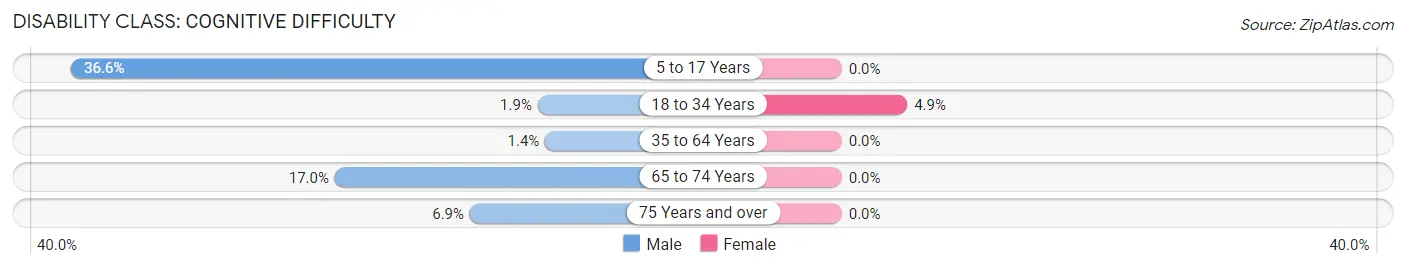
| Age Bracket | Male | Female |
| 5 to 17 Years | 72 (36.5%) | 0 (0.0%) |
| 18 to 34 Years | 5 (1.9%) | 22 (4.9%) |
| 35 to 64 Years | 6 (1.3%) | 0 (0.0%) |
| 65 to 74 Years | 28 (17.0%) | 0 (0.0%) |
| 75 Years and over | 10 (6.9%) | 0 (0.0%) |
Disability Class: Ambulatory Difficulty
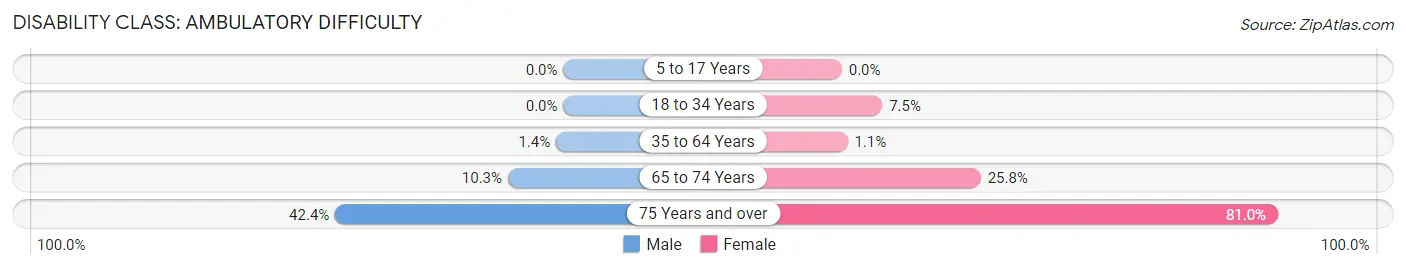
| Age Bracket | Male | Female |
| 5 to 17 Years | 0 (0.0%) | 0 (0.0%) |
| 18 to 34 Years | 0 (0.0%) | 34 (7.5%) |
| 35 to 64 Years | 6 (1.3%) | 5 (1.1%) |
| 65 to 74 Years | 17 (10.3%) | 33 (25.8%) |
| 75 Years and over | 61 (42.4%) | 68 (80.9%) |
Disability Class: Self-Care Difficulty
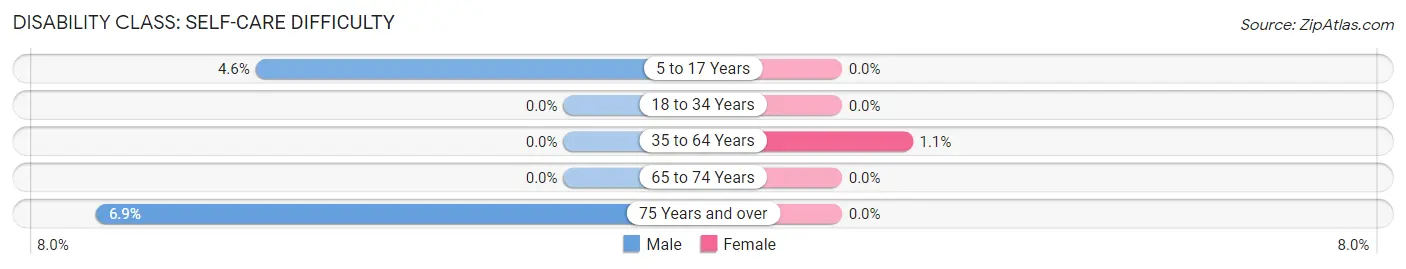
| Age Bracket | Male | Female |
| 5 to 17 Years | 9 (4.6%) | 0 (0.0%) |
| 18 to 34 Years | 0 (0.0%) | 0 (0.0%) |
| 35 to 64 Years | 0 (0.0%) | 5 (1.1%) |
| 65 to 74 Years | 0 (0.0%) | 0 (0.0%) |
| 75 Years and over | 10 (6.9%) | 0 (0.0%) |
Technology Access in Verona borough
Computing Device Access in Verona borough
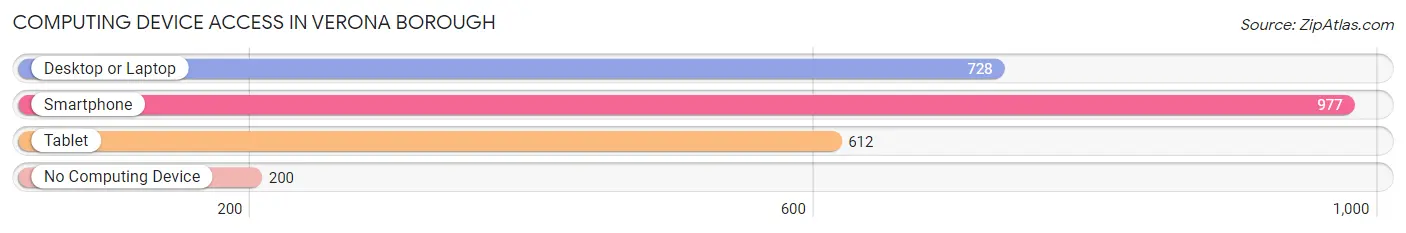
| Device Type | # Households | % Households |
| Desktop or Laptop | 728 | 60.3% |
| Smartphone | 977 | 80.9% |
| Tablet | 612 | 50.7% |
| No Computing Device | 200 | 16.6% |
| Total | 1,208 | 100.0% |
Internet Access in Verona borough
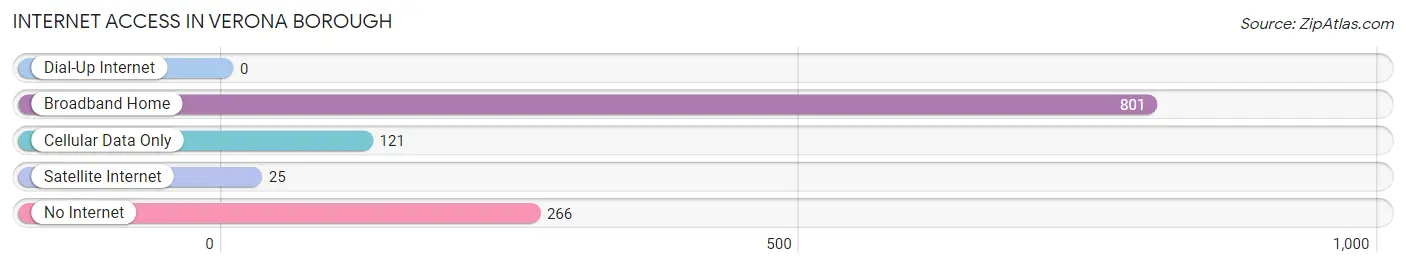
| Internet Type | # Households | % Households |
| Dial-Up Internet | 0 | 0.0% |
| Broadband Home | 801 | 66.3% |
| Cellular Data Only | 121 | 10.0% |
| Satellite Internet | 25 | 2.1% |
| No Internet | 266 | 22.0% |
| Total | 1,208 | 100.0% |
Verona borough Summary
Verona Borough is a small borough located in Allegheny County, Pennsylvania. It is situated on the Allegheny River, approximately 10 miles northeast of Pittsburgh. The borough was incorporated in 1876 and has a population of approximately 1,500 people.
Geography
Verona Borough is located in the Allegheny Valley region of Pennsylvania. It is situated on the Allegheny River, approximately 10 miles northeast of Pittsburgh. The borough is bordered by the boroughs of Oakmont and Plum to the north, Penn Hills to the east, and Verona Township to the south and west. The borough covers an area of 0.7 square miles and is located at an elevation of 890 feet above sea level.
The terrain of Verona Borough is mostly flat, with some rolling hills in the northern part of the borough. The borough is located in a humid continental climate zone, with hot summers and cold winters. The average annual temperature is around 50 degrees Fahrenheit, with an average annual precipitation of around 40 inches.
Economy
Verona Borough has a small, but diverse economy. The borough is home to a variety of businesses, including retail stores, restaurants, and professional services. The borough is also home to a number of manufacturing companies, including a steel mill and a paper mill.
The borough is also home to a number of educational institutions, including the University of Pittsburgh at Bradford, the University of Pittsburgh at Greensburg, and the Community College of Allegheny County.
Demographics
As of the 2010 census, Verona Borough had a population of 1,521 people. The racial makeup of the borough was 94.3% White, 2.2% African American, 0.3% Native American, 0.7% Asian, 0.1% Pacific Islander, 0.7% from other races, and 1.7% from two or more races. Hispanic or Latino of any race were 1.7% of the population.
The median household income in Verona Borough was $41,250, and the median family income was $50,000. The per capita income for the borough was $20,945. About 8.3% of families and 10.2% of the population were below the poverty line, including 14.3% of those under age 18 and 6.2% of those age 65 or over.
Verona Borough is served by the Allegheny Valley School District. The borough is home to two elementary schools, one middle school, and one high school.
Verona Borough is a small borough with a rich history and a diverse economy. The borough is home to a variety of businesses, educational institutions, and manufacturing companies. The borough has a population of approximately 1,500 people, with a median household income of $41,250. The borough is served by the Allegheny Valley School District and is located in a humid continental climate zone.
Common Questions
What is Per Capita Income in Verona borough?
Per Capita income in Verona borough is $34,874.
What is the Median Family Income in Verona borough?
Median Family Income in Verona borough is $71,065.
What is the Median Household income in Verona borough?
Median Household Income in Verona borough is $46,610.
What is Income or Wage Gap in Verona borough?
Income or Wage Gap in Verona borough is 27.9%.
Women in Verona borough earn 72.1 cents for every dollar earned by a man.
What is Family Income Deficit in Verona borough?
Family Income Deficit in Verona borough is $10,843.
Families that are below poverty line in Verona borough earn $10,843 less on average than the poverty threshold level.
What is Inequality or Gini Index in Verona borough?
Inequality or Gini Index in Verona borough is 0.49.
What is the Total Population of Verona borough?
Total Population of Verona borough is 2,629.
What is the Total Male Population of Verona borough?
Total Male Population of Verona borough is 1,305.
What is the Total Female Population of Verona borough?
Total Female Population of Verona borough is 1,324.
What is the Ratio of Males per 100 Females in Verona borough?
There are 98.56 Males per 100 Females in Verona borough.
What is the Ratio of Females per 100 Males in Verona borough?
There are 101.46 Females per 100 Males in Verona borough.
What is the Median Population Age in Verona borough?
Median Population Age in Verona borough is 38.8 Years.
What is the Average Family Size in Verona borough
Average Family Size in Verona borough is 3.1 People.
What is the Average Household Size in Verona borough
Average Household Size in Verona borough is 2.2 People.
How Large is the Labor Force in Verona borough?
There are 1,519 People in the Labor Forcein in Verona borough.
What is the Percentage of People in the Labor Force in Verona borough?
68.7% of People are in the Labor Force in Verona borough.
What is the Unemployment Rate in Verona borough?
Unemployment Rate in Verona borough is 7.8%.