Blanchard, PA Map & Demographics
Blanchard Map
Blanchard Overview
$35,194
PER CAPITA INCOME
$115,694
AVG FAMILY INCOME
$69,750
AVG HOUSEHOLD INCOME
8.4%
WAGE / INCOME GAP [ % ]
91.6¢/ $1
WAGE / INCOME GAP [ $ ]
0.28
INEQUALITY / GINI INDEX
505
TOTAL POPULATION
341
MALE POPULATION
164
FEMALE POPULATION
207.93
MALES / 100 FEMALES
48.09
FEMALES / 100 MALES
57.3
MEDIAN AGE
2.9
AVG FAMILY SIZE
2.2
AVG HOUSEHOLD SIZE
279
LABOR FORCE [ PEOPLE ]
58.1%
PERCENT IN LABOR FORCE
Blanchard Zip Codes
Blanchard Area Codes
Income in Blanchard
Income Overview in Blanchard
Per Capita Income in Blanchard is $35,194, while median incomes of families and households are $115,694 and $69,750 respectively.
| Characteristic | Number | Measure |
| Per Capita Income | 505 | $35,194 |
| Median Family Income | 137 | $115,694 |
| Mean Family Income | 137 | $98,249 |
| Median Household Income | 227 | $69,750 |
| Mean Household Income | 227 | $78,973 |
| Income Deficit | 137 | $0 |
| Wage / Income Gap (%) | 505 | 8.44% |
| Wage / Income Gap ($) | 505 | 91.56¢ per $1 |
| Gini / Inequality Index | 505 | 0.28 |
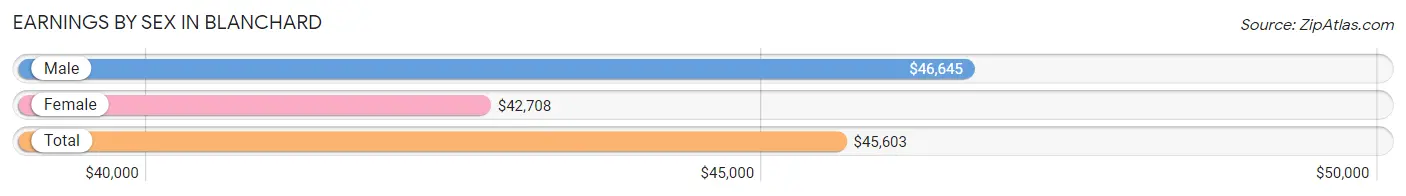
Earnings by Sex in Blanchard
Average Earnings in Blanchard are $45,603, $46,645 for men and $42,708 for women, a difference of 8.4%.
| Sex | Number | Average Earnings |
| Male | 187 (63.6%) | $46,645 |
| Female | 107 (36.4%) | $42,708 |
| Total | 294 (100.0%) | $45,603 |
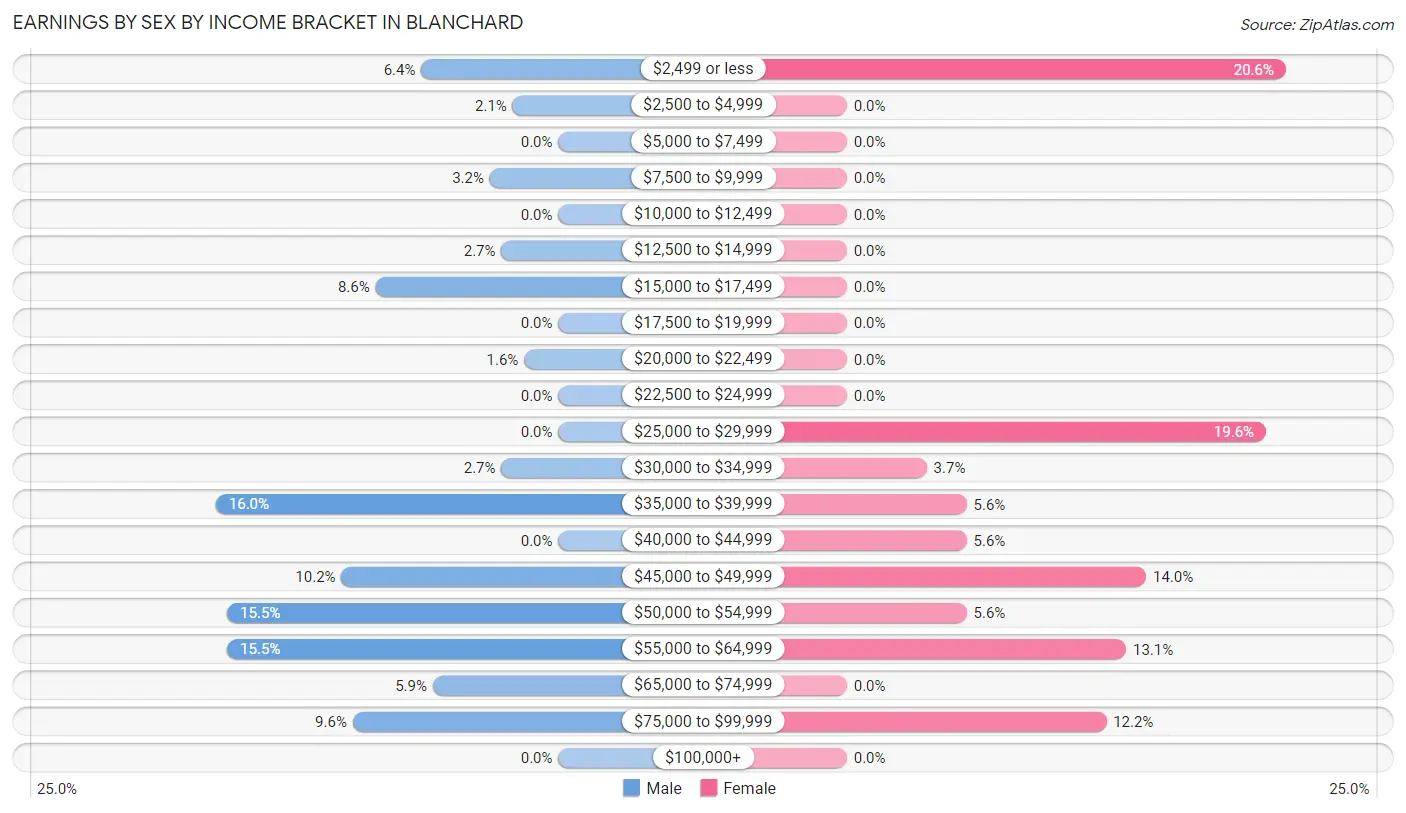
Earnings by Sex by Income Bracket in Blanchard
The most common earnings brackets in Blanchard are $35,000 to $39,999 for men (30 | 16.0%) and $2,499 or less for women (22 | 20.6%).
| Income | Male | Female |
| $2,499 or less | 12 (6.4%) | 22 (20.6%) |
| $2,500 to $4,999 | 4 (2.1%) | 0 (0.0%) |
| $5,000 to $7,499 | 0 (0.0%) | 0 (0.0%) |
| $7,500 to $9,999 | 6 (3.2%) | 0 (0.0%) |
| $10,000 to $12,499 | 0 (0.0%) | 0 (0.0%) |
| $12,500 to $14,999 | 5 (2.7%) | 0 (0.0%) |
| $15,000 to $17,499 | 16 (8.6%) | 0 (0.0%) |
| $17,500 to $19,999 | 0 (0.0%) | 0 (0.0%) |
| $20,000 to $22,499 | 3 (1.6%) | 0 (0.0%) |
| $22,500 to $24,999 | 0 (0.0%) | 0 (0.0%) |
| $25,000 to $29,999 | 0 (0.0%) | 21 (19.6%) |
| $30,000 to $34,999 | 5 (2.7%) | 4 (3.7%) |
| $35,000 to $39,999 | 30 (16.0%) | 6 (5.6%) |
| $40,000 to $44,999 | 0 (0.0%) | 6 (5.6%) |
| $45,000 to $49,999 | 19 (10.2%) | 15 (14.0%) |
| $50,000 to $54,999 | 29 (15.5%) | 6 (5.6%) |
| $55,000 to $64,999 | 29 (15.5%) | 14 (13.1%) |
| $65,000 to $74,999 | 11 (5.9%) | 0 (0.0%) |
| $75,000 to $99,999 | 18 (9.6%) | 13 (12.1%) |
| $100,000+ | 0 (0.0%) | 0 (0.0%) |
| Total | 187 (100.0%) | 107 (100.0%) |
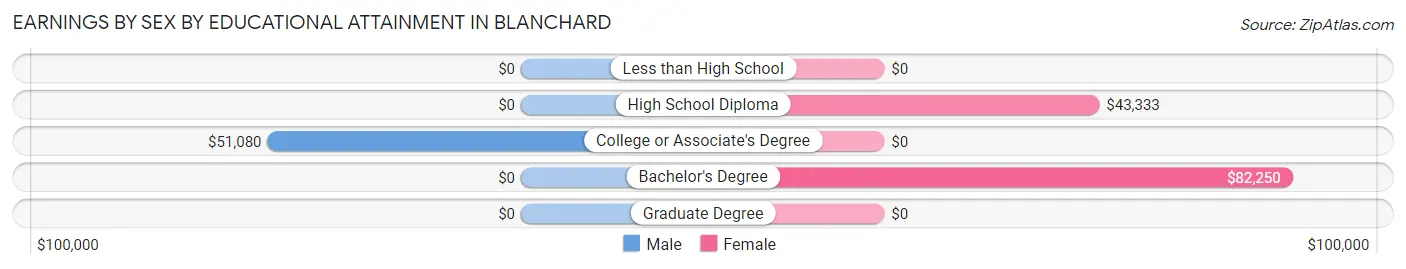
Earnings by Sex by Educational Attainment in Blanchard
Average earnings in Blanchard are $46,645 for men and $43,750 for women, a difference of 6.2%. Men with an educational attainment of college or associate's degree enjoy the highest average annual earnings of $51,080, while those with college or associate's degree education earn the least with $51,080. Women with an educational attainment of bachelor's degree earn the most with the average annual earnings of $82,250, while those with high school diploma education have the smallest earnings of $43,333.
| Educational Attainment | Male Income | Female Income |
| Less than High School | - | - |
| High School Diploma | - | - |
| College or Associate's Degree | $51,080 | $0 |
| Bachelor's Degree | - | - |
| Graduate Degree | - | - |
| Total | $46,645 | $43,750 |
Family Income in Blanchard
Family Income Brackets in Blanchard
According to the Blanchard family income data, there are 87 families falling into the $100,000 to $149,999 income range, which is the most common income bracket and makes up 63.5% of all families.
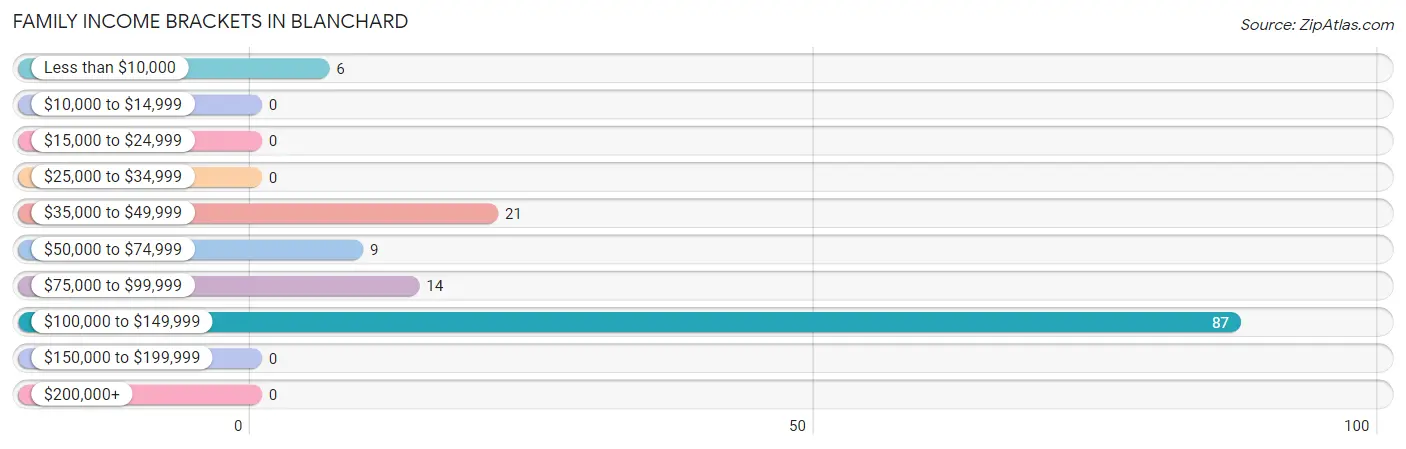
| Income Bracket | # Families | % Families |
| Less than $10,000 | 6 | 4.4% |
| $10,000 to $14,999 | 0 | 0.0% |
| $15,000 to $24,999 | 0 | 0.0% |
| $25,000 to $34,999 | 0 | 0.0% |
| $35,000 to $49,999 | 21 | 15.3% |
| $50,000 to $74,999 | 9 | 6.6% |
| $75,000 to $99,999 | 14 | 10.2% |
| $100,000 to $149,999 | 87 | 63.5% |
| $150,000 to $199,999 | 0 | 0.0% |
| $200,000+ | 0 | 0.0% |
Family Income by Famaliy Size in Blanchard
4-person families (42 | 30.7%) account for the highest median family income in Blanchard with $119,200 per family, while 2-person families (77 | 56.2%) have the highest median income of $53,854 per family member.
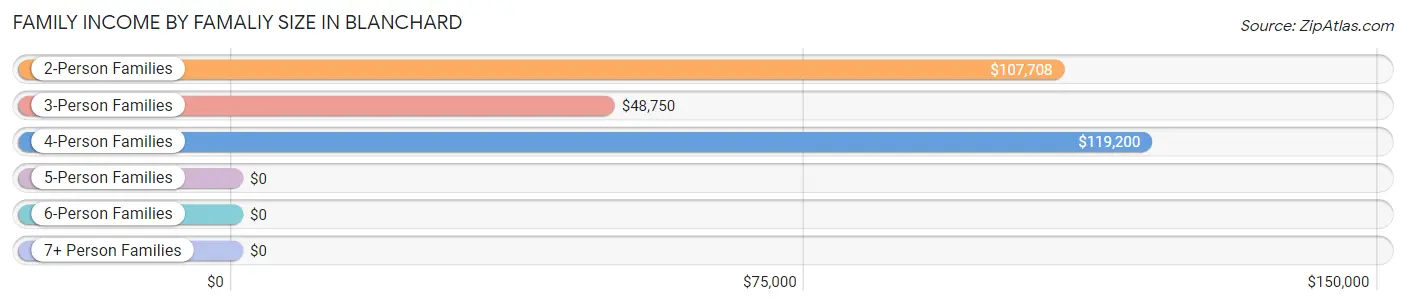
| Income Bracket | # Families | Median Income |
| 2-Person Families | 77 (56.2%) | $107,708 |
| 3-Person Families | 18 (13.1%) | $48,750 |
| 4-Person Families | 42 (30.7%) | $119,200 |
| 5-Person Families | 0 (0.0%) | $0 |
| 6-Person Families | 0 (0.0%) | $0 |
| 7+ Person Families | 0 (0.0%) | $0 |
| Total | 137 (100.0%) | $115,694 |
Family Income by Number of Earners in Blanchard
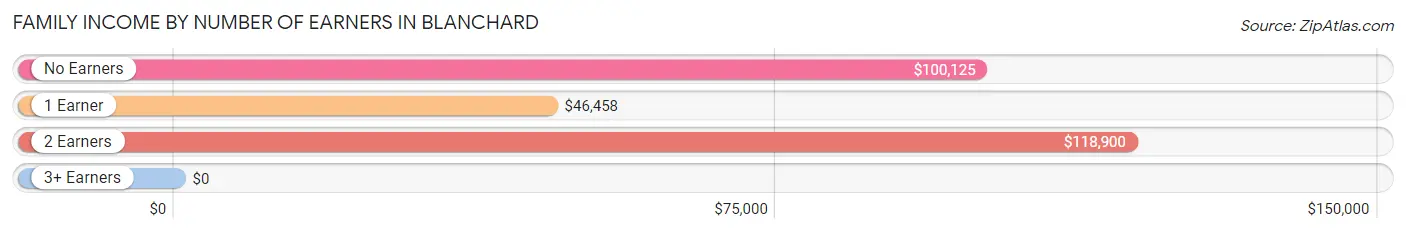
| Number of Earners | # Families | Median Income |
| No Earners | 19 (13.9%) | $100,125 |
| 1 Earner | 29 (21.2%) | $46,458 |
| 2 Earners | 80 (58.4%) | $118,900 |
| 3+ Earners | 9 (6.6%) | $0 |
| Total | 137 (100.0%) | $115,694 |
Household Income in Blanchard
Household Income Brackets in Blanchard
With 87 households falling in the category, the $100,000 to $149,999 income range is the most frequent in Blanchard, accounting for 38.3% of all households.
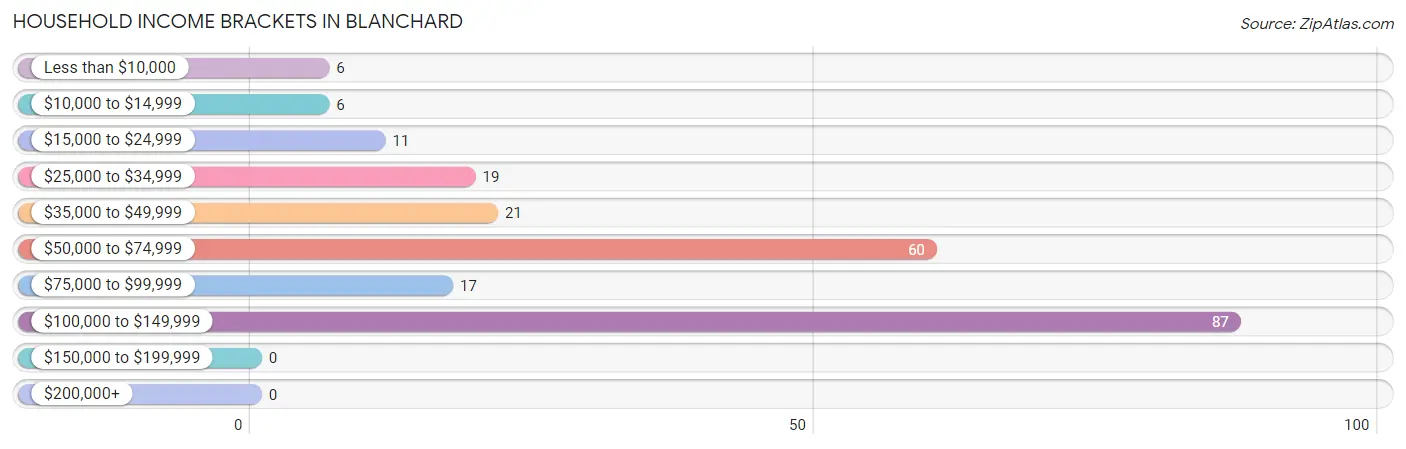
| Income Bracket | # Households | % Households |
| Less than $10,000 | 6 | 2.6% |
| $10,000 to $14,999 | 6 | 2.6% |
| $15,000 to $24,999 | 11 | 4.8% |
| $25,000 to $34,999 | 19 | 8.4% |
| $35,000 to $49,999 | 21 | 9.3% |
| $50,000 to $74,999 | 60 | 26.4% |
| $75,000 to $99,999 | 17 | 7.5% |
| $100,000 to $149,999 | 87 | 38.3% |
| $150,000 to $199,999 | 0 | 0.0% |
| $200,000+ | 0 | 0.0% |
Household Income by Householder Age in Blanchard
The median household income in Blanchard is $69,750, with the highest median household income of $98,750 found in the 45 to 64 years age bracket for the primary householder. A total of 134 households (59.0%) fall into this category.
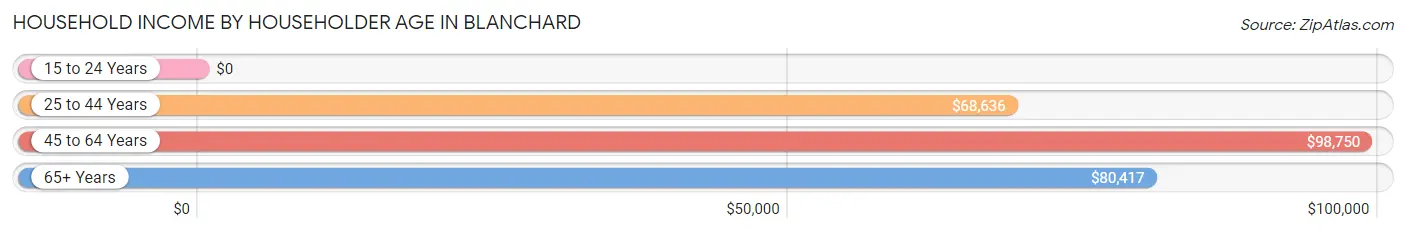
| Income Bracket | # Households | Median Income |
| 15 to 24 Years | 0 (0.0%) | $0 |
| 25 to 44 Years | 40 (17.6%) | $68,636 |
| 45 to 64 Years | 134 (59.0%) | $98,750 |
| 65+ Years | 53 (23.4%) | $80,417 |
| Total | 227 (100.0%) | $69,750 |
Poverty in Blanchard
Income Below Poverty by Sex and Age in Blanchard
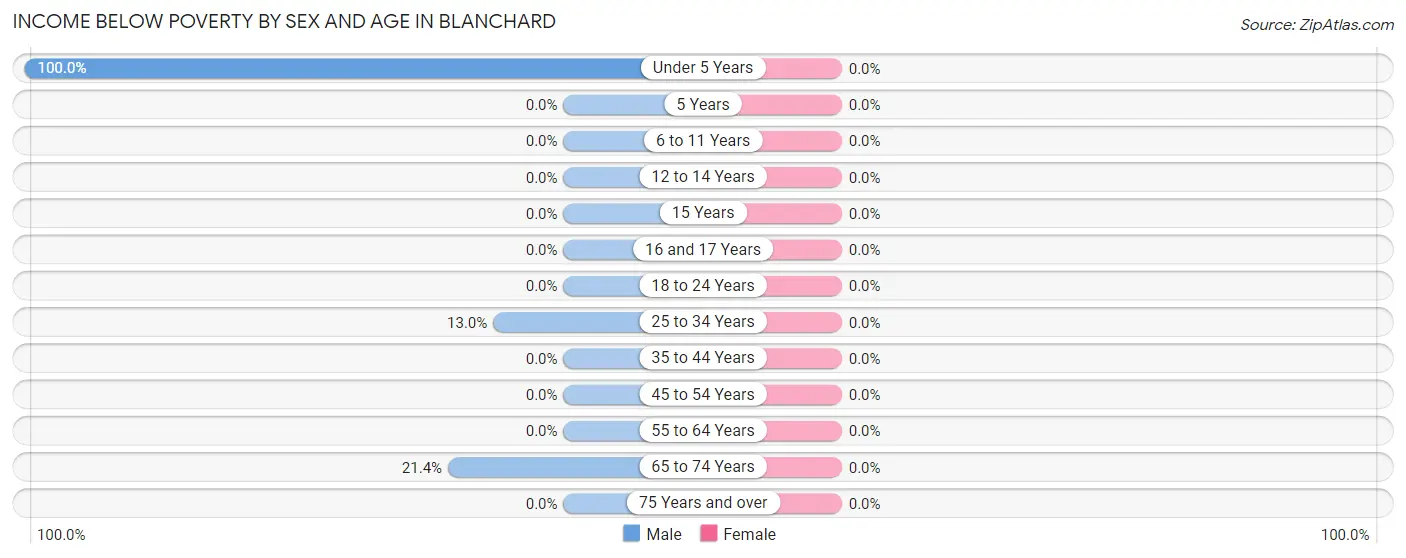
| Age Bracket | Male | Female |
| Under 5 Years | 4 (100.0%) | 0 (0.0%) |
| 5 Years | 0 (0.0%) | 0 (0.0%) |
| 6 to 11 Years | 0 (0.0%) | 0 (0.0%) |
| 12 to 14 Years | 0 (0.0%) | 0 (0.0%) |
| 15 Years | 0 (0.0%) | 0 (0.0%) |
| 16 and 17 Years | 0 (0.0%) | 0 (0.0%) |
| 18 to 24 Years | 0 (0.0%) | 0 (0.0%) |
| 25 to 34 Years | 6 (13.0%) | 0 (0.0%) |
| 35 to 44 Years | 0 (0.0%) | 0 (0.0%) |
| 45 to 54 Years | 0 (0.0%) | 0 (0.0%) |
| 55 to 64 Years | 0 (0.0%) | 0 (0.0%) |
| 65 to 74 Years | 6 (21.4%) | 0 (0.0%) |
| 75 Years and over | 0 (0.0%) | 0 (0.0%) |
| Total | 16 (4.7%) | 0 (0.0%) |
Income Above Poverty by Sex and Age in Blanchard
According to the poverty statistics in Blanchard, males aged 5 years and females aged 6 to 11 years are the age groups that are most secure financially, with 100.0% of males and 100.0% of females in these age groups living above the poverty line.
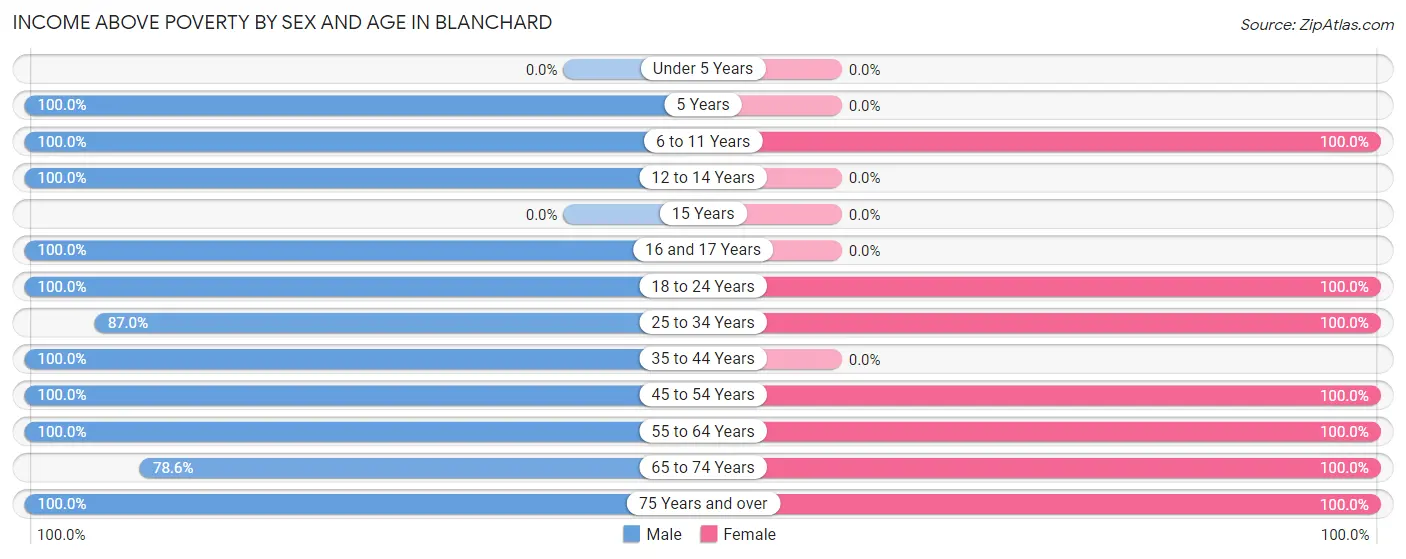
| Age Bracket | Male | Female |
| Under 5 Years | 0 (0.0%) | 0 (0.0%) |
| 5 Years | 5 (100.0%) | 0 (0.0%) |
| 6 to 11 Years | 5 (100.0%) | 7 (100.0%) |
| 12 to 14 Years | 4 (100.0%) | 0 (0.0%) |
| 15 Years | 0 (0.0%) | 0 (0.0%) |
| 16 and 17 Years | 9 (100.0%) | 0 (0.0%) |
| 18 to 24 Years | 1 (100.0%) | 5 (100.0%) |
| 25 to 34 Years | 40 (87.0%) | 12 (100.0%) |
| 35 to 44 Years | 66 (100.0%) | 0 (0.0%) |
| 45 to 54 Years | 40 (100.0%) | 26 (100.0%) |
| 55 to 64 Years | 122 (100.0%) | 56 (100.0%) |
| 65 to 74 Years | 22 (78.6%) | 44 (100.0%) |
| 75 Years and over | 11 (100.0%) | 14 (100.0%) |
| Total | 325 (95.3%) | 164 (100.0%) |
Income Below Poverty Among Married-Couple Families in Blanchard
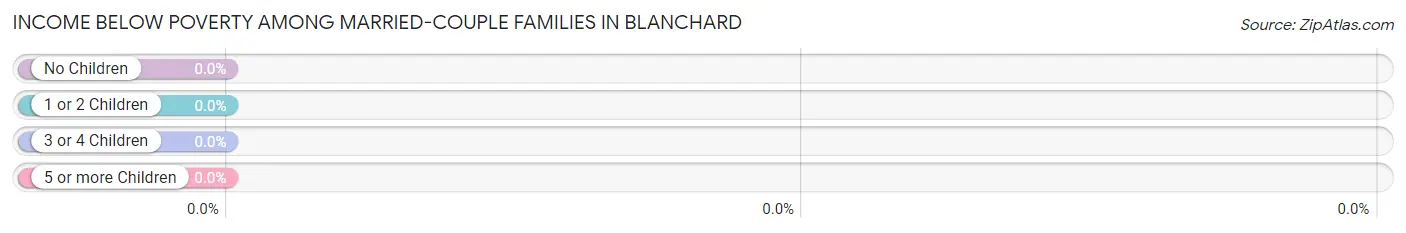
| Children | Above Poverty | Below Poverty |
| No Children | 102 (100.0%) | 0 (0.0%) |
| 1 or 2 Children | 17 (100.0%) | 0 (0.0%) |
| 3 or 4 Children | 0 (0.0%) | 0 (0.0%) |
| 5 or more Children | 0 (0.0%) | 0 (0.0%) |
| Total | 119 (100.0%) | 0 (0.0%) |
Income Below Poverty Among Single-Parent Households in Blanchard
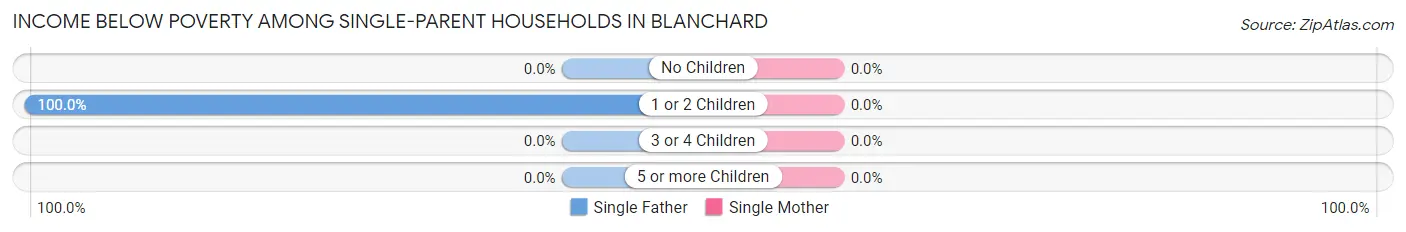
| Children | Single Father | Single Mother |
| No Children | 0 (0.0%) | 0 (0.0%) |
| 1 or 2 Children | 6 (100.0%) | 0 (0.0%) |
| 3 or 4 Children | 0 (0.0%) | 0 (0.0%) |
| 5 or more Children | 0 (0.0%) | 0 (0.0%) |
| Total | 6 (100.0%) | 0 (0.0%) |
Income Below Poverty Among Married-Couple vs Single-Parent Households in Blanchard
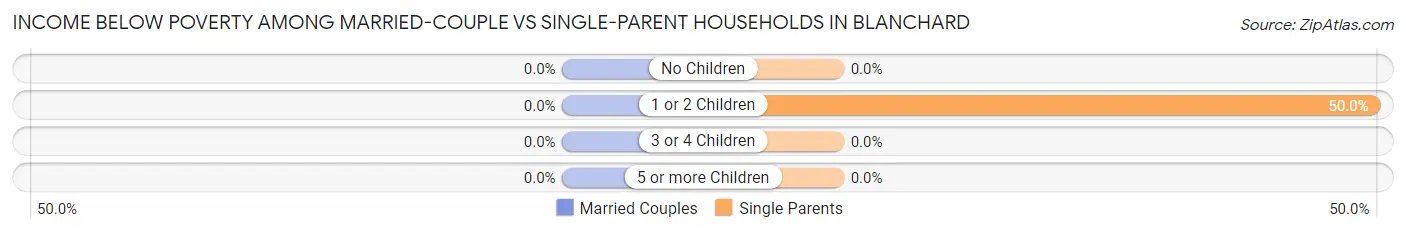
| Children | Married-Couple Families | Single-Parent Households |
| No Children | 0 (0.0%) | 0 (0.0%) |
| 1 or 2 Children | 0 (0.0%) | 6 (50.0%) |
| 3 or 4 Children | 0 (0.0%) | 0 (0.0%) |
| 5 or more Children | 0 (0.0%) | 0 (0.0%) |
| Total | 0 (0.0%) | 6 (33.3%) |
Race in Blanchard
The most populous races in Blanchard are White / Caucasian (494 | 97.8%), and Two or more Races (11 | 2.2%).
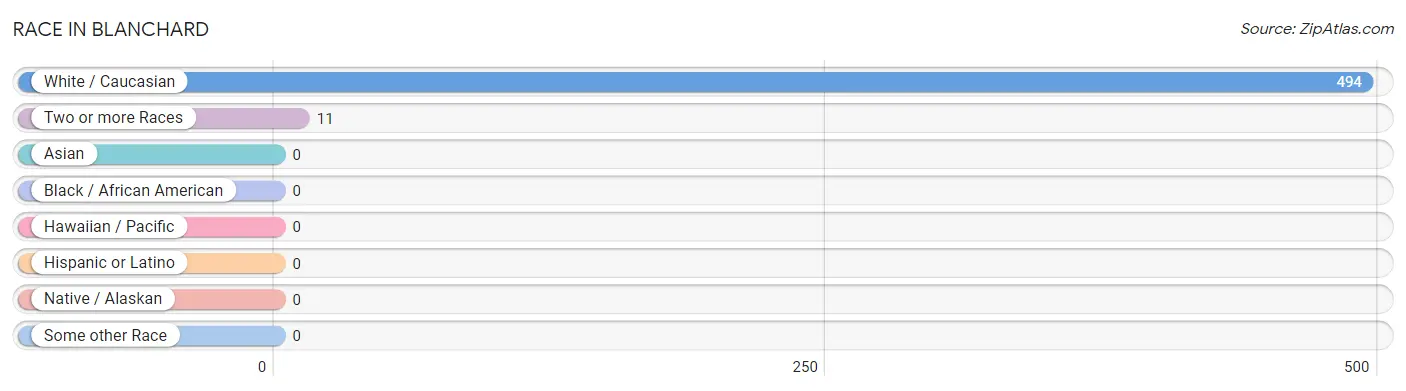
| Race | # Population | % Population |
| Asian | 0 | 0.0% |
| Black / African American | 0 | 0.0% |
| Hawaiian / Pacific | 0 | 0.0% |
| Hispanic or Latino | 0 | 0.0% |
| Native / Alaskan | 0 | 0.0% |
| White / Caucasian | 494 | 97.8% |
| Two or more Races | 11 | 2.2% |
| Some other Race | 0 | 0.0% |
| Total | 505 | 100.0% |
Ancestry in Blanchard
The most populous ancestries reported in Blanchard are German (230 | 45.5%), Irish (71 | 14.1%), English (51 | 10.1%), American (33 | 6.5%), and Apache (11 | 2.2%), together accounting for 78.4% of all Blanchard residents.
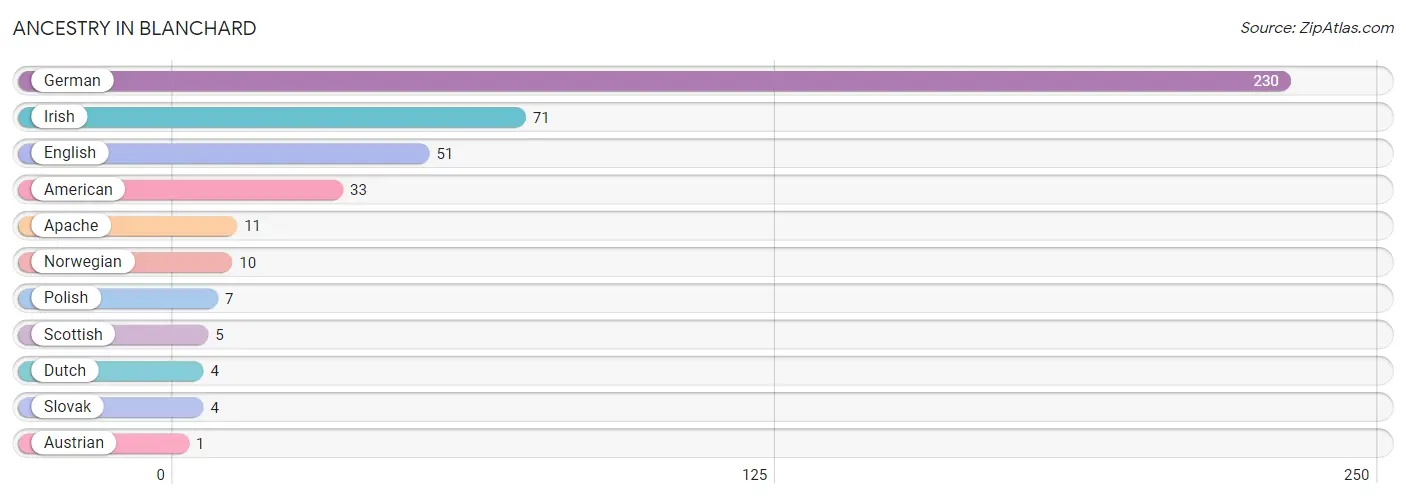
| Ancestry | # Population | % Population |
| American | 33 | 6.5% |
| Apache | 11 | 2.2% |
| Austrian | 1 | 0.2% |
| Dutch | 4 | 0.8% |
| English | 51 | 10.1% |
| German | 230 | 45.5% |
| Irish | 71 | 14.1% |
| Norwegian | 10 | 2.0% |
| Polish | 7 | 1.4% |
| Scottish | 5 | 1.0% |
| Slovak | 4 | 0.8% | View All 11 Rows |
Immigrants in Blanchard

| Immigration Origin | # Population | % Population | View All 0 Rows |
Sex and Age in Blanchard
Sex and Age in Blanchard
The most populous age groups in Blanchard are 60 to 64 Years (77 | 22.6%) for men and 55 to 59 Years (39 | 23.8%) for women.
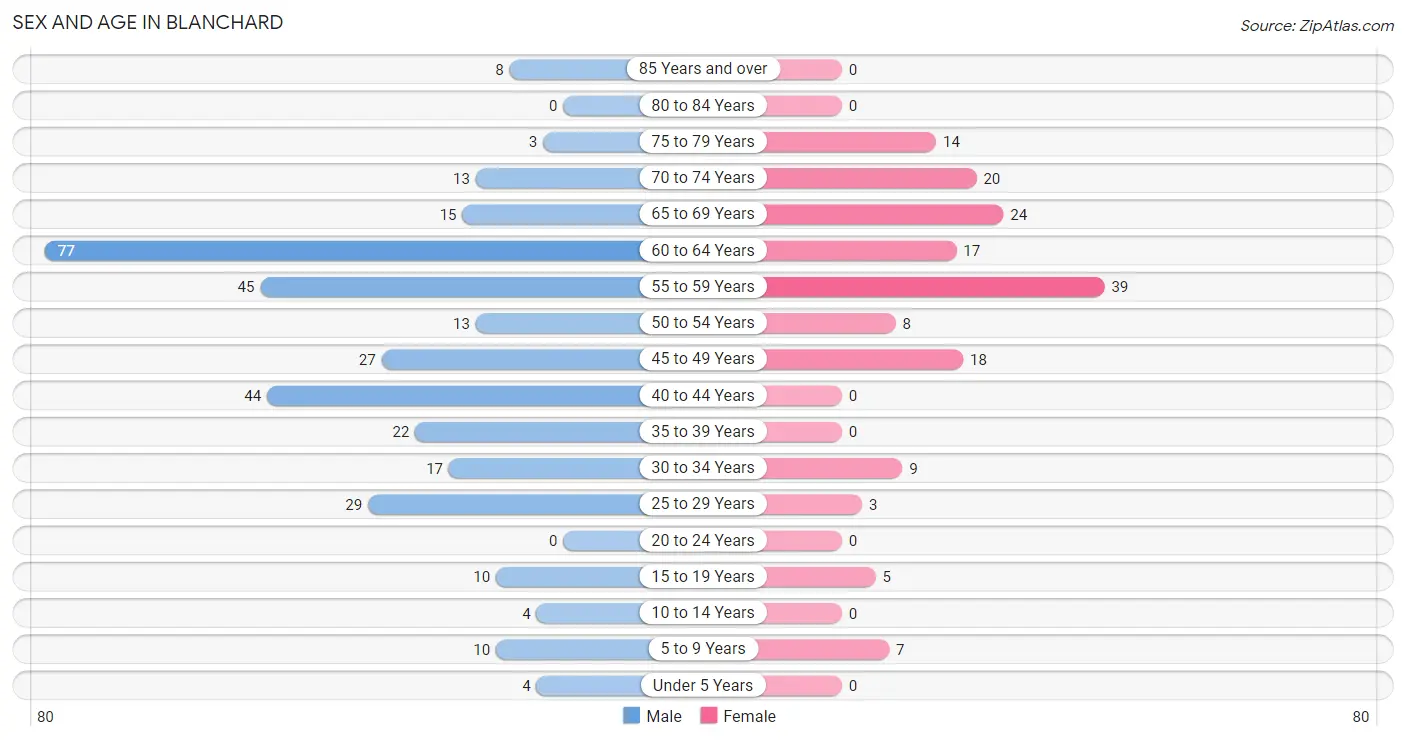
| Age Bracket | Male | Female |
| Under 5 Years | 4 (1.2%) | 0 (0.0%) |
| 5 to 9 Years | 10 (2.9%) | 7 (4.3%) |
| 10 to 14 Years | 4 (1.2%) | 0 (0.0%) |
| 15 to 19 Years | 10 (2.9%) | 5 (3.0%) |
| 20 to 24 Years | 0 (0.0%) | 0 (0.0%) |
| 25 to 29 Years | 29 (8.5%) | 3 (1.8%) |
| 30 to 34 Years | 17 (5.0%) | 9 (5.5%) |
| 35 to 39 Years | 22 (6.5%) | 0 (0.0%) |
| 40 to 44 Years | 44 (12.9%) | 0 (0.0%) |
| 45 to 49 Years | 27 (7.9%) | 18 (11.0%) |
| 50 to 54 Years | 13 (3.8%) | 8 (4.9%) |
| 55 to 59 Years | 45 (13.2%) | 39 (23.8%) |
| 60 to 64 Years | 77 (22.6%) | 17 (10.4%) |
| 65 to 69 Years | 15 (4.4%) | 24 (14.6%) |
| 70 to 74 Years | 13 (3.8%) | 20 (12.2%) |
| 75 to 79 Years | 3 (0.9%) | 14 (8.5%) |
| 80 to 84 Years | 0 (0.0%) | 0 (0.0%) |
| 85 Years and over | 8 (2.4%) | 0 (0.0%) |
| Total | 341 (100.0%) | 164 (100.0%) |
Families and Households in Blanchard
Median Family Size in Blanchard
The median family size in Blanchard is 2.89 persons per family, with married-couple families (119 | 86.9%) accounting for the largest median family size of 2.99 persons per family. On the other hand, single male/father families (6 | 4.4%) represent the smallest median family size with 1.67 persons per family.
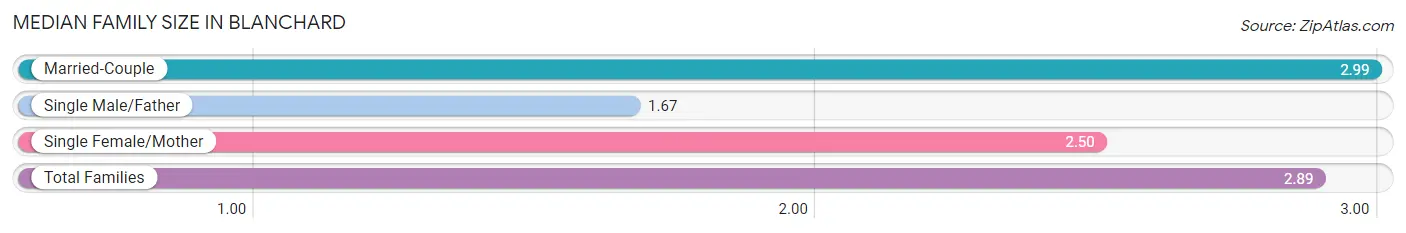
| Family Type | # Families | Family Size |
| Married-Couple | 119 (86.9%) | 2.99 |
| Single Male/Father | 6 (4.4%) | 1.67 |
| Single Female/Mother | 12 (8.8%) | 2.50 |
| Total Families | 137 (100.0%) | 2.89 |
Median Household Size in Blanchard
The median household size in Blanchard is 2.22 persons per household, with married-couple households (119 | 52.4%) accounting for the largest median household size of 2.99 persons per household. non-family households (90 | 39.7%) represent the smallest median household size with 1.21 persons per household.
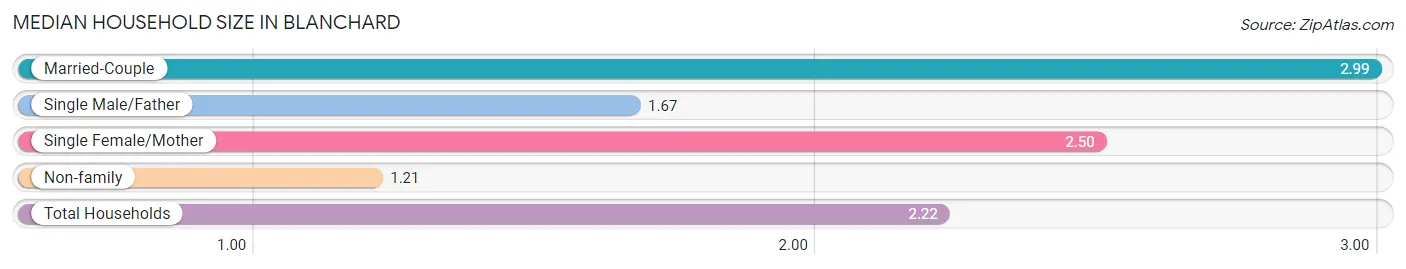
| Household Type | # Households | Household Size |
| Married-Couple | 119 (52.4%) | 2.99 |
| Single Male/Father | 6 (2.6%) | 1.67 |
| Single Female/Mother | 12 (5.3%) | 2.50 |
| Non-family | 90 (39.7%) | 1.21 |
| Total Households | 227 (100.0%) | 2.22 |
Household Size by Marriage Status in Blanchard
Out of a total of 227 households in Blanchard, 137 (60.4%) are family households, while 90 (39.7%) are nonfamily households. The most numerous type of family households are 2-person households, comprising 77, and the most common type of nonfamily households are 1-person households, comprising 65.
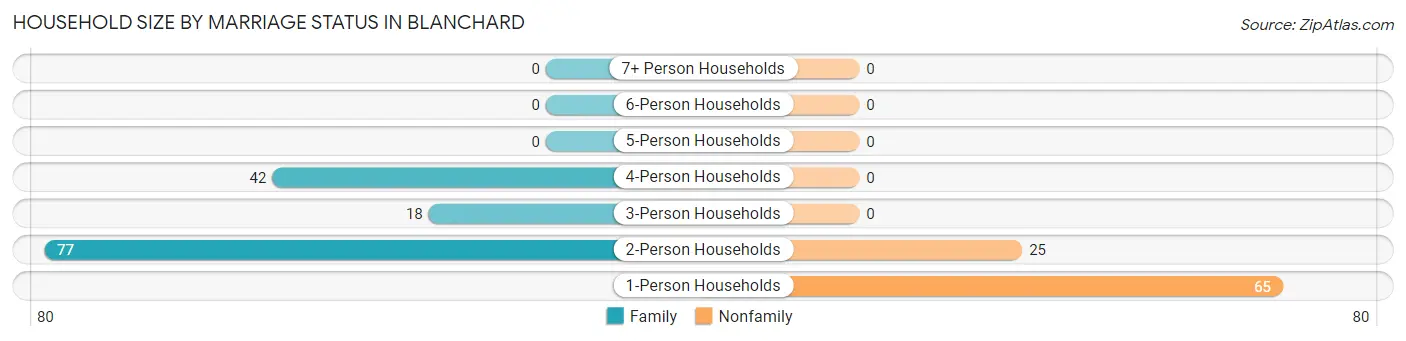
| Household Size | Family Households | Nonfamily Households |
| 1-Person Households | - | 65 (28.6%) |
| 2-Person Households | 77 (33.9%) | 25 (11.0%) |
| 3-Person Households | 18 (7.9%) | 0 (0.0%) |
| 4-Person Households | 42 (18.5%) | 0 (0.0%) |
| 5-Person Households | 0 (0.0%) | 0 (0.0%) |
| 6-Person Households | 0 (0.0%) | 0 (0.0%) |
| 7+ Person Households | 0 (0.0%) | 0 (0.0%) |
| Total | 137 (60.4%) | 90 (39.7%) |
Female Fertility in Blanchard
Fertility by Age in Blanchard
| Age Bracket | Women with Births | Births / 1,000 Women |
| 15 to 19 years | 0 (0.0%) | 0.0 |
| 20 to 34 years | 0 (0.0%) | 0.0 |
| 35 to 50 years | 0 (0.0%) | 0.0 |
| Total | 0 (0.0%) | 0.0 |
Fertility by Age by Marriage Status in Blanchard
| Age Bracket | Married | Unmarried |
| 15 to 19 years | 0 (0.0%) | 0 (0.0%) |
| 20 to 34 years | 0 (0.0%) | 0 (0.0%) |
| 35 to 50 years | 0 (0.0%) | 0 (0.0%) |
| Total | 0 (0.0%) | 0 (0.0%) |
Fertility by Education in Blanchard
| Educational Attainment | Women with Births | Births / 1,000 Women |
| Less than High School | 0 (0.0%) | 0.0 |
| High School Diploma | 0 (0.0%) | 0.0 |
| College or Associate's Degree | 0 (0.0%) | 0.0 |
| Bachelor's Degree | 0 (0.0%) | 0.0 |
| Graduate Degree | 0 (0.0%) | 0.0 |
| Total | 0 (0.0%) | 0.0 |
Fertility by Education by Marriage Status in Blanchard
| Educational Attainment | Married | Unmarried |
| Less than High School | 0 (0.0%) | 0 (0.0%) |
| High School Diploma | 0 (0.0%) | 0 (0.0%) |
| College or Associate's Degree | 0 (0.0%) | 0 (0.0%) |
| Bachelor's Degree | 0 (0.0%) | 0 (0.0%) |
| Graduate Degree | 0 (0.0%) | 0 (0.0%) |
| Total | 0 (0.0%) | 0 (0.0%) |
Employment Characteristics in Blanchard
Employment by Class of Employer in Blanchard
Among the 279 employed individuals in Blanchard, private company employees (121 | 43.4%), state government employees (81 | 29.0%), and not-for-profit organizations (36 | 12.9%) make up the most common classes of employment.
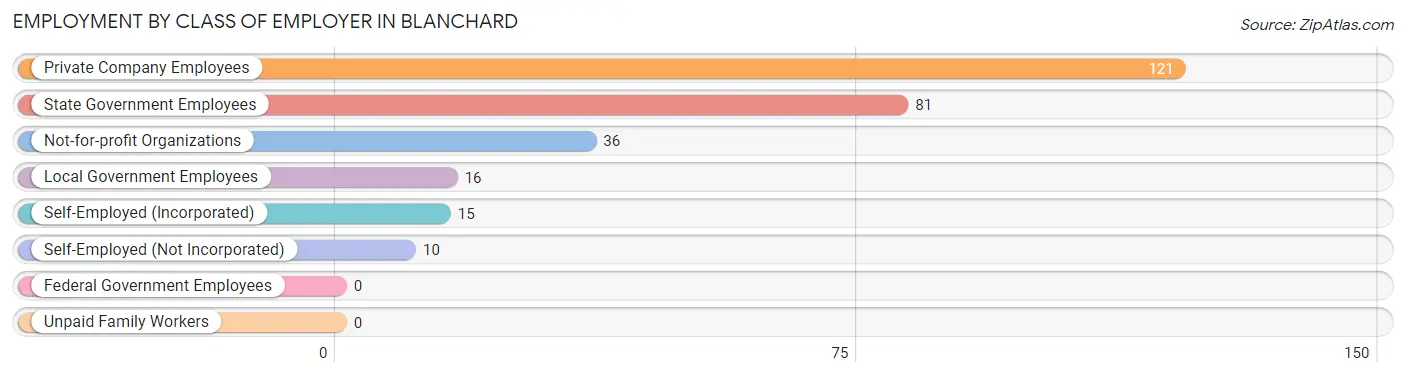
| Employer Class | # Employees | % Employees |
| Private Company Employees | 121 | 43.4% |
| Self-Employed (Incorporated) | 15 | 5.4% |
| Self-Employed (Not Incorporated) | 10 | 3.6% |
| Not-for-profit Organizations | 36 | 12.9% |
| Local Government Employees | 16 | 5.7% |
| State Government Employees | 81 | 29.0% |
| Federal Government Employees | 0 | 0.0% |
| Unpaid Family Workers | 0 | 0.0% |
| Total | 279 | 100.0% |
Employment Status by Age in Blanchard
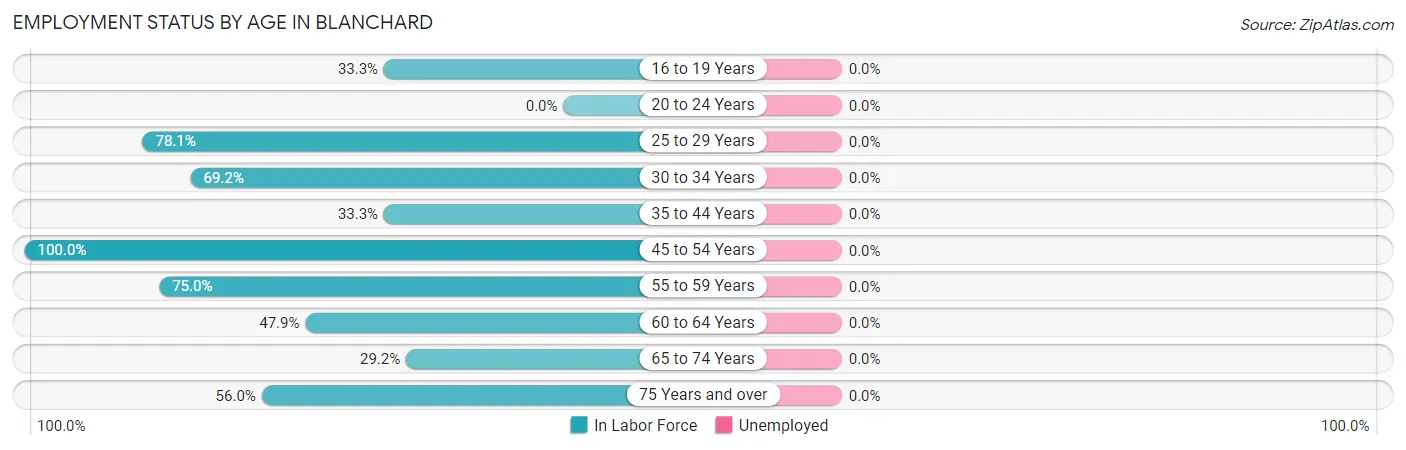
| Age Bracket | In Labor Force | Unemployed |
| 16 to 19 Years | 5 (33.3%) | 0 (0.0%) |
| 20 to 24 Years | 0 (0.0%) | 0 (0.0%) |
| 25 to 29 Years | 25 (78.1%) | 0 (0.0%) |
| 30 to 34 Years | 18 (69.2%) | 0 (0.0%) |
| 35 to 44 Years | 22 (33.3%) | 0 (0.0%) |
| 45 to 54 Years | 66 (100.0%) | 0 (0.0%) |
| 55 to 59 Years | 63 (75.0%) | 0 (0.0%) |
| 60 to 64 Years | 45 (47.9%) | 0 (0.0%) |
| 65 to 74 Years | 21 (29.2%) | 0 (0.0%) |
| 75 Years and over | 14 (56.0%) | 0 (0.0%) |
| Total | 279 (58.1%) | 0 (0.0%) |
Employment Status by Educational Attainment in Blanchard
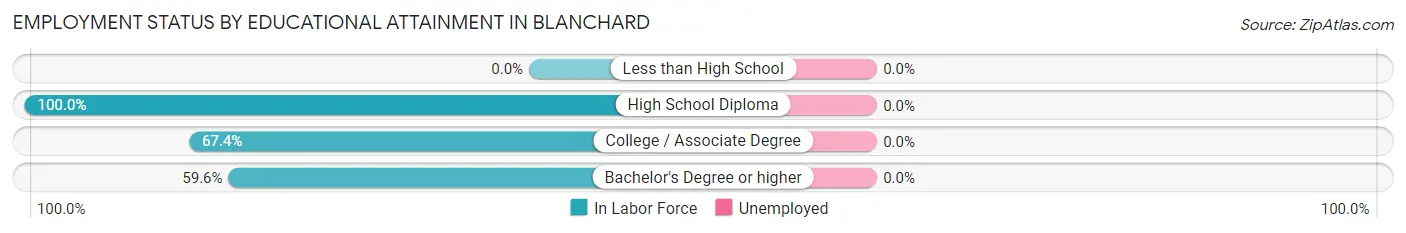
| Educational Attainment | In Labor Force | Unemployed |
| Less than High School | 0 (0.0%) | 0 (0.0%) |
| High School Diploma | 89 (100.0%) | 0 (0.0%) |
| College / Associate Degree | 122 (67.4%) | 0 (0.0%) |
| Bachelor's Degree or higher | 28 (59.6%) | 0 (0.0%) |
| Total | 239 (64.9%) | 0 (0.0%) |
Employment Occupations by Sex in Blanchard
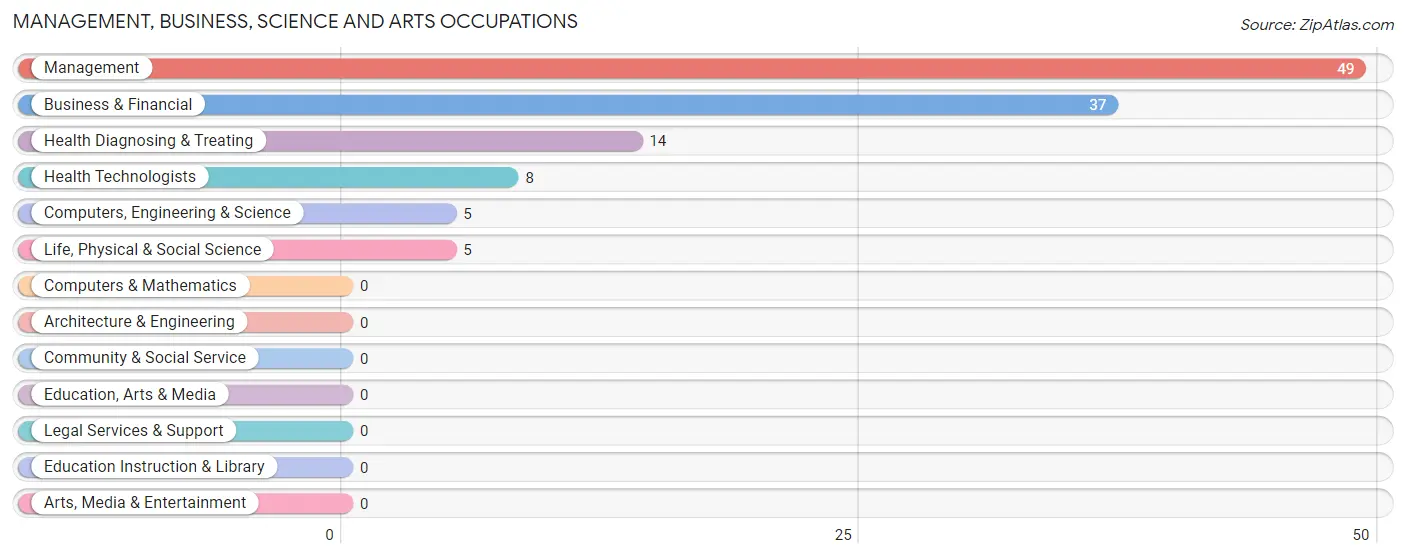
Management, Business, Science and Arts Occupations
The most common Management, Business, Science and Arts occupations in Blanchard are Management (49 | 17.6%), Business & Financial (37 | 13.3%), Health Diagnosing & Treating (14 | 5.0%), Health Technologists (8 | 2.9%), and Computers, Engineering & Science (5 | 1.8%).
Management, Business, Science and Arts Occupations by Sex
Within the Management, Business, Science and Arts occupations in Blanchard, the most male-oriented occupations are Computers, Engineering & Science (100.0%), Life, Physical & Social Science (100.0%), and Management (89.8%), while the most female-oriented occupations are Health Diagnosing & Treating (100.0%), Health Technologists (100.0%), and Business & Financial (89.2%).
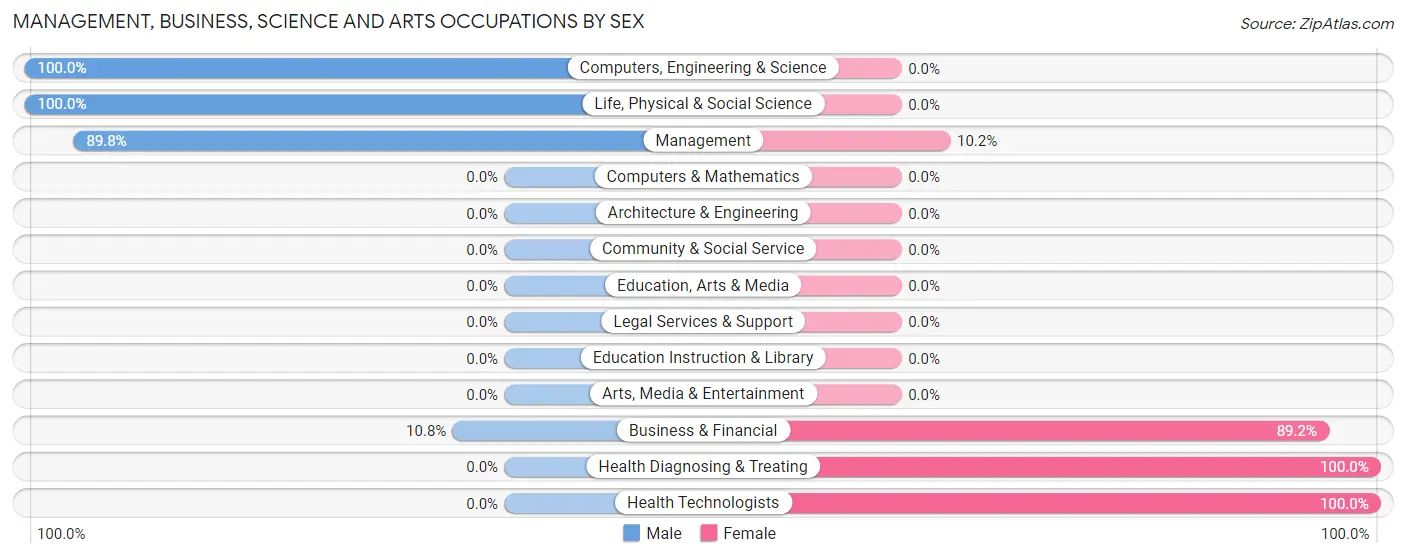
| Occupation | Male | Female |
| Management | 44 (89.8%) | 5 (10.2%) |
| Business & Financial | 4 (10.8%) | 33 (89.2%) |
| Computers, Engineering & Science | 5 (100.0%) | 0 (0.0%) |
| Computers & Mathematics | 0 (0.0%) | 0 (0.0%) |
| Architecture & Engineering | 0 (0.0%) | 0 (0.0%) |
| Life, Physical & Social Science | 5 (100.0%) | 0 (0.0%) |
| Community & Social Service | 0 (0.0%) | 0 (0.0%) |
| Education, Arts & Media | 0 (0.0%) | 0 (0.0%) |
| Legal Services & Support | 0 (0.0%) | 0 (0.0%) |
| Education Instruction & Library | 0 (0.0%) | 0 (0.0%) |
| Arts, Media & Entertainment | 0 (0.0%) | 0 (0.0%) |
| Health Diagnosing & Treating | 0 (0.0%) | 14 (100.0%) |
| Health Technologists | 0 (0.0%) | 8 (100.0%) |
| Total (Category) | 53 (50.5%) | 52 (49.5%) |
| Total (Overall) | 175 (62.7%) | 104 (37.3%) |
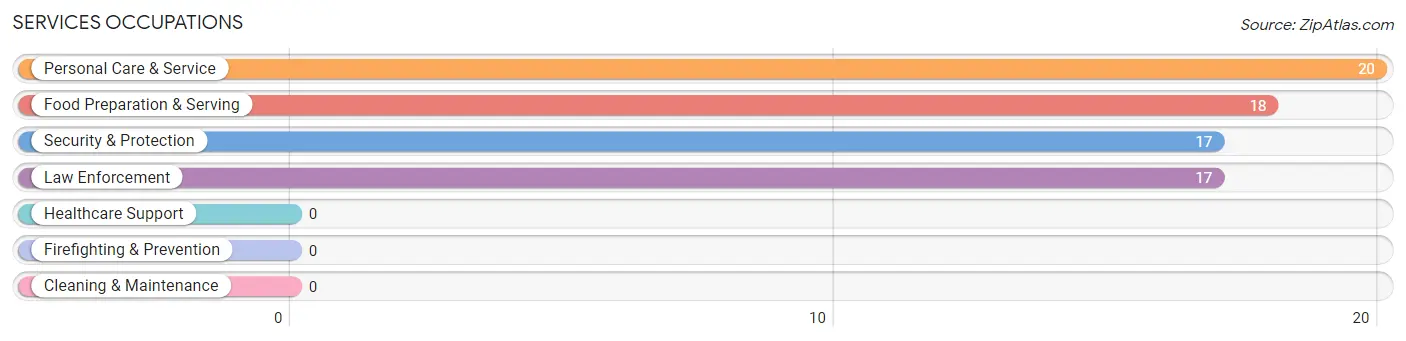
Services Occupations
The most common Services occupations in Blanchard are Personal Care & Service (20 | 7.2%), Food Preparation & Serving (18 | 6.5%), Security & Protection (17 | 6.1%), and Law Enforcement (17 | 6.1%).
Services Occupations by Sex
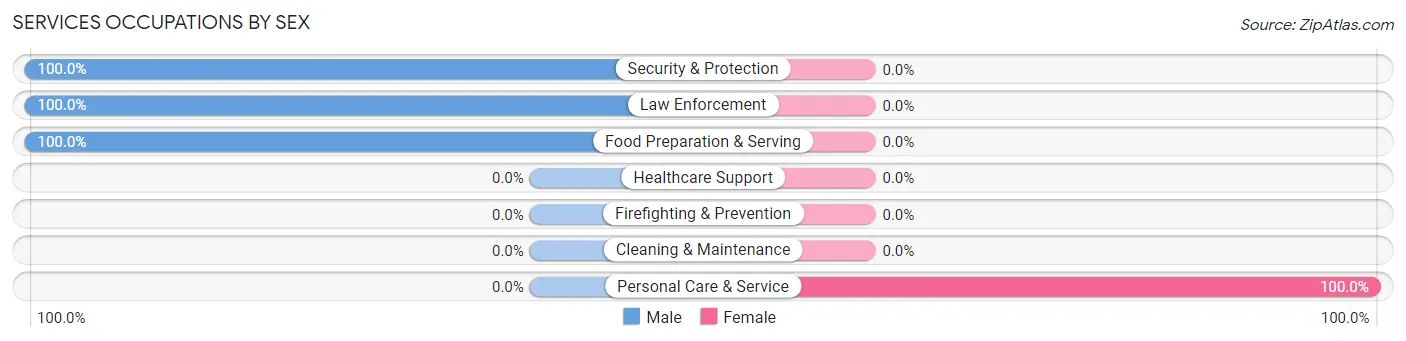
| Occupation | Male | Female |
| Healthcare Support | 0 (0.0%) | 0 (0.0%) |
| Security & Protection | 17 (100.0%) | 0 (0.0%) |
| Firefighting & Prevention | 0 (0.0%) | 0 (0.0%) |
| Law Enforcement | 17 (100.0%) | 0 (0.0%) |
| Food Preparation & Serving | 18 (100.0%) | 0 (0.0%) |
| Cleaning & Maintenance | 0 (0.0%) | 0 (0.0%) |
| Personal Care & Service | 0 (0.0%) | 20 (100.0%) |
| Total (Category) | 35 (63.6%) | 20 (36.4%) |
| Total (Overall) | 175 (62.7%) | 104 (37.3%) |
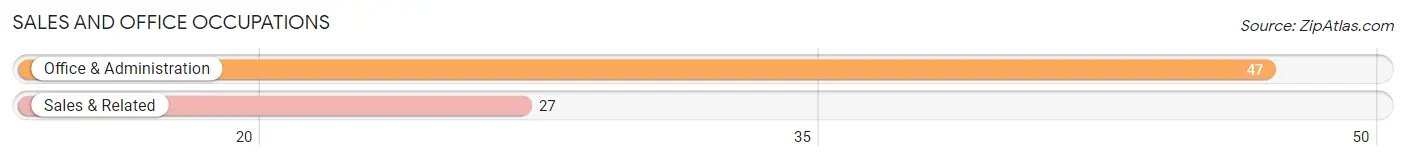
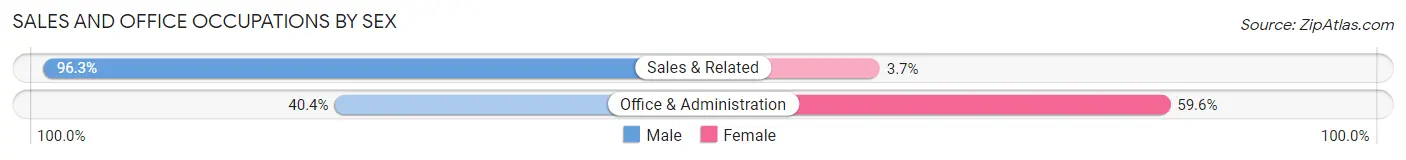
Sales and Office Occupations
The most common Sales and Office occupations in Blanchard are Office & Administration (47 | 16.9%), and Sales & Related (27 | 9.7%).
Sales and Office Occupations by Sex
| Occupation | Male | Female |
| Sales & Related | 26 (96.3%) | 1 (3.7%) |
| Office & Administration | 19 (40.4%) | 28 (59.6%) |
| Total (Category) | 45 (60.8%) | 29 (39.2%) |
| Total (Overall) | 175 (62.7%) | 104 (37.3%) |
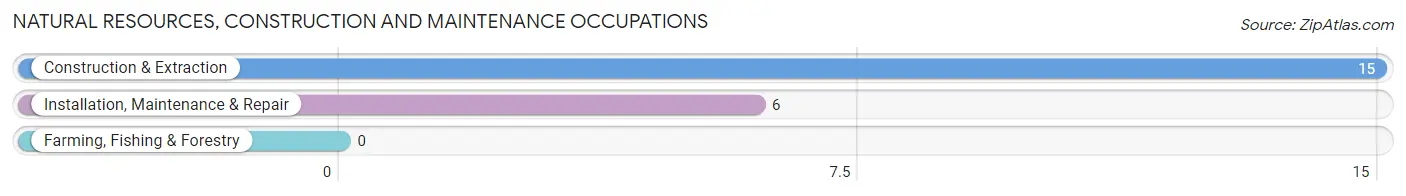
Natural Resources, Construction and Maintenance Occupations
The most common Natural Resources, Construction and Maintenance occupations in Blanchard are Construction & Extraction (15 | 5.4%), and Installation, Maintenance & Repair (6 | 2.1%).
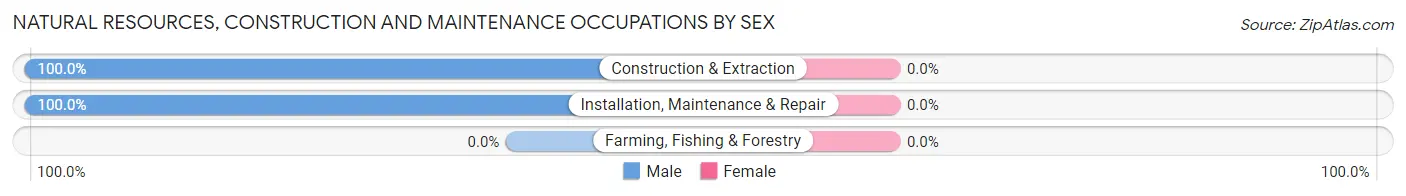
Natural Resources, Construction and Maintenance Occupations by Sex
| Occupation | Male | Female |
| Farming, Fishing & Forestry | 0 (0.0%) | 0 (0.0%) |
| Construction & Extraction | 15 (100.0%) | 0 (0.0%) |
| Installation, Maintenance & Repair | 6 (100.0%) | 0 (0.0%) |
| Total (Category) | 21 (100.0%) | 0 (0.0%) |
| Total (Overall) | 175 (62.7%) | 104 (37.3%) |
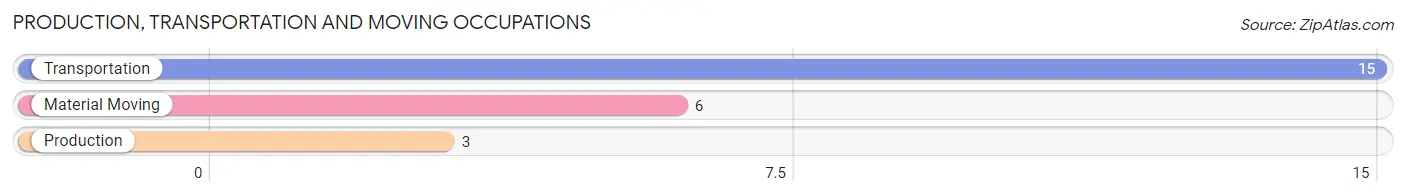
Production, Transportation and Moving Occupations
The most common Production, Transportation and Moving occupations in Blanchard are Transportation (15 | 5.4%), Material Moving (6 | 2.1%), and Production (3 | 1.1%).
Production, Transportation and Moving Occupations by Sex
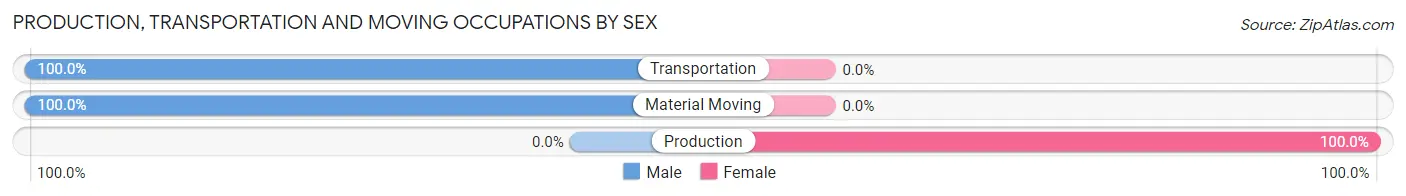
| Occupation | Male | Female |
| Production | 0 (0.0%) | 3 (100.0%) |
| Transportation | 15 (100.0%) | 0 (0.0%) |
| Material Moving | 6 (100.0%) | 0 (0.0%) |
| Total (Category) | 21 (87.5%) | 3 (12.5%) |
| Total (Overall) | 175 (62.7%) | 104 (37.3%) |
Employment Industries by Sex in Blanchard
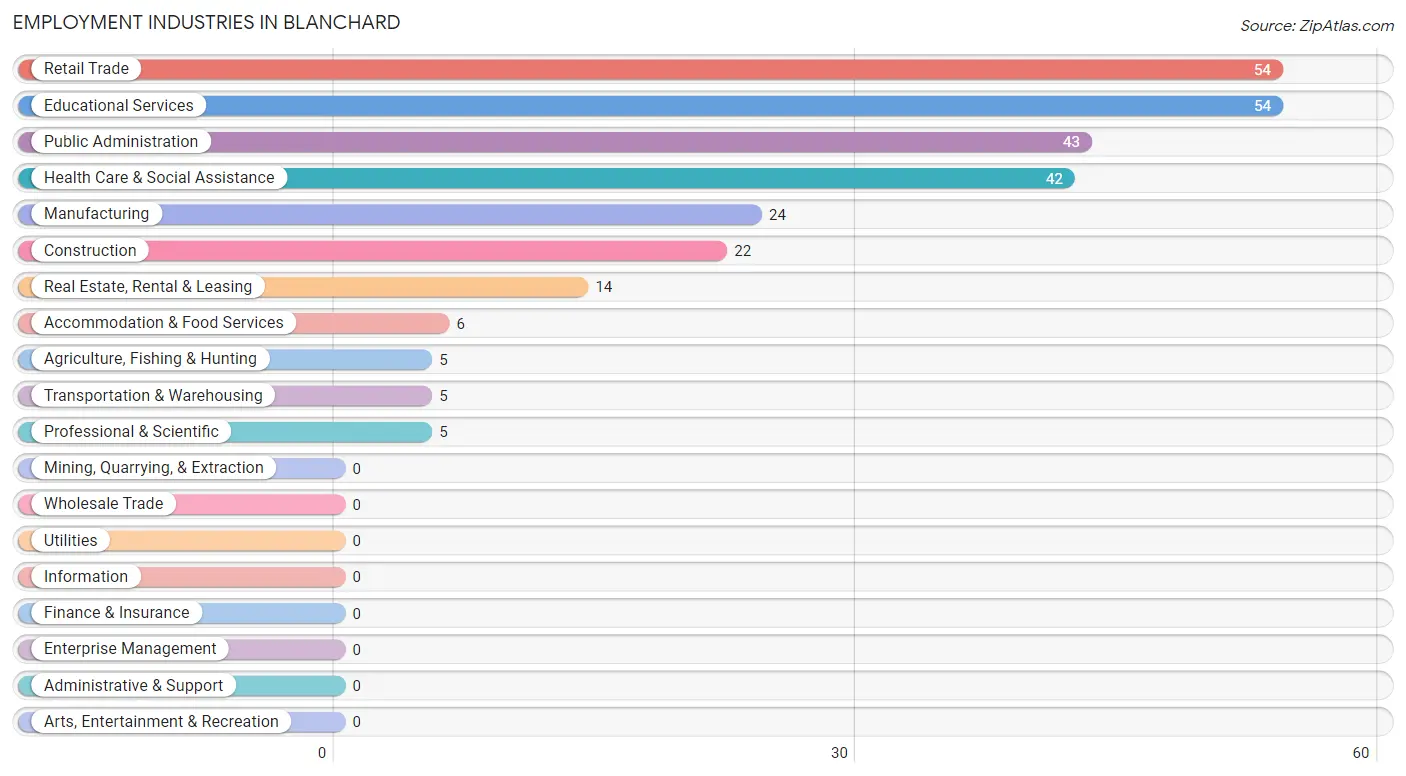
Employment Industries in Blanchard
The major employment industries in Blanchard include Retail Trade (54 | 19.4%), Educational Services (54 | 19.4%), Public Administration (43 | 15.4%), Health Care & Social Assistance (42 | 15.0%), and Manufacturing (24 | 8.6%).
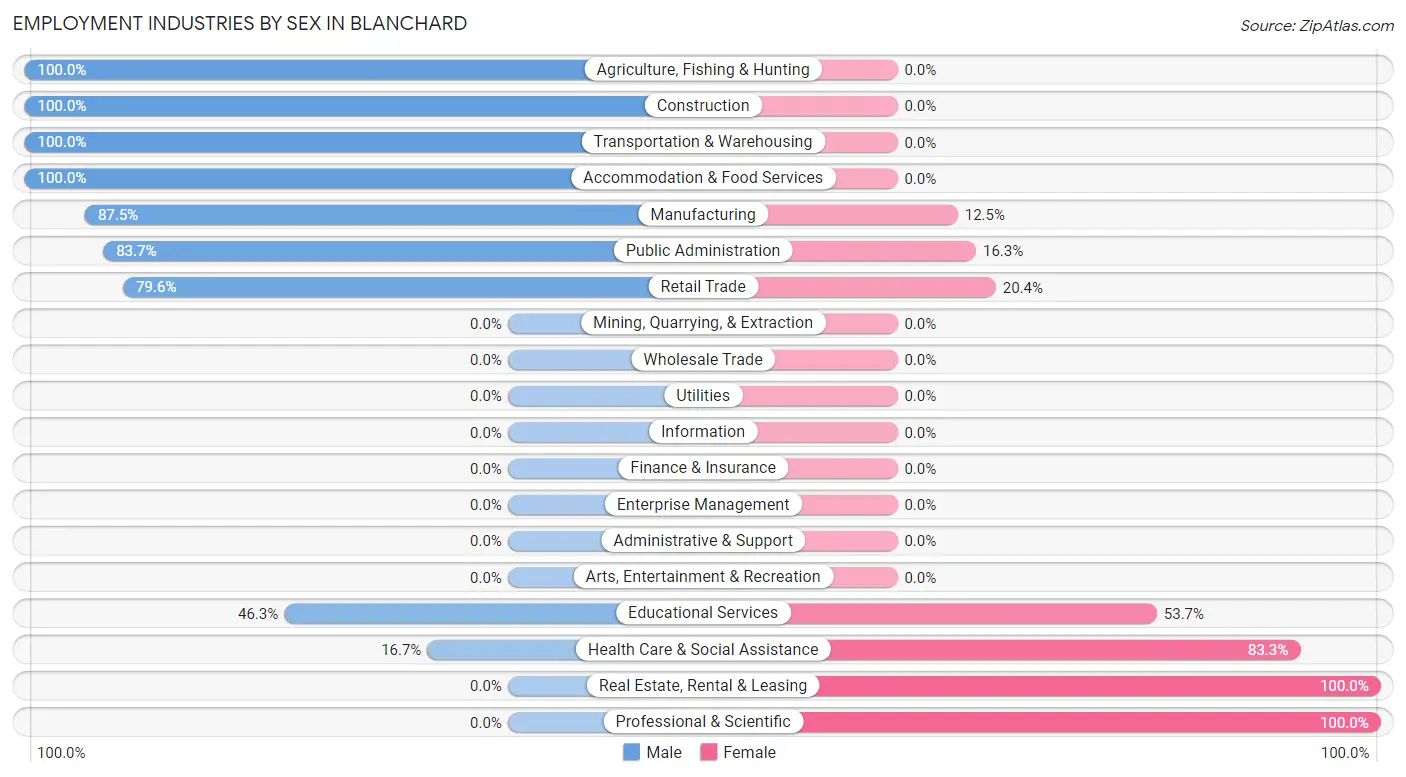
Employment Industries by Sex in Blanchard
The Blanchard industries that see more men than women are Agriculture, Fishing & Hunting (100.0%), Construction (100.0%), and Transportation & Warehousing (100.0%), whereas the industries that tend to have a higher number of women are Real Estate, Rental & Leasing (100.0%), Professional & Scientific (100.0%), and Health Care & Social Assistance (83.3%).
| Industry | Male | Female |
| Agriculture, Fishing & Hunting | 5 (100.0%) | 0 (0.0%) |
| Mining, Quarrying, & Extraction | 0 (0.0%) | 0 (0.0%) |
| Construction | 22 (100.0%) | 0 (0.0%) |
| Manufacturing | 21 (87.5%) | 3 (12.5%) |
| Wholesale Trade | 0 (0.0%) | 0 (0.0%) |
| Retail Trade | 43 (79.6%) | 11 (20.4%) |
| Transportation & Warehousing | 5 (100.0%) | 0 (0.0%) |
| Utilities | 0 (0.0%) | 0 (0.0%) |
| Information | 0 (0.0%) | 0 (0.0%) |
| Finance & Insurance | 0 (0.0%) | 0 (0.0%) |
| Real Estate, Rental & Leasing | 0 (0.0%) | 14 (100.0%) |
| Professional & Scientific | 0 (0.0%) | 5 (100.0%) |
| Enterprise Management | 0 (0.0%) | 0 (0.0%) |
| Administrative & Support | 0 (0.0%) | 0 (0.0%) |
| Educational Services | 25 (46.3%) | 29 (53.7%) |
| Health Care & Social Assistance | 7 (16.7%) | 35 (83.3%) |
| Arts, Entertainment & Recreation | 0 (0.0%) | 0 (0.0%) |
| Accommodation & Food Services | 6 (100.0%) | 0 (0.0%) |
| Public Administration | 36 (83.7%) | 7 (16.3%) |
| Total | 175 (62.7%) | 104 (37.3%) |
Education in Blanchard
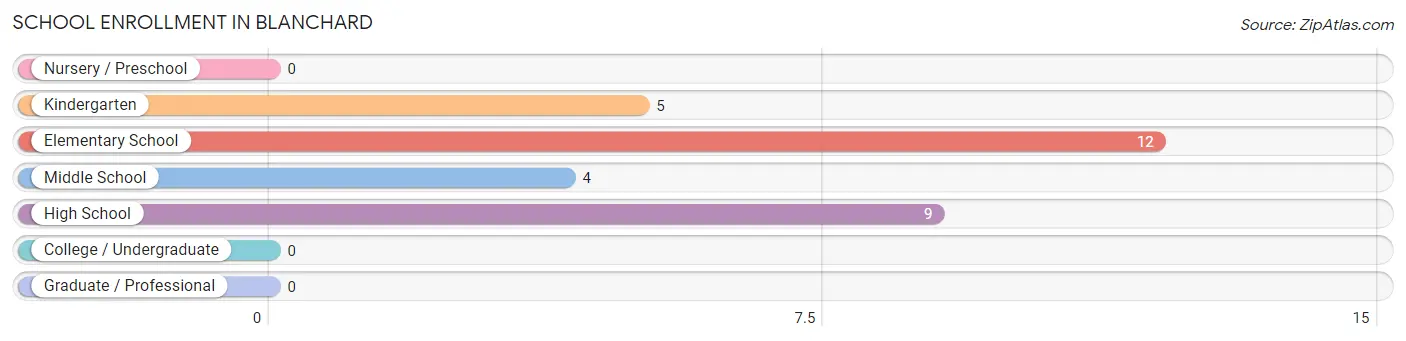
School Enrollment in Blanchard
The most common levels of schooling among the 30 students in Blanchard are elementary school (12 | 40.0%), high school (9 | 30.0%), and kindergarten (5 | 16.7%).
| School Level | # Students | % Students |
| Nursery / Preschool | 0 | 0.0% |
| Kindergarten | 5 | 16.7% |
| Elementary School | 12 | 40.0% |
| Middle School | 4 | 13.3% |
| High School | 9 | 30.0% |
| College / Undergraduate | 0 | 0.0% |
| Graduate / Professional | 0 | 0.0% |
| Total | 30 | 100.0% |
School Enrollment by Age by Funding Source in Blanchard
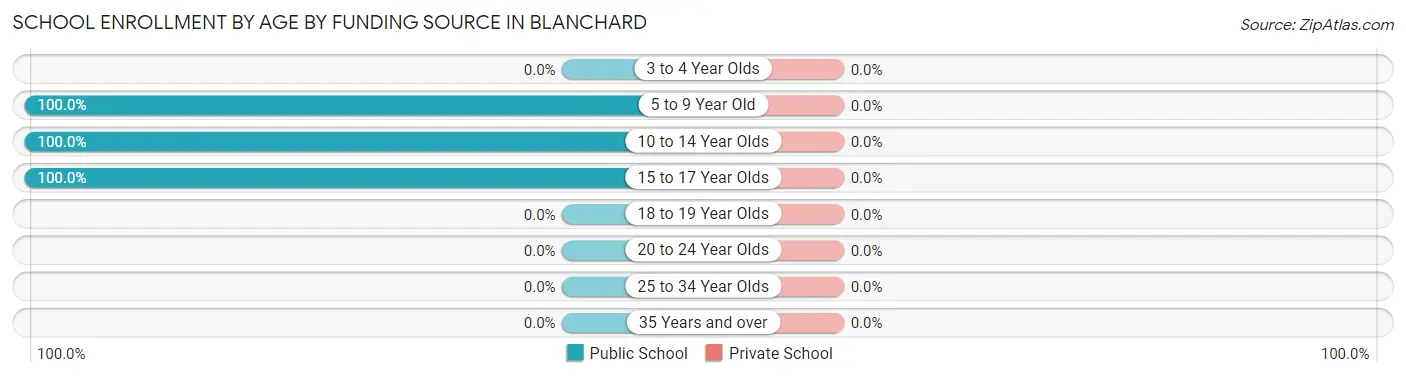
| Age Bracket | Public School | Private School |
| 3 to 4 Year Olds | 0 (0.0%) | 0 (0.0%) |
| 5 to 9 Year Old | 17 (100.0%) | 0 (0.0%) |
| 10 to 14 Year Olds | 4 (100.0%) | 0 (0.0%) |
| 15 to 17 Year Olds | 9 (100.0%) | 0 (0.0%) |
| 18 to 19 Year Olds | 0 (0.0%) | 0 (0.0%) |
| 20 to 24 Year Olds | 0 (0.0%) | 0 (0.0%) |
| 25 to 34 Year Olds | 0 (0.0%) | 0 (0.0%) |
| 35 Years and over | 0 (0.0%) | 0 (0.0%) |
| Total | 30 (100.0%) | 0 (0.0%) |
Educational Attainment by Field of Study in Blanchard
Business (39 | 42.4%), social sciences (14 | 15.2%), bio, nature & agricultural (9 | 9.8%), science & technology (8 | 8.7%), and education (8 | 8.7%) are the most common fields of study among 92 individuals in Blanchard who have obtained a bachelor's degree or higher.
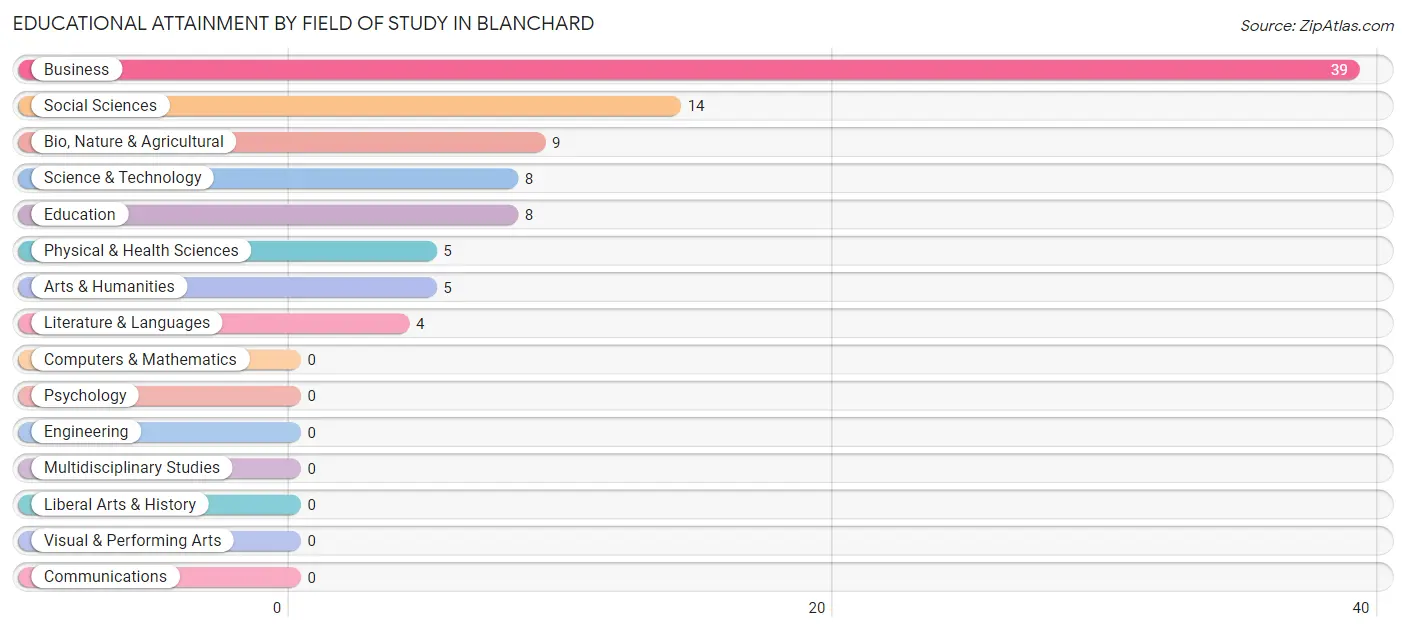
| Field of Study | # Graduates | % Graduates |
| Computers & Mathematics | 0 | 0.0% |
| Bio, Nature & Agricultural | 9 | 9.8% |
| Physical & Health Sciences | 5 | 5.4% |
| Psychology | 0 | 0.0% |
| Social Sciences | 14 | 15.2% |
| Engineering | 0 | 0.0% |
| Multidisciplinary Studies | 0 | 0.0% |
| Science & Technology | 8 | 8.7% |
| Business | 39 | 42.4% |
| Education | 8 | 8.7% |
| Literature & Languages | 4 | 4.3% |
| Liberal Arts & History | 0 | 0.0% |
| Visual & Performing Arts | 0 | 0.0% |
| Communications | 0 | 0.0% |
| Arts & Humanities | 5 | 5.4% |
| Total | 92 | 100.0% |
Transportation & Commute in Blanchard
Vehicle Availability by Sex in Blanchard
The most prevalent vehicle ownership categories in Blanchard are males with 2 vehicles (65, accounting for 37.1%) and females with 2 vehicles (21, making up 62.5%).
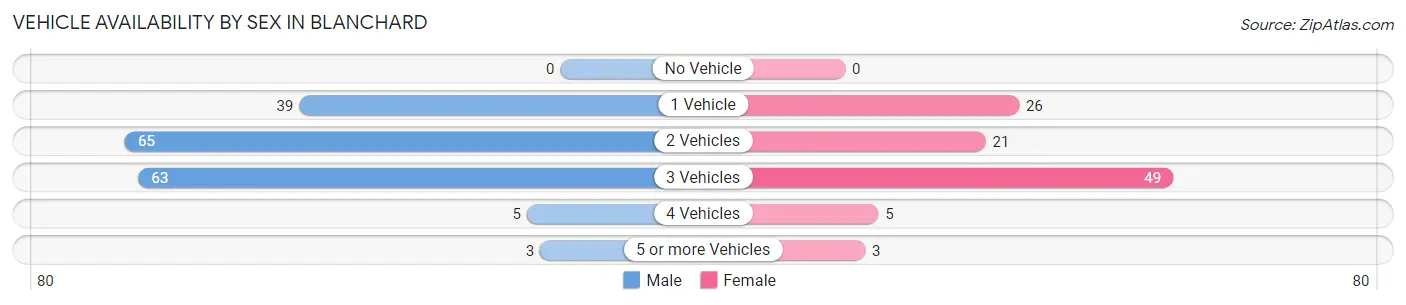
| Vehicles Available | Male | Female |
| No Vehicle | 0 (0.0%) | 0 (0.0%) |
| 1 Vehicle | 39 (22.3%) | 26 (25.0%) |
| 2 Vehicles | 65 (37.1%) | 21 (20.2%) |
| 3 Vehicles | 63 (36.0%) | 49 (47.1%) |
| 4 Vehicles | 5 (2.9%) | 5 (4.8%) |
| 5 or more Vehicles | 3 (1.7%) | 3 (2.9%) |
| Total | 175 (100.0%) | 104 (100.0%) |
Commute Time in Blanchard
The most frequently occuring commute durations in Blanchard are 30 to 34 minutes (71 commuters, 26.0%), 20 to 24 minutes (40 commuters, 14.6%), and 60 to 89 minutes (36 commuters, 13.2%).
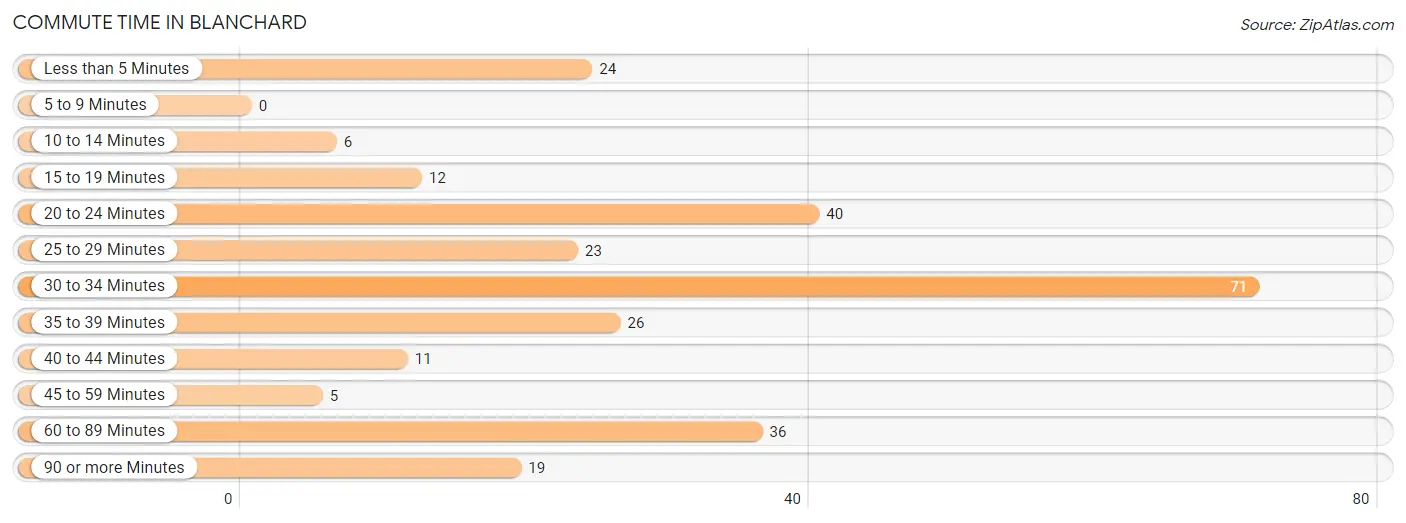
| Commute Time | # Commuters | % Commuters |
| Less than 5 Minutes | 24 | 8.8% |
| 5 to 9 Minutes | 0 | 0.0% |
| 10 to 14 Minutes | 6 | 2.2% |
| 15 to 19 Minutes | 12 | 4.4% |
| 20 to 24 Minutes | 40 | 14.6% |
| 25 to 29 Minutes | 23 | 8.4% |
| 30 to 34 Minutes | 71 | 26.0% |
| 35 to 39 Minutes | 26 | 9.5% |
| 40 to 44 Minutes | 11 | 4.0% |
| 45 to 59 Minutes | 5 | 1.8% |
| 60 to 89 Minutes | 36 | 13.2% |
| 90 or more Minutes | 19 | 7.0% |
Commute Time by Sex in Blanchard
The most common commute times in Blanchard are 30 to 34 minutes (48 commuters, 27.4%) for males and 20 to 24 minutes (35 commuters, 35.7%) for females.
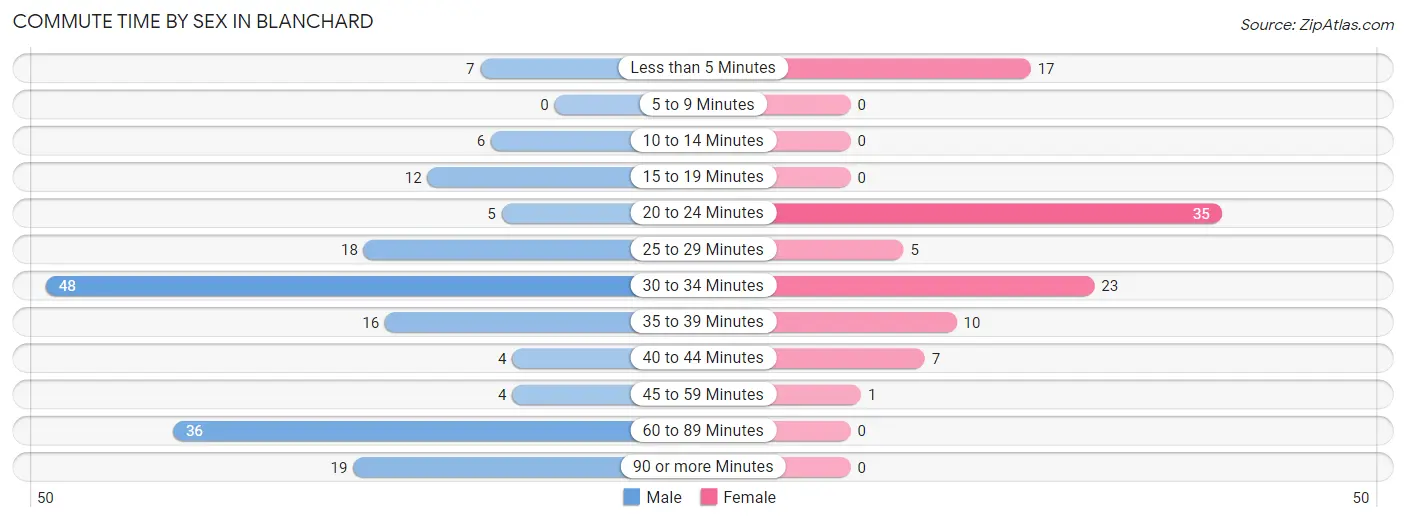
| Commute Time | Male | Female |
| Less than 5 Minutes | 7 (4.0%) | 17 (17.3%) |
| 5 to 9 Minutes | 0 (0.0%) | 0 (0.0%) |
| 10 to 14 Minutes | 6 (3.4%) | 0 (0.0%) |
| 15 to 19 Minutes | 12 (6.9%) | 0 (0.0%) |
| 20 to 24 Minutes | 5 (2.9%) | 35 (35.7%) |
| 25 to 29 Minutes | 18 (10.3%) | 5 (5.1%) |
| 30 to 34 Minutes | 48 (27.4%) | 23 (23.5%) |
| 35 to 39 Minutes | 16 (9.1%) | 10 (10.2%) |
| 40 to 44 Minutes | 4 (2.3%) | 7 (7.1%) |
| 45 to 59 Minutes | 4 (2.3%) | 1 (1.0%) |
| 60 to 89 Minutes | 36 (20.6%) | 0 (0.0%) |
| 90 or more Minutes | 19 (10.9%) | 0 (0.0%) |
Time of Departure to Work by Sex in Blanchard
The most frequent times of departure to work in Blanchard are 7:00 AM to 7:29 AM (57, 32.6%) for males and 7:30 AM to 7:59 AM (36, 36.7%) for females.
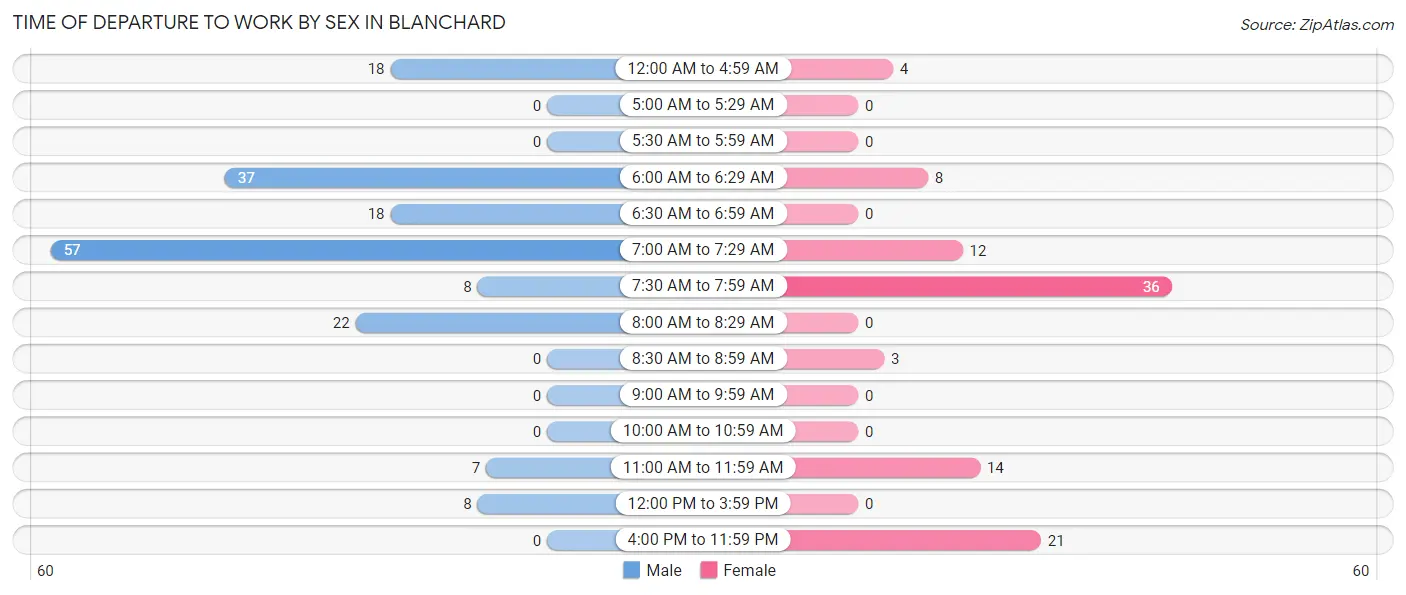
| Time of Departure | Male | Female |
| 12:00 AM to 4:59 AM | 18 (10.3%) | 4 (4.1%) |
| 5:00 AM to 5:29 AM | 0 (0.0%) | 0 (0.0%) |
| 5:30 AM to 5:59 AM | 0 (0.0%) | 0 (0.0%) |
| 6:00 AM to 6:29 AM | 37 (21.1%) | 8 (8.2%) |
| 6:30 AM to 6:59 AM | 18 (10.3%) | 0 (0.0%) |
| 7:00 AM to 7:29 AM | 57 (32.6%) | 12 (12.2%) |
| 7:30 AM to 7:59 AM | 8 (4.6%) | 36 (36.7%) |
| 8:00 AM to 8:29 AM | 22 (12.6%) | 0 (0.0%) |
| 8:30 AM to 8:59 AM | 0 (0.0%) | 3 (3.1%) |
| 9:00 AM to 9:59 AM | 0 (0.0%) | 0 (0.0%) |
| 10:00 AM to 10:59 AM | 0 (0.0%) | 0 (0.0%) |
| 11:00 AM to 11:59 AM | 7 (4.0%) | 14 (14.3%) |
| 12:00 PM to 3:59 PM | 8 (4.6%) | 0 (0.0%) |
| 4:00 PM to 11:59 PM | 0 (0.0%) | 21 (21.4%) |
| Total | 175 (100.0%) | 98 (100.0%) |
Housing Occupancy in Blanchard
Occupancy by Ownership in Blanchard
Of the total 227 dwellings in Blanchard, owner-occupied units account for 174 (76.6%), while renter-occupied units make up 53 (23.4%).
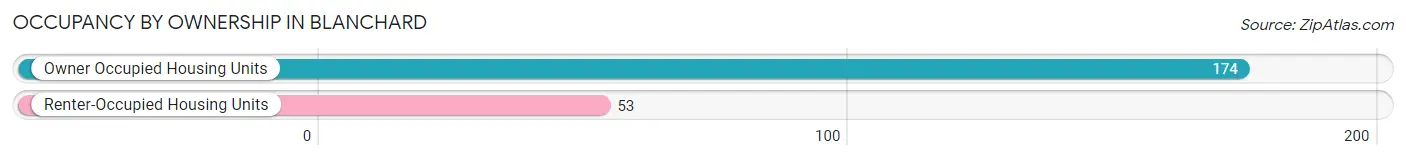
| Occupancy | # Housing Units | % Housing Units |
| Owner Occupied Housing Units | 174 | 76.6% |
| Renter-Occupied Housing Units | 53 | 23.4% |
| Total Occupied Housing Units | 227 | 100.0% |
Occupancy by Household Size in Blanchard
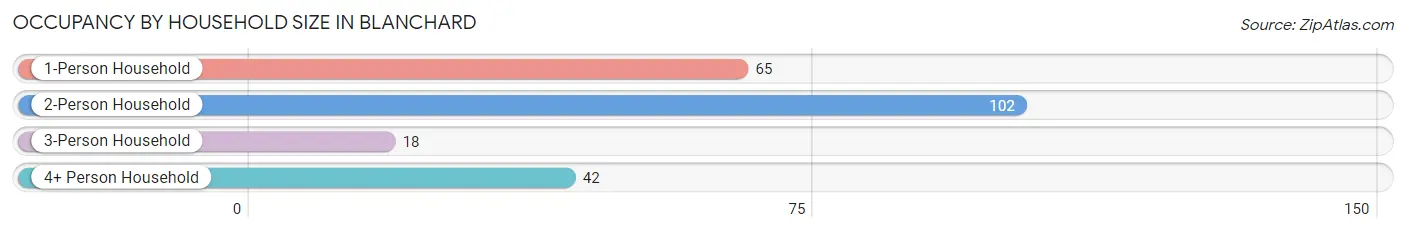
| Household Size | # Housing Units | % Housing Units |
| 1-Person Household | 65 | 28.6% |
| 2-Person Household | 102 | 44.9% |
| 3-Person Household | 18 | 7.9% |
| 4+ Person Household | 42 | 18.5% |
| Total Housing Units | 227 | 100.0% |
Occupancy by Ownership by Household Size in Blanchard
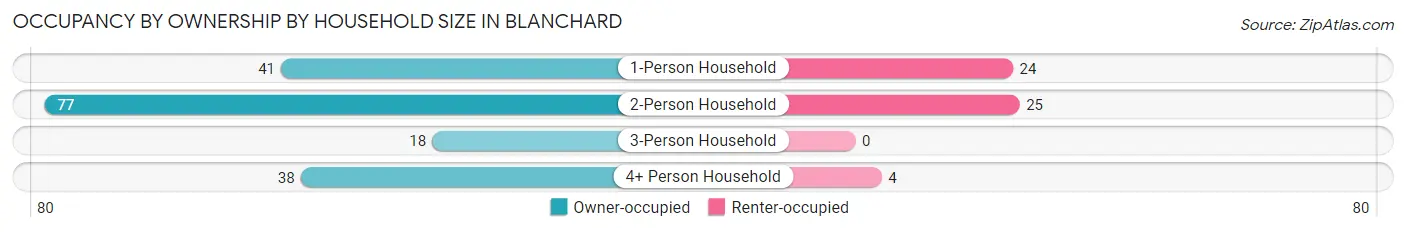
| Household Size | Owner-occupied | Renter-occupied |
| 1-Person Household | 41 (63.1%) | 24 (36.9%) |
| 2-Person Household | 77 (75.5%) | 25 (24.5%) |
| 3-Person Household | 18 (100.0%) | 0 (0.0%) |
| 4+ Person Household | 38 (90.5%) | 4 (9.5%) |
| Total Housing Units | 174 (76.6%) | 53 (23.4%) |
Occupancy by Educational Attainment in Blanchard
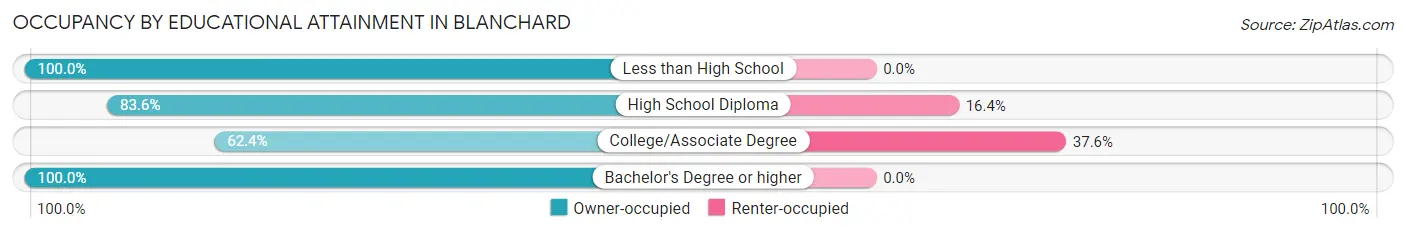
| Household Size | Owner-occupied | Renter-occupied |
| Less than High School | 9 (100.0%) | 0 (0.0%) |
| High School Diploma | 46 (83.6%) | 9 (16.4%) |
| College/Associate Degree | 73 (62.4%) | 44 (37.6%) |
| Bachelor's Degree or higher | 46 (100.0%) | 0 (0.0%) |
Occupancy by Age of Householder in Blanchard
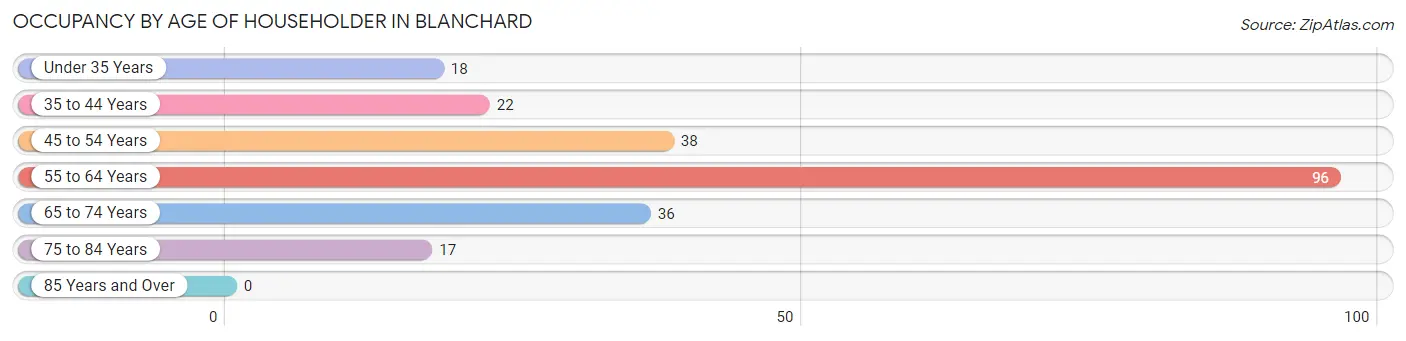
| Age Bracket | # Households | % Households |
| Under 35 Years | 18 | 7.9% |
| 35 to 44 Years | 22 | 9.7% |
| 45 to 54 Years | 38 | 16.7% |
| 55 to 64 Years | 96 | 42.3% |
| 65 to 74 Years | 36 | 15.9% |
| 75 to 84 Years | 17 | 7.5% |
| 85 Years and Over | 0 | 0.0% |
| Total | 227 | 100.0% |
Housing Finances in Blanchard
Median Income by Occupancy in Blanchard
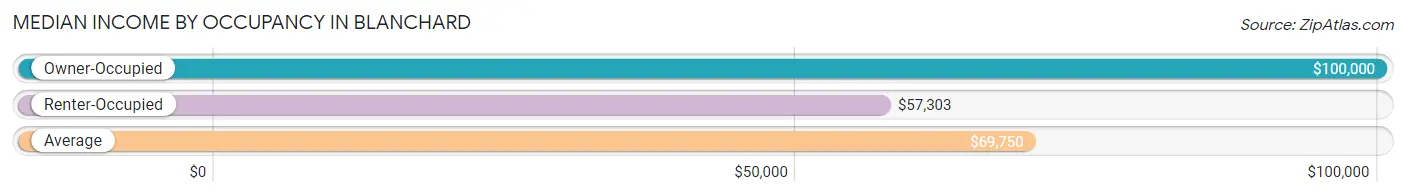
| Occupancy Type | # Households | Median Income |
| Owner-Occupied | 174 (76.6%) | $100,000 |
| Renter-Occupied | 53 (23.4%) | $57,303 |
| Average | 227 (100.0%) | $69,750 |
Occupancy by Householder Income Bracket in Blanchard
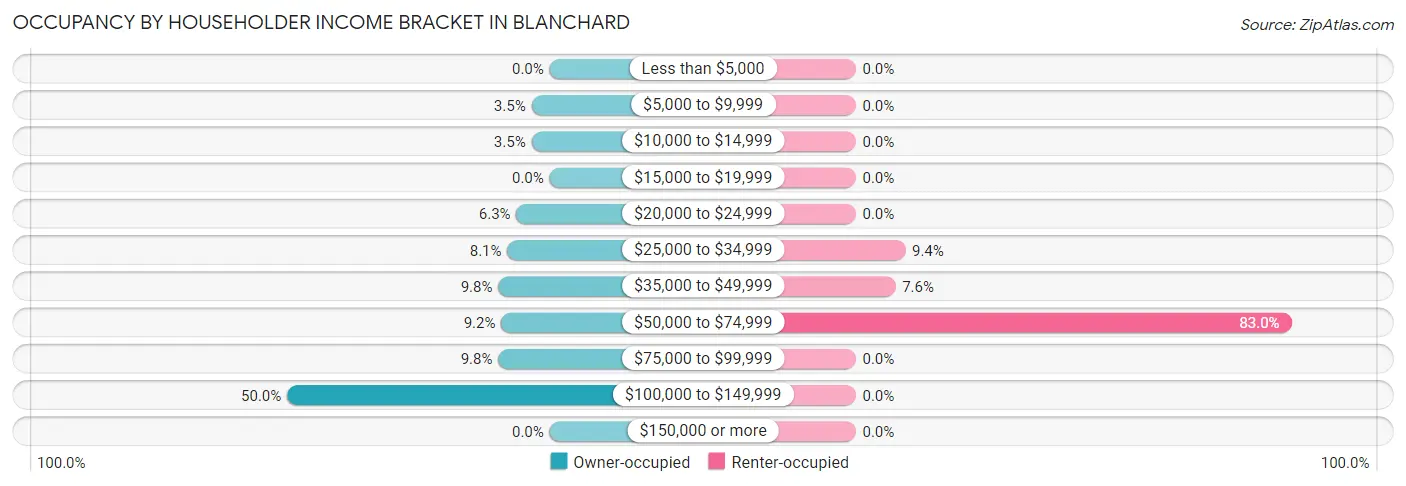
| Income Bracket | Owner-occupied | Renter-occupied |
| Less than $5,000 | 0 (0.0%) | 0 (0.0%) |
| $5,000 to $9,999 | 6 (3.5%) | 0 (0.0%) |
| $10,000 to $14,999 | 6 (3.5%) | 0 (0.0%) |
| $15,000 to $19,999 | 0 (0.0%) | 0 (0.0%) |
| $20,000 to $24,999 | 11 (6.3%) | 0 (0.0%) |
| $25,000 to $34,999 | 14 (8.1%) | 5 (9.4%) |
| $35,000 to $49,999 | 17 (9.8%) | 4 (7.5%) |
| $50,000 to $74,999 | 16 (9.2%) | 44 (83.0%) |
| $75,000 to $99,999 | 17 (9.8%) | 0 (0.0%) |
| $100,000 to $149,999 | 87 (50.0%) | 0 (0.0%) |
| $150,000 or more | 0 (0.0%) | 0 (0.0%) |
| Total | 174 (100.0%) | 53 (100.0%) |
Monthly Housing Cost Tiers in Blanchard
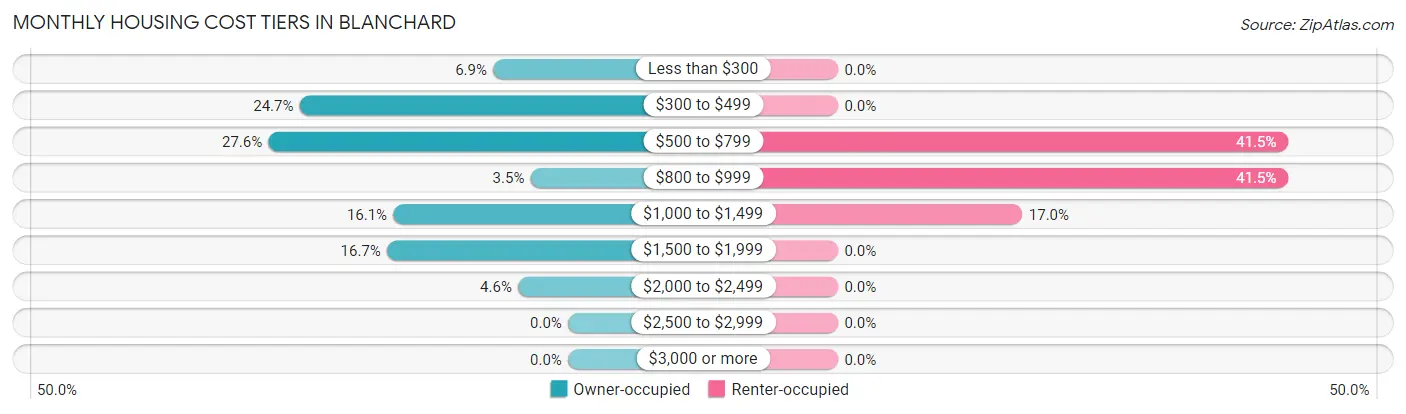
| Monthly Cost | Owner-occupied | Renter-occupied |
| Less than $300 | 12 (6.9%) | 0 (0.0%) |
| $300 to $499 | 43 (24.7%) | 0 (0.0%) |
| $500 to $799 | 48 (27.6%) | 22 (41.5%) |
| $800 to $999 | 6 (3.5%) | 22 (41.5%) |
| $1,000 to $1,499 | 28 (16.1%) | 9 (17.0%) |
| $1,500 to $1,999 | 29 (16.7%) | 0 (0.0%) |
| $2,000 to $2,499 | 8 (4.6%) | 0 (0.0%) |
| $2,500 to $2,999 | 0 (0.0%) | 0 (0.0%) |
| $3,000 or more | 0 (0.0%) | 0 (0.0%) |
| Total | 174 (100.0%) | 53 (100.0%) |
Physical Housing Characteristics in Blanchard
Housing Structures in Blanchard
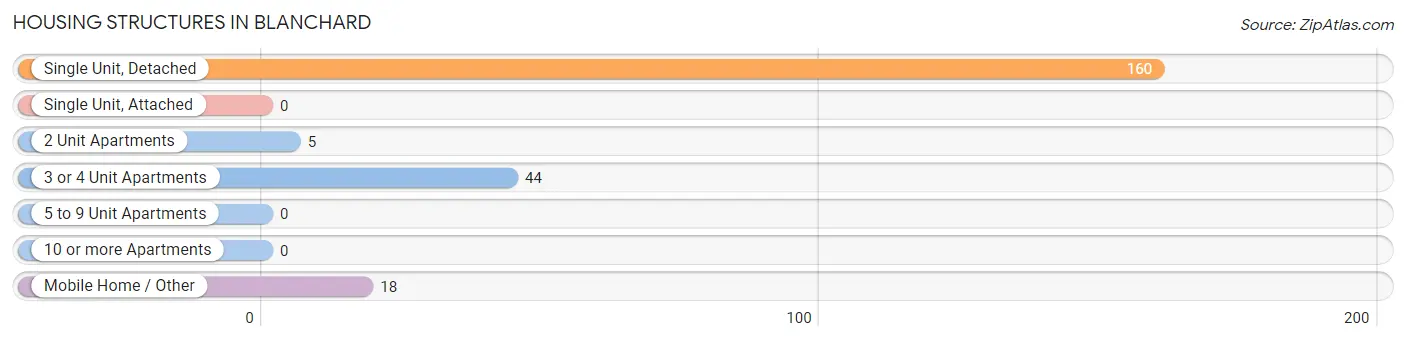
| Structure Type | # Housing Units | % Housing Units |
| Single Unit, Detached | 160 | 70.5% |
| Single Unit, Attached | 0 | 0.0% |
| 2 Unit Apartments | 5 | 2.2% |
| 3 or 4 Unit Apartments | 44 | 19.4% |
| 5 to 9 Unit Apartments | 0 | 0.0% |
| 10 or more Apartments | 0 | 0.0% |
| Mobile Home / Other | 18 | 7.9% |
| Total | 227 | 100.0% |
Housing Structures by Occupancy in Blanchard
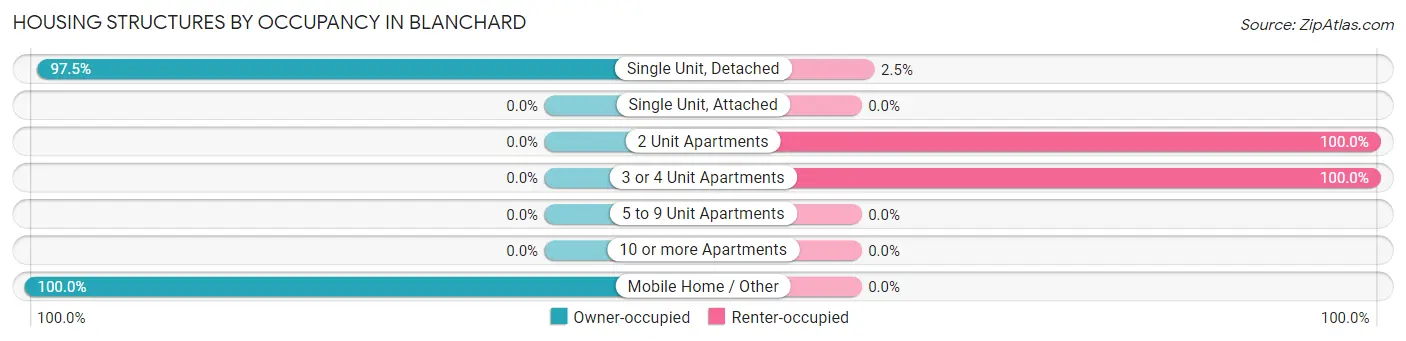
| Structure Type | Owner-occupied | Renter-occupied |
| Single Unit, Detached | 156 (97.5%) | 4 (2.5%) |
| Single Unit, Attached | 0 (0.0%) | 0 (0.0%) |
| 2 Unit Apartments | 0 (0.0%) | 5 (100.0%) |
| 3 or 4 Unit Apartments | 0 (0.0%) | 44 (100.0%) |
| 5 to 9 Unit Apartments | 0 (0.0%) | 0 (0.0%) |
| 10 or more Apartments | 0 (0.0%) | 0 (0.0%) |
| Mobile Home / Other | 18 (100.0%) | 0 (0.0%) |
| Total | 174 (76.6%) | 53 (23.4%) |
Housing Structures by Number of Rooms in Blanchard
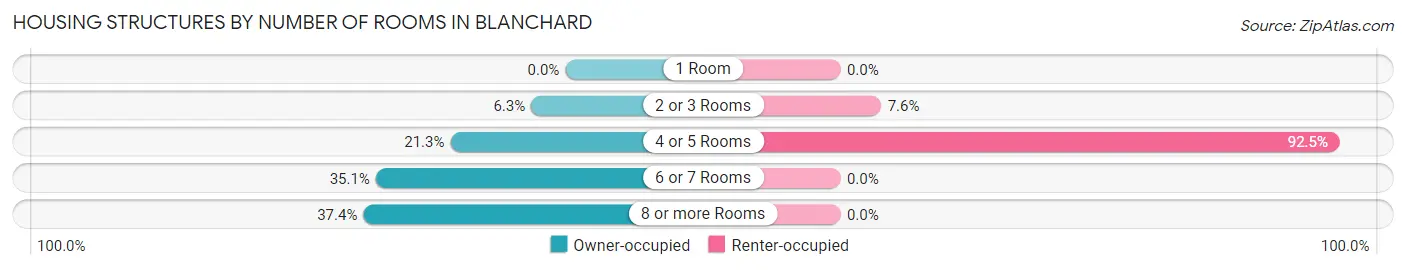
| Number of Rooms | Owner-occupied | Renter-occupied |
| 1 Room | 0 (0.0%) | 0 (0.0%) |
| 2 or 3 Rooms | 11 (6.3%) | 4 (7.5%) |
| 4 or 5 Rooms | 37 (21.3%) | 49 (92.4%) |
| 6 or 7 Rooms | 61 (35.1%) | 0 (0.0%) |
| 8 or more Rooms | 65 (37.4%) | 0 (0.0%) |
| Total | 174 (100.0%) | 53 (100.0%) |
Housing Structure by Heating Type in Blanchard
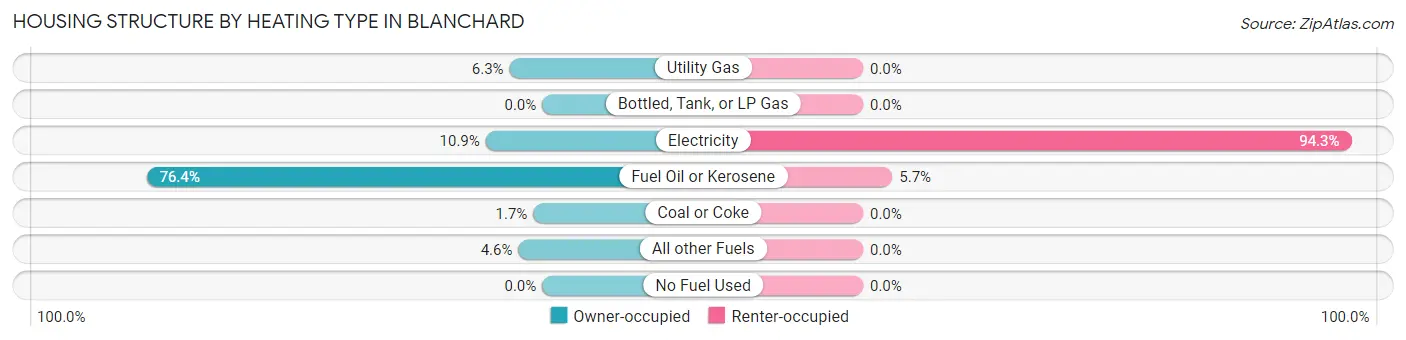
| Heating Type | Owner-occupied | Renter-occupied |
| Utility Gas | 11 (6.3%) | 0 (0.0%) |
| Bottled, Tank, or LP Gas | 0 (0.0%) | 0 (0.0%) |
| Electricity | 19 (10.9%) | 50 (94.3%) |
| Fuel Oil or Kerosene | 133 (76.4%) | 3 (5.7%) |
| Coal or Coke | 3 (1.7%) | 0 (0.0%) |
| All other Fuels | 8 (4.6%) | 0 (0.0%) |
| No Fuel Used | 0 (0.0%) | 0 (0.0%) |
| Total | 174 (100.0%) | 53 (100.0%) |
Household Vehicle Usage in Blanchard
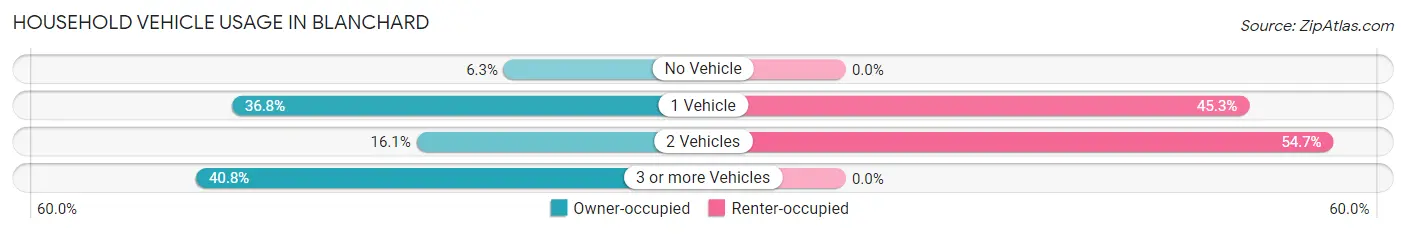
| Vehicles per Household | Owner-occupied | Renter-occupied |
| No Vehicle | 11 (6.3%) | 0 (0.0%) |
| 1 Vehicle | 64 (36.8%) | 24 (45.3%) |
| 2 Vehicles | 28 (16.1%) | 29 (54.7%) |
| 3 or more Vehicles | 71 (40.8%) | 0 (0.0%) |
| Total | 174 (100.0%) | 53 (100.0%) |
Real Estate & Mortgages in Blanchard
Real Estate and Mortgage Overview in Blanchard
| Characteristic | Without Mortgage | With Mortgage |
| Housing Units | 89 | 85 |
| Median Property Value | $136,700 | $189,400 |
| Median Household Income | $89,063 | $0 |
| Monthly Housing Costs | $484 | $0 |
| Real Estate Taxes | $1,393 | $0 |
Property Value by Mortgage Status in Blanchard
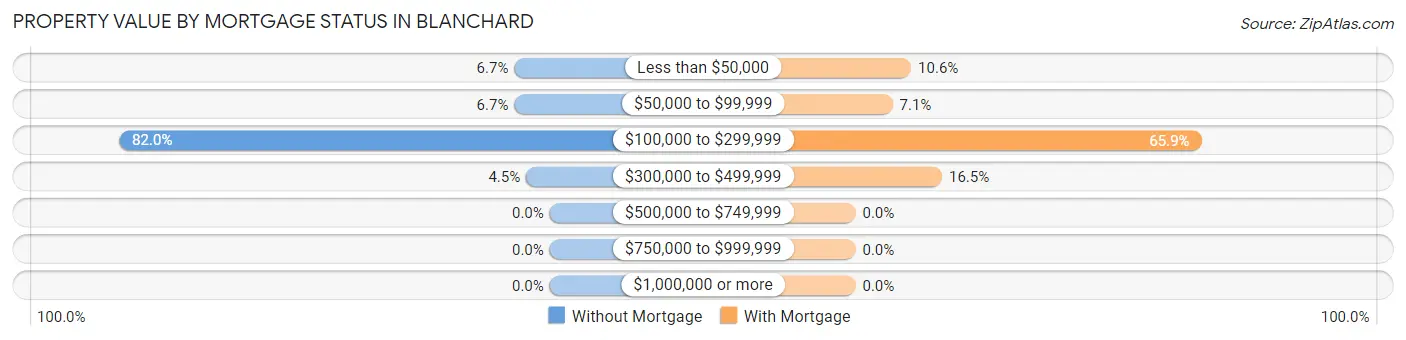
| Property Value | Without Mortgage | With Mortgage |
| Less than $50,000 | 6 (6.7%) | 9 (10.6%) |
| $50,000 to $99,999 | 6 (6.7%) | 6 (7.1%) |
| $100,000 to $299,999 | 73 (82.0%) | 56 (65.9%) |
| $300,000 to $499,999 | 4 (4.5%) | 14 (16.5%) |
| $500,000 to $749,999 | 0 (0.0%) | 0 (0.0%) |
| $750,000 to $999,999 | 0 (0.0%) | 0 (0.0%) |
| $1,000,000 or more | 0 (0.0%) | 0 (0.0%) |
| Total | 89 (100.0%) | 85 (100.0%) |
Household Income by Mortgage Status in Blanchard
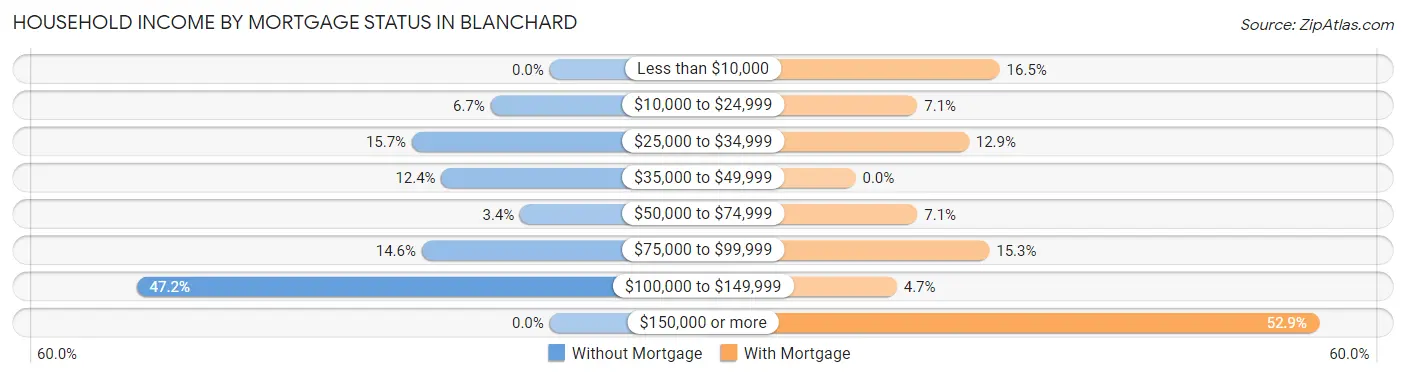
| Household Income | Without Mortgage | With Mortgage |
| Less than $10,000 | 0 (0.0%) | 14 (16.5%) |
| $10,000 to $24,999 | 6 (6.7%) | 6 (7.1%) |
| $25,000 to $34,999 | 14 (15.7%) | 11 (12.9%) |
| $35,000 to $49,999 | 11 (12.4%) | 0 (0.0%) |
| $50,000 to $74,999 | 3 (3.4%) | 6 (7.1%) |
| $75,000 to $99,999 | 13 (14.6%) | 13 (15.3%) |
| $100,000 to $149,999 | 42 (47.2%) | 4 (4.7%) |
| $150,000 or more | 0 (0.0%) | 45 (52.9%) |
| Total | 89 (100.0%) | 85 (100.0%) |
Property Value to Household Income Ratio in Blanchard
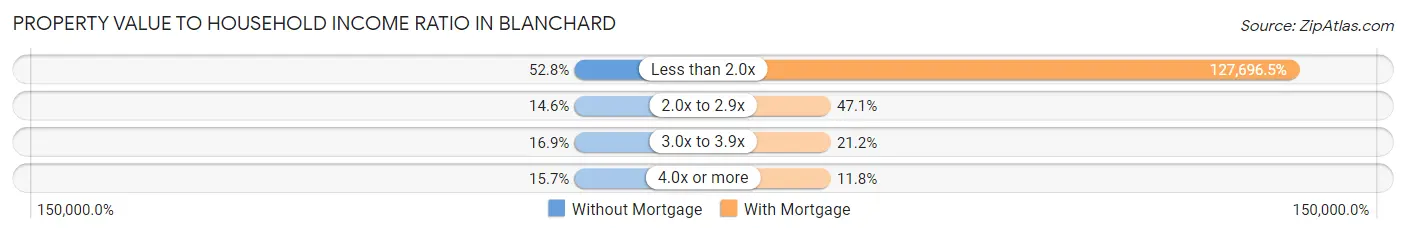
| Value-to-Income Ratio | Without Mortgage | With Mortgage |
| Less than 2.0x | 47 (52.8%) | 108,542 (127,696.5%) |
| 2.0x to 2.9x | 13 (14.6%) | 40 (47.1%) |
| 3.0x to 3.9x | 15 (16.9%) | 18 (21.2%) |
| 4.0x or more | 14 (15.7%) | 10 (11.8%) |
| Total | 89 (100.0%) | 85 (100.0%) |
Real Estate Taxes by Mortgage Status in Blanchard
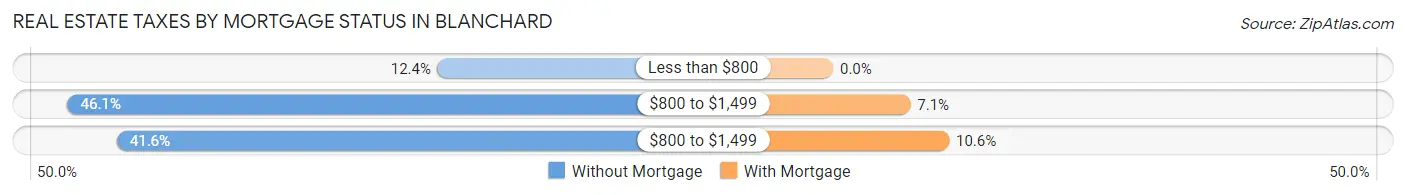
| Property Taxes | Without Mortgage | With Mortgage |
| Less than $800 | 11 (12.4%) | 0 (0.0%) |
| $800 to $1,499 | 41 (46.1%) | 6 (7.1%) |
| $800 to $1,499 | 37 (41.6%) | 9 (10.6%) |
| Total | 89 (100.0%) | 85 (100.0%) |
Health & Disability in Blanchard
Health Insurance Coverage by Age in Blanchard
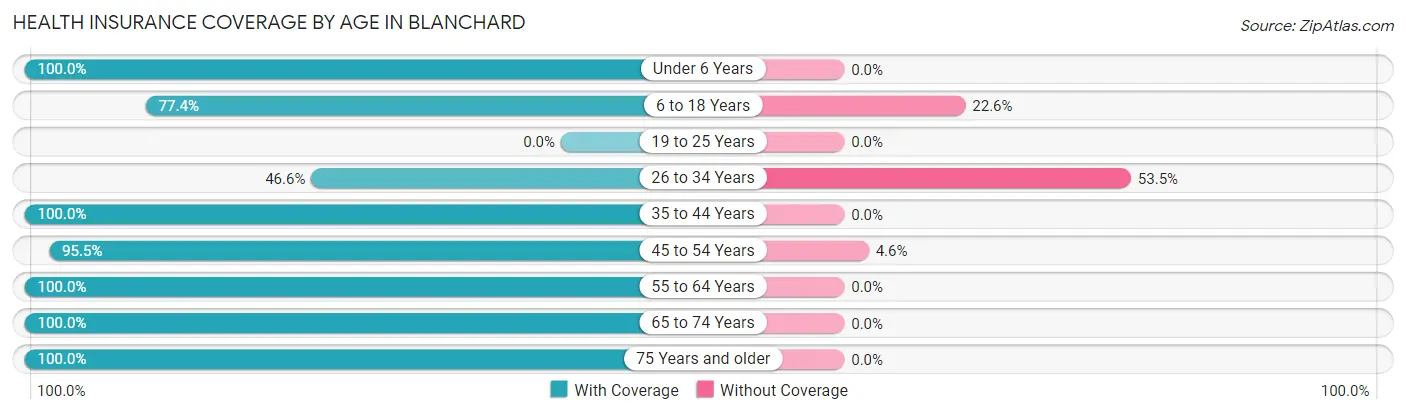
| Age Bracket | With Coverage | Without Coverage |
| Under 6 Years | 9 (100.0%) | 0 (0.0%) |
| 6 to 18 Years | 24 (77.4%) | 7 (22.6%) |
| 19 to 25 Years | 0 (0.0%) | 0 (0.0%) |
| 26 to 34 Years | 27 (46.6%) | 31 (53.4%) |
| 35 to 44 Years | 66 (100.0%) | 0 (0.0%) |
| 45 to 54 Years | 63 (95.5%) | 3 (4.5%) |
| 55 to 64 Years | 178 (100.0%) | 0 (0.0%) |
| 65 to 74 Years | 72 (100.0%) | 0 (0.0%) |
| 75 Years and older | 25 (100.0%) | 0 (0.0%) |
| Total | 464 (91.9%) | 41 (8.1%) |
Health Insurance Coverage by Citizenship Status in Blanchard
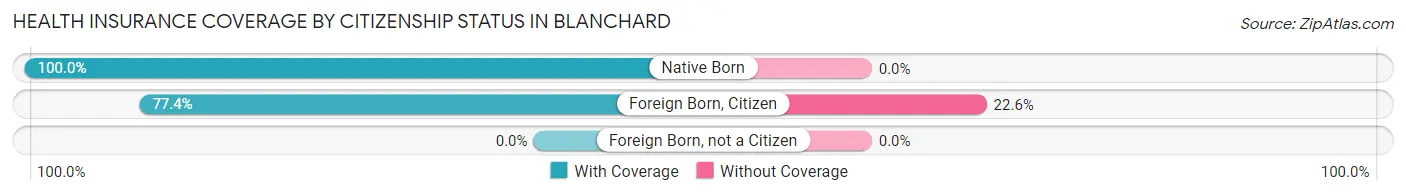
| Citizenship Status | With Coverage | Without Coverage |
| Native Born | 9 (100.0%) | 0 (0.0%) |
| Foreign Born, Citizen | 24 (77.4%) | 7 (22.6%) |
| Foreign Born, not a Citizen | 0 (0.0%) | 0 (0.0%) |
Health Insurance Coverage by Household Income in Blanchard
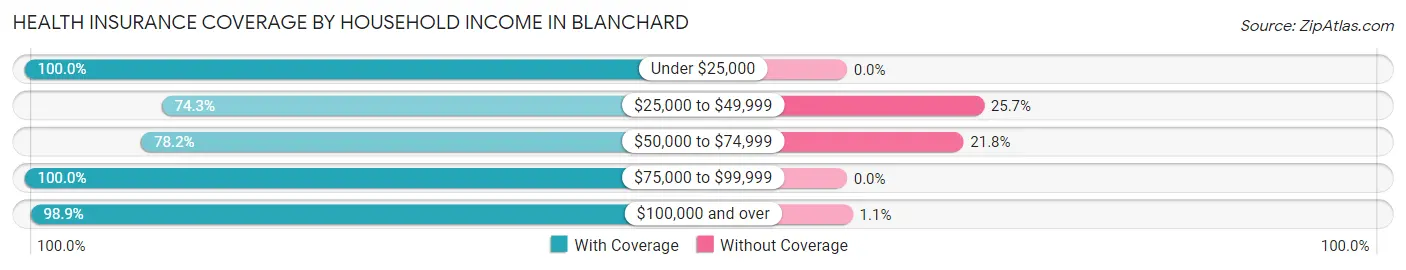
| Household Income | With Coverage | Without Coverage |
| Under $25,000 | 27 (100.0%) | 0 (0.0%) |
| $25,000 to $49,999 | 55 (74.3%) | 19 (25.7%) |
| $50,000 to $74,999 | 68 (78.2%) | 19 (21.8%) |
| $75,000 to $99,999 | 44 (100.0%) | 0 (0.0%) |
| $100,000 and over | 270 (98.9%) | 3 (1.1%) |
Public vs Private Health Insurance Coverage by Age in Blanchard
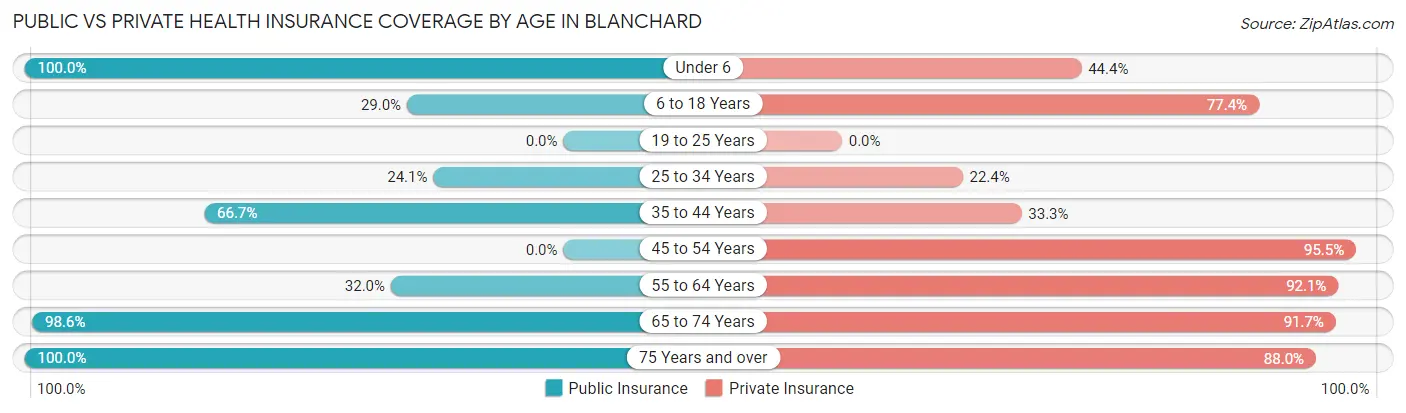
| Age Bracket | Public Insurance | Private Insurance |
| Under 6 | 9 (100.0%) | 4 (44.4%) |
| 6 to 18 Years | 9 (29.0%) | 24 (77.4%) |
| 19 to 25 Years | 0 (0.0%) | 0 (0.0%) |
| 25 to 34 Years | 14 (24.1%) | 13 (22.4%) |
| 35 to 44 Years | 44 (66.7%) | 22 (33.3%) |
| 45 to 54 Years | 0 (0.0%) | 63 (95.5%) |
| 55 to 64 Years | 57 (32.0%) | 164 (92.1%) |
| 65 to 74 Years | 71 (98.6%) | 66 (91.7%) |
| 75 Years and over | 25 (100.0%) | 22 (88.0%) |
| Total | 229 (45.4%) | 378 (74.9%) |
Disability Status by Sex by Age in Blanchard
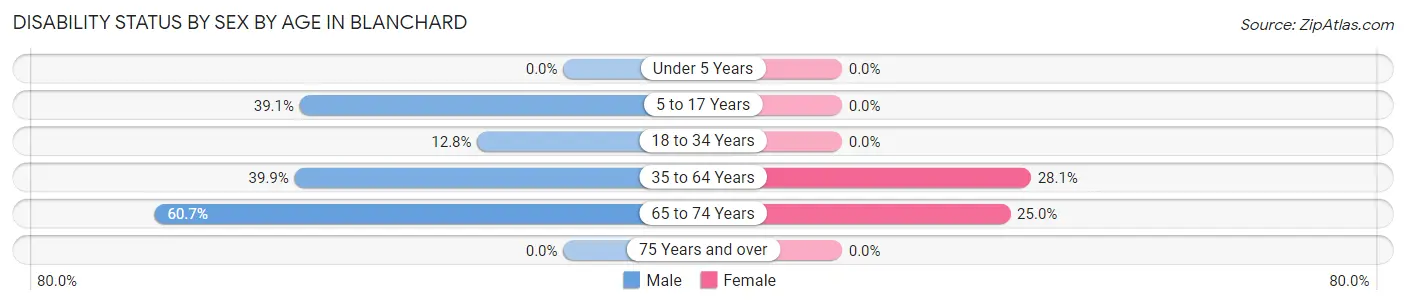
| Age Bracket | Male | Female |
| Under 5 Years | 0 (0.0%) | 0 (0.0%) |
| 5 to 17 Years | 9 (39.1%) | 0 (0.0%) |
| 18 to 34 Years | 6 (12.8%) | 0 (0.0%) |
| 35 to 64 Years | 91 (39.9%) | 23 (28.1%) |
| 65 to 74 Years | 17 (60.7%) | 11 (25.0%) |
| 75 Years and over | 0 (0.0%) | 0 (0.0%) |
Disability Class by Sex by Age in Blanchard
Disability Class: Hearing Difficulty
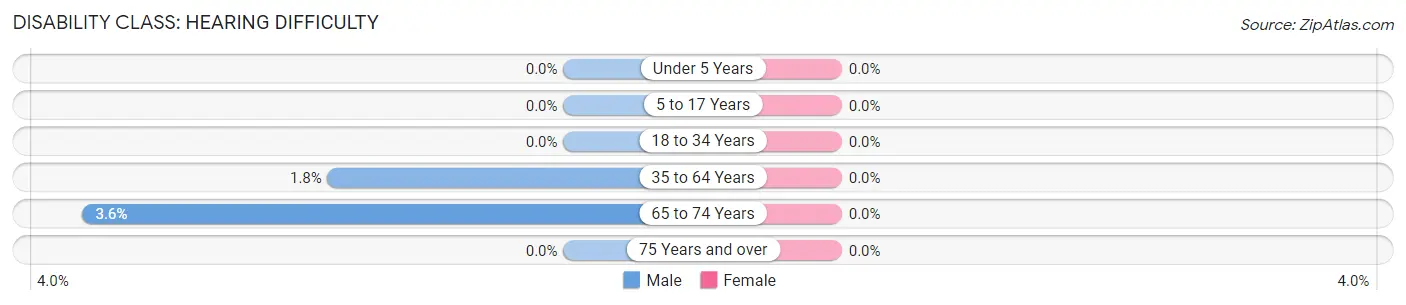
| Age Bracket | Male | Female |
| Under 5 Years | 0 (0.0%) | 0 (0.0%) |
| 5 to 17 Years | 0 (0.0%) | 0 (0.0%) |
| 18 to 34 Years | 0 (0.0%) | 0 (0.0%) |
| 35 to 64 Years | 4 (1.8%) | 0 (0.0%) |
| 65 to 74 Years | 1 (3.6%) | 0 (0.0%) |
| 75 Years and over | 0 (0.0%) | 0 (0.0%) |
Disability Class: Vision Difficulty
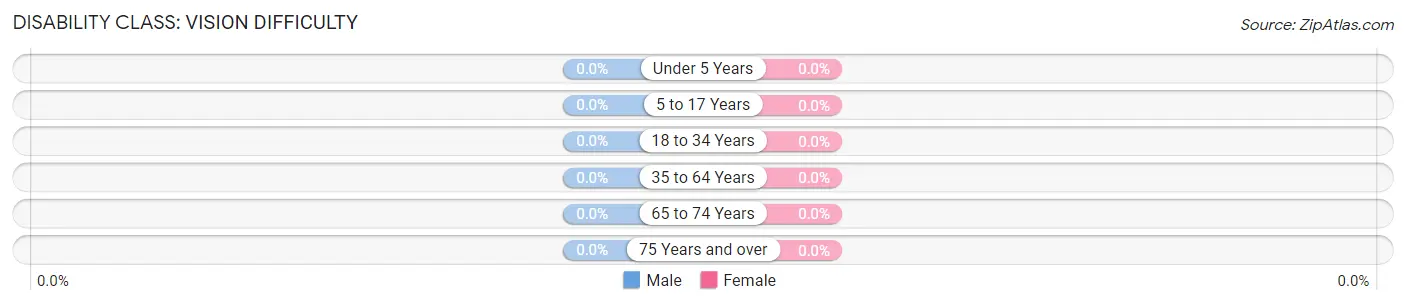
| Age Bracket | Male | Female |
| Under 5 Years | 0 (0.0%) | 0 (0.0%) |
| 5 to 17 Years | 0 (0.0%) | 0 (0.0%) |
| 18 to 34 Years | 0 (0.0%) | 0 (0.0%) |
| 35 to 64 Years | 0 (0.0%) | 0 (0.0%) |
| 65 to 74 Years | 0 (0.0%) | 0 (0.0%) |
| 75 Years and over | 0 (0.0%) | 0 (0.0%) |
Disability Class: Cognitive Difficulty
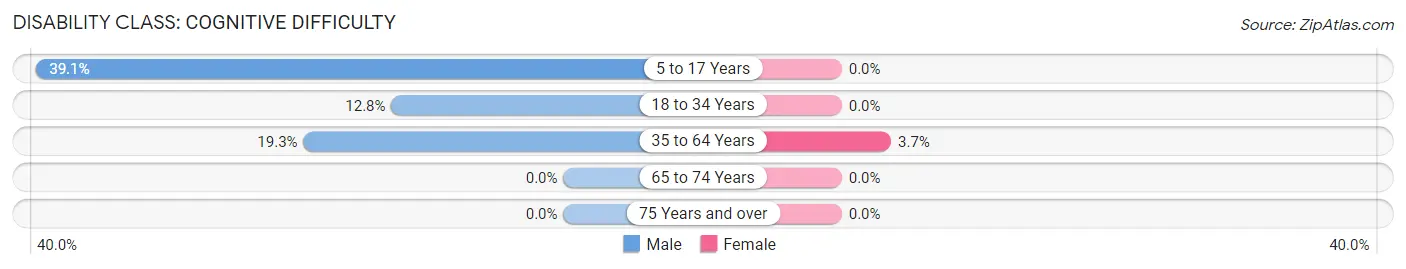
| Age Bracket | Male | Female |
| 5 to 17 Years | 9 (39.1%) | 0 (0.0%) |
| 18 to 34 Years | 6 (12.8%) | 0 (0.0%) |
| 35 to 64 Years | 44 (19.3%) | 3 (3.7%) |
| 65 to 74 Years | 0 (0.0%) | 0 (0.0%) |
| 75 Years and over | 0 (0.0%) | 0 (0.0%) |
Disability Class: Ambulatory Difficulty
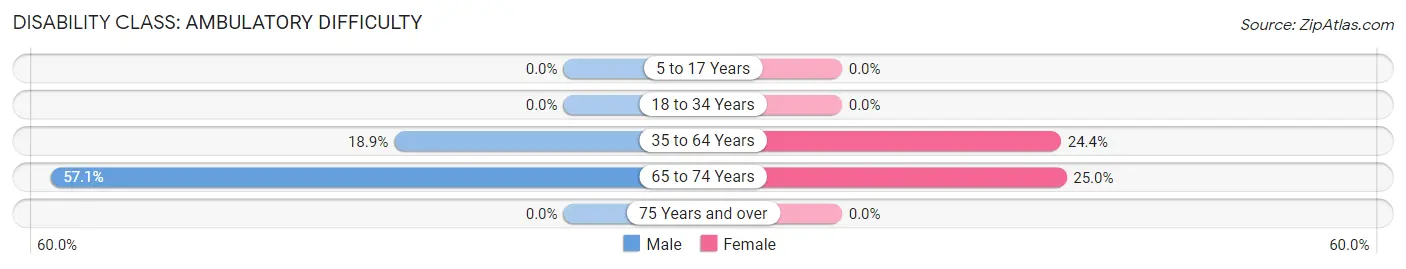
| Age Bracket | Male | Female |
| 5 to 17 Years | 0 (0.0%) | 0 (0.0%) |
| 18 to 34 Years | 0 (0.0%) | 0 (0.0%) |
| 35 to 64 Years | 43 (18.9%) | 20 (24.4%) |
| 65 to 74 Years | 16 (57.1%) | 11 (25.0%) |
| 75 Years and over | 0 (0.0%) | 0 (0.0%) |
Disability Class: Self-Care Difficulty
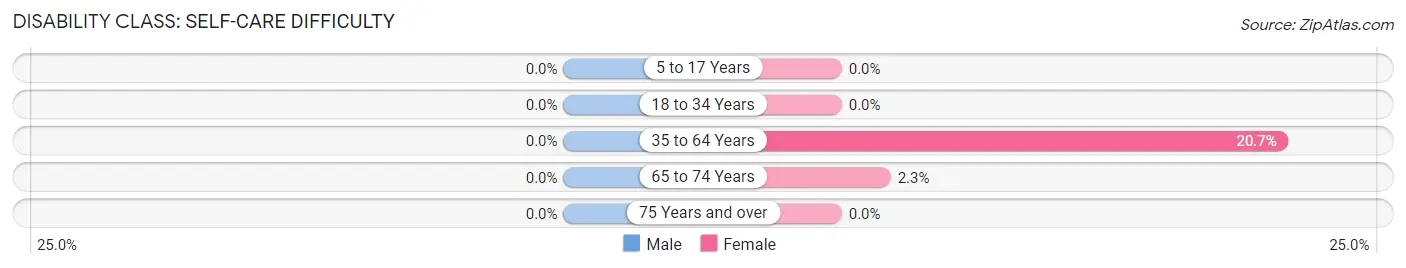
| Age Bracket | Male | Female |
| 5 to 17 Years | 0 (0.0%) | 0 (0.0%) |
| 18 to 34 Years | 0 (0.0%) | 0 (0.0%) |
| 35 to 64 Years | 0 (0.0%) | 17 (20.7%) |
| 65 to 74 Years | 0 (0.0%) | 1 (2.3%) |
| 75 Years and over | 0 (0.0%) | 0 (0.0%) |
Technology Access in Blanchard
Computing Device Access in Blanchard
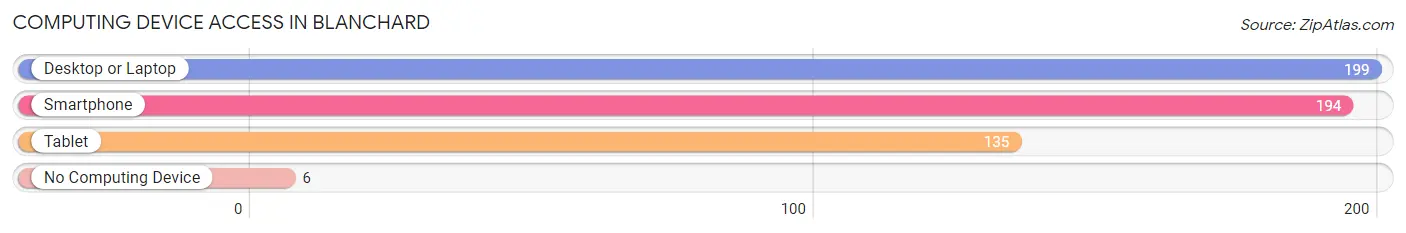
| Device Type | # Households | % Households |
| Desktop or Laptop | 199 | 87.7% |
| Smartphone | 194 | 85.5% |
| Tablet | 135 | 59.5% |
| No Computing Device | 6 | 2.6% |
| Total | 227 | 100.0% |
Internet Access in Blanchard
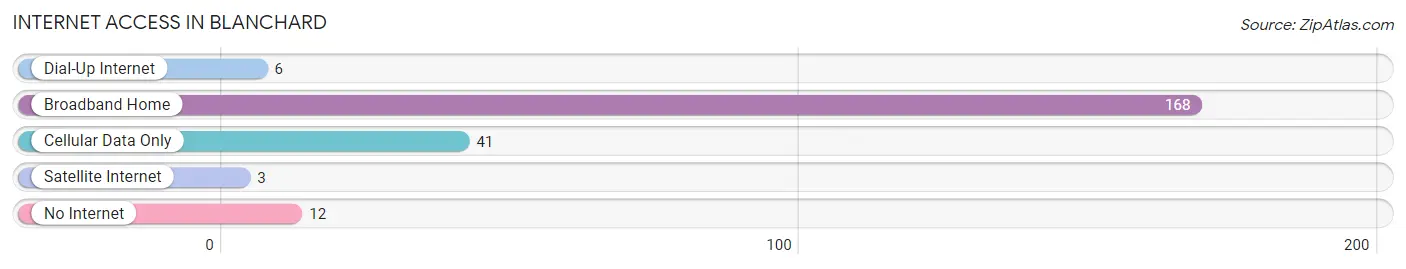
| Internet Type | # Households | % Households |
| Dial-Up Internet | 6 | 2.6% |
| Broadband Home | 168 | 74.0% |
| Cellular Data Only | 41 | 18.1% |
| Satellite Internet | 3 | 1.3% |
| No Internet | 12 | 5.3% |
| Total | 227 | 100.0% |
Blanchard Summary
Blanchard is a small borough located in Centre County, Pennsylvania. It is situated in the Nittany Valley, approximately 8 miles south of State College and 8 miles north of Huntingdon. The population of Blanchard was 545 at the 2010 census.
History
Blanchard was founded in 1845 by William Blanchard, a local landowner. The town was originally known as Blanchardville, but the name was changed to Blanchard in 1875. The town was incorporated in 1887.
Blanchard was a small farming community until the late 19th century, when the Pennsylvania Railroad built a line through the town. This allowed for the development of a small industrial base, including a sawmill, a grist mill, and a tannery.
Geography
Blanchard is located at 40°45'45" North, 77°45'45" West (40.7625, -77.7625). It is situated in the Nittany Valley, approximately 8 miles south of State College and 8 miles north of Huntingdon.
The borough is located in the Nittany Valley, a narrow valley that runs through the center of Centre County. The valley is surrounded by mountains, including Tussey Mountain to the east and Bald Eagle Mountain to the west.
The borough is located in the Bald Eagle Creek watershed. The creek is a tributary of the Susquehanna River, which flows into the Chesapeake Bay.
Economy
Blanchard's economy is largely based on agriculture and tourism. The borough is home to several small farms, which produce a variety of crops, including corn, soybeans, hay, and wheat.
The borough is also home to several small businesses, including a grocery store, a hardware store, and a restaurant.
Tourism is an important part of the local economy. The borough is home to several attractions, including the Blanchard Dam, the Blanchard Covered Bridge, and the Blanchard Historic District.
Demographics
As of the 2010 census, the population of Blanchard was 545. The racial makeup of the borough was 97.3% White, 0.7% African American, 0.2% Native American, 0.2% Asian, and 1.6% from two or more races.
The median household income in Blanchard was $45,833, and the median family income was $50,000. The per capita income was $20,945. About 8.3% of families and 10.2% of the population were below the poverty line.
Blanchard is served by the Bald Eagle Area School District. The borough is home to one elementary school, one middle school, and one high school.
Common Questions
What is Per Capita Income in Blanchard?
Per Capita income in Blanchard is $35,194.
What is the Median Family Income in Blanchard?
Median Family Income in Blanchard is $115,694.
What is the Median Household income in Blanchard?
Median Household Income in Blanchard is $69,750.
What is Income or Wage Gap in Blanchard?
Income or Wage Gap in Blanchard is 8.4%.
Women in Blanchard earn 91.6 cents for every dollar earned by a man.
What is Inequality or Gini Index in Blanchard?
Inequality or Gini Index in Blanchard is 0.28.
What is the Total Population of Blanchard?
Total Population of Blanchard is 505.
What is the Total Male Population of Blanchard?
Total Male Population of Blanchard is 341.
What is the Total Female Population of Blanchard?
Total Female Population of Blanchard is 164.
What is the Ratio of Males per 100 Females in Blanchard?
There are 207.93 Males per 100 Females in Blanchard.
What is the Ratio of Females per 100 Males in Blanchard?
There are 48.09 Females per 100 Males in Blanchard.
What is the Median Population Age in Blanchard?
Median Population Age in Blanchard is 57.3 Years.
What is the Average Family Size in Blanchard
Average Family Size in Blanchard is 2.9 People.
What is the Average Household Size in Blanchard
Average Household Size in Blanchard is 2.2 People.
How Large is the Labor Force in Blanchard?
There are 279 People in the Labor Forcein in Blanchard.
What is the Percentage of People in the Labor Force in Blanchard?
58.1% of People are in the Labor Force in Blanchard.