Millersville borough, PA Map & Demographics
Millersville borough Overview
$24,952
PER CAPITA INCOME
$86,469
AVG FAMILY INCOME
$65,804
AVG HOUSEHOLD INCOME
39.7%
WAGE / INCOME GAP [ % ]
60.3¢/ $1
WAGE / INCOME GAP [ $ ]
0.43
INEQUALITY / GINI INDEX
8,426
TOTAL POPULATION
3,772
MALE POPULATION
4,654
FEMALE POPULATION
81.05
MALES / 100 FEMALES
123.38
FEMALES / 100 MALES
23.3
MEDIAN AGE
3.1
AVG FAMILY SIZE
2.7
AVG HOUSEHOLD SIZE
4,340
LABOR FORCE [ PEOPLE ]
57.8%
PERCENT IN LABOR FORCE
4.1%
UNEMPLOYMENT RATE
Income in Millersville borough
Income Overview in Millersville borough
Per Capita Income in Millersville borough is $24,952, while median incomes of families and households are $86,469 and $65,804 respectively.
| Characteristic | Number | Measure |
| Per Capita Income | 8,426 | $24,952 |
| Median Family Income | 1,299 | $86,469 |
| Mean Family Income | 1,299 | $103,592 |
| Median Household Income | 2,503 | $65,804 |
| Mean Household Income | 2,503 | $79,438 |
| Income Deficit | 1,299 | $0 |
| Wage / Income Gap (%) | 8,426 | 39.72% |
| Wage / Income Gap ($) | 8,426 | 60.28¢ per $1 |
| Gini / Inequality Index | 8,426 | 0.43 |
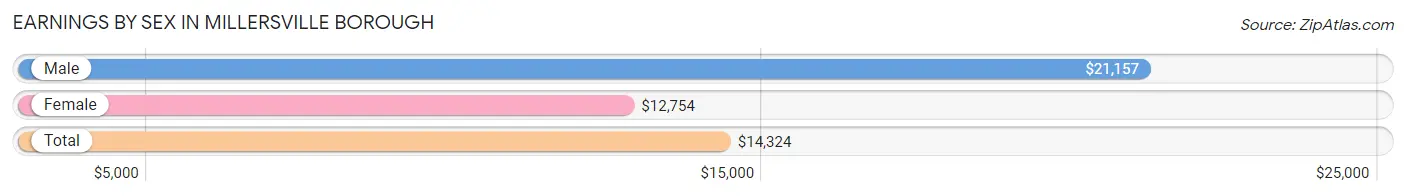
Earnings by Sex in Millersville borough
Average Earnings in Millersville borough are $14,324, $21,157 for men and $12,754 for women, a difference of 39.7%.
| Sex | Number | Average Earnings |
| Male | 2,525 (47.9%) | $21,157 |
| Female | 2,751 (52.1%) | $12,754 |
| Total | 5,276 (100.0%) | $14,324 |
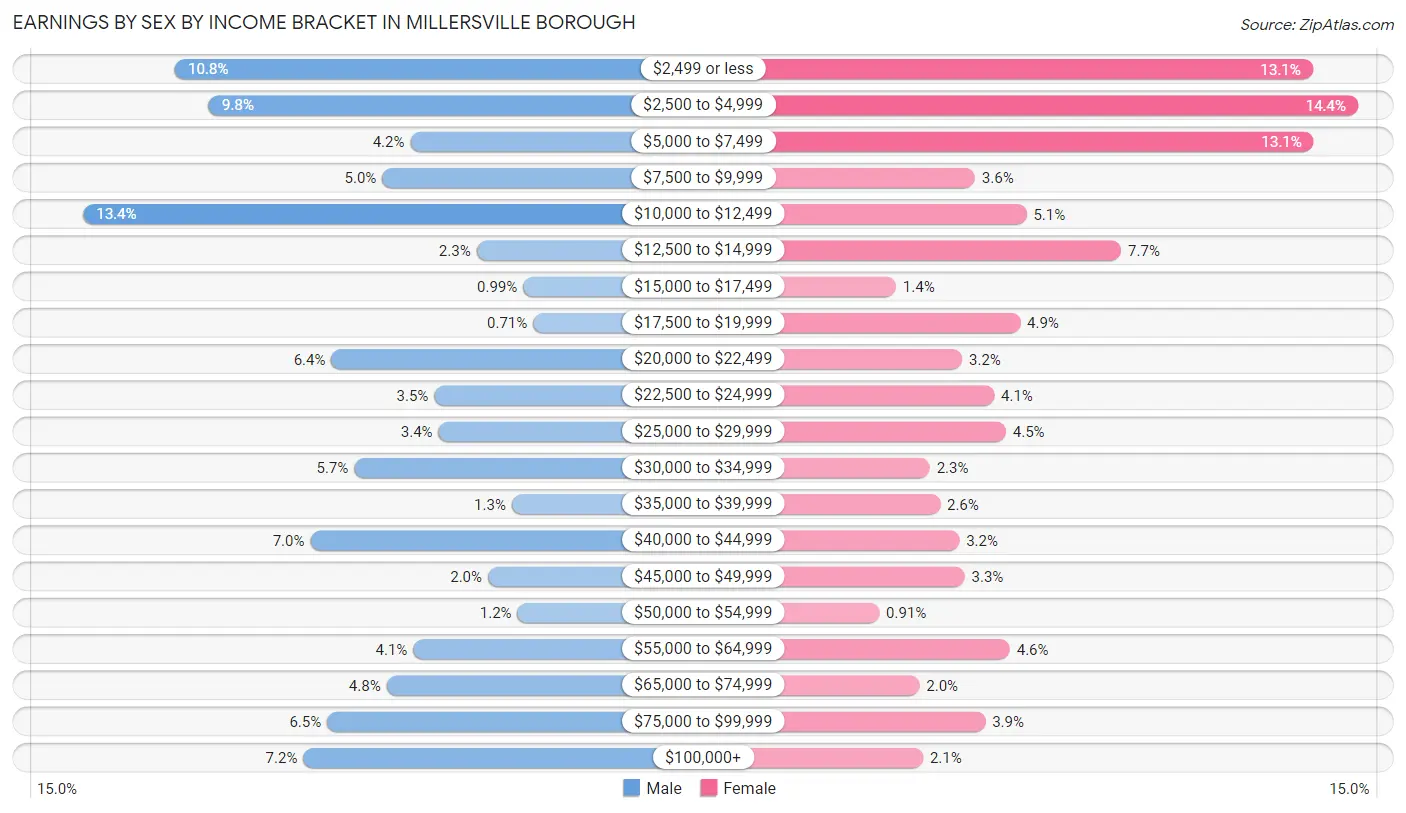
Earnings by Sex by Income Bracket in Millersville borough
The most common earnings brackets in Millersville borough are $10,000 to $12,499 for men (337 | 13.4%) and $2,500 to $4,999 for women (395 | 14.4%).
| Income | Male | Female |
| $2,499 or less | 272 (10.8%) | 360 (13.1%) |
| $2,500 to $4,999 | 248 (9.8%) | 395 (14.4%) |
| $5,000 to $7,499 | 105 (4.2%) | 361 (13.1%) |
| $7,500 to $9,999 | 125 (5.0%) | 99 (3.6%) |
| $10,000 to $12,499 | 337 (13.4%) | 139 (5.1%) |
| $12,500 to $14,999 | 58 (2.3%) | 212 (7.7%) |
| $15,000 to $17,499 | 25 (1.0%) | 38 (1.4%) |
| $17,500 to $19,999 | 18 (0.7%) | 134 (4.9%) |
| $20,000 to $22,499 | 161 (6.4%) | 89 (3.2%) |
| $22,500 to $24,999 | 88 (3.5%) | 114 (4.1%) |
| $25,000 to $29,999 | 85 (3.4%) | 123 (4.5%) |
| $30,000 to $34,999 | 145 (5.7%) | 64 (2.3%) |
| $35,000 to $39,999 | 33 (1.3%) | 72 (2.6%) |
| $40,000 to $44,999 | 176 (7.0%) | 87 (3.2%) |
| $45,000 to $49,999 | 50 (2.0%) | 91 (3.3%) |
| $50,000 to $54,999 | 29 (1.1%) | 25 (0.9%) |
| $55,000 to $64,999 | 103 (4.1%) | 126 (4.6%) |
| $65,000 to $74,999 | 122 (4.8%) | 56 (2.0%) |
| $75,000 to $99,999 | 164 (6.5%) | 107 (3.9%) |
| $100,000+ | 181 (7.2%) | 59 (2.1%) |
| Total | 2,525 (100.0%) | 2,751 (100.0%) |
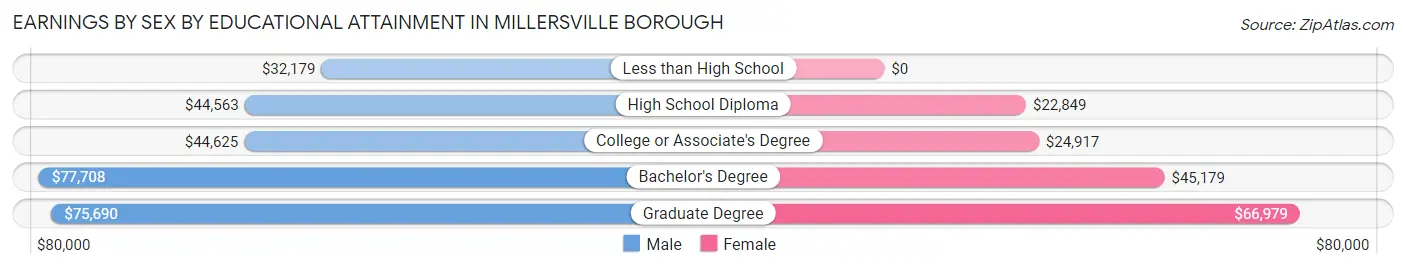
Earnings by Sex by Educational Attainment in Millersville borough
Average earnings in Millersville borough are $47,702 for men and $27,895 for women, a difference of 41.5%. Men with an educational attainment of bachelor's degree enjoy the highest average annual earnings of $77,708, while those with less than high school education earn the least with $32,179. Women with an educational attainment of graduate degree earn the most with the average annual earnings of $66,979, while those with high school diploma education have the smallest earnings of $22,849.
| Educational Attainment | Male Income | Female Income |
| Less than High School | $32,179 | $0 |
| High School Diploma | $44,563 | $22,849 |
| College or Associate's Degree | $44,625 | $24,917 |
| Bachelor's Degree | $77,708 | $45,179 |
| Graduate Degree | $75,690 | $66,979 |
| Total | $47,702 | $27,895 |
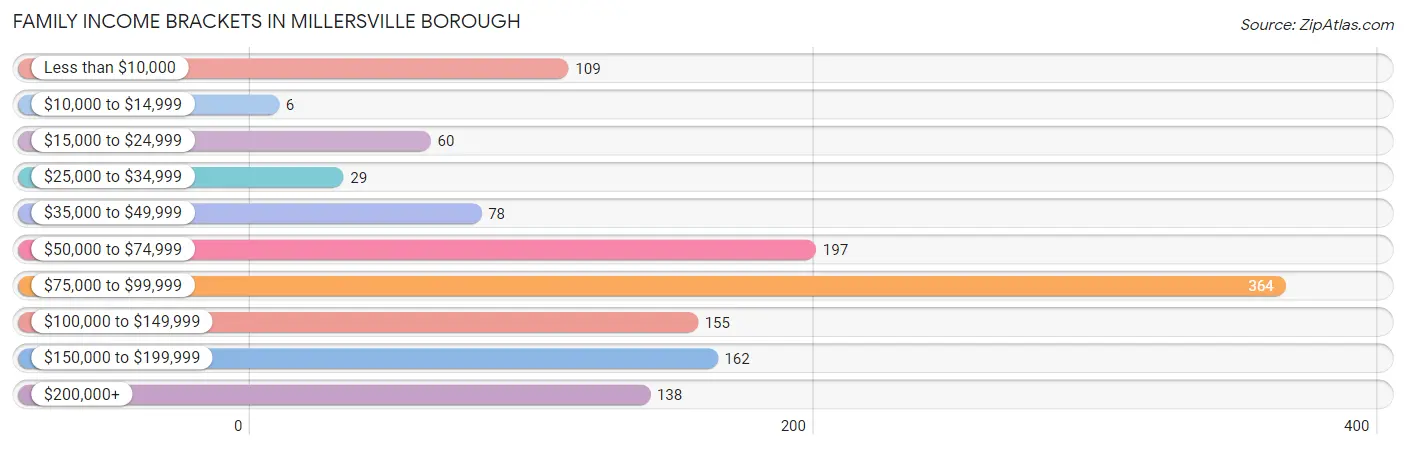
Family Income in Millersville borough
Family Income Brackets in Millersville borough
According to the Millersville borough family income data, there are 364 families falling into the $75,000 to $99,999 income range, which is the most common income bracket and makes up 28.0% of all families. Conversely, the $10,000 to $14,999 income bracket is the least frequent group with only 6 families (0.5%) belonging to this category.
| Income Bracket | # Families | % Families |
| Less than $10,000 | 109 | 8.4% |
| $10,000 to $14,999 | 6 | 0.5% |
| $15,000 to $24,999 | 60 | 4.6% |
| $25,000 to $34,999 | 29 | 2.2% |
| $35,000 to $49,999 | 78 | 6.0% |
| $50,000 to $74,999 | 197 | 15.2% |
| $75,000 to $99,999 | 364 | 28.0% |
| $100,000 to $149,999 | 155 | 11.9% |
| $150,000 to $199,999 | 162 | 12.5% |
| $200,000+ | 138 | 10.6% |
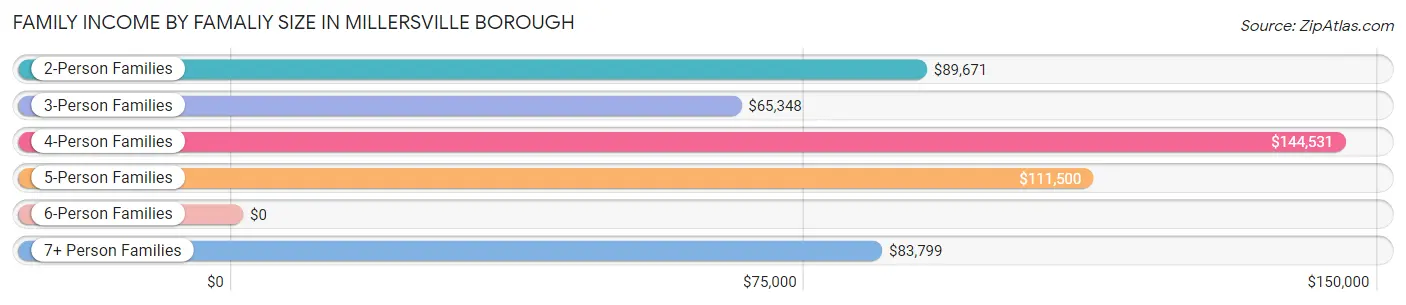
Family Income by Famaliy Size in Millersville borough
4-person families (201 | 15.5%) account for the highest median family income in Millersville borough with $144,531 per family, while 2-person families (543 | 41.8%) have the highest median income of $44,836 per family member.
| Income Bracket | # Families | Median Income |
| 2-Person Families | 543 (41.8%) | $89,671 |
| 3-Person Families | 361 (27.8%) | $65,348 |
| 4-Person Families | 201 (15.5%) | $144,531 |
| 5-Person Families | 102 (7.9%) | $111,500 |
| 6-Person Families | 12 (0.9%) | $0 |
| 7+ Person Families | 80 (6.2%) | $83,799 |
| Total | 1,299 (100.0%) | $86,469 |
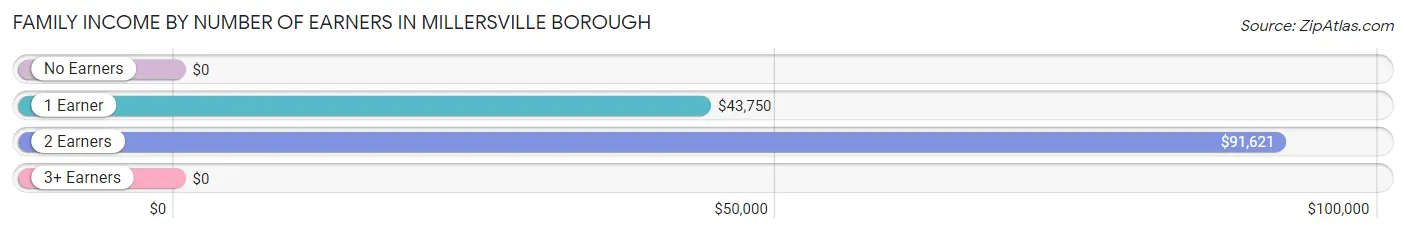
Family Income by Number of Earners in Millersville borough
| Number of Earners | # Families | Median Income |
| No Earners | 194 (14.9%) | $0 |
| 1 Earner | 392 (30.2%) | $43,750 |
| 2 Earners | 415 (32.0%) | $91,621 |
| 3+ Earners | 298 (22.9%) | $0 |
| Total | 1,299 (100.0%) | $86,469 |
Household Income in Millersville borough
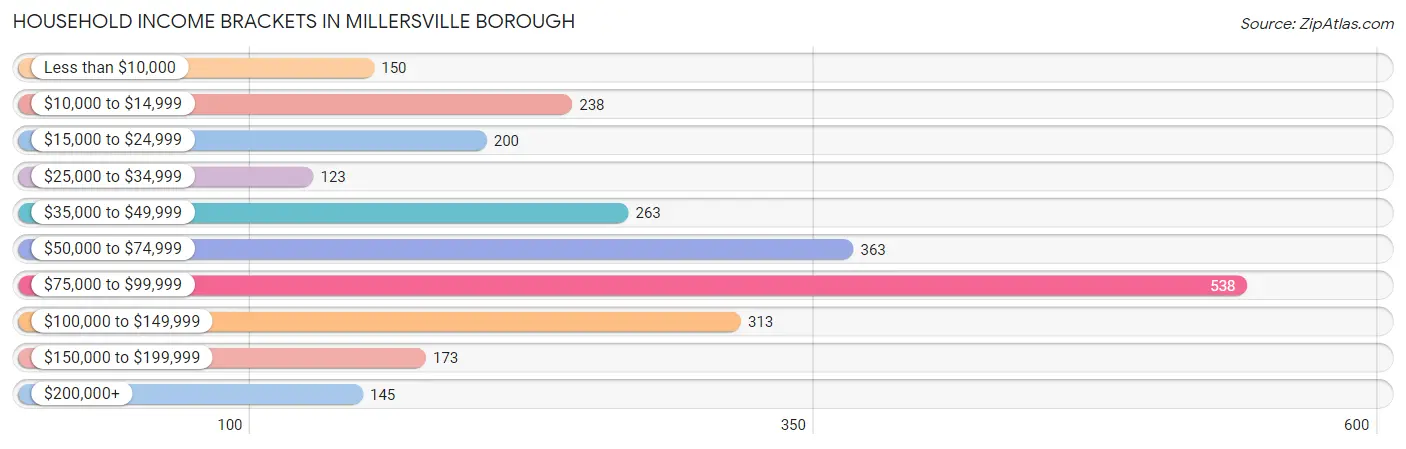
Household Income Brackets in Millersville borough
With 538 households falling in the category, the $75,000 to $99,999 income range is the most frequent in Millersville borough, accounting for 21.5% of all households. In contrast, only 123 households (4.9%) fall into the $25,000 to $34,999 income bracket, making it the least populous group.
| Income Bracket | # Households | % Households |
| Less than $10,000 | 150 | 6.0% |
| $10,000 to $14,999 | 238 | 9.5% |
| $15,000 to $24,999 | 200 | 8.0% |
| $25,000 to $34,999 | 123 | 4.9% |
| $35,000 to $49,999 | 263 | 10.5% |
| $50,000 to $74,999 | 363 | 14.5% |
| $75,000 to $99,999 | 538 | 21.5% |
| $100,000 to $149,999 | 313 | 12.5% |
| $150,000 to $199,999 | 173 | 6.9% |
| $200,000+ | 145 | 5.8% |
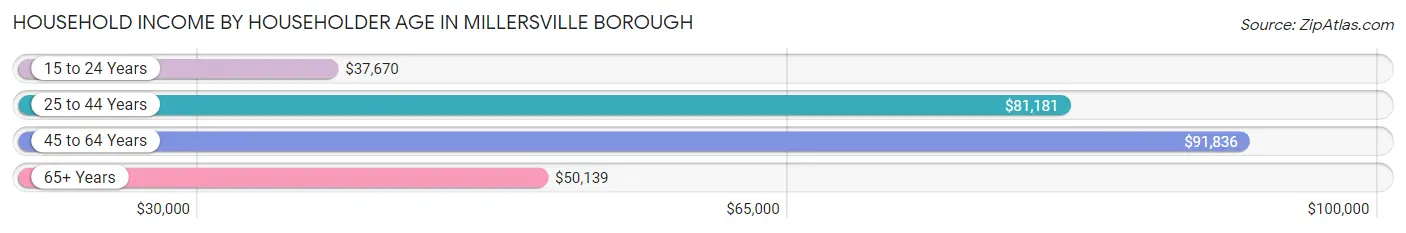
Household Income by Householder Age in Millersville borough
The median household income in Millersville borough is $65,804, with the highest median household income of $91,836 found in the 45 to 64 years age bracket for the primary householder. A total of 676 households (27.0%) fall into this category. Meanwhile, the 15 to 24 years age bracket for the primary householder has the lowest median household income of $37,670, with 451 households (18.0%) in this group.
| Income Bracket | # Households | Median Income |
| 15 to 24 Years | 451 (18.0%) | $37,670 |
| 25 to 44 Years | 745 (29.8%) | $81,181 |
| 45 to 64 Years | 676 (27.0%) | $91,836 |
| 65+ Years | 631 (25.2%) | $50,139 |
| Total | 2,503 (100.0%) | $65,804 |
Poverty in Millersville borough
Income Below Poverty by Sex and Age in Millersville borough
With 23.3% poverty level for males and 29.1% for females among the residents of Millersville borough, 45 to 54 year old males and 18 to 24 year old females are the most vulnerable to poverty, with 257 males (61.2%) and 607 females (52.5%) in their respective age groups living below the poverty level.
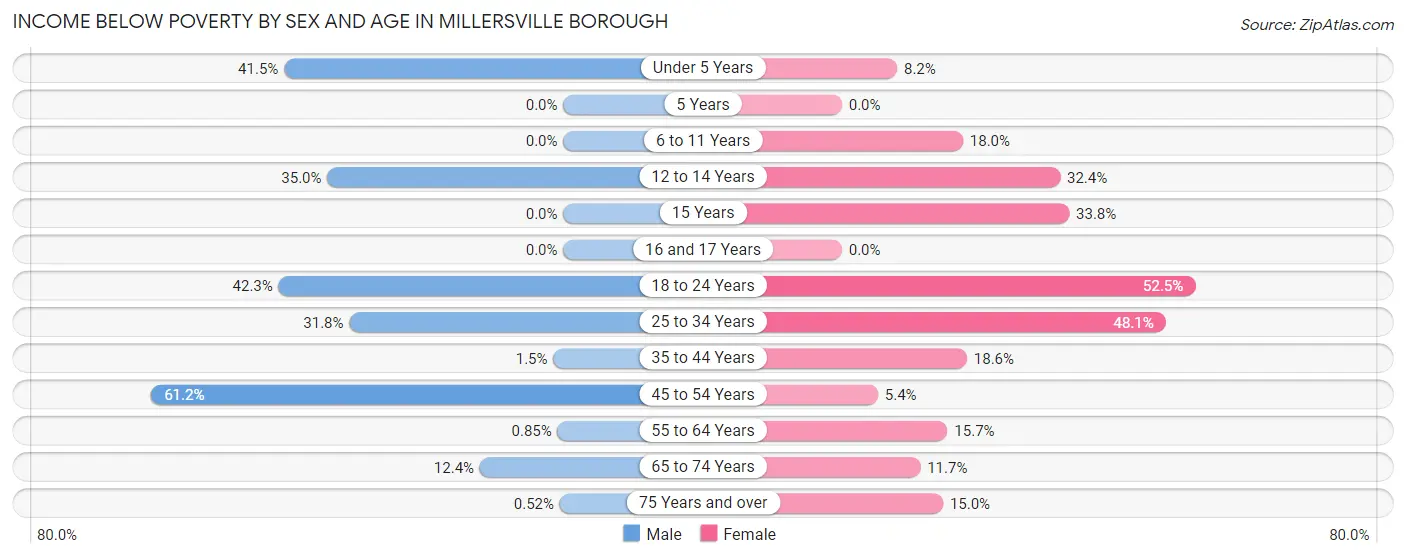
| Age Bracket | Male | Female |
| Under 5 Years | 34 (41.5%) | 5 (8.2%) |
| 5 Years | 0 (0.0%) | 0 (0.0%) |
| 6 to 11 Years | 0 (0.0%) | 48 (18.0%) |
| 12 to 14 Years | 48 (35.0%) | 47 (32.4%) |
| 15 Years | 0 (0.0%) | 27 (33.8%) |
| 16 and 17 Years | 0 (0.0%) | 0 (0.0%) |
| 18 to 24 Years | 211 (42.3%) | 607 (52.5%) |
| 25 to 34 Years | 102 (31.8%) | 138 (48.1%) |
| 35 to 44 Years | 6 (1.5%) | 83 (18.6%) |
| 45 to 54 Years | 257 (61.2%) | 13 (5.3%) |
| 55 to 64 Years | 4 (0.9%) | 69 (15.7%) |
| 65 to 74 Years | 28 (12.4%) | 31 (11.7%) |
| 75 Years and over | 1 (0.5%) | 50 (15.0%) |
| Total | 691 (23.3%) | 1,118 (29.1%) |
Income Above Poverty by Sex and Age in Millersville borough
According to the poverty statistics in Millersville borough, males aged 5 years and females aged 5 years are the age groups that are most secure financially, with 100.0% of males and 100.0% of females in these age groups living above the poverty line.
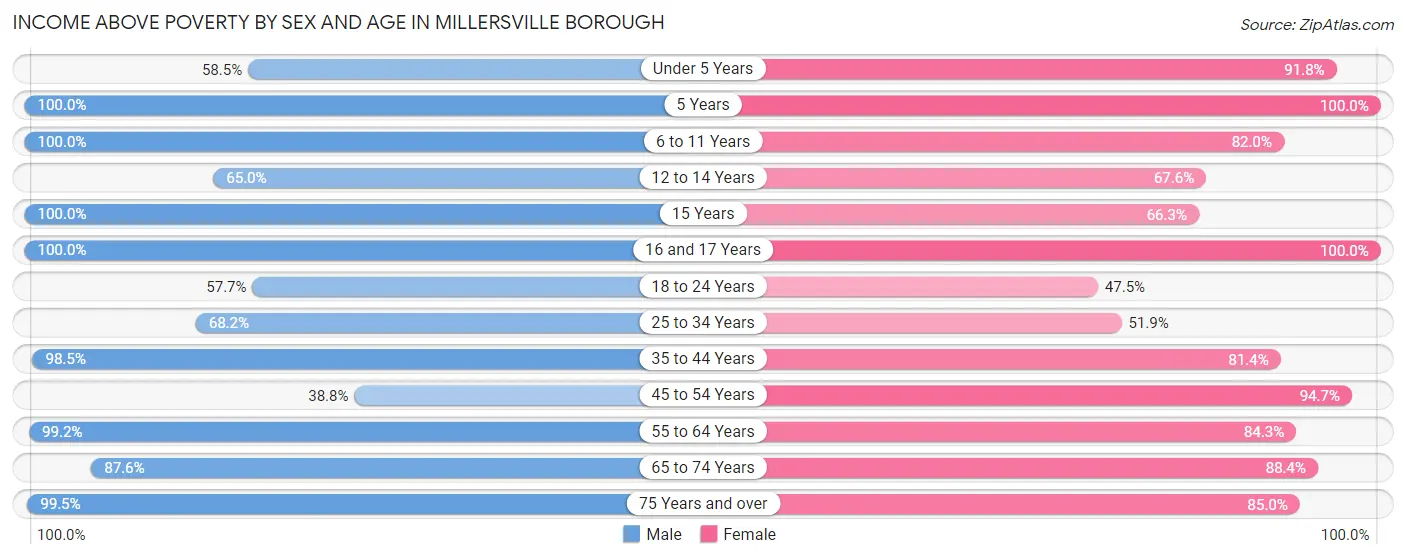
| Age Bracket | Male | Female |
| Under 5 Years | 48 (58.5%) | 56 (91.8%) |
| 5 Years | 11 (100.0%) | 41 (100.0%) |
| 6 to 11 Years | 55 (100.0%) | 219 (82.0%) |
| 12 to 14 Years | 89 (65.0%) | 98 (67.6%) |
| 15 Years | 36 (100.0%) | 53 (66.2%) |
| 16 and 17 Years | 114 (100.0%) | 76 (100.0%) |
| 18 to 24 Years | 288 (57.7%) | 550 (47.5%) |
| 25 to 34 Years | 219 (68.2%) | 149 (51.9%) |
| 35 to 44 Years | 400 (98.5%) | 364 (81.4%) |
| 45 to 54 Years | 163 (38.8%) | 230 (94.7%) |
| 55 to 64 Years | 465 (99.2%) | 371 (84.3%) |
| 65 to 74 Years | 198 (87.6%) | 235 (88.3%) |
| 75 Years and over | 192 (99.5%) | 283 (85.0%) |
| Total | 2,278 (76.7%) | 2,725 (70.9%) |
Income Below Poverty Among Married-Couple Families in Millersville borough
The poverty statistics for married-couple families in Millersville borough show that 1.9% or 18 of the total 968 families live below the poverty line. Families with 1 or 2 children have the highest poverty rate of 3.9%, comprising of 12 families. On the other hand, families with 3 or 4 children have the lowest poverty rate of 0.0%, which includes 0 families.
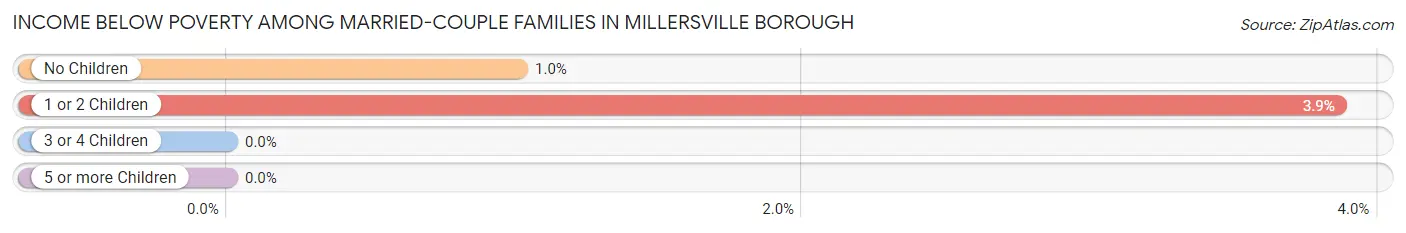
| Children | Above Poverty | Below Poverty |
| No Children | 590 (99.0%) | 6 (1.0%) |
| 1 or 2 Children | 299 (96.1%) | 12 (3.9%) |
| 3 or 4 Children | 32 (100.0%) | 0 (0.0%) |
| 5 or more Children | 29 (100.0%) | 0 (0.0%) |
| Total | 950 (98.1%) | 18 (1.9%) |
Income Below Poverty Among Single-Parent Households in Millersville borough
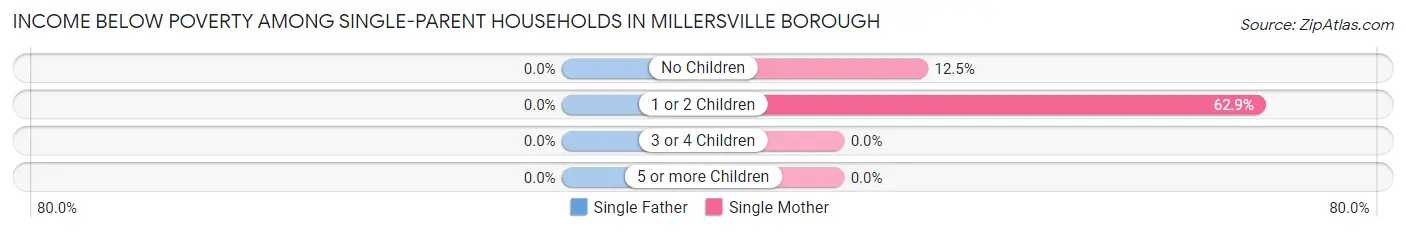
| Children | Single Father | Single Mother |
| No Children | 0 (0.0%) | 13 (12.5%) |
| 1 or 2 Children | 0 (0.0%) | 139 (62.9%) |
| 3 or 4 Children | 0 (0.0%) | 0 (0.0%) |
| 5 or more Children | 0 (0.0%) | 0 (0.0%) |
| Total | 0 (0.0%) | 152 (46.8%) |
Income Below Poverty Among Married-Couple vs Single-Parent Households in Millersville borough
The poverty data for Millersville borough shows that 18 of the married-couple family households (1.9%) and 152 of the single-parent households (45.9%) are living below the poverty level. Within the married-couple family households, those with 1 or 2 children have the highest poverty rate, with 12 households (3.9%) falling below the poverty line. Among the single-parent households, those with 1 or 2 children have the highest poverty rate, with 139 household (62.9%) living below poverty.
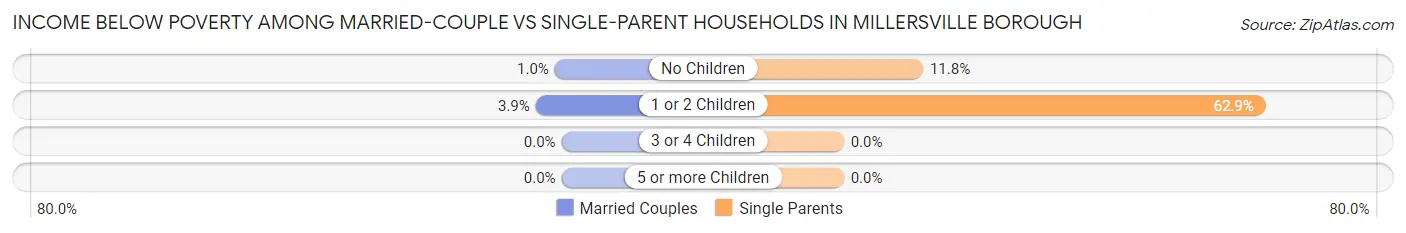
| Children | Married-Couple Families | Single-Parent Households |
| No Children | 6 (1.0%) | 13 (11.8%) |
| 1 or 2 Children | 12 (3.9%) | 139 (62.9%) |
| 3 or 4 Children | 0 (0.0%) | 0 (0.0%) |
| 5 or more Children | 0 (0.0%) | 0 (0.0%) |
| Total | 18 (1.9%) | 152 (45.9%) |
Race in Millersville borough
The most populous races in Millersville borough are White / Caucasian (6,295 | 74.7%), Hispanic or Latino (928 | 11.0%), and Some other Race (636 | 7.5%).
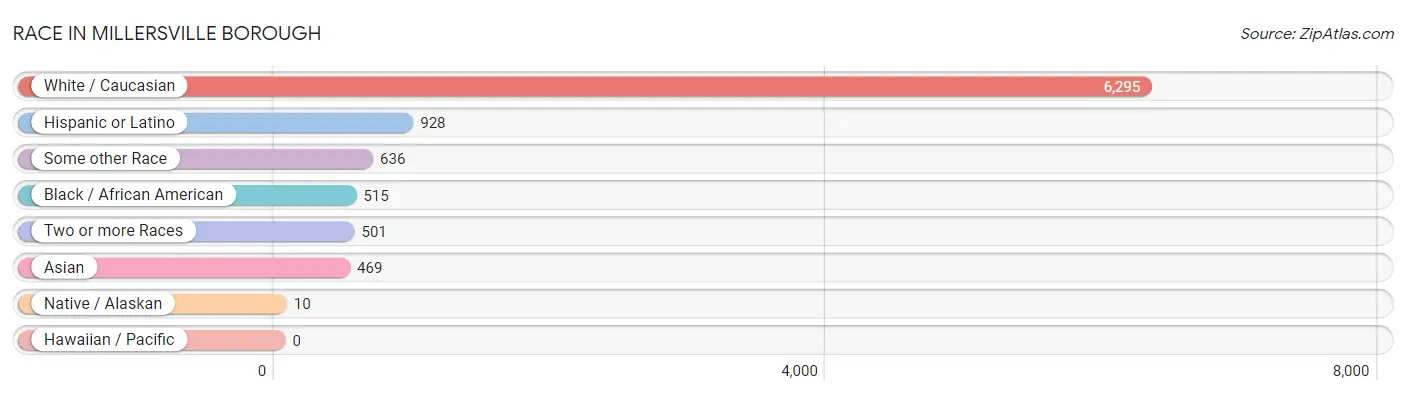
| Race | # Population | % Population |
| Asian | 469 | 5.6% |
| Black / African American | 515 | 6.1% |
| Hawaiian / Pacific | 0 | 0.0% |
| Hispanic or Latino | 928 | 11.0% |
| Native / Alaskan | 10 | 0.1% |
| White / Caucasian | 6,295 | 74.7% |
| Two or more Races | 501 | 5.9% |
| Some other Race | 636 | 7.5% |
| Total | 8,426 | 100.0% |
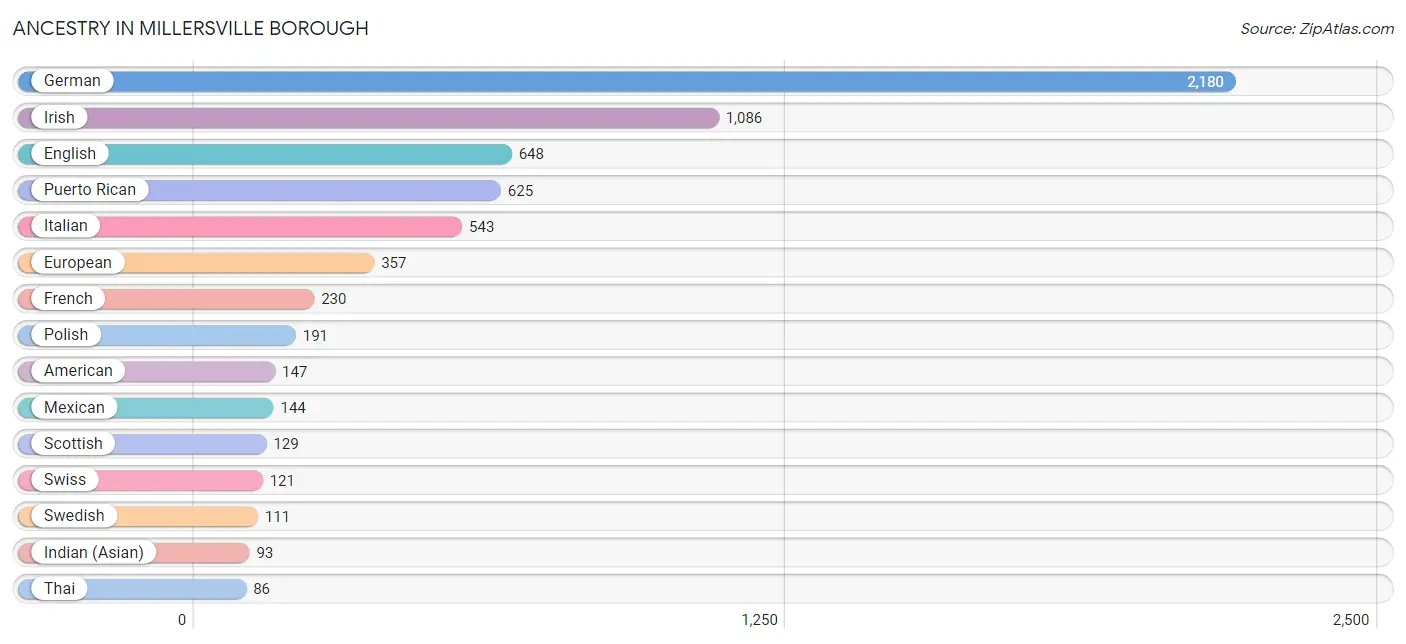
Ancestry in Millersville borough
The most populous ancestries reported in Millersville borough are German (2,180 | 25.9%), Irish (1,086 | 12.9%), English (648 | 7.7%), Puerto Rican (625 | 7.4%), and Italian (543 | 6.4%), together accounting for 60.3% of all Millersville borough residents.
| Ancestry | # Population | % Population |
| African | 3 | 0.0% |
| American | 147 | 1.7% |
| Arab | 44 | 0.5% |
| Armenian | 6 | 0.1% |
| Blackfeet | 22 | 0.3% |
| Burmese | 26 | 0.3% |
| Canadian | 16 | 0.2% |
| Central American | 26 | 0.3% |
| Central American Indian | 35 | 0.4% |
| Cherokee | 7 | 0.1% |
| Colombian | 23 | 0.3% |
| Croatian | 8 | 0.1% |
| Czech | 34 | 0.4% |
| Czechoslovakian | 22 | 0.3% |
| Danish | 7 | 0.1% |
| Dominican | 84 | 1.0% |
| Dutch | 40 | 0.5% |
| Eastern European | 15 | 0.2% |
| English | 648 | 7.7% |
| European | 357 | 4.2% |
| Finnish | 10 | 0.1% |
| French | 230 | 2.7% |
| French Canadian | 67 | 0.8% |
| German | 2,180 | 25.9% |
| Greek | 48 | 0.6% |
| Honduran | 9 | 0.1% |
| Hungarian | 54 | 0.6% |
| Indian (Asian) | 93 | 1.1% |
| Irish | 1,086 | 12.9% |
| Iroquois | 9 | 0.1% |
| Italian | 543 | 6.4% |
| Jamaican | 64 | 0.8% |
| Korean | 22 | 0.3% |
| Lithuanian | 18 | 0.2% |
| Mexican | 144 | 1.7% |
| Norwegian | 72 | 0.9% |
| Panamanian | 17 | 0.2% |
| Peruvian | 9 | 0.1% |
| Polish | 191 | 2.3% |
| Portuguese | 7 | 0.1% |
| Puerto Rican | 625 | 7.4% |
| Romanian | 9 | 0.1% |
| Russian | 15 | 0.2% |
| Scotch-Irish | 65 | 0.8% |
| Scottish | 129 | 1.5% |
| Seminole | 4 | 0.1% |
| Serbian | 25 | 0.3% |
| Slovak | 29 | 0.3% |
| South American | 32 | 0.4% |
| Sri Lankan | 3 | 0.0% |
| Subsaharan African | 3 | 0.0% |
| Swedish | 111 | 1.3% |
| Swiss | 121 | 1.4% |
| Thai | 86 | 1.0% |
| Ukrainian | 4 | 0.1% |
| Welsh | 25 | 0.3% | View All 56 Rows |
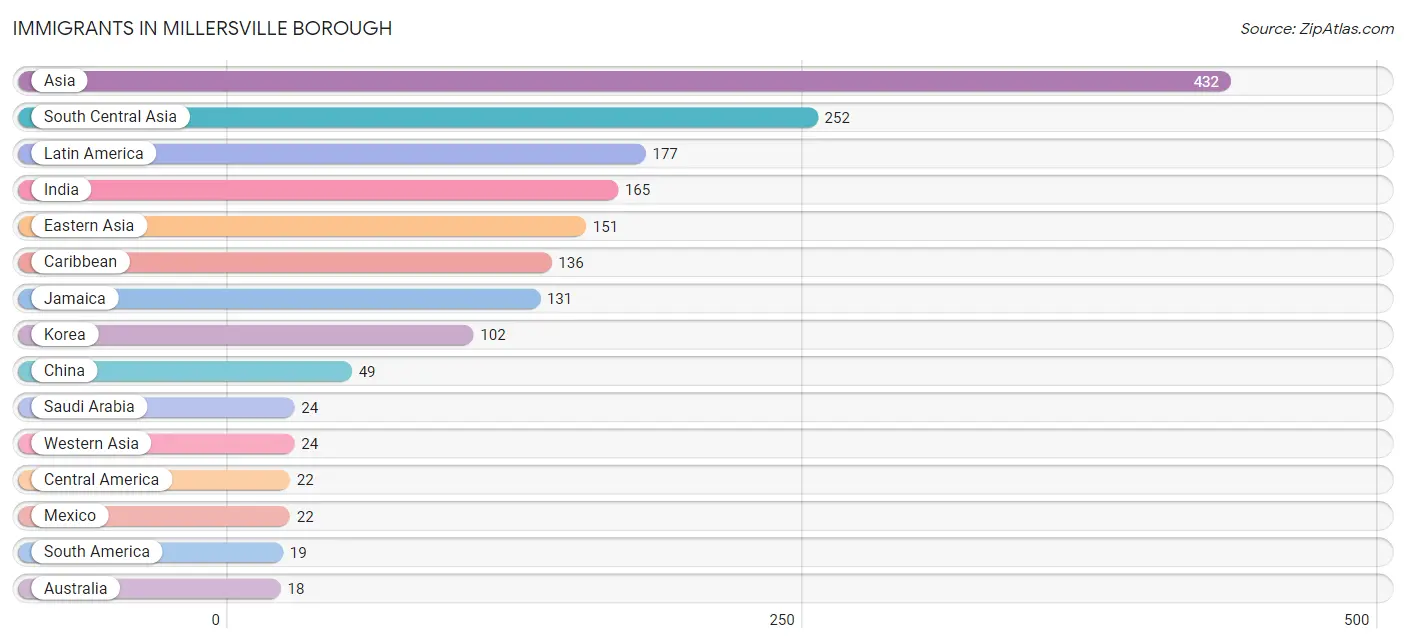
Immigrants in Millersville borough
The most numerous immigrant groups reported in Millersville borough came from Asia (432 | 5.1%), South Central Asia (252 | 3.0%), Latin America (177 | 2.1%), India (165 | 2.0%), and Eastern Asia (151 | 1.8%), together accounting for 14.0% of all Millersville borough residents.
| Immigration Origin | # Population | % Population |
| Asia | 432 | 5.1% |
| Australia | 18 | 0.2% |
| Canada | 9 | 0.1% |
| Caribbean | 136 | 1.6% |
| Central America | 22 | 0.3% |
| China | 49 | 0.6% |
| Dominican Republic | 5 | 0.1% |
| Eastern Asia | 151 | 1.8% |
| England | 11 | 0.1% |
| Europe | 11 | 0.1% |
| India | 165 | 2.0% |
| Jamaica | 131 | 1.5% |
| Korea | 102 | 1.2% |
| Latin America | 177 | 2.1% |
| Mexico | 22 | 0.3% |
| Northern Europe | 11 | 0.1% |
| Oceania | 18 | 0.2% |
| Peru | 9 | 0.1% |
| Philippines | 5 | 0.1% |
| Saudi Arabia | 24 | 0.3% |
| South America | 19 | 0.2% |
| South Central Asia | 252 | 3.0% |
| South Eastern Asia | 5 | 0.1% |
| Venezuela | 10 | 0.1% |
| Western Asia | 24 | 0.3% | View All 25 Rows |
Sex and Age in Millersville borough
Sex and Age in Millersville borough
The most populous age groups in Millersville borough are 20 to 24 Years (908 | 24.1%) for men and 20 to 24 Years (1,254 | 26.9%) for women.
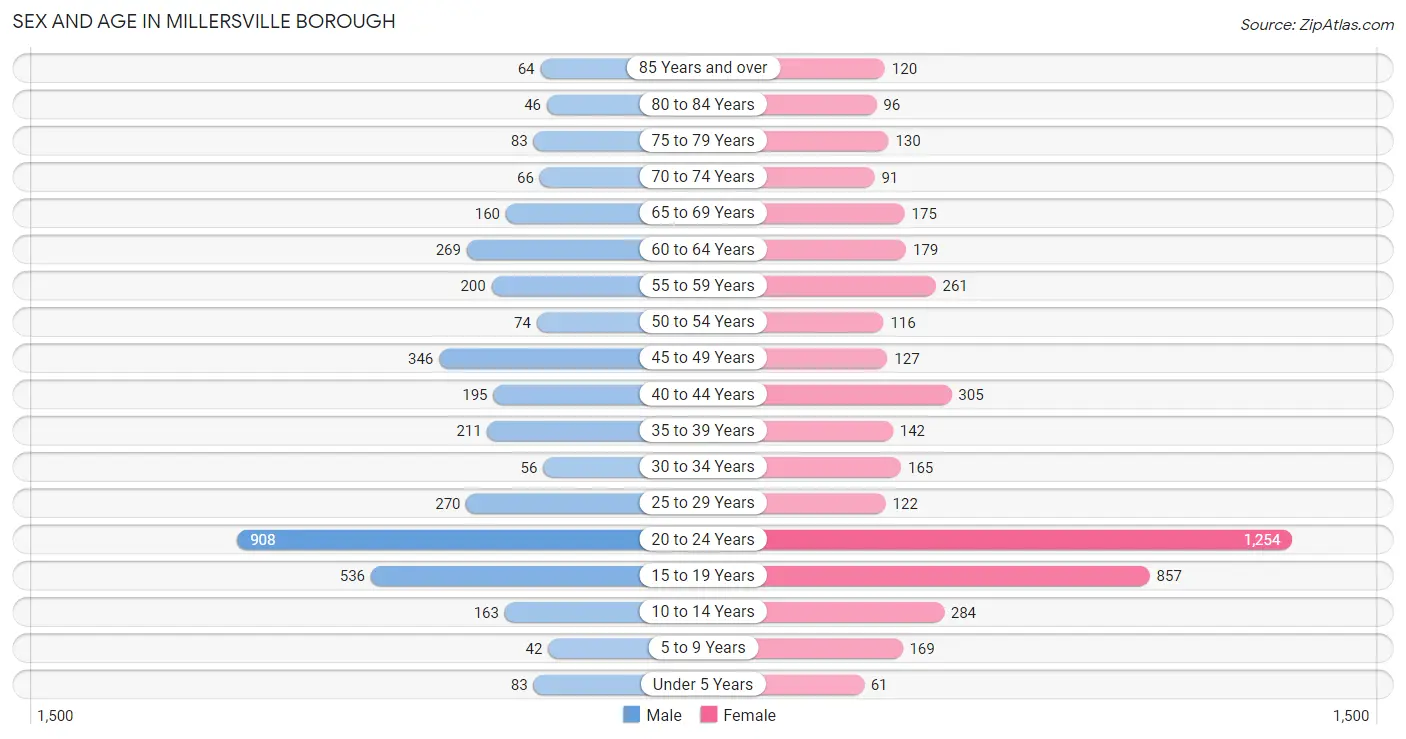
| Age Bracket | Male | Female |
| Under 5 Years | 83 (2.2%) | 61 (1.3%) |
| 5 to 9 Years | 42 (1.1%) | 169 (3.6%) |
| 10 to 14 Years | 163 (4.3%) | 284 (6.1%) |
| 15 to 19 Years | 536 (14.2%) | 857 (18.4%) |
| 20 to 24 Years | 908 (24.1%) | 1,254 (26.9%) |
| 25 to 29 Years | 270 (7.2%) | 122 (2.6%) |
| 30 to 34 Years | 56 (1.5%) | 165 (3.5%) |
| 35 to 39 Years | 211 (5.6%) | 142 (3.0%) |
| 40 to 44 Years | 195 (5.2%) | 305 (6.6%) |
| 45 to 49 Years | 346 (9.2%) | 127 (2.7%) |
| 50 to 54 Years | 74 (2.0%) | 116 (2.5%) |
| 55 to 59 Years | 200 (5.3%) | 261 (5.6%) |
| 60 to 64 Years | 269 (7.1%) | 179 (3.8%) |
| 65 to 69 Years | 160 (4.2%) | 175 (3.8%) |
| 70 to 74 Years | 66 (1.8%) | 91 (2.0%) |
| 75 to 79 Years | 83 (2.2%) | 130 (2.8%) |
| 80 to 84 Years | 46 (1.2%) | 96 (2.1%) |
| 85 Years and over | 64 (1.7%) | 120 (2.6%) |
| Total | 3,772 (100.0%) | 4,654 (100.0%) |
Families and Households in Millersville borough
Median Family Size in Millersville borough
The median family size in Millersville borough is 3.07 persons per family, with married-couple families (968 | 74.5%) accounting for the largest median family size of 3.12 persons per family. On the other hand, single male/father families (6 | 0.5%) represent the smallest median family size with 2.00 persons per family.
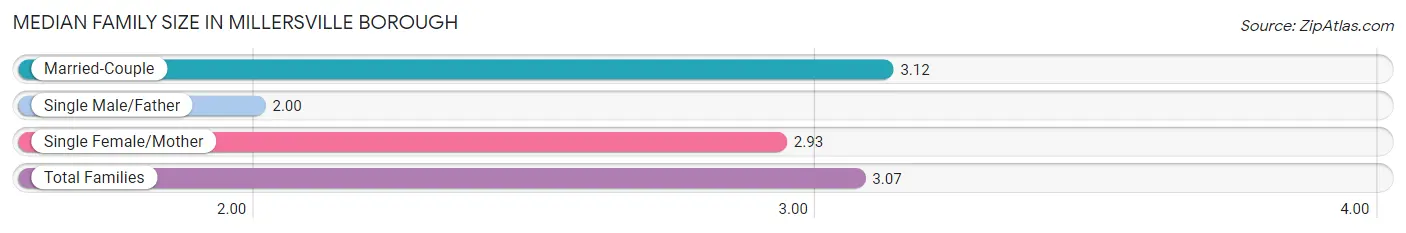
| Family Type | # Families | Family Size |
| Married-Couple | 968 (74.5%) | 3.12 |
| Single Male/Father | 6 (0.5%) | 2.00 |
| Single Female/Mother | 325 (25.0%) | 2.93 |
| Total Families | 1,299 (100.0%) | 3.07 |
Median Household Size in Millersville borough
The median household size in Millersville borough is 2.72 persons per household, with single female/mother households (325 | 13.0%) accounting for the largest median household size of 4.19 persons per household. single male/father households (6 | 0.2%) represent the smallest median household size with 2.00 persons per household.
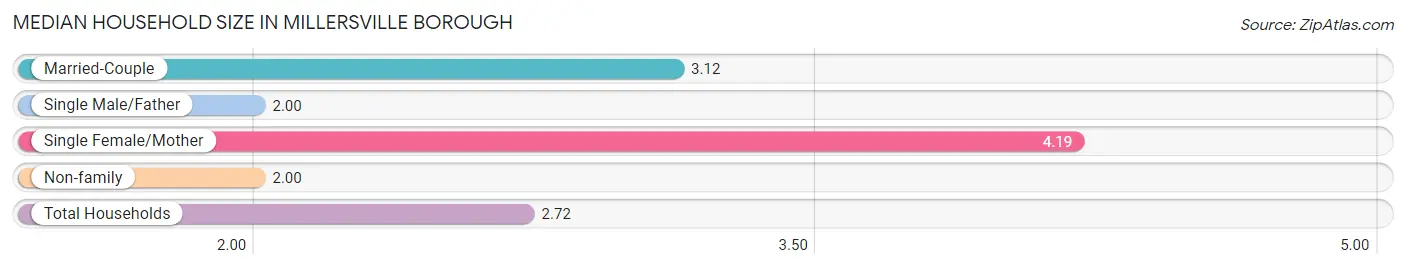
| Household Type | # Households | Household Size |
| Married-Couple | 968 (38.7%) | 3.12 |
| Single Male/Father | 6 (0.2%) | 2.00 |
| Single Female/Mother | 325 (13.0%) | 4.19 |
| Non-family | 1,204 (48.1%) | 2.00 |
| Total Households | 2,503 (100.0%) | 2.72 |
Household Size by Marriage Status in Millersville borough
Out of a total of 2,503 households in Millersville borough, 1,299 (51.9%) are family households, while 1,204 (48.1%) are nonfamily households. The most numerous type of family households are 2-person households, comprising 538, and the most common type of nonfamily households are 1-person households, comprising 642.
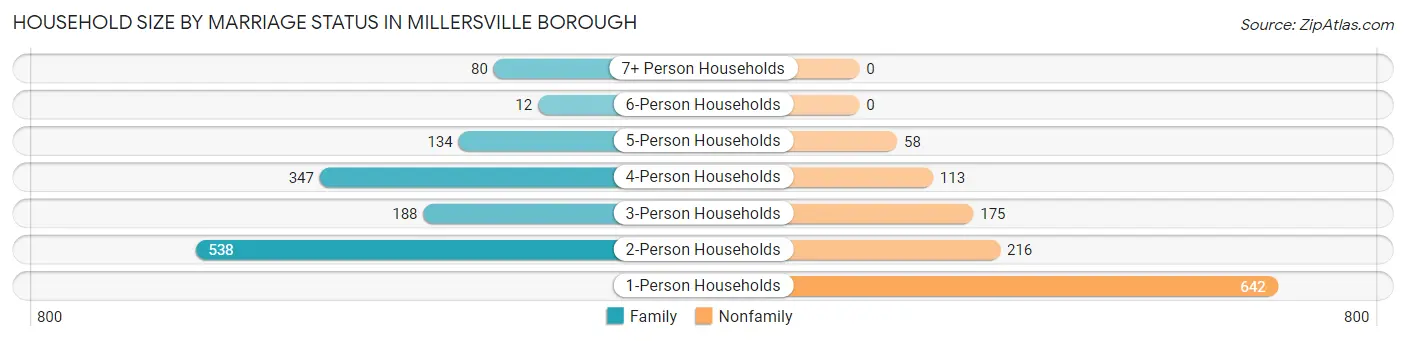
| Household Size | Family Households | Nonfamily Households |
| 1-Person Households | - | 642 (25.7%) |
| 2-Person Households | 538 (21.5%) | 216 (8.6%) |
| 3-Person Households | 188 (7.5%) | 175 (7.0%) |
| 4-Person Households | 347 (13.9%) | 113 (4.5%) |
| 5-Person Households | 134 (5.3%) | 58 (2.3%) |
| 6-Person Households | 12 (0.5%) | 0 (0.0%) |
| 7+ Person Households | 80 (3.2%) | 0 (0.0%) |
| Total | 1,299 (51.9%) | 1,204 (48.1%) |
Female Fertility in Millersville borough
Fertility by Age in Millersville borough
Average fertility rate in Millersville borough is 34.0 births per 1,000 women. Women in the age bracket of 20 to 34 years have the highest fertility rate with 66.0 births per 1,000 women. Women in the age bracket of 20 to 34 years acount for 100.0% of all women with births.
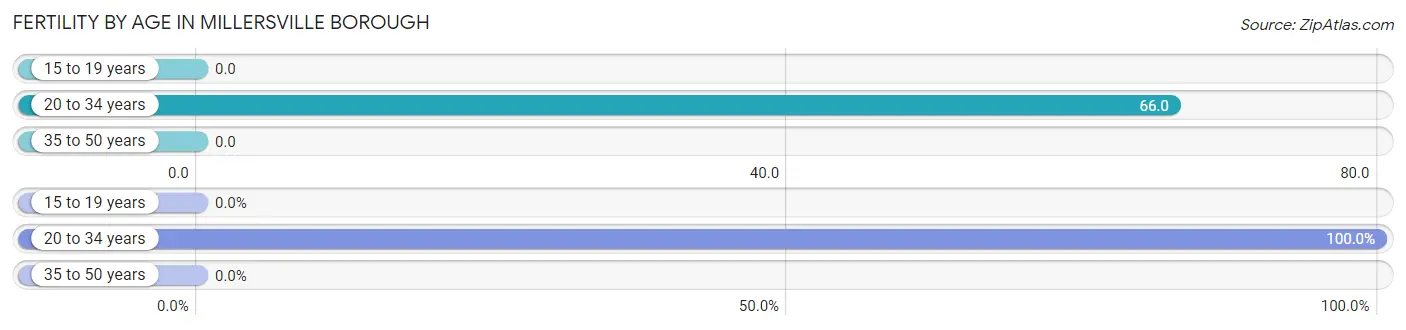
| Age Bracket | Women with Births | Births / 1,000 Women |
| 15 to 19 years | 0 (0.0%) | 0.0 |
| 20 to 34 years | 101 (100.0%) | 66.0 |
| 35 to 50 years | 0 (0.0%) | 0.0 |
| Total | 101 (100.0%) | 34.0 |
Fertility by Age by Marriage Status in Millersville borough
15.8% of women with births (101) in Millersville borough are married. The highest percentage of unmarried women with births falls into 20 to 34 years age bracket with 84.2% of them unmarried at the time of birth, while the lowest percentage of unmarried women with births belong to 20 to 34 years age bracket with 84.2% of them unmarried.
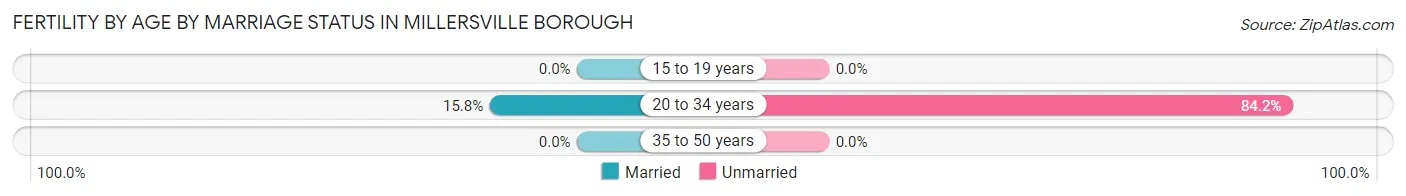
| Age Bracket | Married | Unmarried |
| 15 to 19 years | 0 (0.0%) | 0 (0.0%) |
| 20 to 34 years | 16 (15.8%) | 85 (84.2%) |
| 35 to 50 years | 0 (0.0%) | 0 (0.0%) |
| Total | 16 (15.8%) | 85 (84.2%) |
Fertility by Education in Millersville borough
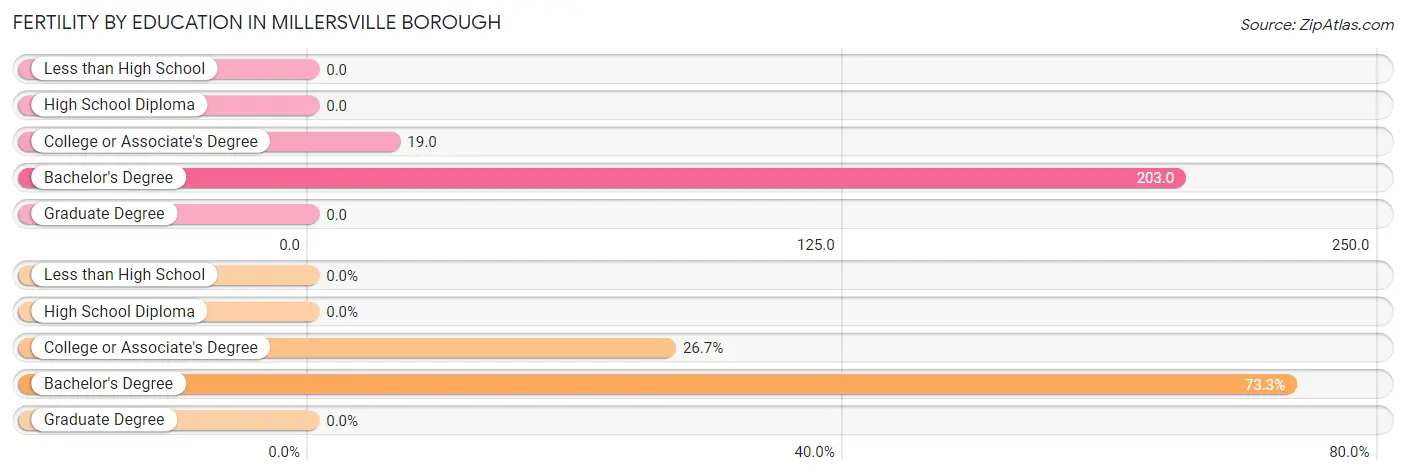
| Educational Attainment | Women with Births | Births / 1,000 Women |
| Less than High School | 0 (0.0%) | 0.0 |
| High School Diploma | 0 (0.0%) | 0.0 |
| College or Associate's Degree | 27 (26.7%) | 19.0 |
| Bachelor's Degree | 74 (73.3%) | 203.0 |
| Graduate Degree | 0 (0.0%) | 0.0 |
| Total | 101 (100.0%) | 34.0 |
Fertility by Education by Marriage Status in Millersville borough
84.2% of women with births in Millersville borough are unmarried. Women with the educational attainment of bachelor's degree are most likely to be married with 16.2% of them married at childbirth, while women with the educational attainment of college or associate's degree are least likely to be married with 85.2% of them unmarried at childbirth.
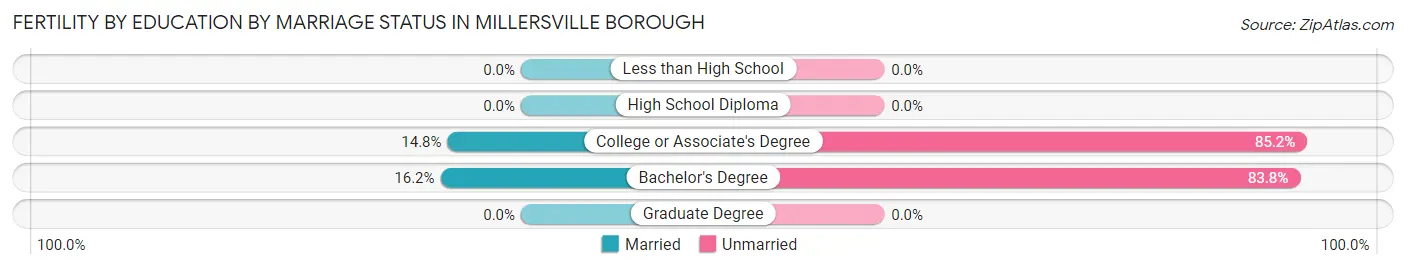
| Educational Attainment | Married | Unmarried |
| Less than High School | 0 (0.0%) | 0 (0.0%) |
| High School Diploma | 0 (0.0%) | 0 (0.0%) |
| College or Associate's Degree | 4 (14.8%) | 23 (85.2%) |
| Bachelor's Degree | 12 (16.2%) | 62 (83.8%) |
| Graduate Degree | 0 (0.0%) | 0 (0.0%) |
| Total | 16 (15.8%) | 85 (84.2%) |
Employment Characteristics in Millersville borough
Employment by Class of Employer in Millersville borough
Among the 3,998 employed individuals in Millersville borough, private company employees (2,633 | 65.9%), not-for-profit organizations (511 | 12.8%), and state government employees (282 | 7.0%) make up the most common classes of employment.
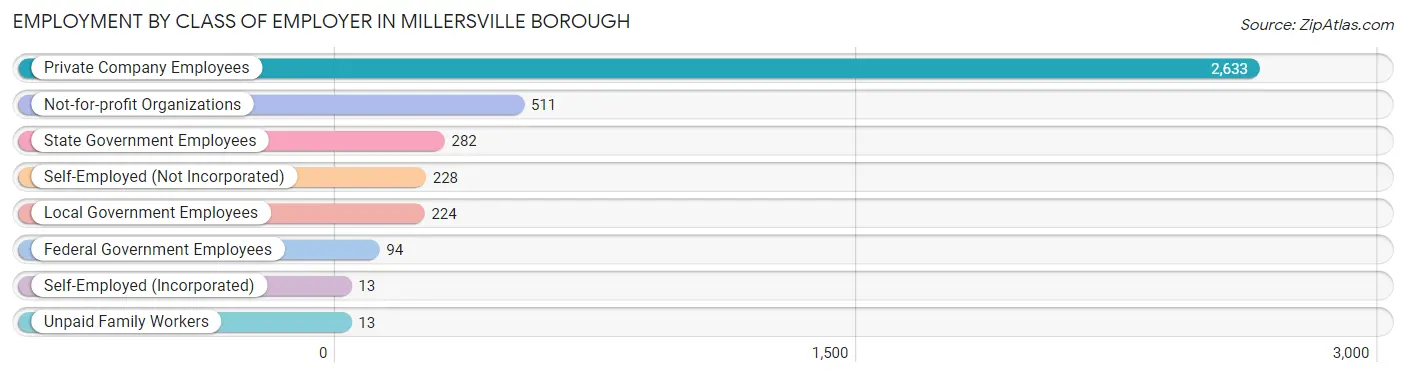
| Employer Class | # Employees | % Employees |
| Private Company Employees | 2,633 | 65.9% |
| Self-Employed (Incorporated) | 13 | 0.3% |
| Self-Employed (Not Incorporated) | 228 | 5.7% |
| Not-for-profit Organizations | 511 | 12.8% |
| Local Government Employees | 224 | 5.6% |
| State Government Employees | 282 | 7.0% |
| Federal Government Employees | 94 | 2.4% |
| Unpaid Family Workers | 13 | 0.3% |
| Total | 3,998 | 100.0% |
Employment Status by Age in Millersville borough
According to the labor force statistics for Millersville borough, out of the total population over 16 years of age (7,508), 57.8% or 4,340 individuals are in the labor force, with 4.1% or 178 of them unemployed. The age group with the highest labor force participation rate is 35 to 44 years, with 93.2% or 795 individuals in the labor force. Within the labor force, the 25 to 29 years age range has the highest percentage of unemployed individuals, with 28.7% or 83 of them being unemployed.
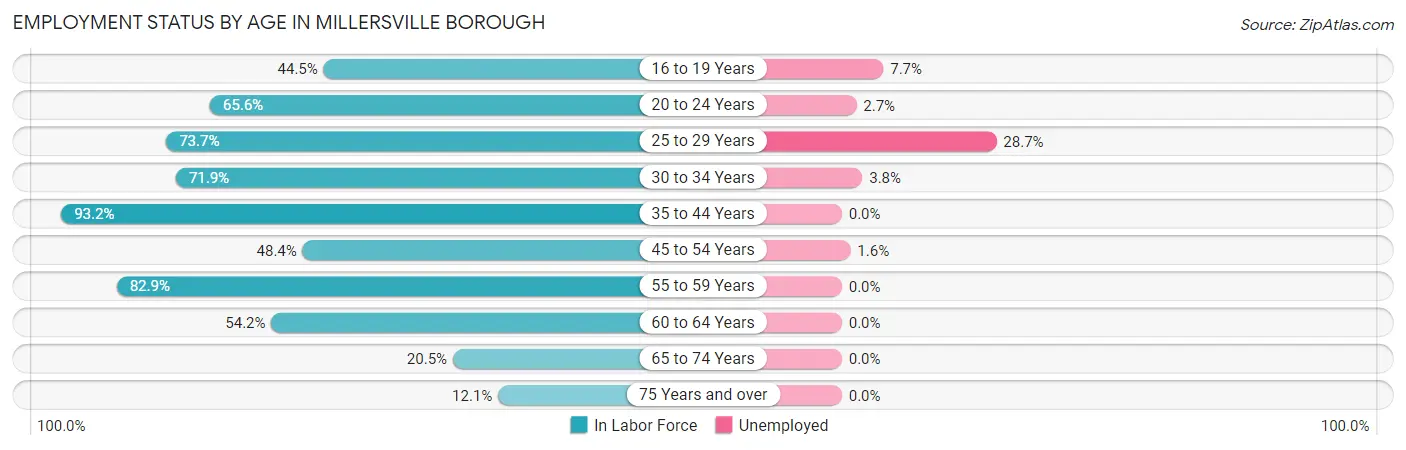
| Age Bracket | In Labor Force | Unemployed |
| 16 to 19 Years | 568 (44.5%) | 44 (7.7%) |
| 20 to 24 Years | 1,418 (65.6%) | 38 (2.7%) |
| 25 to 29 Years | 289 (73.7%) | 83 (28.7%) |
| 30 to 34 Years | 159 (71.9%) | 6 (3.8%) |
| 35 to 44 Years | 795 (93.2%) | 0 (0.0%) |
| 45 to 54 Years | 321 (48.4%) | 5 (1.6%) |
| 55 to 59 Years | 382 (82.9%) | 0 (0.0%) |
| 60 to 64 Years | 243 (54.2%) | 0 (0.0%) |
| 65 to 74 Years | 101 (20.5%) | 0 (0.0%) |
| 75 Years and over | 65 (12.1%) | 0 (0.0%) |
| Total | 4,340 (57.8%) | 178 (4.1%) |
Employment Status by Educational Attainment in Millersville borough
According to labor force statistics for Millersville borough, 72.1% of individuals (2,190) out of the total population between 25 and 64 years of age (3,038) are in the labor force, with 4.3% or 94 of them being unemployed. The group with the highest labor force participation rate are those with the educational attainment of high school diploma, with 84.8% or 889 individuals in the labor force. Within the labor force, individuals with less than high school education have the highest percentage of unemployment, with 10.8% or 15 of them being unemployed.
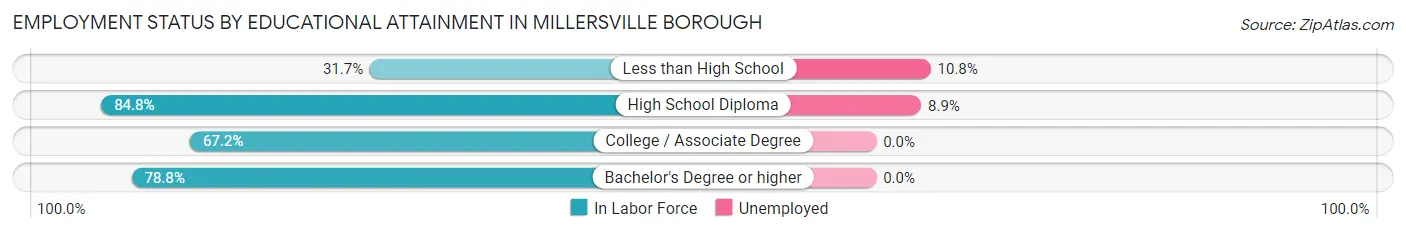
| Educational Attainment | In Labor Force | Unemployed |
| Less than High School | 139 (31.7%) | 47 (10.8%) |
| High School Diploma | 889 (84.8%) | 93 (8.9%) |
| College / Associate Degree | 356 (67.2%) | 0 (0.0%) |
| Bachelor's Degree or higher | 805 (78.8%) | 0 (0.0%) |
| Total | 2,190 (72.1%) | 131 (4.3%) |
Employment Occupations by Sex in Millersville borough
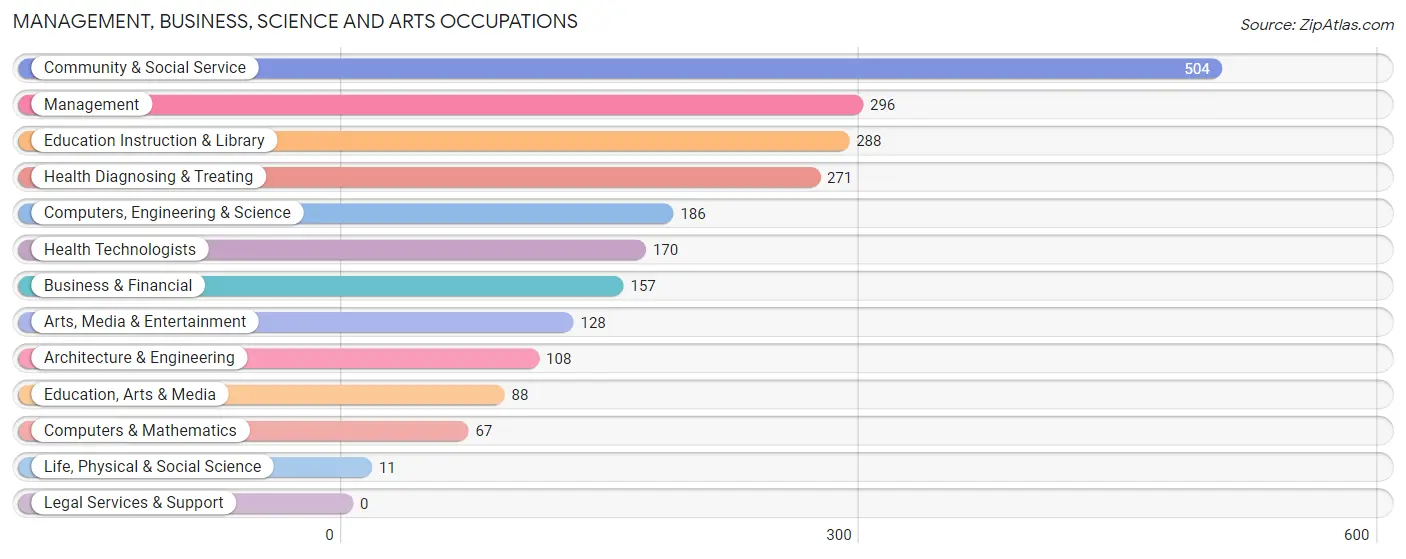
Management, Business, Science and Arts Occupations
The most common Management, Business, Science and Arts occupations in Millersville borough are Community & Social Service (504 | 12.1%), Management (296 | 7.1%), Education Instruction & Library (288 | 6.9%), Health Diagnosing & Treating (271 | 6.5%), and Computers, Engineering & Science (186 | 4.5%).
Management, Business, Science and Arts Occupations by Sex
Within the Management, Business, Science and Arts occupations in Millersville borough, the most male-oriented occupations are Computers & Mathematics (86.6%), Management (79.7%), and Architecture & Engineering (75.9%), while the most female-oriented occupations are Life, Physical & Social Science (100.0%), Health Technologists (100.0%), and Education, Arts & Media (97.7%).
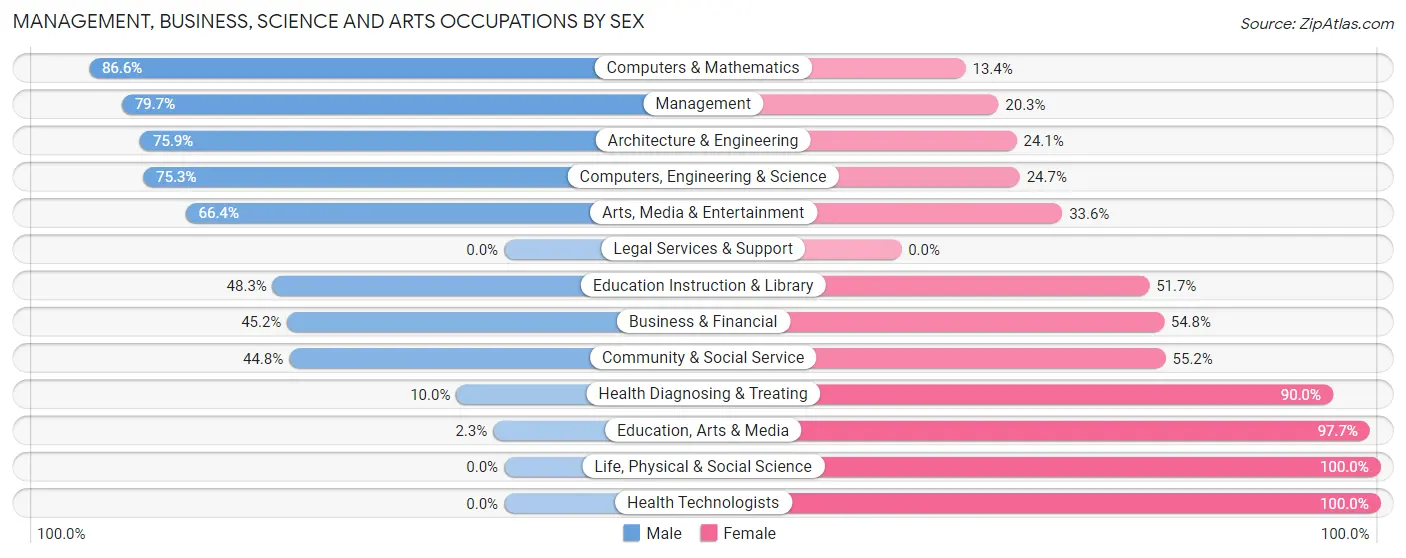
| Occupation | Male | Female |
| Management | 236 (79.7%) | 60 (20.3%) |
| Business & Financial | 71 (45.2%) | 86 (54.8%) |
| Computers, Engineering & Science | 140 (75.3%) | 46 (24.7%) |
| Computers & Mathematics | 58 (86.6%) | 9 (13.4%) |
| Architecture & Engineering | 82 (75.9%) | 26 (24.1%) |
| Life, Physical & Social Science | 0 (0.0%) | 11 (100.0%) |
| Community & Social Service | 226 (44.8%) | 278 (55.2%) |
| Education, Arts & Media | 2 (2.3%) | 86 (97.7%) |
| Legal Services & Support | 0 (0.0%) | 0 (0.0%) |
| Education Instruction & Library | 139 (48.3%) | 149 (51.7%) |
| Arts, Media & Entertainment | 85 (66.4%) | 43 (33.6%) |
| Health Diagnosing & Treating | 27 (10.0%) | 244 (90.0%) |
| Health Technologists | 0 (0.0%) | 170 (100.0%) |
| Total (Category) | 700 (49.5%) | 714 (50.5%) |
| Total (Overall) | 1,999 (48.0%) | 2,166 (52.0%) |
Services Occupations
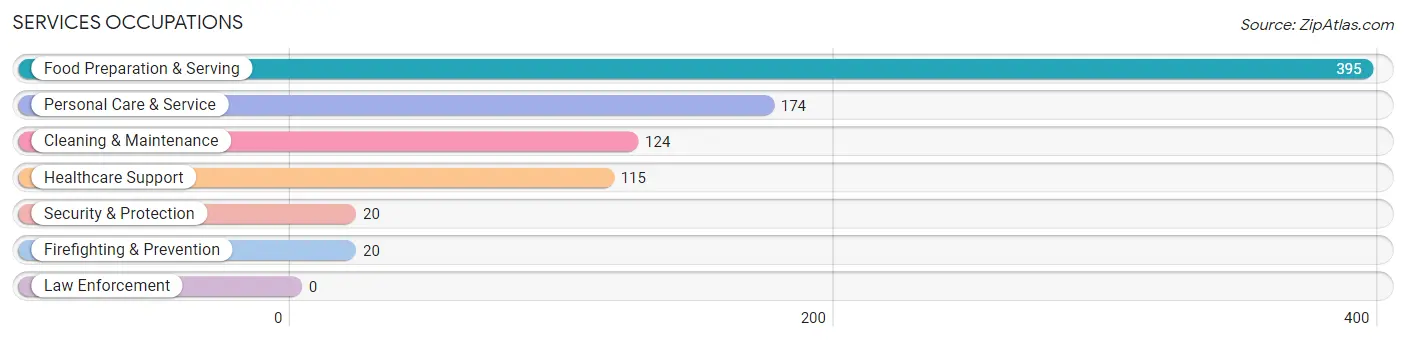
The most common Services occupations in Millersville borough are Food Preparation & Serving (395 | 9.5%), Personal Care & Service (174 | 4.2%), Cleaning & Maintenance (124 | 3.0%), Healthcare Support (115 | 2.8%), and Security & Protection (20 | 0.5%).
Services Occupations by Sex
Within the Services occupations in Millersville borough, the most male-oriented occupations are Security & Protection (65.0%), Firefighting & Prevention (65.0%), and Personal Care & Service (54.6%), while the most female-oriented occupations are Healthcare Support (100.0%), Food Preparation & Serving (80.8%), and Cleaning & Maintenance (75.8%).
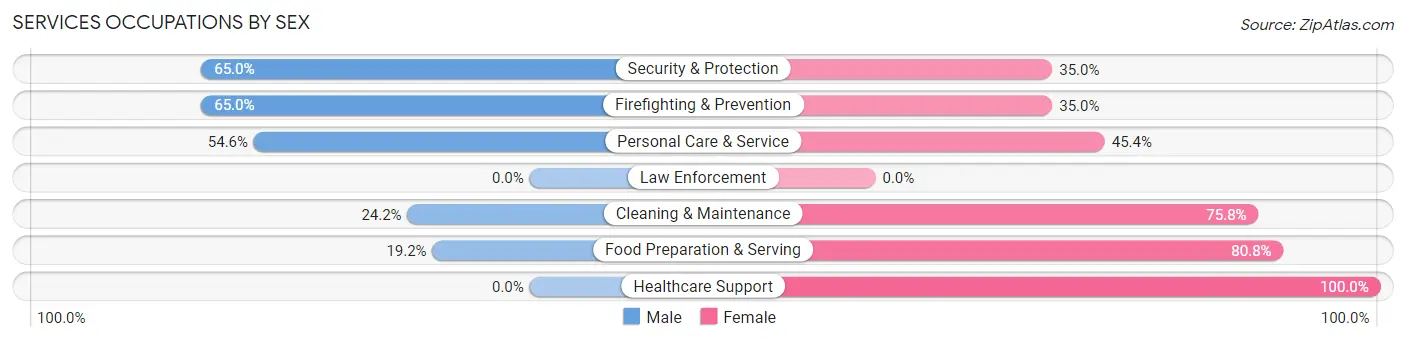
| Occupation | Male | Female |
| Healthcare Support | 0 (0.0%) | 115 (100.0%) |
| Security & Protection | 13 (65.0%) | 7 (35.0%) |
| Firefighting & Prevention | 13 (65.0%) | 7 (35.0%) |
| Law Enforcement | 0 (0.0%) | 0 (0.0%) |
| Food Preparation & Serving | 76 (19.2%) | 319 (80.8%) |
| Cleaning & Maintenance | 30 (24.2%) | 94 (75.8%) |
| Personal Care & Service | 95 (54.6%) | 79 (45.4%) |
| Total (Category) | 214 (25.9%) | 614 (74.2%) |
| Total (Overall) | 1,999 (48.0%) | 2,166 (52.0%) |
Sales and Office Occupations
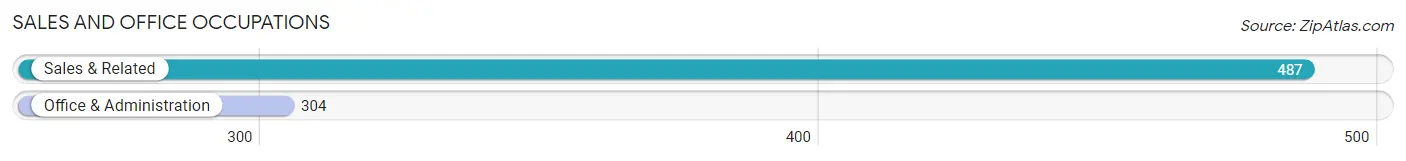
The most common Sales and Office occupations in Millersville borough are Sales & Related (487 | 11.7%), and Office & Administration (304 | 7.3%).
Sales and Office Occupations by Sex

| Occupation | Male | Female |
| Sales & Related | 84 (17.2%) | 403 (82.8%) |
| Office & Administration | 111 (36.5%) | 193 (63.5%) |
| Total (Category) | 195 (24.6%) | 596 (75.3%) |
| Total (Overall) | 1,999 (48.0%) | 2,166 (52.0%) |
Natural Resources, Construction and Maintenance Occupations
The most common Natural Resources, Construction and Maintenance occupations in Millersville borough are Installation, Maintenance & Repair (100 | 2.4%), Construction & Extraction (89 | 2.1%), and Farming, Fishing & Forestry (23 | 0.5%).
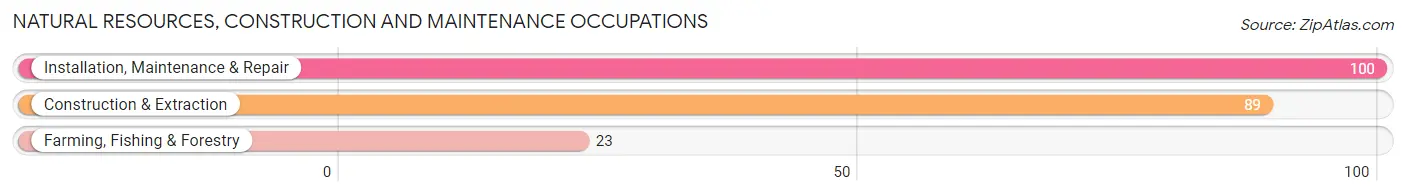
Natural Resources, Construction and Maintenance Occupations by Sex

| Occupation | Male | Female |
| Farming, Fishing & Forestry | 0 (0.0%) | 23 (100.0%) |
| Construction & Extraction | 89 (100.0%) | 0 (0.0%) |
| Installation, Maintenance & Repair | 100 (100.0%) | 0 (0.0%) |
| Total (Category) | 189 (89.1%) | 23 (10.8%) |
| Total (Overall) | 1,999 (48.0%) | 2,166 (52.0%) |
Production, Transportation and Moving Occupations
The most common Production, Transportation and Moving occupations in Millersville borough are Production (415 | 10.0%), Material Moving (342 | 8.2%), and Transportation (163 | 3.9%).
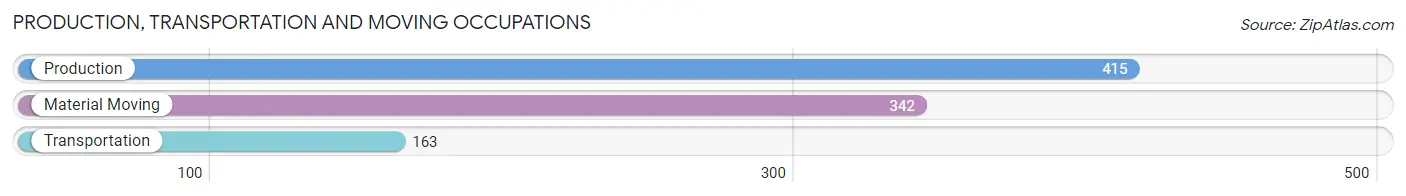
Production, Transportation and Moving Occupations by Sex
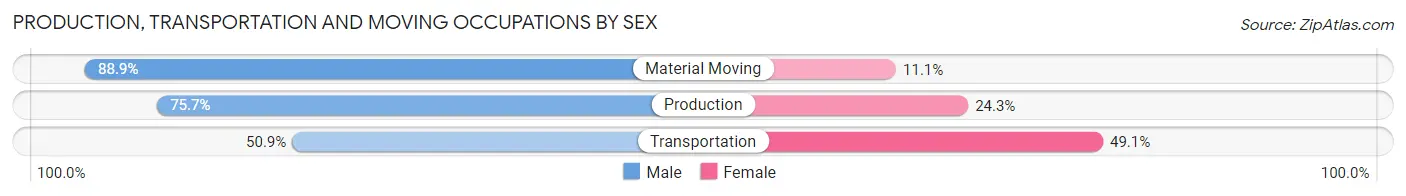
| Occupation | Male | Female |
| Production | 314 (75.7%) | 101 (24.3%) |
| Transportation | 83 (50.9%) | 80 (49.1%) |
| Material Moving | 304 (88.9%) | 38 (11.1%) |
| Total (Category) | 701 (76.2%) | 219 (23.8%) |
| Total (Overall) | 1,999 (48.0%) | 2,166 (52.0%) |
Employment Industries by Sex in Millersville borough
Employment Industries in Millersville borough
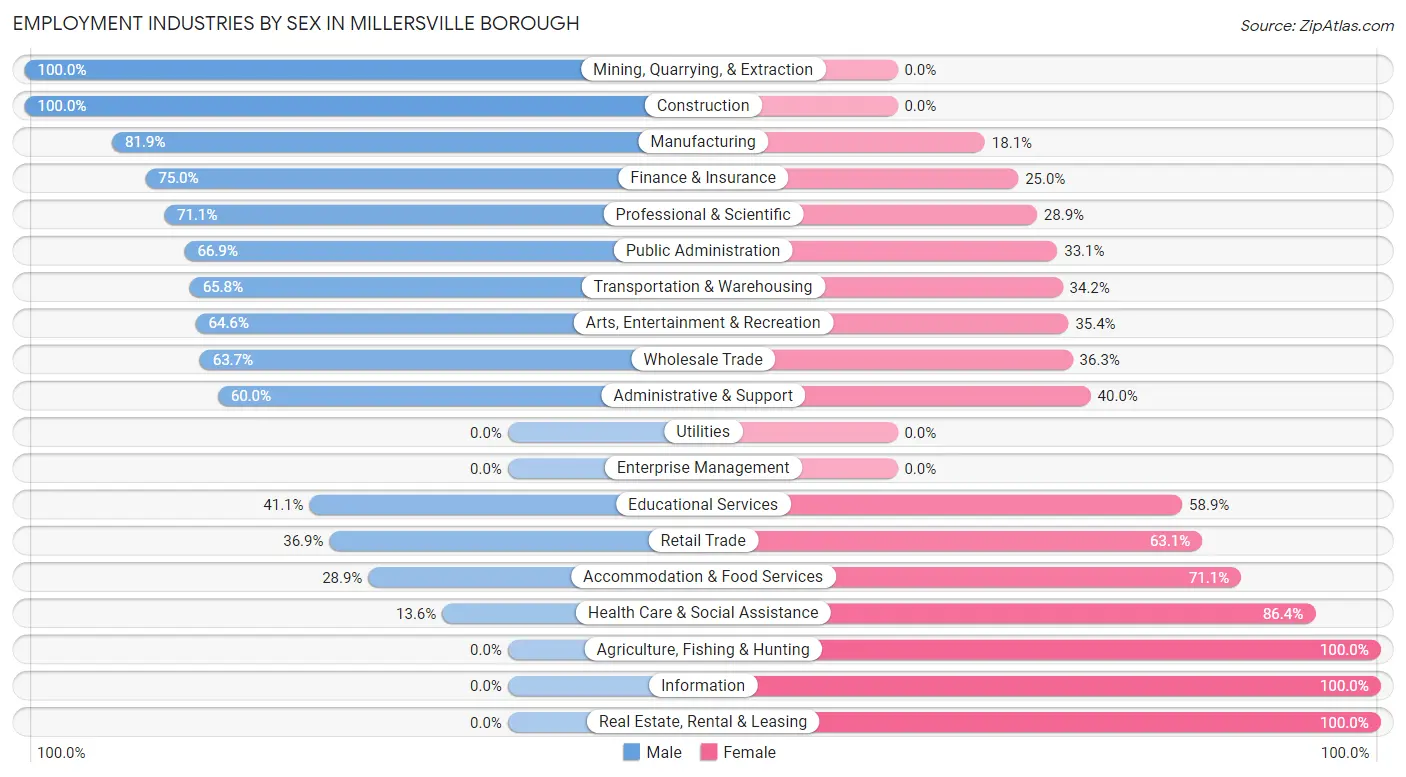
The major employment industries in Millersville borough include Retail Trade (777 | 18.7%), Educational Services (526 | 12.6%), Health Care & Social Assistance (508 | 12.2%), Accommodation & Food Services (464 | 11.1%), and Manufacturing (392 | 9.4%).
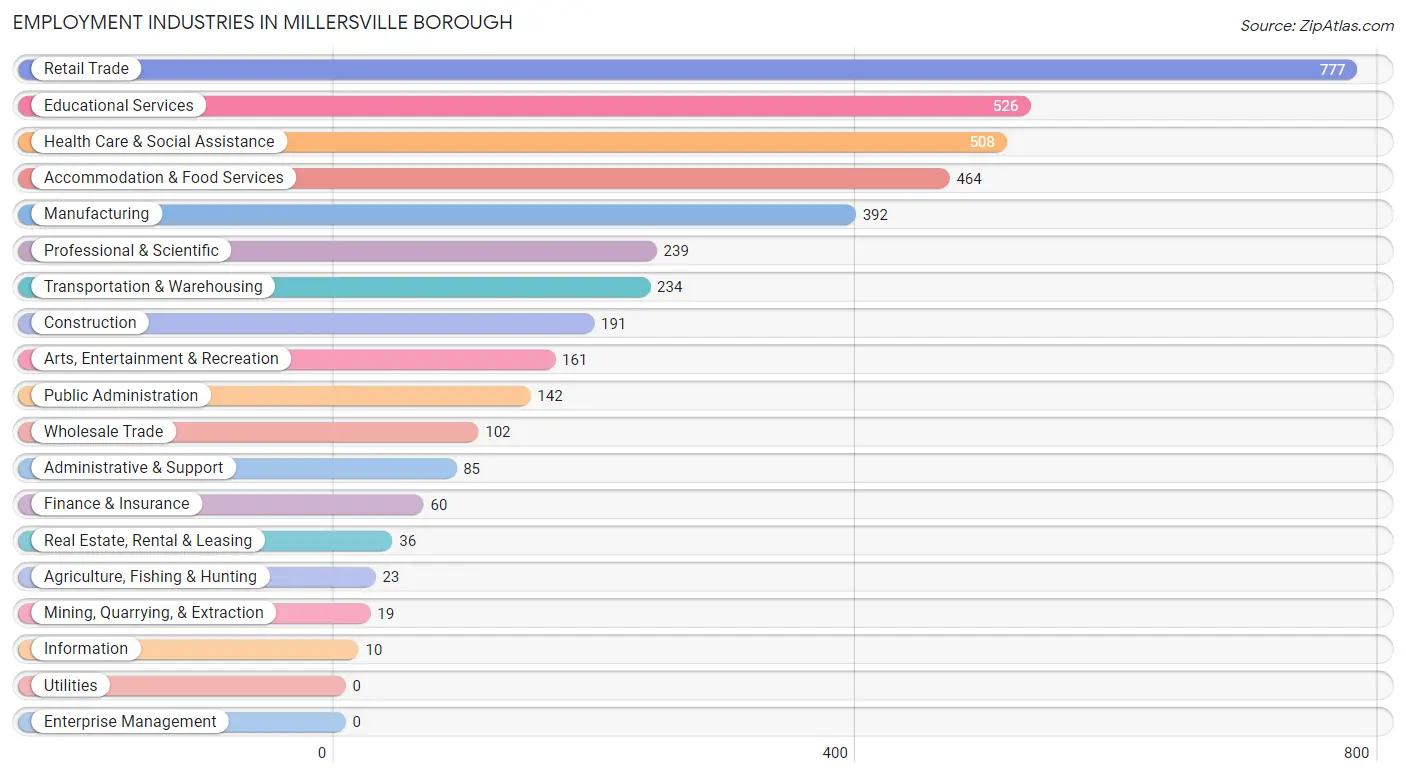
Employment Industries by Sex in Millersville borough
The Millersville borough industries that see more men than women are Mining, Quarrying, & Extraction (100.0%), Construction (100.0%), and Manufacturing (81.9%), whereas the industries that tend to have a higher number of women are Agriculture, Fishing & Hunting (100.0%), Information (100.0%), and Real Estate, Rental & Leasing (100.0%).
| Industry | Male | Female |
| Agriculture, Fishing & Hunting | 0 (0.0%) | 23 (100.0%) |
| Mining, Quarrying, & Extraction | 19 (100.0%) | 0 (0.0%) |
| Construction | 191 (100.0%) | 0 (0.0%) |
| Manufacturing | 321 (81.9%) | 71 (18.1%) |
| Wholesale Trade | 65 (63.7%) | 37 (36.3%) |
| Retail Trade | 287 (36.9%) | 490 (63.1%) |
| Transportation & Warehousing | 154 (65.8%) | 80 (34.2%) |
| Utilities | 0 (0.0%) | 0 (0.0%) |
| Information | 0 (0.0%) | 10 (100.0%) |
| Finance & Insurance | 45 (75.0%) | 15 (25.0%) |
| Real Estate, Rental & Leasing | 0 (0.0%) | 36 (100.0%) |
| Professional & Scientific | 170 (71.1%) | 69 (28.9%) |
| Enterprise Management | 0 (0.0%) | 0 (0.0%) |
| Administrative & Support | 51 (60.0%) | 34 (40.0%) |
| Educational Services | 216 (41.1%) | 310 (58.9%) |
| Health Care & Social Assistance | 69 (13.6%) | 439 (86.4%) |
| Arts, Entertainment & Recreation | 104 (64.6%) | 57 (35.4%) |
| Accommodation & Food Services | 134 (28.9%) | 330 (71.1%) |
| Public Administration | 95 (66.9%) | 47 (33.1%) |
| Total | 1,999 (48.0%) | 2,166 (52.0%) |
Education in Millersville borough
School Enrollment in Millersville borough
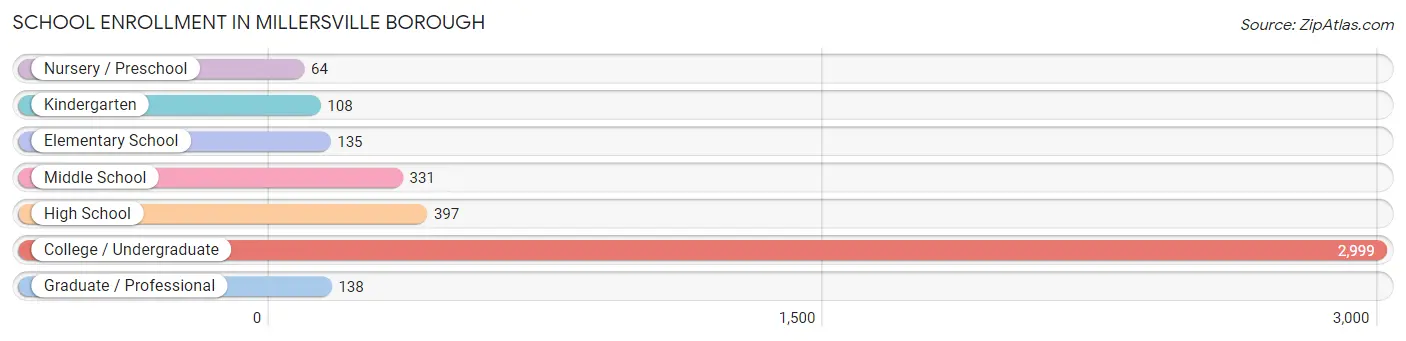
The most common levels of schooling among the 4,172 students in Millersville borough are college / undergraduate (2,999 | 71.9%), high school (397 | 9.5%), and middle school (331 | 7.9%).
| School Level | # Students | % Students |
| Nursery / Preschool | 64 | 1.5% |
| Kindergarten | 108 | 2.6% |
| Elementary School | 135 | 3.2% |
| Middle School | 331 | 7.9% |
| High School | 397 | 9.5% |
| College / Undergraduate | 2,999 | 71.9% |
| Graduate / Professional | 138 | 3.3% |
| Total | 4,172 | 100.0% |
School Enrollment by Age by Funding Source in Millersville borough
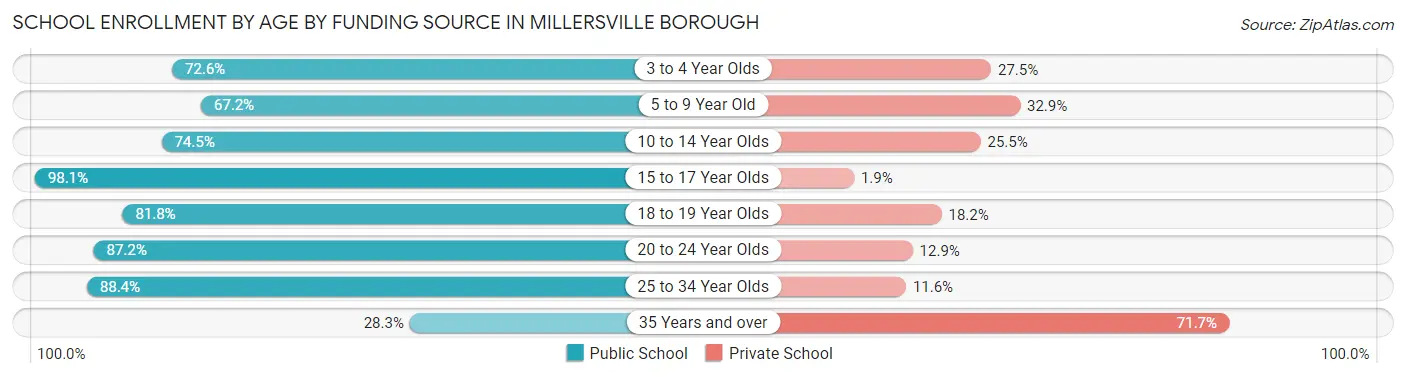
Out of a total of 4,172 students who are enrolled in schools in Millersville borough, 688 (16.5%) attend a private institution, while the remaining 3,484 (83.5%) are enrolled in public schools. The age group of 35 years and over has the highest likelihood of being enrolled in private schools, with 33 (71.7% in the age bracket) enrolled. Conversely, the age group of 15 to 17 year olds has the lowest likelihood of being enrolled in a private school, with 307 (98.1% in the age bracket) attending a public institution.
| Age Bracket | Public School | Private School |
| 3 to 4 Year Olds | 37 (72.6%) | 14 (27.5%) |
| 5 to 9 Year Old | 139 (67.1%) | 68 (32.9%) |
| 10 to 14 Year Olds | 333 (74.5%) | 114 (25.5%) |
| 15 to 17 Year Olds | 307 (98.1%) | 6 (1.9%) |
| 18 to 19 Year Olds | 879 (81.8%) | 196 (18.2%) |
| 20 to 24 Year Olds | 1,614 (87.2%) | 238 (12.9%) |
| 25 to 34 Year Olds | 160 (88.4%) | 21 (11.6%) |
| 35 Years and over | 13 (28.3%) | 33 (71.7%) |
| Total | 3,484 (83.5%) | 688 (16.5%) |
Educational Attainment by Field of Study in Millersville borough
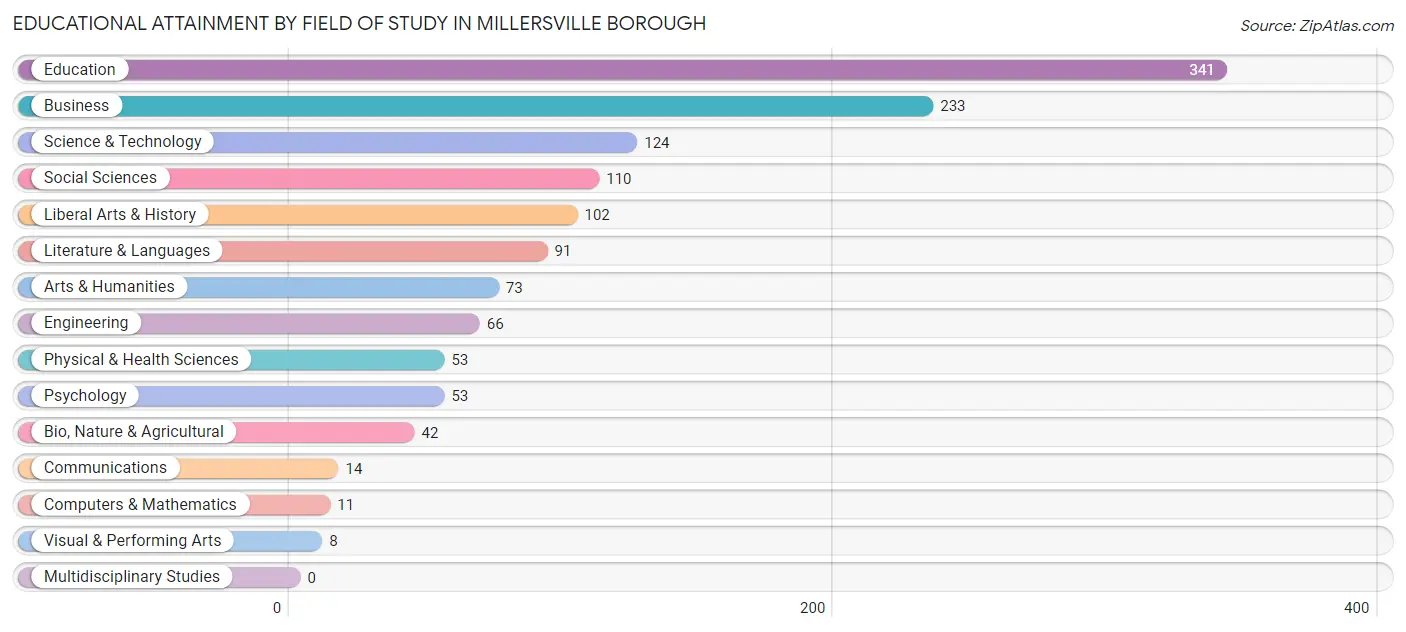
Education (341 | 25.8%), business (233 | 17.6%), science & technology (124 | 9.4%), social sciences (110 | 8.3%), and liberal arts & history (102 | 7.7%) are the most common fields of study among 1,321 individuals in Millersville borough who have obtained a bachelor's degree or higher.
| Field of Study | # Graduates | % Graduates |
| Computers & Mathematics | 11 | 0.8% |
| Bio, Nature & Agricultural | 42 | 3.2% |
| Physical & Health Sciences | 53 | 4.0% |
| Psychology | 53 | 4.0% |
| Social Sciences | 110 | 8.3% |
| Engineering | 66 | 5.0% |
| Multidisciplinary Studies | 0 | 0.0% |
| Science & Technology | 124 | 9.4% |
| Business | 233 | 17.6% |
| Education | 341 | 25.8% |
| Literature & Languages | 91 | 6.9% |
| Liberal Arts & History | 102 | 7.7% |
| Visual & Performing Arts | 8 | 0.6% |
| Communications | 14 | 1.1% |
| Arts & Humanities | 73 | 5.5% |
| Total | 1,321 | 100.0% |
Transportation & Commute in Millersville borough
Vehicle Availability by Sex in Millersville borough
The most prevalent vehicle ownership categories in Millersville borough are males with 2 vehicles (630, accounting for 38.8%) and females with 2 vehicles (493, making up 39.1%).
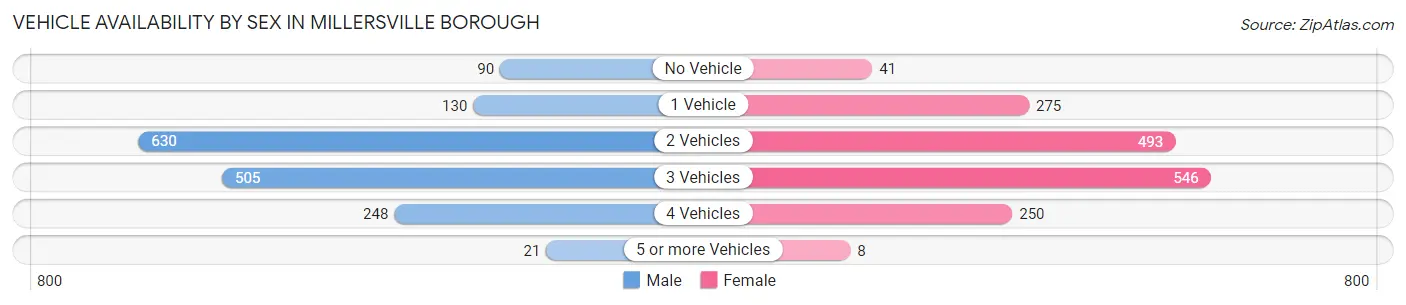
| Vehicles Available | Male | Female |
| No Vehicle | 90 (5.5%) | 41 (2.5%) |
| 1 Vehicle | 130 (8.0%) | 275 (17.1%) |
| 2 Vehicles | 630 (38.8%) | 493 (30.6%) |
| 3 Vehicles | 505 (31.1%) | 546 (33.9%) |
| 4 Vehicles | 248 (15.3%) | 250 (15.5%) |
| 5 or more Vehicles | 21 (1.3%) | 8 (0.5%) |
| Total | 1,624 (100.0%) | 1,613 (100.0%) |
Commute Time in Millersville borough
The most frequently occuring commute durations in Millersville borough are 20 to 24 minutes (834 commuters, 22.5%), 15 to 19 minutes (578 commuters, 15.6%), and 5 to 9 minutes (437 commuters, 11.8%).
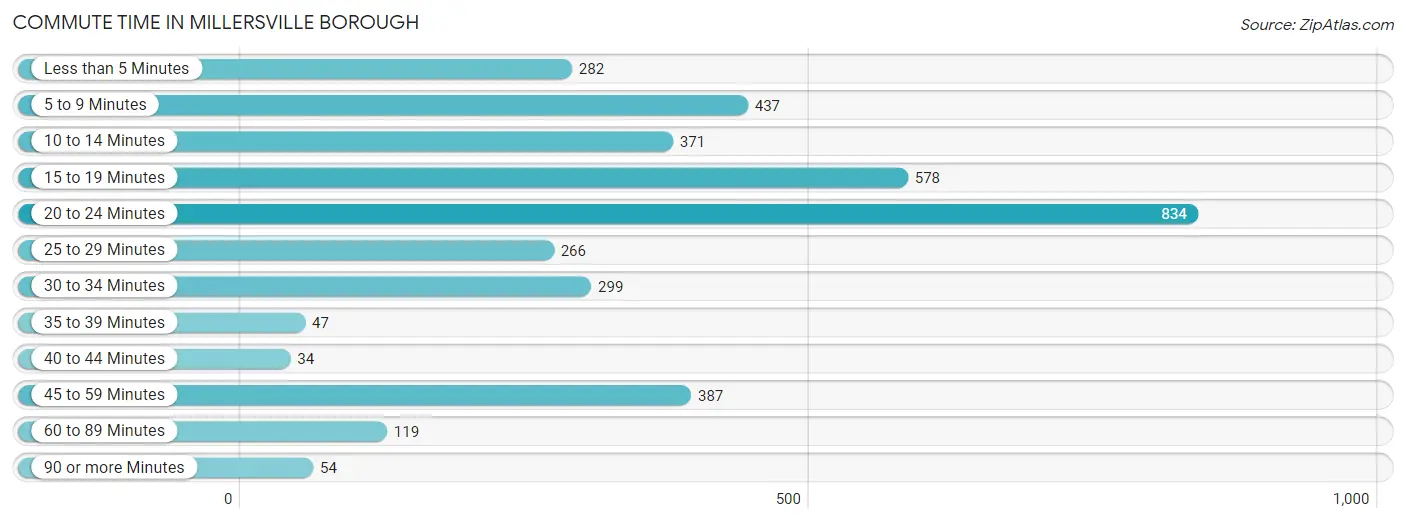
| Commute Time | # Commuters | % Commuters |
| Less than 5 Minutes | 282 | 7.6% |
| 5 to 9 Minutes | 437 | 11.8% |
| 10 to 14 Minutes | 371 | 10.0% |
| 15 to 19 Minutes | 578 | 15.6% |
| 20 to 24 Minutes | 834 | 22.5% |
| 25 to 29 Minutes | 266 | 7.2% |
| 30 to 34 Minutes | 299 | 8.1% |
| 35 to 39 Minutes | 47 | 1.3% |
| 40 to 44 Minutes | 34 | 0.9% |
| 45 to 59 Minutes | 387 | 10.4% |
| 60 to 89 Minutes | 119 | 3.2% |
| 90 or more Minutes | 54 | 1.5% |
Commute Time by Sex in Millersville borough
The most common commute times in Millersville borough are 20 to 24 minutes (369 commuters, 20.0%) for males and 20 to 24 minutes (465 commuters, 24.9%) for females.
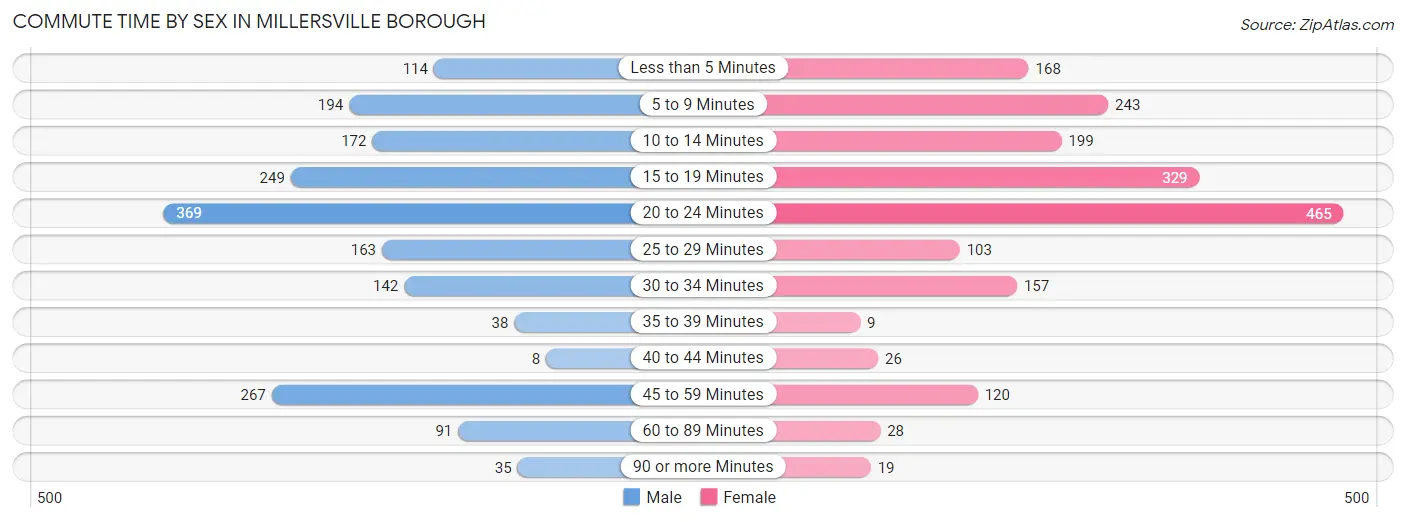
| Commute Time | Male | Female |
| Less than 5 Minutes | 114 (6.2%) | 168 (9.0%) |
| 5 to 9 Minutes | 194 (10.5%) | 243 (13.0%) |
| 10 to 14 Minutes | 172 (9.3%) | 199 (10.7%) |
| 15 to 19 Minutes | 249 (13.5%) | 329 (17.6%) |
| 20 to 24 Minutes | 369 (20.0%) | 465 (24.9%) |
| 25 to 29 Minutes | 163 (8.8%) | 103 (5.5%) |
| 30 to 34 Minutes | 142 (7.7%) | 157 (8.4%) |
| 35 to 39 Minutes | 38 (2.1%) | 9 (0.5%) |
| 40 to 44 Minutes | 8 (0.4%) | 26 (1.4%) |
| 45 to 59 Minutes | 267 (14.5%) | 120 (6.4%) |
| 60 to 89 Minutes | 91 (4.9%) | 28 (1.5%) |
| 90 or more Minutes | 35 (1.9%) | 19 (1.0%) |
Time of Departure to Work by Sex in Millersville borough
The most frequent times of departure to work in Millersville borough are 12:00 PM to 3:59 PM (268, 14.5%) for males and 7:30 AM to 7:59 AM (346, 18.5%) for females.
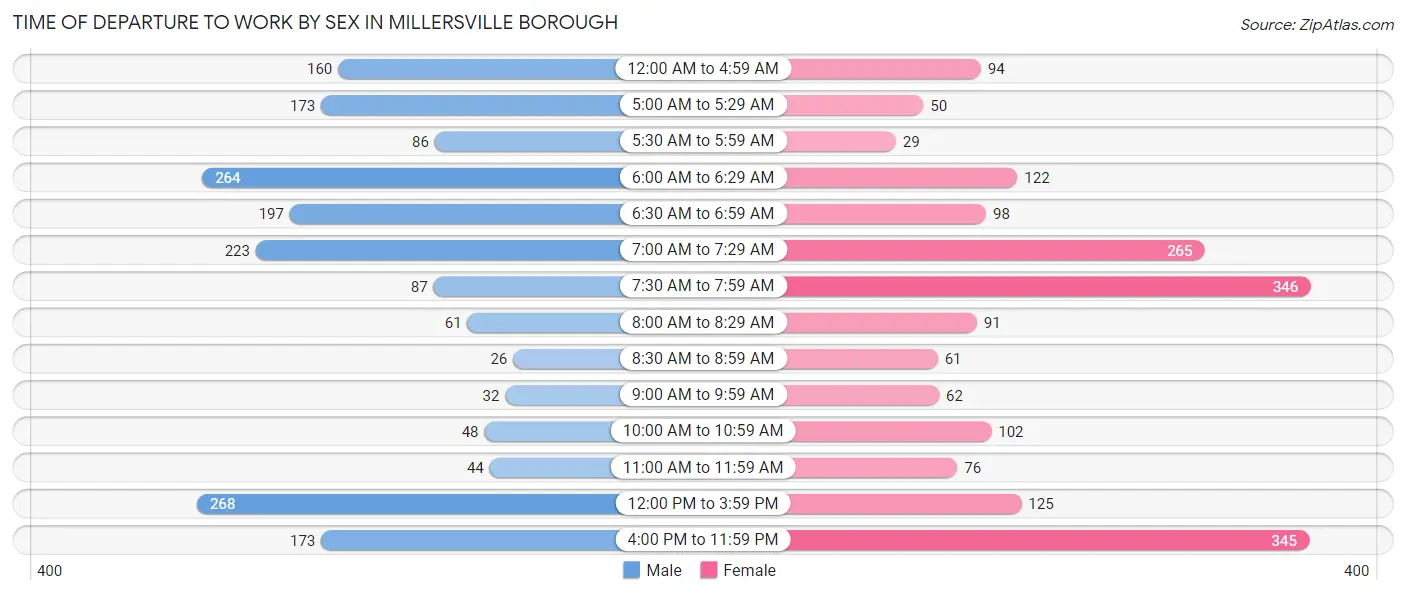
| Time of Departure | Male | Female |
| 12:00 AM to 4:59 AM | 160 (8.7%) | 94 (5.0%) |
| 5:00 AM to 5:29 AM | 173 (9.4%) | 50 (2.7%) |
| 5:30 AM to 5:59 AM | 86 (4.7%) | 29 (1.5%) |
| 6:00 AM to 6:29 AM | 264 (14.3%) | 122 (6.5%) |
| 6:30 AM to 6:59 AM | 197 (10.7%) | 98 (5.2%) |
| 7:00 AM to 7:29 AM | 223 (12.1%) | 265 (14.2%) |
| 7:30 AM to 7:59 AM | 87 (4.7%) | 346 (18.5%) |
| 8:00 AM to 8:29 AM | 61 (3.3%) | 91 (4.9%) |
| 8:30 AM to 8:59 AM | 26 (1.4%) | 61 (3.3%) |
| 9:00 AM to 9:59 AM | 32 (1.7%) | 62 (3.3%) |
| 10:00 AM to 10:59 AM | 48 (2.6%) | 102 (5.5%) |
| 11:00 AM to 11:59 AM | 44 (2.4%) | 76 (4.1%) |
| 12:00 PM to 3:59 PM | 268 (14.5%) | 125 (6.7%) |
| 4:00 PM to 11:59 PM | 173 (9.4%) | 345 (18.5%) |
| Total | 1,842 (100.0%) | 1,866 (100.0%) |
Housing Occupancy in Millersville borough
Occupancy by Ownership in Millersville borough
Of the total 2,503 dwellings in Millersville borough, owner-occupied units account for 1,310 (52.3%), while renter-occupied units make up 1,193 (47.7%).
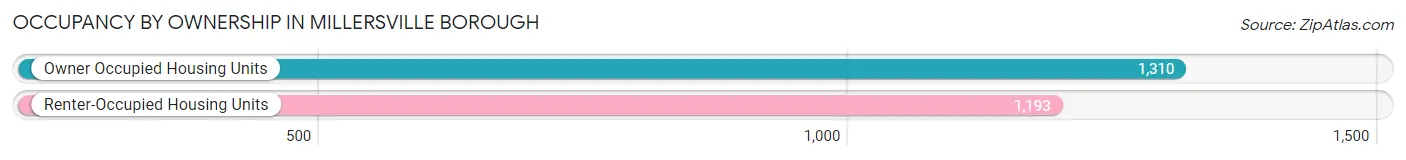
| Occupancy | # Housing Units | % Housing Units |
| Owner Occupied Housing Units | 1,310 | 52.3% |
| Renter-Occupied Housing Units | 1,193 | 47.7% |
| Total Occupied Housing Units | 2,503 | 100.0% |
Occupancy by Household Size in Millersville borough
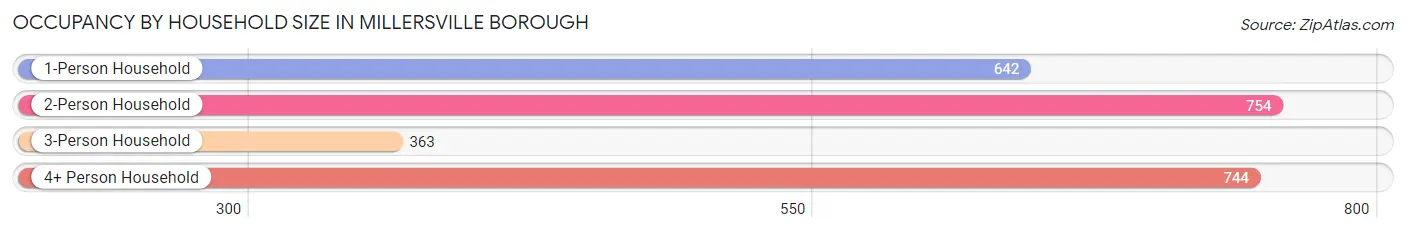
| Household Size | # Housing Units | % Housing Units |
| 1-Person Household | 642 | 25.7% |
| 2-Person Household | 754 | 30.1% |
| 3-Person Household | 363 | 14.5% |
| 4+ Person Household | 744 | 29.7% |
| Total Housing Units | 2,503 | 100.0% |
Occupancy by Ownership by Household Size in Millersville borough
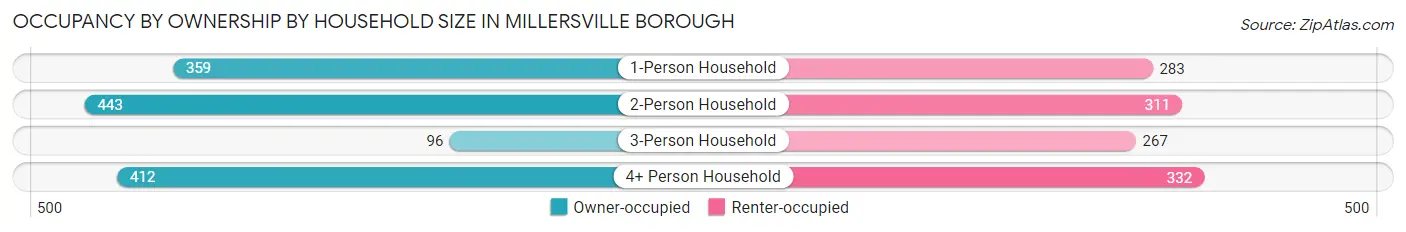
| Household Size | Owner-occupied | Renter-occupied |
| 1-Person Household | 359 (55.9%) | 283 (44.1%) |
| 2-Person Household | 443 (58.8%) | 311 (41.2%) |
| 3-Person Household | 96 (26.5%) | 267 (73.6%) |
| 4+ Person Household | 412 (55.4%) | 332 (44.6%) |
| Total Housing Units | 1,310 (52.3%) | 1,193 (47.7%) |
Occupancy by Educational Attainment in Millersville borough
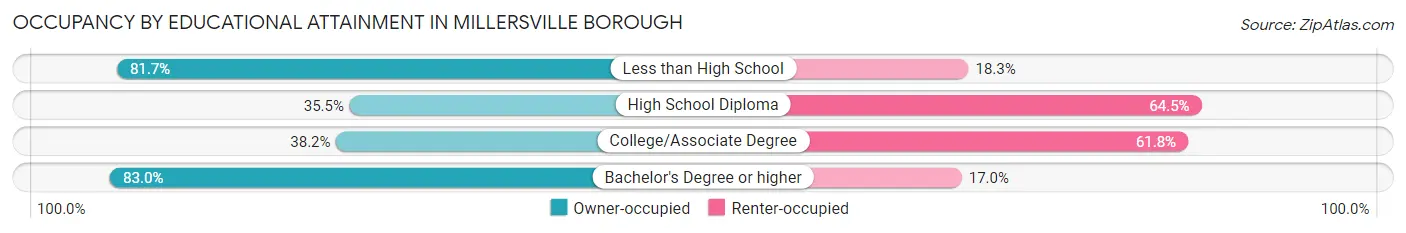
| Household Size | Owner-occupied | Renter-occupied |
| Less than High School | 107 (81.7%) | 24 (18.3%) |
| High School Diploma | 336 (35.5%) | 610 (64.5%) |
| College/Associate Degree | 270 (38.2%) | 437 (61.8%) |
| Bachelor's Degree or higher | 597 (83.0%) | 122 (17.0%) |
Occupancy by Age of Householder in Millersville borough
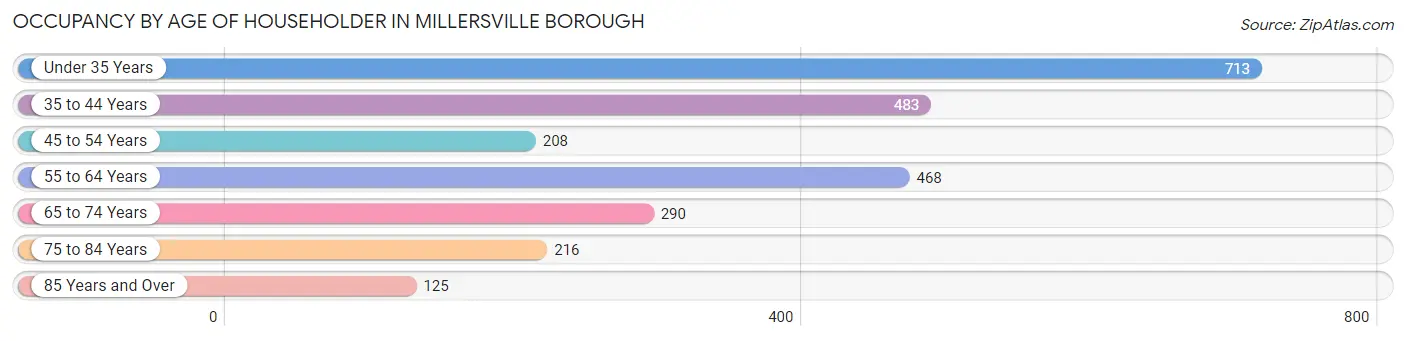
| Age Bracket | # Households | % Households |
| Under 35 Years | 713 | 28.5% |
| 35 to 44 Years | 483 | 19.3% |
| 45 to 54 Years | 208 | 8.3% |
| 55 to 64 Years | 468 | 18.7% |
| 65 to 74 Years | 290 | 11.6% |
| 75 to 84 Years | 216 | 8.6% |
| 85 Years and Over | 125 | 5.0% |
| Total | 2,503 | 100.0% |
Housing Finances in Millersville borough
Median Income by Occupancy in Millersville borough
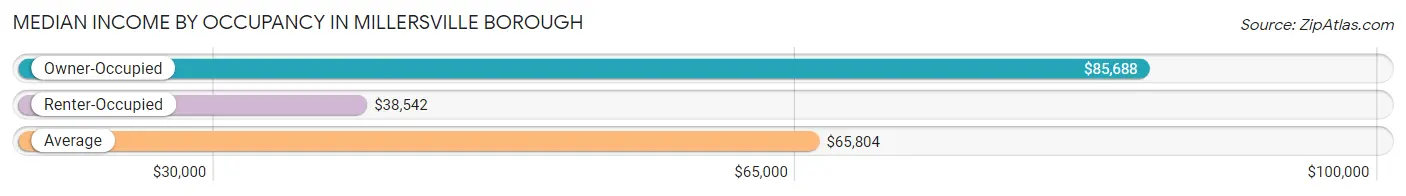
| Occupancy Type | # Households | Median Income |
| Owner-Occupied | 1,310 (52.3%) | $85,688 |
| Renter-Occupied | 1,193 (47.7%) | $38,542 |
| Average | 2,503 (100.0%) | $65,804 |
Occupancy by Householder Income Bracket in Millersville borough
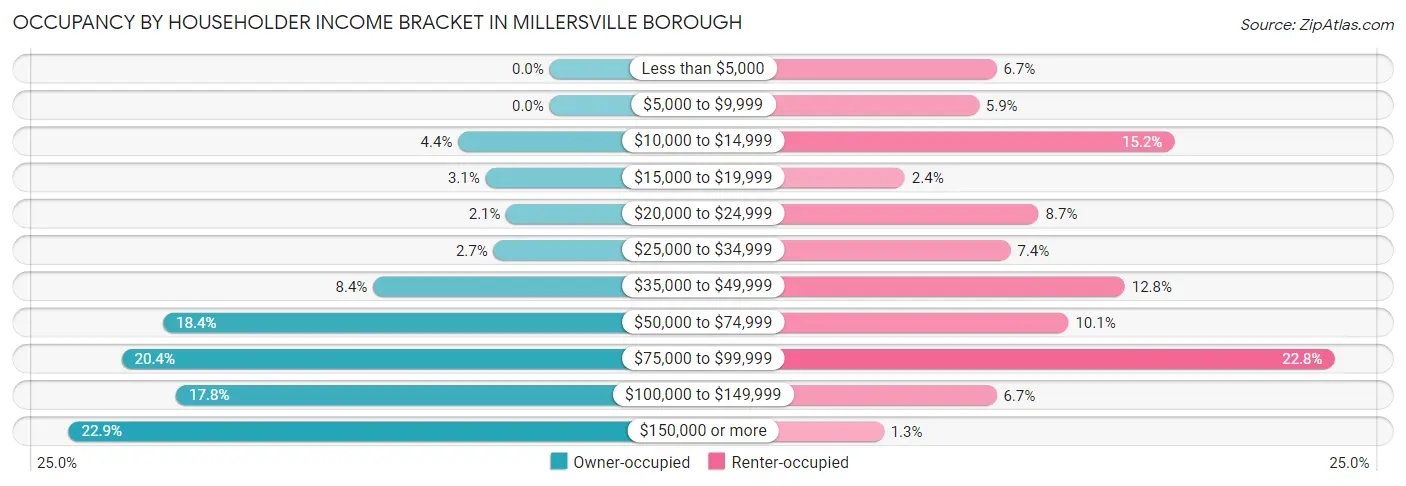
| Income Bracket | Owner-occupied | Renter-occupied |
| Less than $5,000 | 0 (0.0%) | 80 (6.7%) |
| $5,000 to $9,999 | 0 (0.0%) | 70 (5.9%) |
| $10,000 to $14,999 | 57 (4.3%) | 181 (15.2%) |
| $15,000 to $19,999 | 40 (3.0%) | 28 (2.4%) |
| $20,000 to $24,999 | 27 (2.1%) | 104 (8.7%) |
| $25,000 to $34,999 | 35 (2.7%) | 88 (7.4%) |
| $35,000 to $49,999 | 110 (8.4%) | 153 (12.8%) |
| $50,000 to $74,999 | 241 (18.4%) | 121 (10.1%) |
| $75,000 to $99,999 | 267 (20.4%) | 272 (22.8%) |
| $100,000 to $149,999 | 233 (17.8%) | 80 (6.7%) |
| $150,000 or more | 300 (22.9%) | 16 (1.3%) |
| Total | 1,310 (100.0%) | 1,193 (100.0%) |
Monthly Housing Cost Tiers in Millersville borough
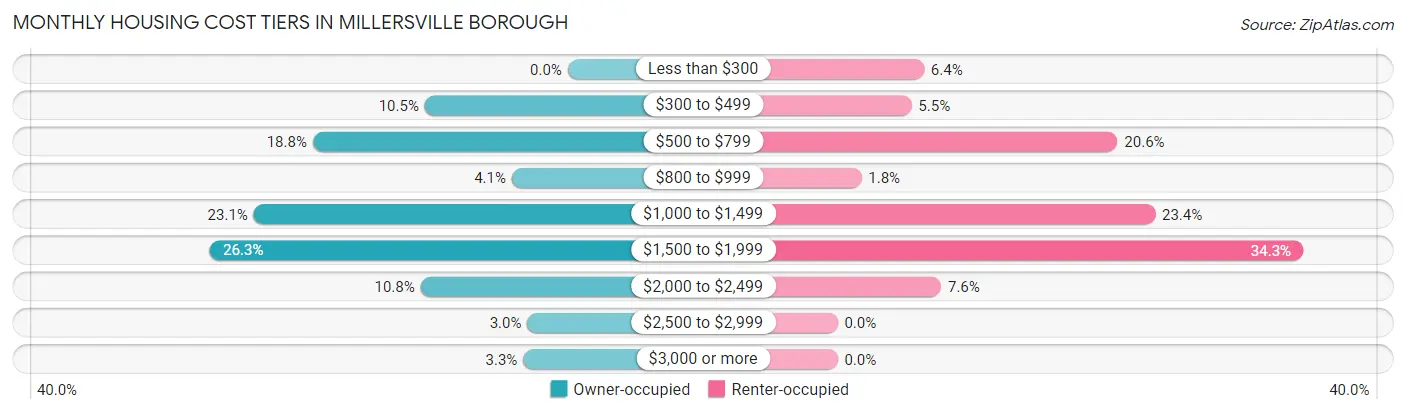
| Monthly Cost | Owner-occupied | Renter-occupied |
| Less than $300 | 0 (0.0%) | 76 (6.4%) |
| $300 to $499 | 138 (10.5%) | 65 (5.4%) |
| $500 to $799 | 246 (18.8%) | 246 (20.6%) |
| $800 to $999 | 54 (4.1%) | 21 (1.8%) |
| $1,000 to $1,499 | 303 (23.1%) | 279 (23.4%) |
| $1,500 to $1,999 | 345 (26.3%) | 409 (34.3%) |
| $2,000 to $2,499 | 142 (10.8%) | 91 (7.6%) |
| $2,500 to $2,999 | 39 (3.0%) | 0 (0.0%) |
| $3,000 or more | 43 (3.3%) | 0 (0.0%) |
| Total | 1,310 (100.0%) | 1,193 (100.0%) |
Physical Housing Characteristics in Millersville borough
Housing Structures in Millersville borough
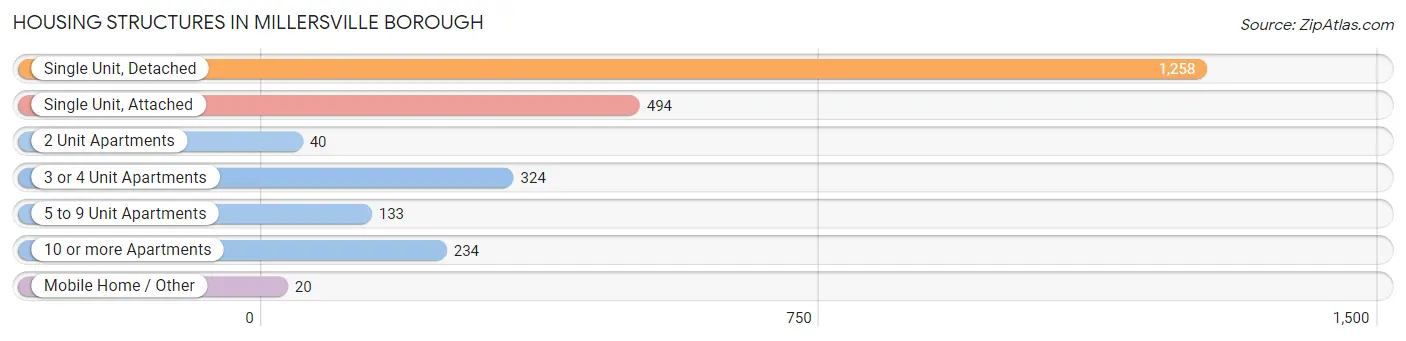
| Structure Type | # Housing Units | % Housing Units |
| Single Unit, Detached | 1,258 | 50.3% |
| Single Unit, Attached | 494 | 19.7% |
| 2 Unit Apartments | 40 | 1.6% |
| 3 or 4 Unit Apartments | 324 | 12.9% |
| 5 to 9 Unit Apartments | 133 | 5.3% |
| 10 or more Apartments | 234 | 9.3% |
| Mobile Home / Other | 20 | 0.8% |
| Total | 2,503 | 100.0% |
Housing Structures by Occupancy in Millersville borough
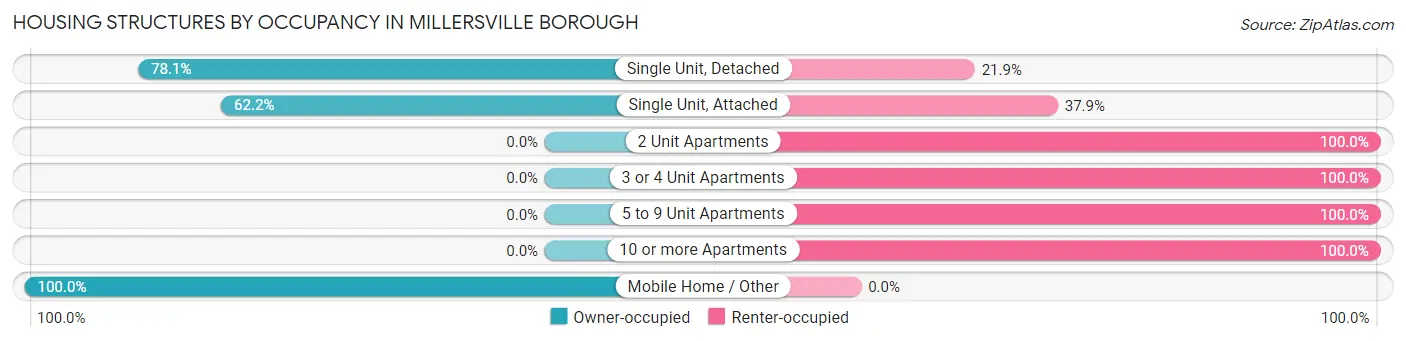
| Structure Type | Owner-occupied | Renter-occupied |
| Single Unit, Detached | 983 (78.1%) | 275 (21.9%) |
| Single Unit, Attached | 307 (62.2%) | 187 (37.9%) |
| 2 Unit Apartments | 0 (0.0%) | 40 (100.0%) |
| 3 or 4 Unit Apartments | 0 (0.0%) | 324 (100.0%) |
| 5 to 9 Unit Apartments | 0 (0.0%) | 133 (100.0%) |
| 10 or more Apartments | 0 (0.0%) | 234 (100.0%) |
| Mobile Home / Other | 20 (100.0%) | 0 (0.0%) |
| Total | 1,310 (52.3%) | 1,193 (47.7%) |
Housing Structures by Number of Rooms in Millersville borough
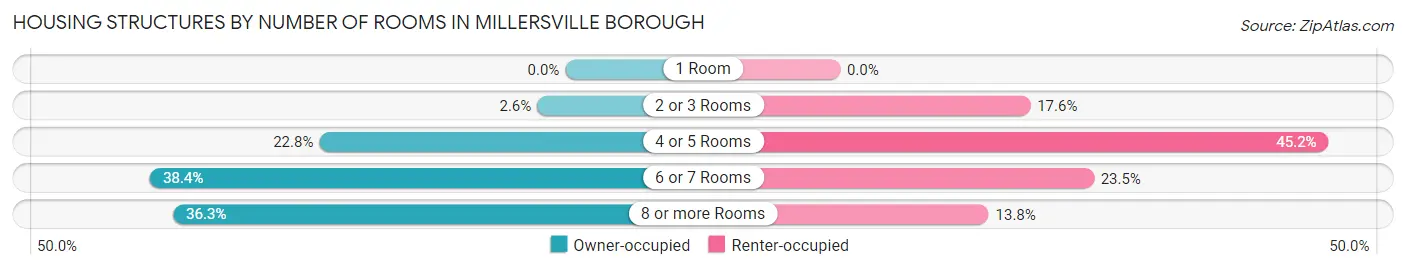
| Number of Rooms | Owner-occupied | Renter-occupied |
| 1 Room | 0 (0.0%) | 0 (0.0%) |
| 2 or 3 Rooms | 34 (2.6%) | 210 (17.6%) |
| 4 or 5 Rooms | 298 (22.8%) | 539 (45.2%) |
| 6 or 7 Rooms | 503 (38.4%) | 280 (23.5%) |
| 8 or more Rooms | 475 (36.3%) | 164 (13.8%) |
| Total | 1,310 (100.0%) | 1,193 (100.0%) |
Housing Structure by Heating Type in Millersville borough
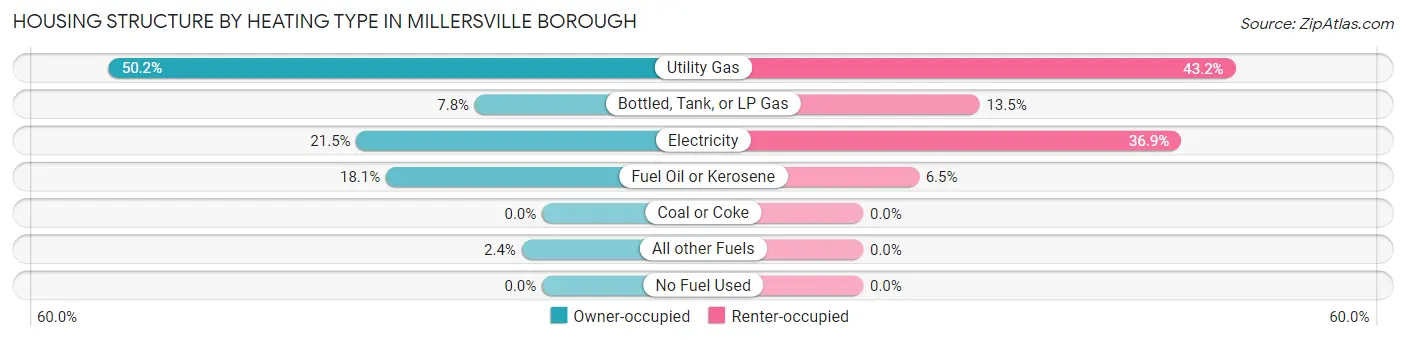
| Heating Type | Owner-occupied | Renter-occupied |
| Utility Gas | 658 (50.2%) | 515 (43.2%) |
| Bottled, Tank, or LP Gas | 102 (7.8%) | 161 (13.5%) |
| Electricity | 282 (21.5%) | 440 (36.9%) |
| Fuel Oil or Kerosene | 237 (18.1%) | 77 (6.5%) |
| Coal or Coke | 0 (0.0%) | 0 (0.0%) |
| All other Fuels | 31 (2.4%) | 0 (0.0%) |
| No Fuel Used | 0 (0.0%) | 0 (0.0%) |
| Total | 1,310 (100.0%) | 1,193 (100.0%) |
Household Vehicle Usage in Millersville borough
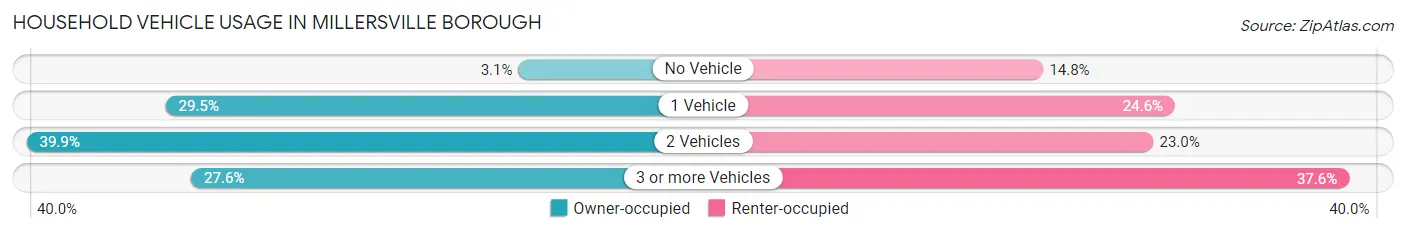
| Vehicles per Household | Owner-occupied | Renter-occupied |
| No Vehicle | 41 (3.1%) | 176 (14.7%) |
| 1 Vehicle | 386 (29.5%) | 294 (24.6%) |
| 2 Vehicles | 522 (39.9%) | 274 (23.0%) |
| 3 or more Vehicles | 361 (27.6%) | 449 (37.6%) |
| Total | 1,310 (100.0%) | 1,193 (100.0%) |
Real Estate & Mortgages in Millersville borough
Real Estate and Mortgage Overview in Millersville borough
| Characteristic | Without Mortgage | With Mortgage |
| Housing Units | 483 | 827 |
| Median Property Value | $210,200 | $243,500 |
| Median Household Income | $68,250 | $191 |
| Monthly Housing Costs | $612 | $43 |
| Real Estate Taxes | $3,576 | $0 |
Property Value by Mortgage Status in Millersville borough
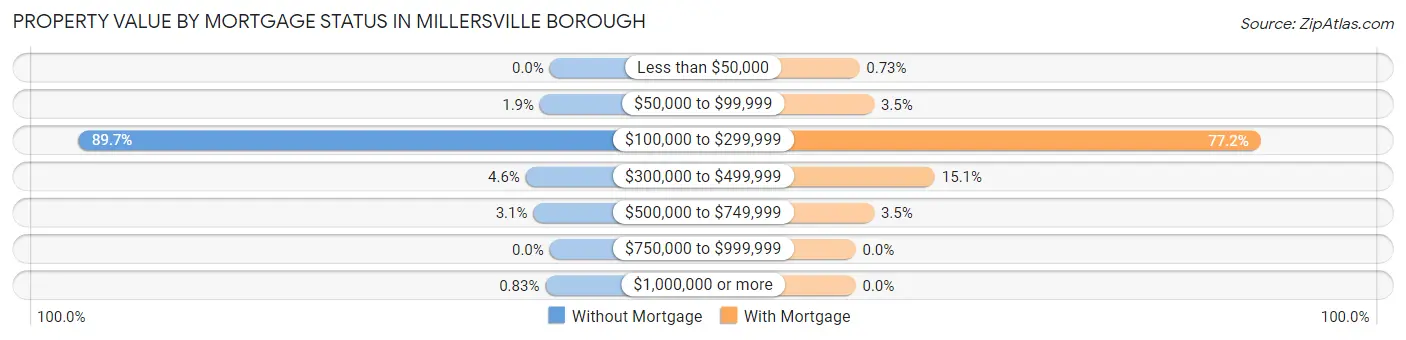
| Property Value | Without Mortgage | With Mortgage |
| Less than $50,000 | 0 (0.0%) | 6 (0.7%) |
| $50,000 to $99,999 | 9 (1.9%) | 29 (3.5%) |
| $100,000 to $299,999 | 433 (89.6%) | 638 (77.1%) |
| $300,000 to $499,999 | 22 (4.5%) | 125 (15.1%) |
| $500,000 to $749,999 | 15 (3.1%) | 29 (3.5%) |
| $750,000 to $999,999 | 0 (0.0%) | 0 (0.0%) |
| $1,000,000 or more | 4 (0.8%) | 0 (0.0%) |
| Total | 483 (100.0%) | 827 (100.0%) |
Household Income by Mortgage Status in Millersville borough
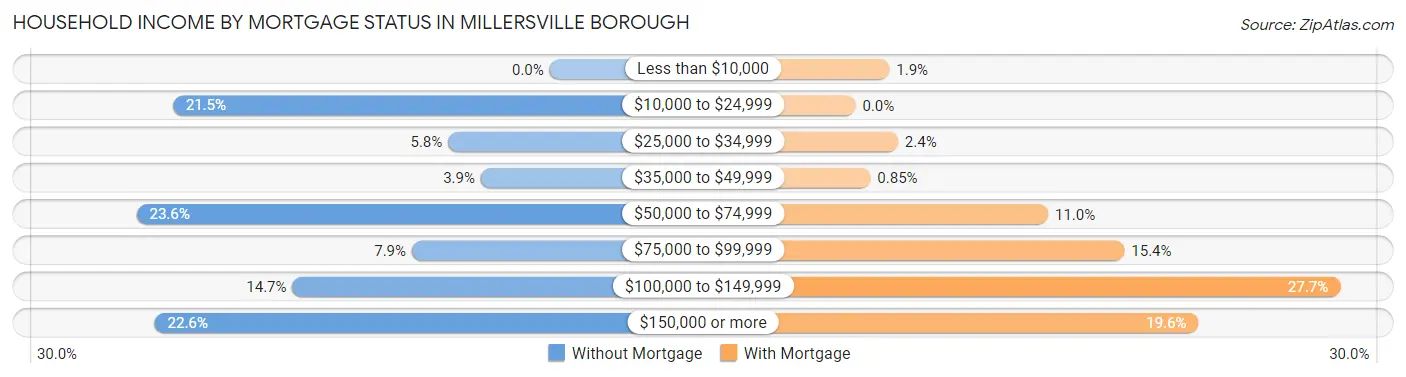
| Household Income | Without Mortgage | With Mortgage |
| Less than $10,000 | 0 (0.0%) | 16 (1.9%) |
| $10,000 to $24,999 | 104 (21.5%) | 0 (0.0%) |
| $25,000 to $34,999 | 28 (5.8%) | 20 (2.4%) |
| $35,000 to $49,999 | 19 (3.9%) | 7 (0.9%) |
| $50,000 to $74,999 | 114 (23.6%) | 91 (11.0%) |
| $75,000 to $99,999 | 38 (7.9%) | 127 (15.4%) |
| $100,000 to $149,999 | 71 (14.7%) | 229 (27.7%) |
| $150,000 or more | 109 (22.6%) | 162 (19.6%) |
| Total | 483 (100.0%) | 827 (100.0%) |
Property Value to Household Income Ratio in Millersville borough
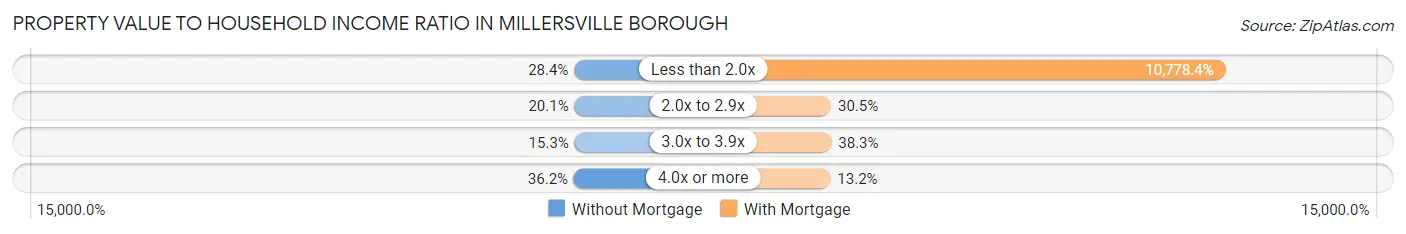
| Value-to-Income Ratio | Without Mortgage | With Mortgage |
| Less than 2.0x | 137 (28.4%) | 89,137 (10,778.4%) |
| 2.0x to 2.9x | 97 (20.1%) | 252 (30.5%) |
| 3.0x to 3.9x | 74 (15.3%) | 317 (38.3%) |
| 4.0x or more | 175 (36.2%) | 109 (13.2%) |
| Total | 483 (100.0%) | 827 (100.0%) |
Real Estate Taxes by Mortgage Status in Millersville borough
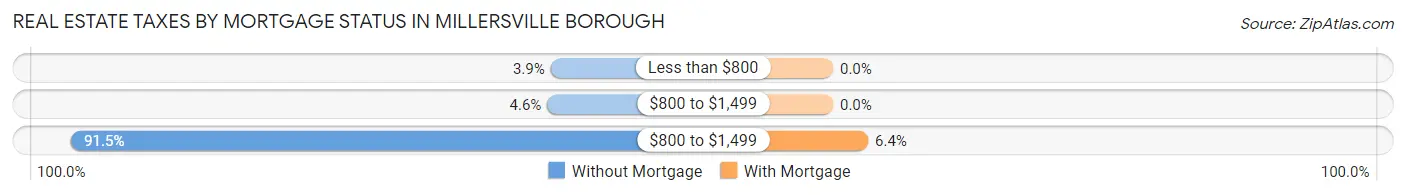
| Property Taxes | Without Mortgage | With Mortgage |
| Less than $800 | 19 (3.9%) | 0 (0.0%) |
| $800 to $1,499 | 22 (4.5%) | 0 (0.0%) |
| $800 to $1,499 | 442 (91.5%) | 53 (6.4%) |
| Total | 483 (100.0%) | 827 (100.0%) |
Health & Disability in Millersville borough
Health Insurance Coverage by Age in Millersville borough
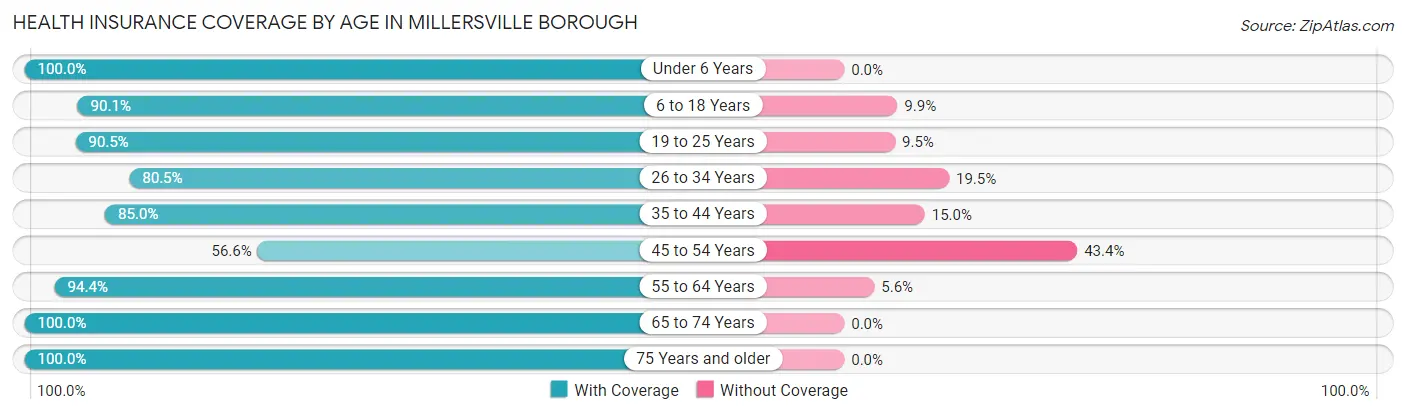
| Age Bracket | With Coverage | Without Coverage |
| Under 6 Years | 195 (100.0%) | 0 (0.0%) |
| 6 to 18 Years | 1,174 (90.1%) | 129 (9.9%) |
| 19 to 25 Years | 2,701 (90.5%) | 283 (9.5%) |
| 26 to 34 Years | 383 (80.5%) | 93 (19.5%) |
| 35 to 44 Years | 725 (85.0%) | 128 (15.0%) |
| 45 to 54 Years | 375 (56.6%) | 288 (43.4%) |
| 55 to 64 Years | 858 (94.4%) | 51 (5.6%) |
| 65 to 74 Years | 492 (100.0%) | 0 (0.0%) |
| 75 Years and older | 526 (100.0%) | 0 (0.0%) |
| Total | 7,429 (88.4%) | 972 (11.6%) |
Health Insurance Coverage by Citizenship Status in Millersville borough
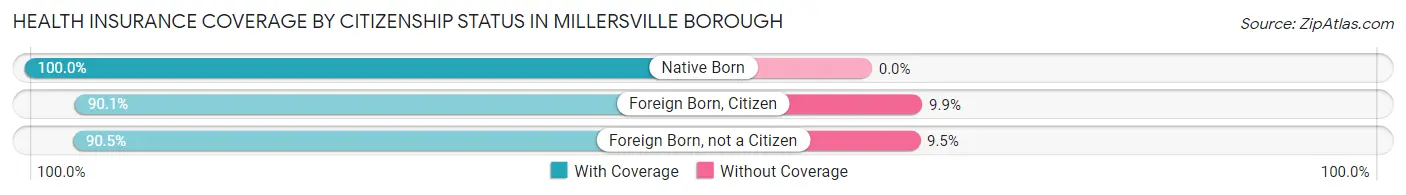
| Citizenship Status | With Coverage | Without Coverage |
| Native Born | 195 (100.0%) | 0 (0.0%) |
| Foreign Born, Citizen | 1,174 (90.1%) | 129 (9.9%) |
| Foreign Born, not a Citizen | 2,701 (90.5%) | 283 (9.5%) |
Health Insurance Coverage by Household Income in Millersville borough
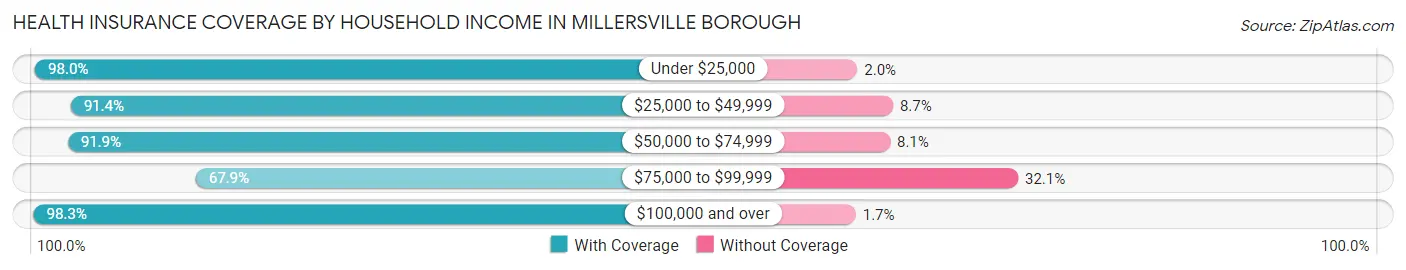
| Household Income | With Coverage | Without Coverage |
| Under $25,000 | 1,090 (98.0%) | 22 (2.0%) |
| $25,000 to $49,999 | 760 (91.3%) | 72 (8.6%) |
| $50,000 to $74,999 | 794 (91.9%) | 70 (8.1%) |
| $75,000 to $99,999 | 1,414 (67.9%) | 668 (32.1%) |
| $100,000 and over | 1,876 (98.3%) | 32 (1.7%) |
Public vs Private Health Insurance Coverage by Age in Millersville borough
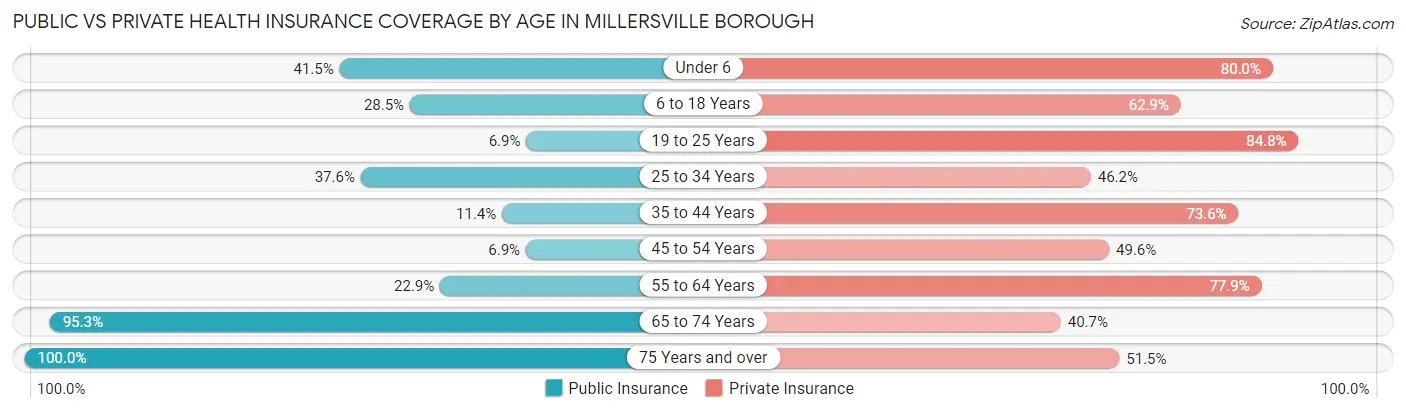
| Age Bracket | Public Insurance | Private Insurance |
| Under 6 | 81 (41.5%) | 156 (80.0%) |
| 6 to 18 Years | 371 (28.5%) | 820 (62.9%) |
| 19 to 25 Years | 205 (6.9%) | 2,529 (84.8%) |
| 25 to 34 Years | 179 (37.6%) | 220 (46.2%) |
| 35 to 44 Years | 97 (11.4%) | 628 (73.6%) |
| 45 to 54 Years | 46 (6.9%) | 329 (49.6%) |
| 55 to 64 Years | 208 (22.9%) | 708 (77.9%) |
| 65 to 74 Years | 469 (95.3%) | 200 (40.6%) |
| 75 Years and over | 526 (100.0%) | 271 (51.5%) |
| Total | 2,182 (26.0%) | 5,861 (69.8%) |
Disability Status by Sex by Age in Millersville borough
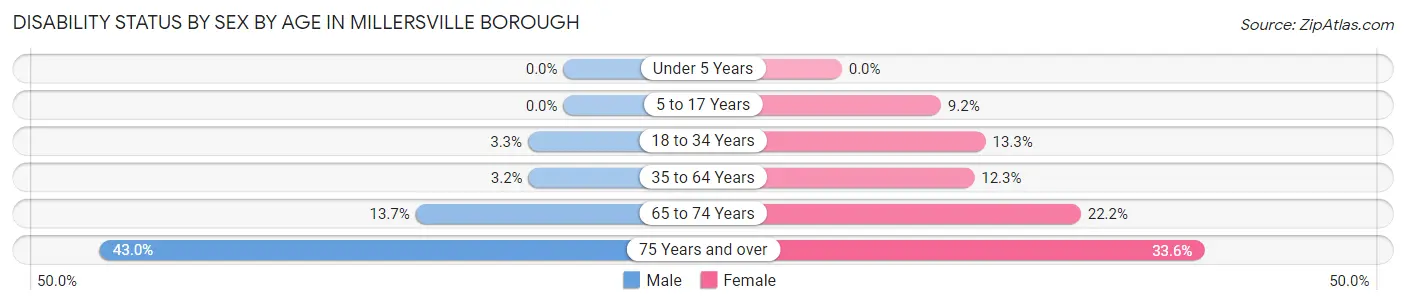
| Age Bracket | Male | Female |
| Under 5 Years | 0 (0.0%) | 0 (0.0%) |
| 5 to 17 Years | 0 (0.0%) | 56 (9.2%) |
| 18 to 34 Years | 53 (3.3%) | 299 (13.3%) |
| 35 to 64 Years | 42 (3.2%) | 139 (12.3%) |
| 65 to 74 Years | 31 (13.7%) | 59 (22.2%) |
| 75 Years and over | 83 (43.0%) | 112 (33.6%) |
Disability Class by Sex by Age in Millersville borough
Disability Class: Hearing Difficulty
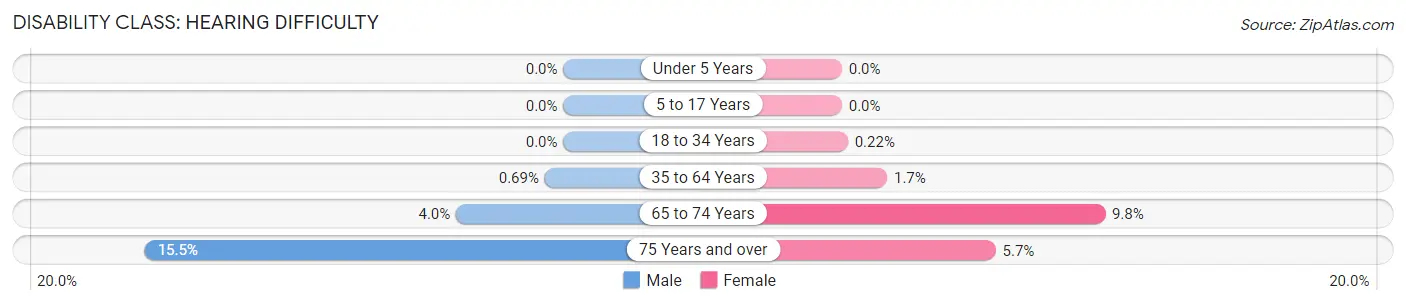
| Age Bracket | Male | Female |
| Under 5 Years | 0 (0.0%) | 0 (0.0%) |
| 5 to 17 Years | 0 (0.0%) | 0 (0.0%) |
| 18 to 34 Years | 0 (0.0%) | 5 (0.2%) |
| 35 to 64 Years | 9 (0.7%) | 19 (1.7%) |
| 65 to 74 Years | 9 (4.0%) | 26 (9.8%) |
| 75 Years and over | 30 (15.5%) | 19 (5.7%) |
Disability Class: Vision Difficulty
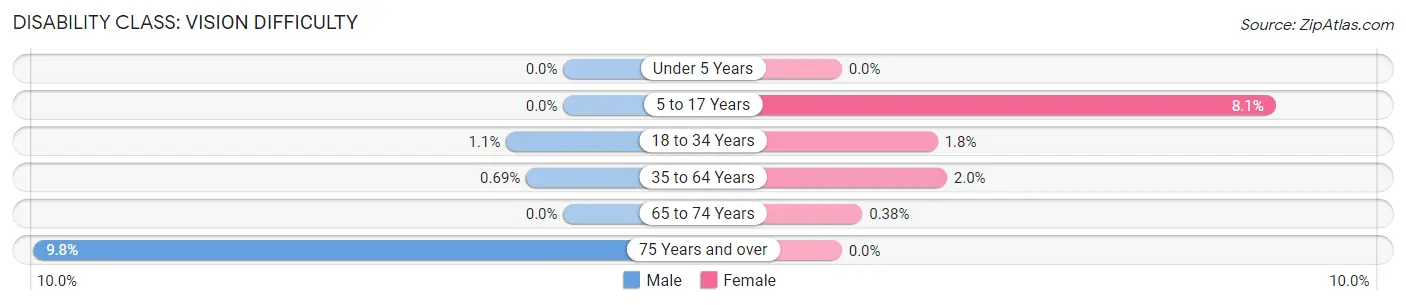
| Age Bracket | Male | Female |
| Under 5 Years | 0 (0.0%) | 0 (0.0%) |
| 5 to 17 Years | 0 (0.0%) | 49 (8.1%) |
| 18 to 34 Years | 17 (1.1%) | 40 (1.8%) |
| 35 to 64 Years | 9 (0.7%) | 22 (1.9%) |
| 65 to 74 Years | 0 (0.0%) | 1 (0.4%) |
| 75 Years and over | 19 (9.8%) | 0 (0.0%) |
Disability Class: Cognitive Difficulty
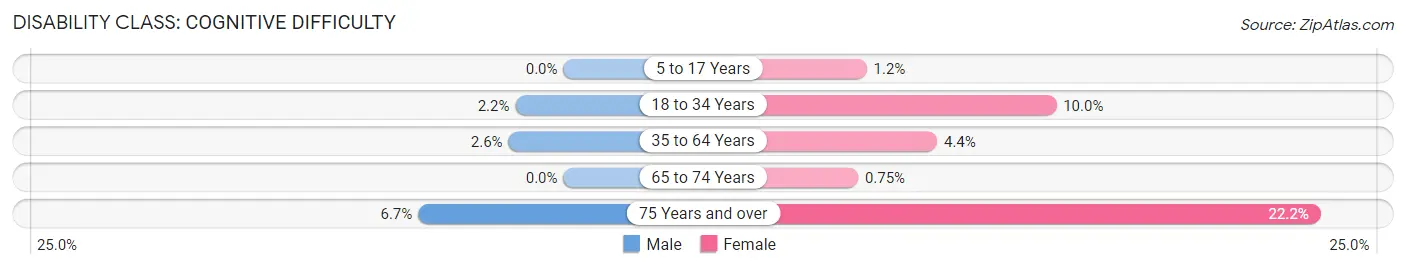
| Age Bracket | Male | Female |
| 5 to 17 Years | 0 (0.0%) | 7 (1.1%) |
| 18 to 34 Years | 36 (2.2%) | 223 (10.0%) |
| 35 to 64 Years | 33 (2.5%) | 50 (4.4%) |
| 65 to 74 Years | 0 (0.0%) | 2 (0.7%) |
| 75 Years and over | 13 (6.7%) | 74 (22.2%) |
Disability Class: Ambulatory Difficulty
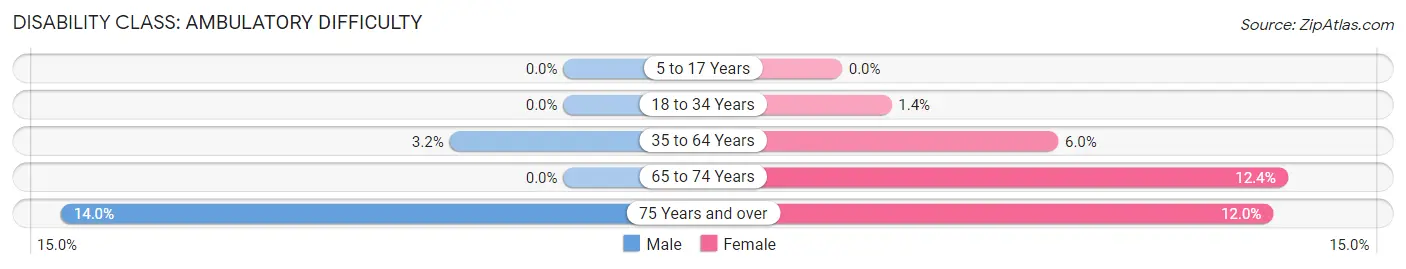
| Age Bracket | Male | Female |
| 5 to 17 Years | 0 (0.0%) | 0 (0.0%) |
| 18 to 34 Years | 0 (0.0%) | 31 (1.4%) |
| 35 to 64 Years | 41 (3.2%) | 68 (6.0%) |
| 65 to 74 Years | 0 (0.0%) | 33 (12.4%) |
| 75 Years and over | 27 (14.0%) | 40 (12.0%) |
Disability Class: Self-Care Difficulty
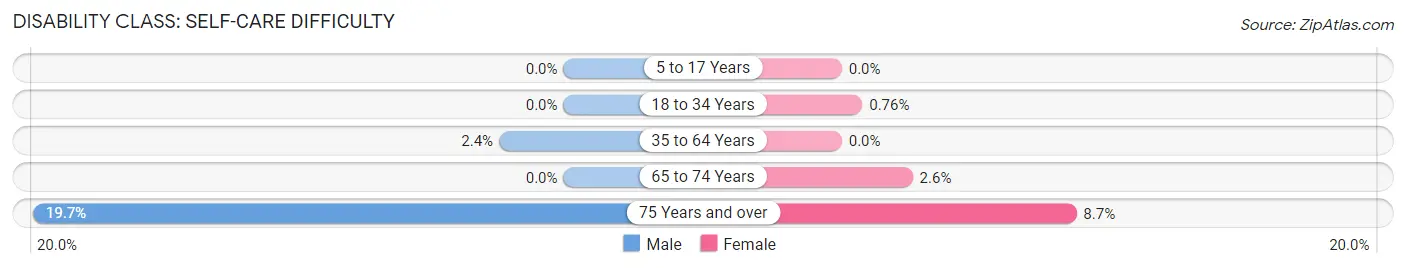
| Age Bracket | Male | Female |
| 5 to 17 Years | 0 (0.0%) | 0 (0.0%) |
| 18 to 34 Years | 0 (0.0%) | 17 (0.8%) |
| 35 to 64 Years | 31 (2.4%) | 0 (0.0%) |
| 65 to 74 Years | 0 (0.0%) | 7 (2.6%) |
| 75 Years and over | 38 (19.7%) | 29 (8.7%) |
Technology Access in Millersville borough
Computing Device Access in Millersville borough
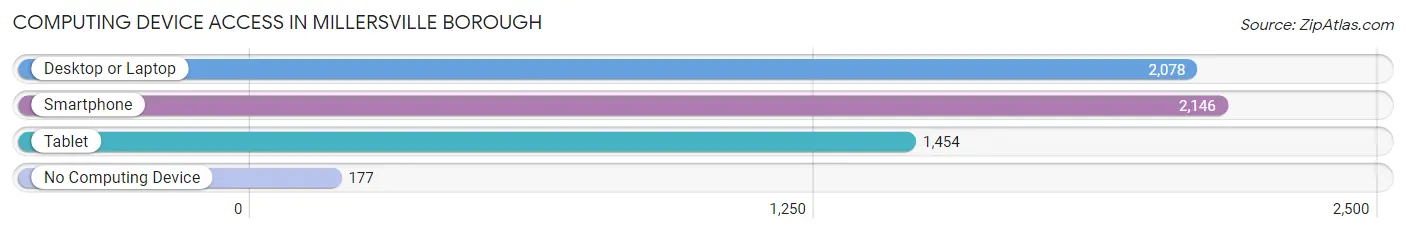
| Device Type | # Households | % Households |
| Desktop or Laptop | 2,078 | 83.0% |
| Smartphone | 2,146 | 85.7% |
| Tablet | 1,454 | 58.1% |
| No Computing Device | 177 | 7.1% |
| Total | 2,503 | 100.0% |
Internet Access in Millersville borough
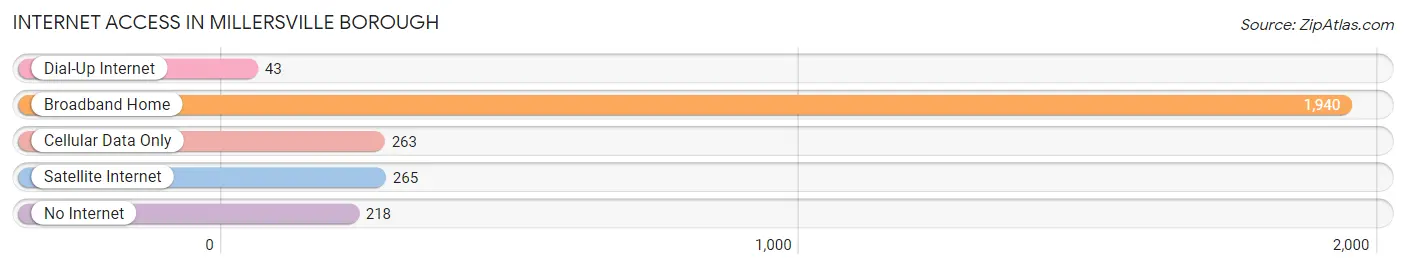
| Internet Type | # Households | % Households |
| Dial-Up Internet | 43 | 1.7% |
| Broadband Home | 1,940 | 77.5% |
| Cellular Data Only | 263 | 10.5% |
| Satellite Internet | 265 | 10.6% |
| No Internet | 218 | 8.7% |
| Total | 2,503 | 100.0% |
Millersville borough Summary
Millerville Borough is a borough located in Lancaster County, Pennsylvania. It is located in the southeastern part of the county, about 10 miles east of the city of Lancaster. The population of Millerville Borough was 2,845 at the 2010 census.
History
Millerville Borough was founded in 1854 by a group of German immigrants who had settled in the area. The town was named after the Miller family, who were among the first settlers. The town was originally a farming community, but in the late 19th century, it began to develop into a small industrial center. The first industry in the area was a sawmill, which was built in 1876. This was followed by a grist mill, a brickyard, and a tannery.
In the early 20th century, Millerville Borough became a popular tourist destination. The town was known for its scenic beauty, and it was a popular spot for fishing and hunting. The town also had a number of hotels and inns, which attracted visitors from all over the region.
In the 1950s, Millerville Borough began to experience a decline in its industrial base. The sawmill and grist mill closed, and the brickyard and tannery were sold. The town began to focus more on tourism, and it became a popular destination for weekend getaways.
Geography
Millerville Borough is located in southeastern Lancaster County, about 10 miles east of the city of Lancaster. The borough is bordered to the north by East Lampeter Township, to the east by West Lampeter Township, to the south by Conestoga Township, and to the west by East Earl Township. The borough is located in the Conestoga Valley, and it is surrounded by rolling hills and farmland.
The borough covers an area of 1.2 square miles, all of which is land. The borough is located in the Conestoga River watershed, and the Conestoga River runs through the borough.
Economy
The economy of Millerville Borough is largely based on tourism. The borough is a popular destination for weekend getaways, and it is home to a number of hotels and inns. The borough also has a number of restaurants, shops, and other businesses that cater to tourists.
The borough also has a number of small businesses, including a hardware store, a grocery store, and a pharmacy. The borough is also home to a number of manufacturing companies, including a furniture manufacturer and a printing company.
Demographics
As of the 2010 census, there were 2,845 people living in Millerville Borough. The racial makeup of the borough was 95.3% White, 1.2% African American, 0.3% Native American, 0.7% Asian, 0.1% Pacific Islander, 0.9% from other races, and 1.6% from two or more races. Hispanic or Latino of any race were 2.2% of the population.
The median household income in Millerville Borough was $50,938, and the median family income was $60,938. The per capita income for the borough was $25,938. About 6.3% of families and 8.2% of the population were below the poverty line, including 10.2% of those under age 18 and 5.2% of those age 65 or over.
Common Questions
What is Per Capita Income in Millersville borough?
Per Capita income in Millersville borough is $24,952.
What is the Median Family Income in Millersville borough?
Median Family Income in Millersville borough is $86,469.
What is the Median Household income in Millersville borough?
Median Household Income in Millersville borough is $65,804.
What is Income or Wage Gap in Millersville borough?
Income or Wage Gap in Millersville borough is 39.7%.
Women in Millersville borough earn 60.3 cents for every dollar earned by a man.
What is Inequality or Gini Index in Millersville borough?
Inequality or Gini Index in Millersville borough is 0.43.
What is the Total Population of Millersville borough?
Total Population of Millersville borough is 8,426.
What is the Total Male Population of Millersville borough?
Total Male Population of Millersville borough is 3,772.
What is the Total Female Population of Millersville borough?
Total Female Population of Millersville borough is 4,654.
What is the Ratio of Males per 100 Females in Millersville borough?
There are 81.05 Males per 100 Females in Millersville borough.
What is the Ratio of Females per 100 Males in Millersville borough?
There are 123.38 Females per 100 Males in Millersville borough.
What is the Median Population Age in Millersville borough?
Median Population Age in Millersville borough is 23.3 Years.
What is the Average Family Size in Millersville borough
Average Family Size in Millersville borough is 3.1 People.
What is the Average Household Size in Millersville borough
Average Household Size in Millersville borough is 2.7 People.
How Large is the Labor Force in Millersville borough?
There are 4,340 People in the Labor Forcein in Millersville borough.
What is the Percentage of People in the Labor Force in Millersville borough?
57.8% of People are in the Labor Force in Millersville borough.
What is the Unemployment Rate in Millersville borough?
Unemployment Rate in Millersville borough is 4.1%.