Connellsville, PA Map & Demographics
Connellsville Map
Connellsville Overview
$32,992
PER CAPITA INCOME
$72,611
AVG FAMILY INCOME
$51,943
AVG HOUSEHOLD INCOME
37.7%
WAGE / INCOME GAP [ % ]
62.3¢/ $1
WAGE / INCOME GAP [ $ ]
0.52
INEQUALITY / GINI INDEX
7,004
TOTAL POPULATION
3,625
MALE POPULATION
3,379
FEMALE POPULATION
107.28
MALES / 100 FEMALES
93.21
FEMALES / 100 MALES
41.2
MEDIAN AGE
2.7
AVG FAMILY SIZE
2.1
AVG HOUSEHOLD SIZE
3,446
LABOR FORCE [ PEOPLE ]
59.1%
PERCENT IN LABOR FORCE
7.3%
UNEMPLOYMENT RATE
Connellsville Zip Codes
Connellsville Area Codes
Income in Connellsville
Income Overview in Connellsville
Per Capita Income in Connellsville is $32,992, while median incomes of families and households are $72,611 and $51,943 respectively.
| Characteristic | Number | Measure |
| Per Capita Income | 7,004 | $32,992 |
| Median Family Income | 2,004 | $72,611 |
| Mean Family Income | 2,004 | $92,923 |
| Median Household Income | 3,293 | $51,943 |
| Mean Household Income | 3,293 | $71,836 |
| Income Deficit | 2,004 | $0 |
| Wage / Income Gap (%) | 7,004 | 37.68% |
| Wage / Income Gap ($) | 7,004 | 62.32¢ per $1 |
| Gini / Inequality Index | 7,004 | 0.52 |
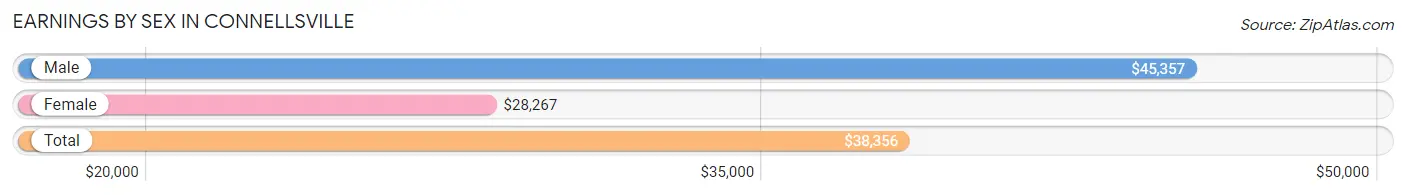
Earnings by Sex in Connellsville
Average Earnings in Connellsville are $38,356, $45,357 for men and $28,267 for women, a difference of 37.7%.
| Sex | Number | Average Earnings |
| Male | 1,864 (53.2%) | $45,357 |
| Female | 1,641 (46.8%) | $28,267 |
| Total | 3,505 (100.0%) | $38,356 |
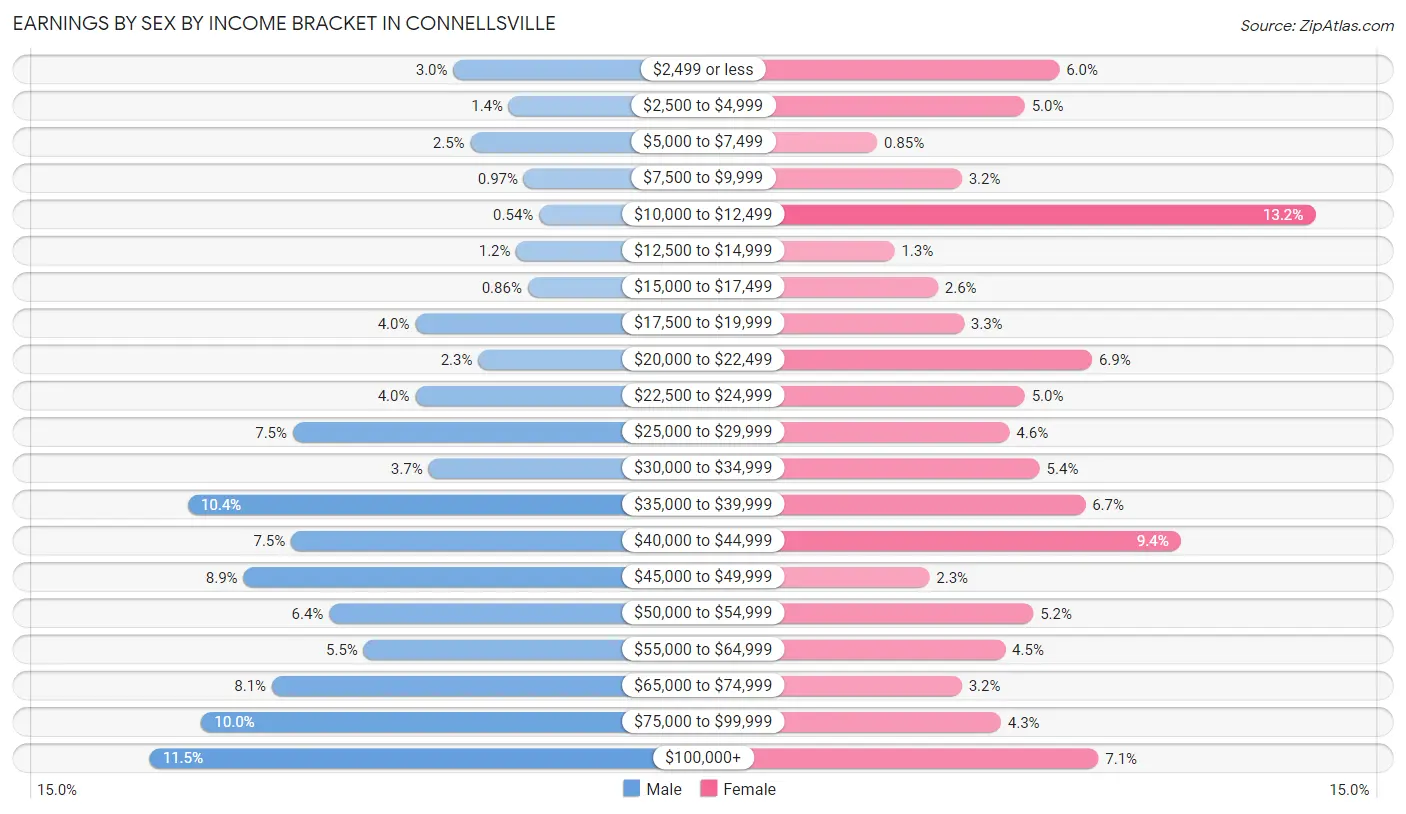
Earnings by Sex by Income Bracket in Connellsville
The most common earnings brackets in Connellsville are $100,000+ for men (214 | 11.5%) and $10,000 to $12,499 for women (216 | 13.2%).
| Income | Male | Female |
| $2,499 or less | 55 (2.9%) | 98 (6.0%) |
| $2,500 to $4,999 | 26 (1.4%) | 82 (5.0%) |
| $5,000 to $7,499 | 46 (2.5%) | 14 (0.9%) |
| $7,500 to $9,999 | 18 (1.0%) | 53 (3.2%) |
| $10,000 to $12,499 | 10 (0.5%) | 216 (13.2%) |
| $12,500 to $14,999 | 22 (1.2%) | 22 (1.3%) |
| $15,000 to $17,499 | 16 (0.9%) | 42 (2.6%) |
| $17,500 to $19,999 | 75 (4.0%) | 54 (3.3%) |
| $20,000 to $22,499 | 42 (2.2%) | 113 (6.9%) |
| $22,500 to $24,999 | 75 (4.0%) | 82 (5.0%) |
| $25,000 to $29,999 | 139 (7.5%) | 75 (4.6%) |
| $30,000 to $34,999 | 68 (3.6%) | 89 (5.4%) |
| $35,000 to $39,999 | 194 (10.4%) | 110 (6.7%) |
| $40,000 to $44,999 | 140 (7.5%) | 154 (9.4%) |
| $45,000 to $49,999 | 165 (8.8%) | 38 (2.3%) |
| $50,000 to $54,999 | 120 (6.4%) | 86 (5.2%) |
| $55,000 to $64,999 | 102 (5.5%) | 73 (4.4%) |
| $65,000 to $74,999 | 150 (8.1%) | 53 (3.2%) |
| $75,000 to $99,999 | 187 (10.0%) | 71 (4.3%) |
| $100,000+ | 214 (11.5%) | 116 (7.1%) |
| Total | 1,864 (100.0%) | 1,641 (100.0%) |
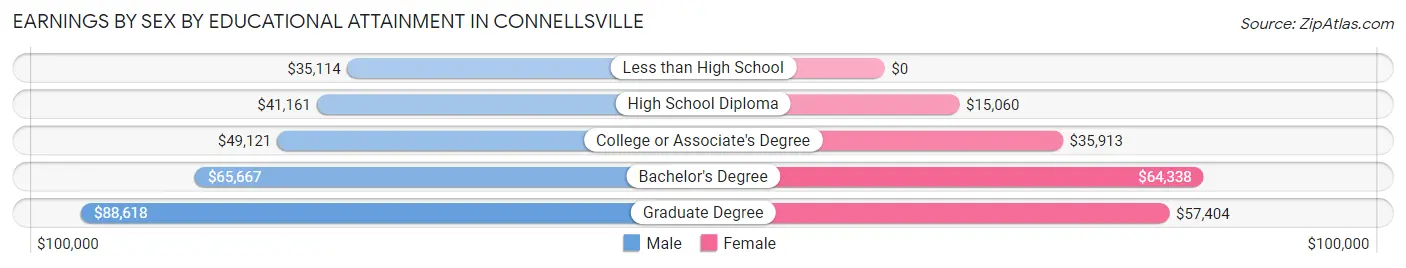
Earnings by Sex by Educational Attainment in Connellsville
Average earnings in Connellsville are $49,512 for men and $35,431 for women, a difference of 28.4%. Men with an educational attainment of graduate degree enjoy the highest average annual earnings of $88,618, while those with less than high school education earn the least with $35,114. Women with an educational attainment of bachelor's degree earn the most with the average annual earnings of $64,338, while those with high school diploma education have the smallest earnings of $15,060.
| Educational Attainment | Male Income | Female Income |
| Less than High School | $35,114 | $0 |
| High School Diploma | $41,161 | $15,060 |
| College or Associate's Degree | $49,121 | $35,913 |
| Bachelor's Degree | $65,667 | $64,338 |
| Graduate Degree | $88,618 | $57,404 |
| Total | $49,512 | $35,431 |
Family Income in Connellsville
Family Income Brackets in Connellsville
According to the Connellsville family income data, there are 515 families falling into the $50,000 to $74,999 income range, which is the most common income bracket and makes up 25.7% of all families. Conversely, the less than $10,000 income bracket is the least frequent group with only 34 families (1.7%) belonging to this category.
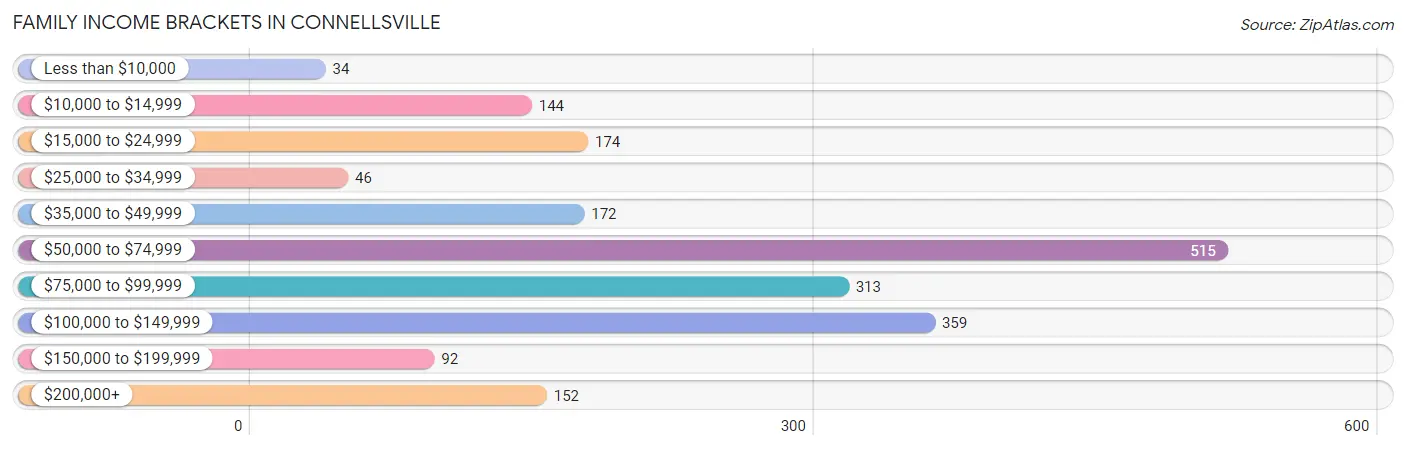
| Income Bracket | # Families | % Families |
| Less than $10,000 | 34 | 1.7% |
| $10,000 to $14,999 | 144 | 7.2% |
| $15,000 to $24,999 | 174 | 8.7% |
| $25,000 to $34,999 | 46 | 2.3% |
| $35,000 to $49,999 | 172 | 8.6% |
| $50,000 to $74,999 | 515 | 25.7% |
| $75,000 to $99,999 | 313 | 15.6% |
| $100,000 to $149,999 | 359 | 17.9% |
| $150,000 to $199,999 | 92 | 4.6% |
| $200,000+ | 152 | 7.6% |
Family Income by Famaliy Size in Connellsville
4-person families (455 | 22.7%) account for the highest median family income in Connellsville with $108,074 per family, while 2-person families (916 | 45.7%) have the highest median income of $27,500 per family member.
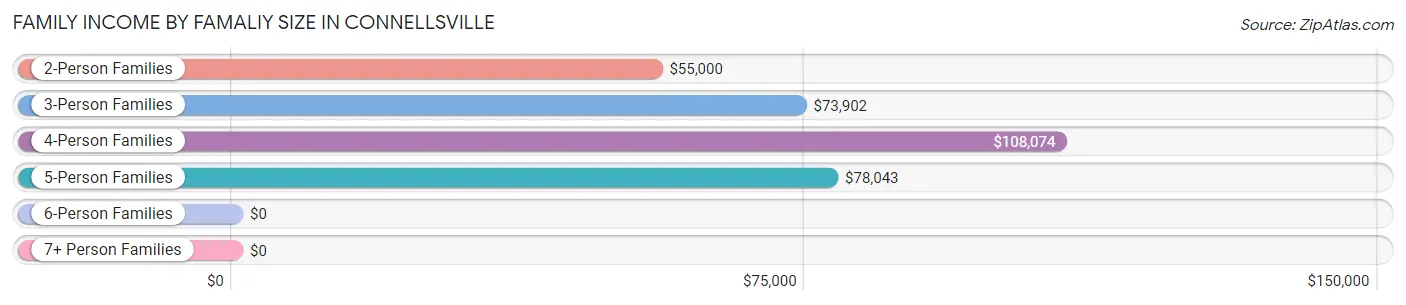
| Income Bracket | # Families | Median Income |
| 2-Person Families | 916 (45.7%) | $55,000 |
| 3-Person Families | 501 (25.0%) | $73,902 |
| 4-Person Families | 455 (22.7%) | $108,074 |
| 5-Person Families | 114 (5.7%) | $78,043 |
| 6-Person Families | 18 (0.9%) | $0 |
| 7+ Person Families | 0 (0.0%) | $0 |
| Total | 2,004 (100.0%) | $72,611 |
Family Income by Number of Earners in Connellsville
The median family income in Connellsville is $72,611, with families comprising 2 earners (767) having the highest median family income of $97,596, while families with no earners (274) have the lowest median family income of $22,310, accounting for 38.3% and 13.7% of families, respectively.
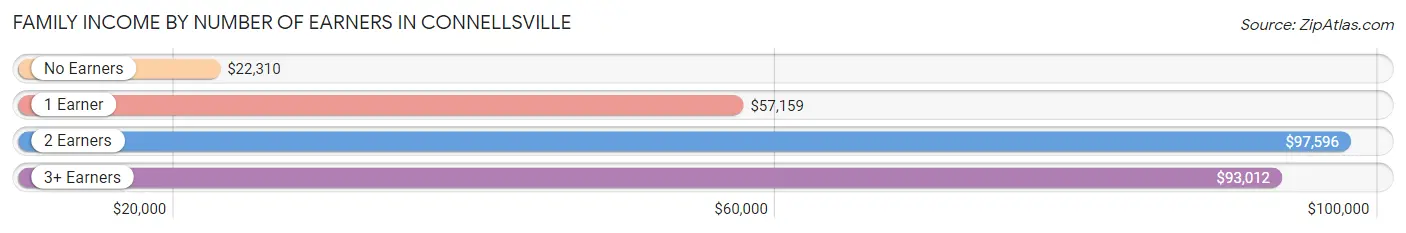
| Number of Earners | # Families | Median Income |
| No Earners | 274 (13.7%) | $22,310 |
| 1 Earner | 714 (35.6%) | $57,159 |
| 2 Earners | 767 (38.3%) | $97,596 |
| 3+ Earners | 249 (12.4%) | $93,012 |
| Total | 2,004 (100.0%) | $72,611 |
Household Income in Connellsville
Household Income Brackets in Connellsville
With 731 households falling in the category, the $50,000 to $74,999 income range is the most frequent in Connellsville, accounting for 22.2% of all households. In contrast, only 102 households (3.1%) fall into the $150,000 to $199,999 income bracket, making it the least populous group.
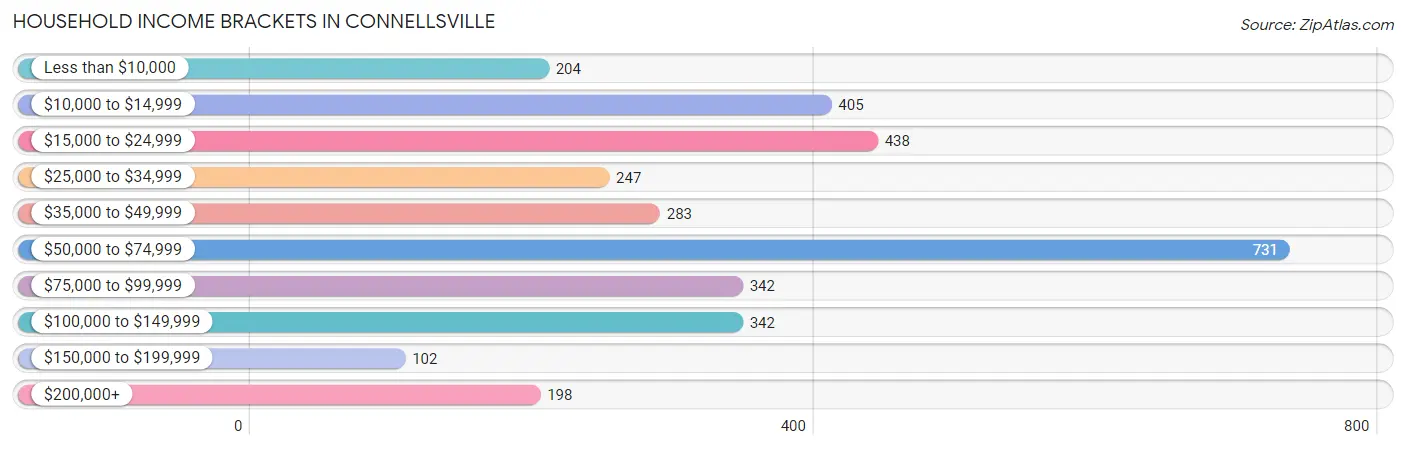
| Income Bracket | # Households | % Households |
| Less than $10,000 | 204 | 6.2% |
| $10,000 to $14,999 | 405 | 12.3% |
| $15,000 to $24,999 | 438 | 13.3% |
| $25,000 to $34,999 | 247 | 7.5% |
| $35,000 to $49,999 | 283 | 8.6% |
| $50,000 to $74,999 | 731 | 22.2% |
| $75,000 to $99,999 | 342 | 10.4% |
| $100,000 to $149,999 | 342 | 10.4% |
| $150,000 to $199,999 | 102 | 3.1% |
| $200,000+ | 198 | 6.0% |
Household Income by Householder Age in Connellsville
The median household income in Connellsville is $51,943, with the highest median household income of $62,872 found in the 15 to 24 years age bracket for the primary householder. A total of 166 households (5.0%) fall into this category. Meanwhile, the 65+ years age bracket for the primary householder has the lowest median household income of $30,368, with 1,091 households (33.1%) in this group.
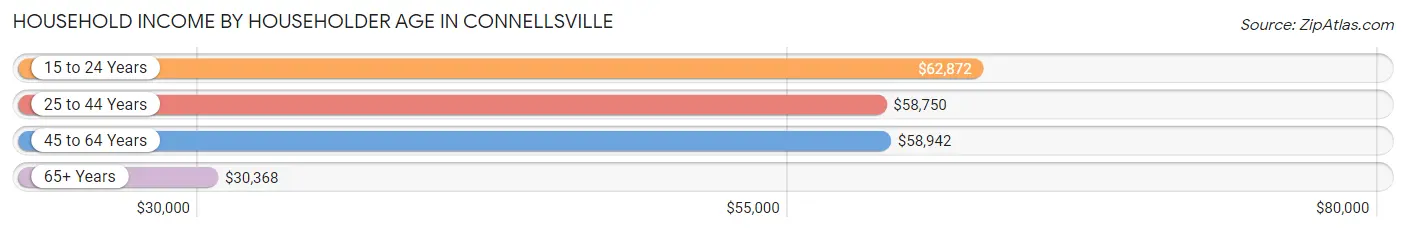
| Income Bracket | # Households | Median Income |
| 15 to 24 Years | 166 (5.0%) | $62,872 |
| 25 to 44 Years | 869 (26.4%) | $58,750 |
| 45 to 64 Years | 1,167 (35.4%) | $58,942 |
| 65+ Years | 1,091 (33.1%) | $30,368 |
| Total | 3,293 (100.0%) | $51,943 |
Poverty in Connellsville
Income Below Poverty by Sex and Age in Connellsville
With 12.4% poverty level for males and 20.2% for females among the residents of Connellsville, 5 year old males and 16 and 17 year old females are the most vulnerable to poverty, with 12 males (100.0%) and 15 females (75.0%) in their respective age groups living below the poverty level.
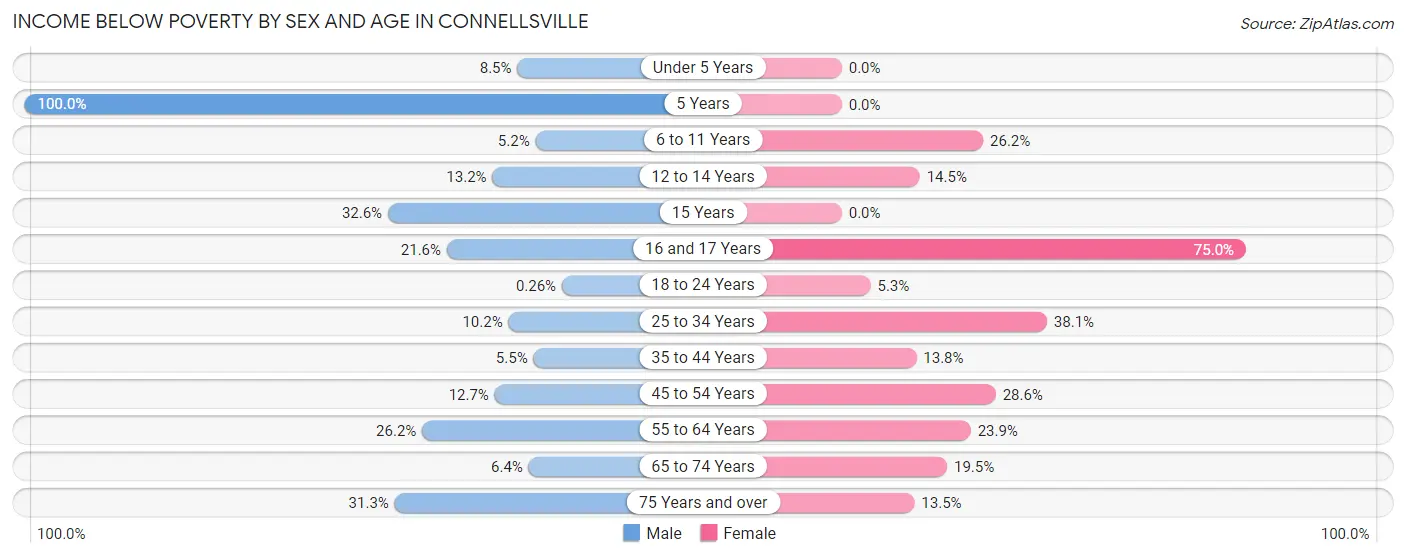
| Age Bracket | Male | Female |
| Under 5 Years | 21 (8.5%) | 0 (0.0%) |
| 5 Years | 12 (100.0%) | 0 (0.0%) |
| 6 to 11 Years | 12 (5.2%) | 32 (26.2%) |
| 12 to 14 Years | 22 (13.2%) | 23 (14.5%) |
| 15 Years | 14 (32.6%) | 0 (0.0%) |
| 16 and 17 Years | 32 (21.6%) | 15 (75.0%) |
| 18 to 24 Years | 1 (0.3%) | 17 (5.3%) |
| 25 to 34 Years | 46 (10.2%) | 166 (38.1%) |
| 35 to 44 Years | 24 (5.5%) | 53 (13.8%) |
| 45 to 54 Years | 66 (12.7%) | 112 (28.6%) |
| 55 to 64 Years | 114 (26.2%) | 106 (23.9%) |
| 65 to 74 Years | 22 (6.4%) | 107 (19.5%) |
| 75 Years and over | 62 (31.3%) | 50 (13.5%) |
| Total | 448 (12.4%) | 681 (20.2%) |
Income Above Poverty by Sex and Age in Connellsville
According to the poverty statistics in Connellsville, males aged 18 to 24 years and females aged under 5 years are the age groups that are most secure financially, with 99.7% of males and 100.0% of females in these age groups living above the poverty line.
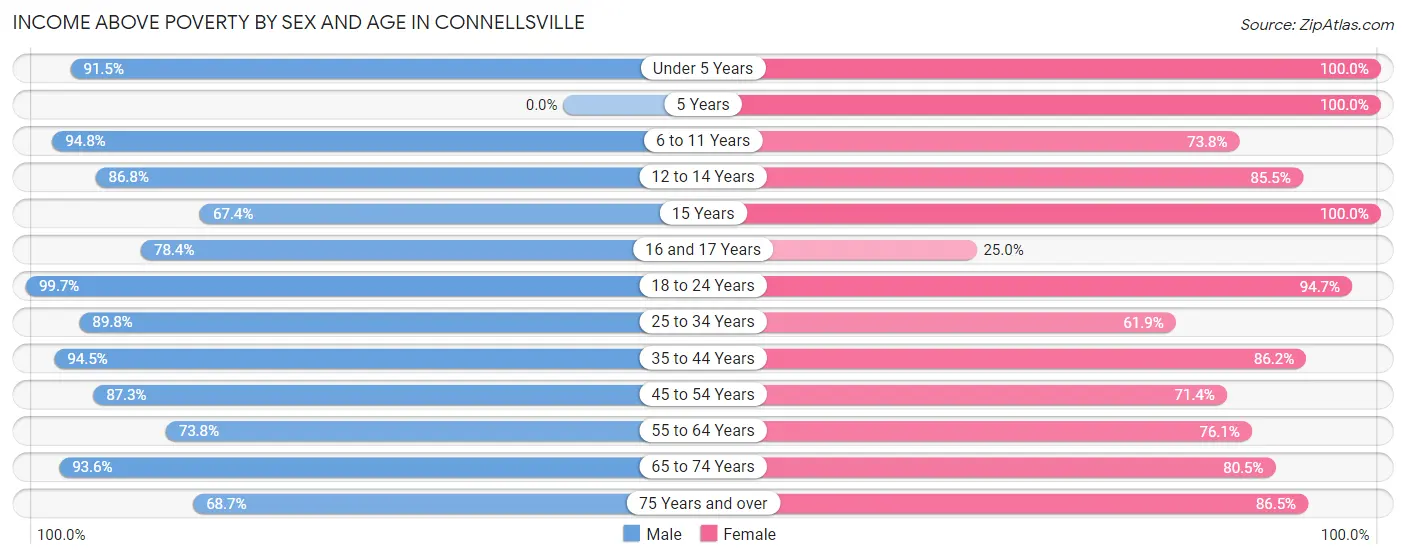
| Age Bracket | Male | Female |
| Under 5 Years | 225 (91.5%) | 147 (100.0%) |
| 5 Years | 0 (0.0%) | 18 (100.0%) |
| 6 to 11 Years | 220 (94.8%) | 90 (73.8%) |
| 12 to 14 Years | 145 (86.8%) | 136 (85.5%) |
| 15 Years | 29 (67.4%) | 15 (100.0%) |
| 16 and 17 Years | 116 (78.4%) | 5 (25.0%) |
| 18 to 24 Years | 386 (99.7%) | 302 (94.7%) |
| 25 to 34 Years | 406 (89.8%) | 270 (61.9%) |
| 35 to 44 Years | 409 (94.5%) | 330 (86.2%) |
| 45 to 54 Years | 452 (87.3%) | 280 (71.4%) |
| 55 to 64 Years | 321 (73.8%) | 337 (76.1%) |
| 65 to 74 Years | 320 (93.6%) | 441 (80.5%) |
| 75 Years and over | 136 (68.7%) | 321 (86.5%) |
| Total | 3,165 (87.6%) | 2,692 (79.8%) |
Income Below Poverty Among Married-Couple Families in Connellsville
The poverty statistics for married-couple families in Connellsville show that 2.0% or 25 of the total 1,261 families live below the poverty line. Families with no children have the highest poverty rate of 3.1%, comprising of 25 families. On the other hand, families with 1 or 2 children have the lowest poverty rate of 0.0%, which includes 0 families.
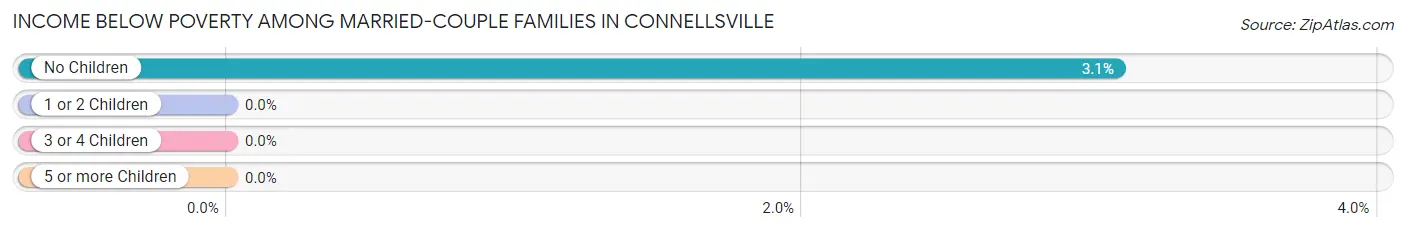
| Children | Above Poverty | Below Poverty |
| No Children | 784 (96.9%) | 25 (3.1%) |
| 1 or 2 Children | 412 (100.0%) | 0 (0.0%) |
| 3 or 4 Children | 40 (100.0%) | 0 (0.0%) |
| 5 or more Children | 0 (0.0%) | 0 (0.0%) |
| Total | 1,236 (98.0%) | 25 (2.0%) |
Income Below Poverty Among Single-Parent Households in Connellsville
According to the poverty data in Connellsville, 4.1% or 10 single-father households and 38.8% or 194 single-mother households are living below the poverty line. Among single-father households, those with 1 or 2 children have the highest poverty rate, with 10 households (8.3%) experiencing poverty. Likewise, among single-mother households, those with 3 or 4 children have the highest poverty rate, with 132 households (100.0%) falling below the poverty line.
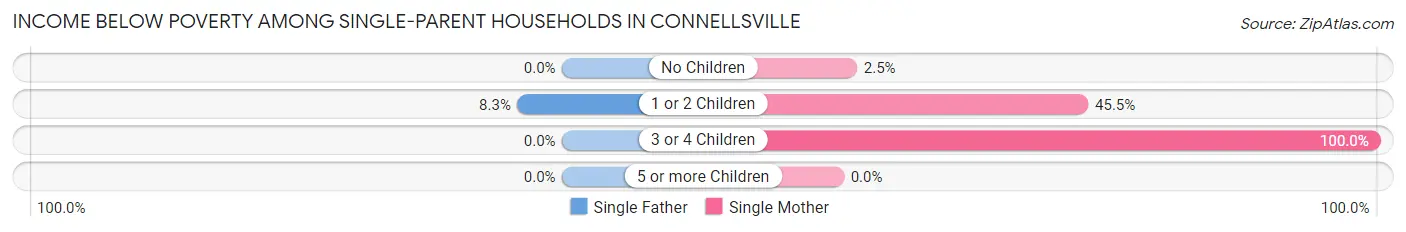
| Children | Single Father | Single Mother |
| No Children | 0 (0.0%) | 6 (2.5%) |
| 1 or 2 Children | 10 (8.3%) | 56 (45.5%) |
| 3 or 4 Children | 0 (0.0%) | 132 (100.0%) |
| 5 or more Children | 0 (0.0%) | 0 (0.0%) |
| Total | 10 (4.1%) | 194 (38.8%) |
Income Below Poverty Among Married-Couple vs Single-Parent Households in Connellsville
The poverty data for Connellsville shows that 25 of the married-couple family households (2.0%) and 204 of the single-parent households (27.5%) are living below the poverty level. Within the married-couple family households, those with no children have the highest poverty rate, with 25 households (3.1%) falling below the poverty line. Among the single-parent households, those with 3 or 4 children have the highest poverty rate, with 132 household (78.1%) living below poverty.
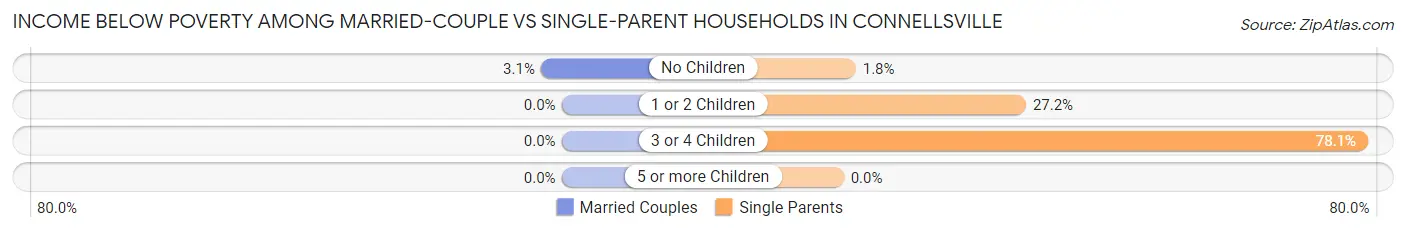
| Children | Married-Couple Families | Single-Parent Households |
| No Children | 25 (3.1%) | 6 (1.8%) |
| 1 or 2 Children | 0 (0.0%) | 66 (27.2%) |
| 3 or 4 Children | 0 (0.0%) | 132 (78.1%) |
| 5 or more Children | 0 (0.0%) | 0 (0.0%) |
| Total | 25 (2.0%) | 204 (27.5%) |
Race in Connellsville
The most populous races in Connellsville are White / Caucasian (6,340 | 90.5%), Two or more Races (431 | 6.1%), and Black / African American (115 | 1.6%).
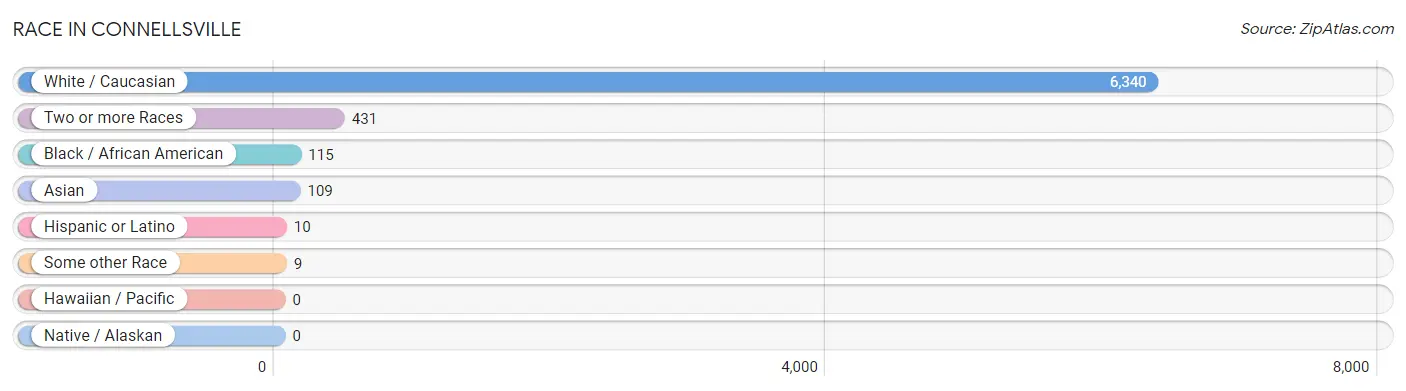
| Race | # Population | % Population |
| Asian | 109 | 1.6% |
| Black / African American | 115 | 1.6% |
| Hawaiian / Pacific | 0 | 0.0% |
| Hispanic or Latino | 10 | 0.1% |
| Native / Alaskan | 0 | 0.0% |
| White / Caucasian | 6,340 | 90.5% |
| Two or more Races | 431 | 6.1% |
| Some other Race | 9 | 0.1% |
| Total | 7,004 | 100.0% |
Ancestry in Connellsville
The most populous ancestries reported in Connellsville are Irish (1,611 | 23.0%), German (1,595 | 22.8%), Italian (1,573 | 22.5%), English (882 | 12.6%), and Polish (523 | 7.5%), together accounting for 88.3% of all Connellsville residents.
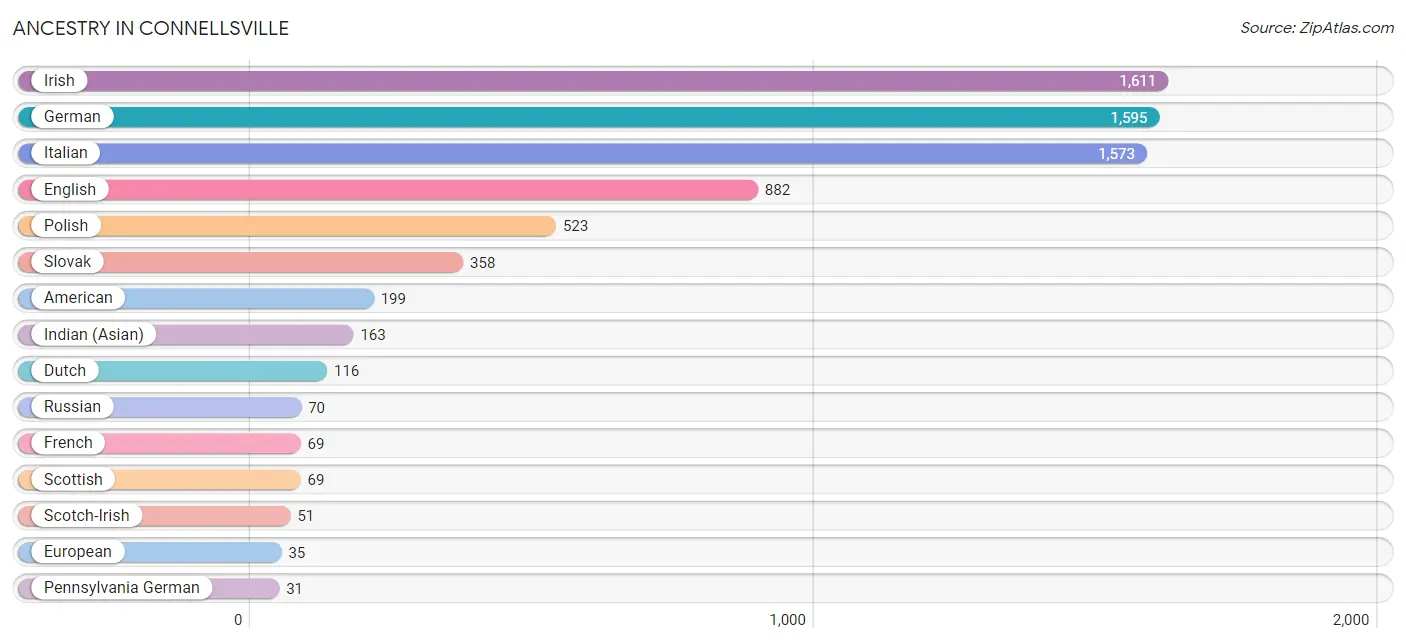
| Ancestry | # Population | % Population |
| American | 199 | 2.8% |
| Austrian | 11 | 0.2% |
| Bhutanese | 14 | 0.2% |
| British | 21 | 0.3% |
| Burmese | 6 | 0.1% |
| Cherokee | 11 | 0.2% |
| Czechoslovakian | 5 | 0.1% |
| Dominican | 1 | 0.0% |
| Dutch | 116 | 1.7% |
| Eastern European | 30 | 0.4% |
| English | 882 | 12.6% |
| European | 35 | 0.5% |
| Finnish | 12 | 0.2% |
| French | 69 | 1.0% |
| French Canadian | 12 | 0.2% |
| German | 1,595 | 22.8% |
| Hungarian | 30 | 0.4% |
| Indian (Asian) | 163 | 2.3% |
| Irish | 1,611 | 23.0% |
| Italian | 1,573 | 22.5% |
| Lithuanian | 13 | 0.2% |
| Mexican | 1 | 0.0% |
| Nigerian | 14 | 0.2% |
| Norwegian | 8 | 0.1% |
| Pennsylvania German | 31 | 0.4% |
| Polish | 523 | 7.5% |
| Russian | 70 | 1.0% |
| Scotch-Irish | 51 | 0.7% |
| Scottish | 69 | 1.0% |
| Slovak | 358 | 5.1% |
| Spaniard | 8 | 0.1% |
| Subsaharan African | 14 | 0.2% |
| Swedish | 14 | 0.2% |
| Swiss | 2 | 0.0% |
| Welsh | 17 | 0.2% | View All 35 Rows |
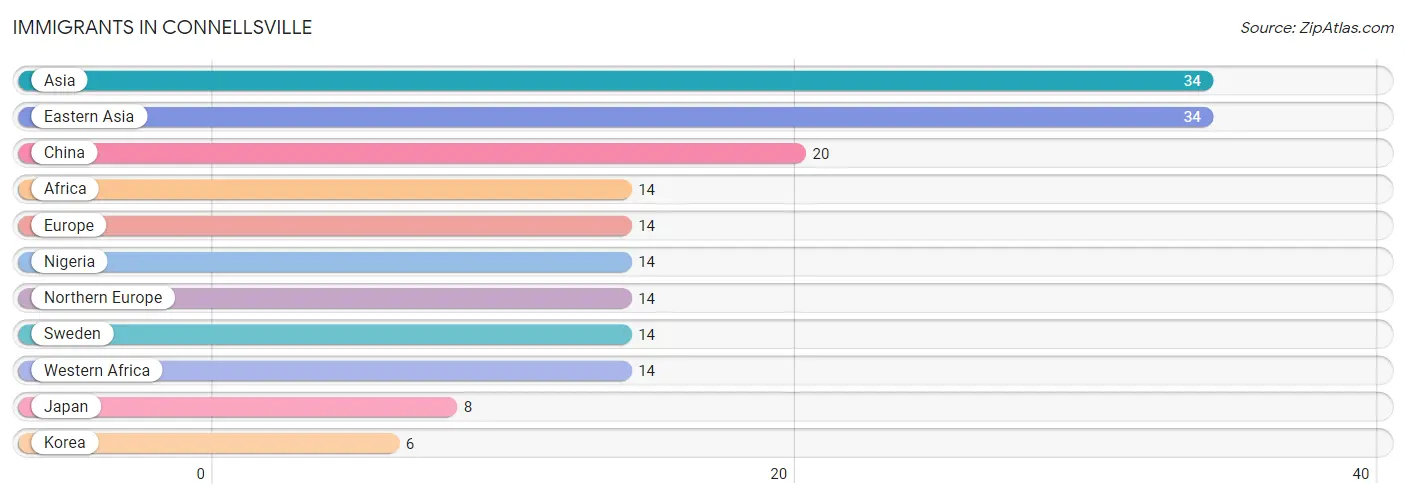
Immigrants in Connellsville
The most numerous immigrant groups reported in Connellsville came from Asia (34 | 0.5%), Eastern Asia (34 | 0.5%), China (20 | 0.3%), Africa (14 | 0.2%), and Europe (14 | 0.2%), together accounting for 1.7% of all Connellsville residents.
| Immigration Origin | # Population | % Population |
| Africa | 14 | 0.2% |
| Asia | 34 | 0.5% |
| China | 20 | 0.3% |
| Eastern Asia | 34 | 0.5% |
| Europe | 14 | 0.2% |
| Japan | 8 | 0.1% |
| Korea | 6 | 0.1% |
| Nigeria | 14 | 0.2% |
| Northern Europe | 14 | 0.2% |
| Sweden | 14 | 0.2% |
| Western Africa | 14 | 0.2% | View All 11 Rows |
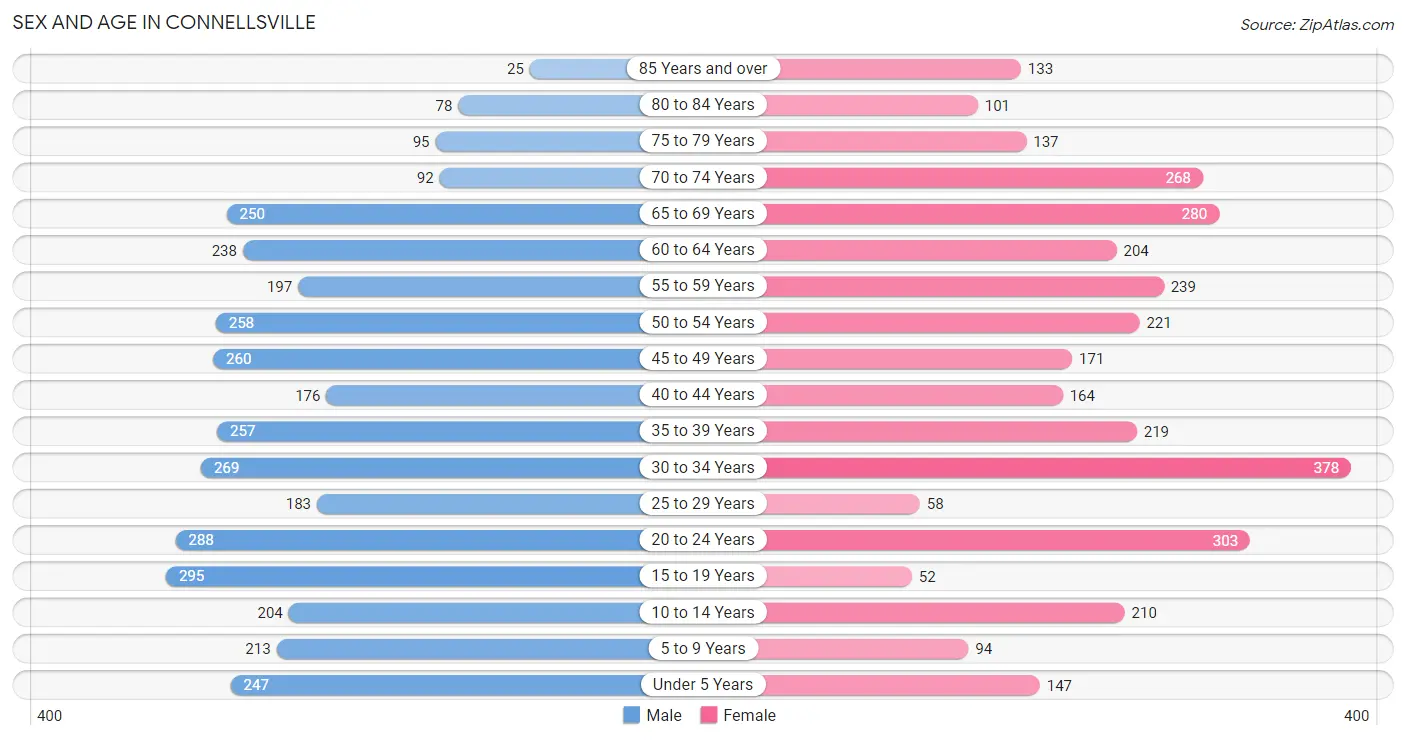
Sex and Age in Connellsville
Sex and Age in Connellsville
The most populous age groups in Connellsville are 15 to 19 Years (295 | 8.1%) for men and 30 to 34 Years (378 | 11.2%) for women.
| Age Bracket | Male | Female |
| Under 5 Years | 247 (6.8%) | 147 (4.3%) |
| 5 to 9 Years | 213 (5.9%) | 94 (2.8%) |
| 10 to 14 Years | 204 (5.6%) | 210 (6.2%) |
| 15 to 19 Years | 295 (8.1%) | 52 (1.5%) |
| 20 to 24 Years | 288 (7.9%) | 303 (9.0%) |
| 25 to 29 Years | 183 (5.1%) | 58 (1.7%) |
| 30 to 34 Years | 269 (7.4%) | 378 (11.2%) |
| 35 to 39 Years | 257 (7.1%) | 219 (6.5%) |
| 40 to 44 Years | 176 (4.9%) | 164 (4.9%) |
| 45 to 49 Years | 260 (7.2%) | 171 (5.1%) |
| 50 to 54 Years | 258 (7.1%) | 221 (6.5%) |
| 55 to 59 Years | 197 (5.4%) | 239 (7.1%) |
| 60 to 64 Years | 238 (6.6%) | 204 (6.0%) |
| 65 to 69 Years | 250 (6.9%) | 280 (8.3%) |
| 70 to 74 Years | 92 (2.5%) | 268 (7.9%) |
| 75 to 79 Years | 95 (2.6%) | 137 (4.1%) |
| 80 to 84 Years | 78 (2.1%) | 101 (3.0%) |
| 85 Years and over | 25 (0.7%) | 133 (3.9%) |
| Total | 3,625 (100.0%) | 3,379 (100.0%) |
Families and Households in Connellsville
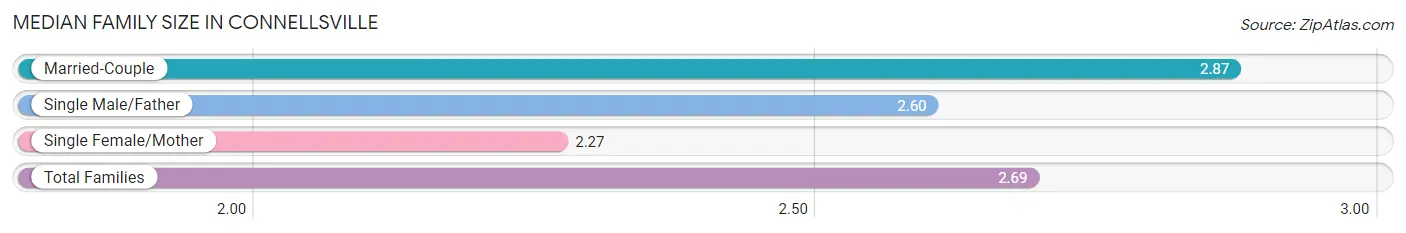
Median Family Size in Connellsville
The median family size in Connellsville is 2.69 persons per family, with married-couple families (1,261 | 62.9%) accounting for the largest median family size of 2.87 persons per family. On the other hand, single female/mother families (500 | 24.9%) represent the smallest median family size with 2.27 persons per family.
| Family Type | # Families | Family Size |
| Married-Couple | 1,261 (62.9%) | 2.87 |
| Single Male/Father | 243 (12.1%) | 2.60 |
| Single Female/Mother | 500 (24.9%) | 2.27 |
| Total Families | 2,004 (100.0%) | 2.69 |
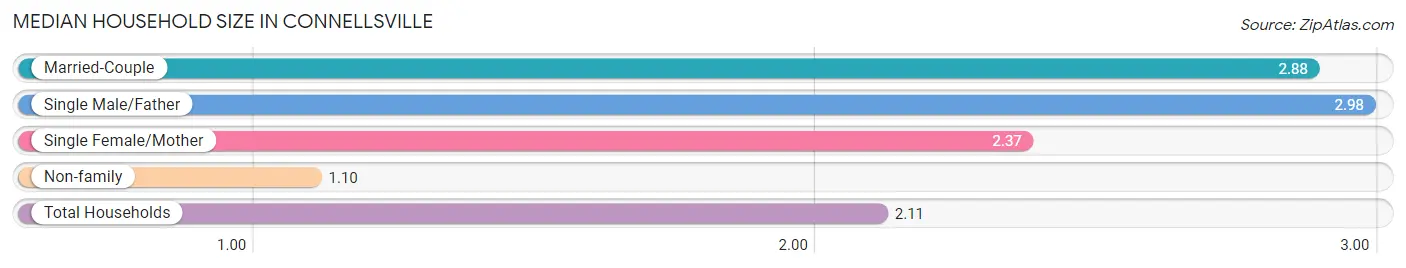
Median Household Size in Connellsville
The median household size in Connellsville is 2.11 persons per household, with single male/father households (243 | 7.4%) accounting for the largest median household size of 2.98 persons per household. non-family households (1,289 | 39.1%) represent the smallest median household size with 1.10 persons per household.
| Household Type | # Households | Household Size |
| Married-Couple | 1,261 (38.3%) | 2.88 |
| Single Male/Father | 243 (7.4%) | 2.98 |
| Single Female/Mother | 500 (15.2%) | 2.37 |
| Non-family | 1,289 (39.1%) | 1.10 |
| Total Households | 3,293 (100.0%) | 2.11 |
Household Size by Marriage Status in Connellsville
Out of a total of 3,293 households in Connellsville, 2,004 (60.9%) are family households, while 1,289 (39.1%) are nonfamily households. The most numerous type of family households are 2-person households, comprising 816, and the most common type of nonfamily households are 1-person households, comprising 1,152.
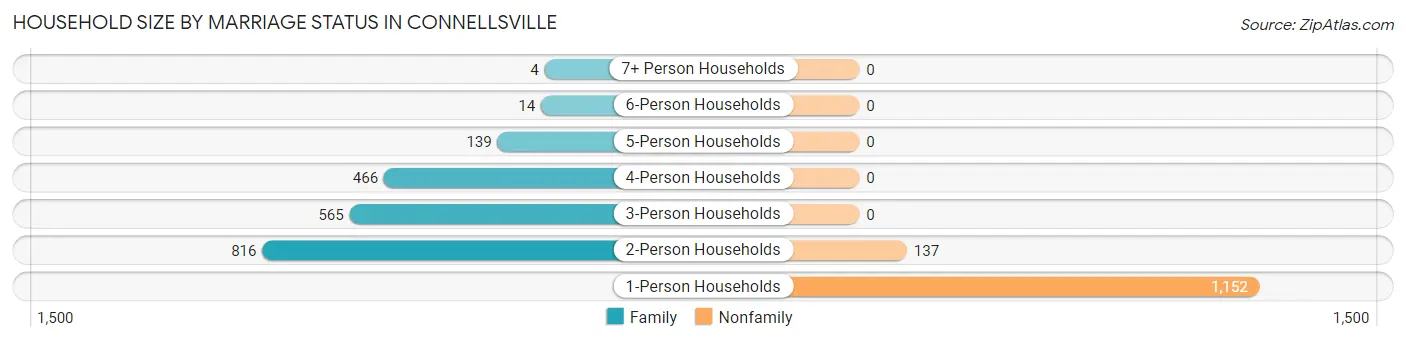
| Household Size | Family Households | Nonfamily Households |
| 1-Person Households | - | 1,152 (35.0%) |
| 2-Person Households | 816 (24.8%) | 137 (4.2%) |
| 3-Person Households | 565 (17.2%) | 0 (0.0%) |
| 4-Person Households | 466 (14.1%) | 0 (0.0%) |
| 5-Person Households | 139 (4.2%) | 0 (0.0%) |
| 6-Person Households | 14 (0.4%) | 0 (0.0%) |
| 7+ Person Households | 4 (0.1%) | 0 (0.0%) |
| Total | 2,004 (60.9%) | 1,289 (39.1%) |
Female Fertility in Connellsville
Fertility by Age in Connellsville
Average fertility rate in Connellsville is 71.0 births per 1,000 women. Women in the age bracket of 20 to 34 years have the highest fertility rate with 135.0 births per 1,000 women. Women in the age bracket of 20 to 34 years acount for 100.0% of all women with births.
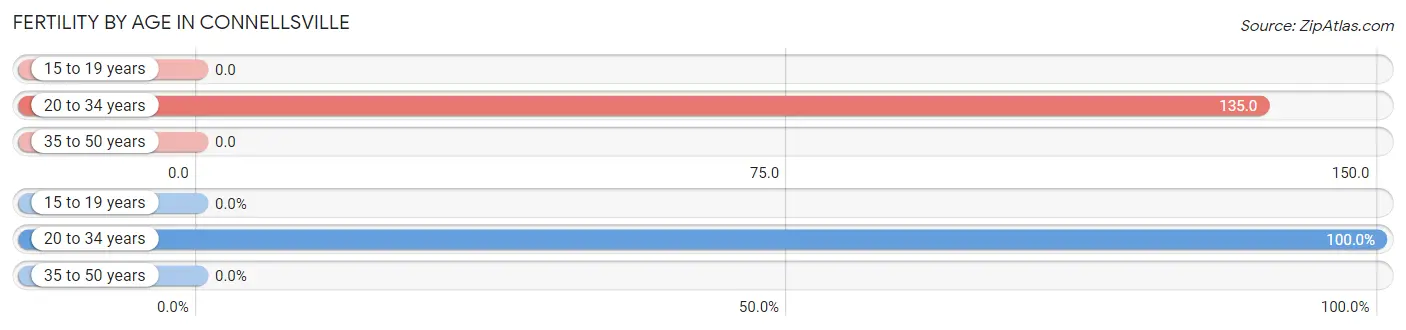
| Age Bracket | Women with Births | Births / 1,000 Women |
| 15 to 19 years | 0 (0.0%) | 0.0 |
| 20 to 34 years | 100 (100.0%) | 135.0 |
| 35 to 50 years | 0 (0.0%) | 0.0 |
| Total | 100 (100.0%) | 71.0 |
Fertility by Age by Marriage Status in Connellsville
61.0% of women with births (100) in Connellsville are married. The highest percentage of unmarried women with births falls into 20 to 34 years age bracket with 39.0% of them unmarried at the time of birth, while the lowest percentage of unmarried women with births belong to 20 to 34 years age bracket with 39.0% of them unmarried.
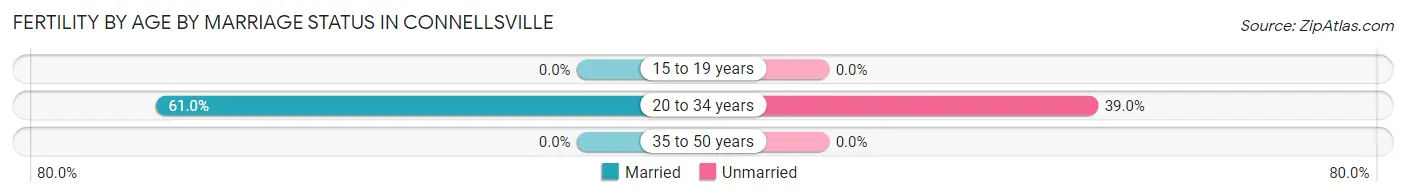
| Age Bracket | Married | Unmarried |
| 15 to 19 years | 0 (0.0%) | 0 (0.0%) |
| 20 to 34 years | 61 (61.0%) | 39 (39.0%) |
| 35 to 50 years | 0 (0.0%) | 0 (0.0%) |
| Total | 61 (61.0%) | 39 (39.0%) |
Fertility by Education in Connellsville
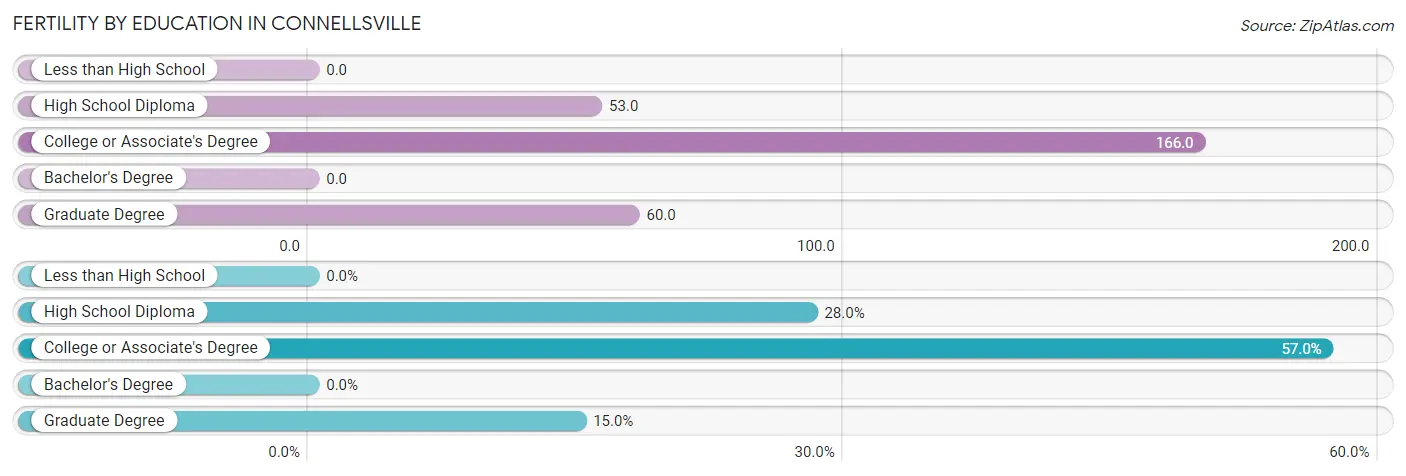
| Educational Attainment | Women with Births | Births / 1,000 Women |
| Less than High School | 0 (0.0%) | 0.0 |
| High School Diploma | 28 (28.0%) | 53.0 |
| College or Associate's Degree | 57 (57.0%) | 166.0 |
| Bachelor's Degree | 0 (0.0%) | 0.0 |
| Graduate Degree | 15 (15.0%) | 60.0 |
| Total | 100 (100.0%) | 71.0 |
Fertility by Education by Marriage Status in Connellsville
39.0% of women with births in Connellsville are unmarried. Women with the educational attainment of graduate degree are most likely to be married with 100.0% of them married at childbirth, while women with the educational attainment of high school diploma are least likely to be married with 100.0% of them unmarried at childbirth.
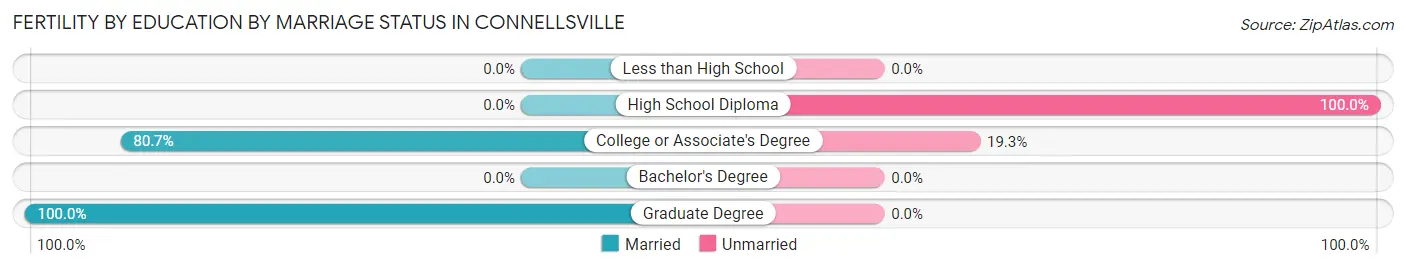
| Educational Attainment | Married | Unmarried |
| Less than High School | 0 (0.0%) | 0 (0.0%) |
| High School Diploma | 0 (0.0%) | 28 (100.0%) |
| College or Associate's Degree | 46 (80.7%) | 11 (19.3%) |
| Bachelor's Degree | 0 (0.0%) | 0 (0.0%) |
| Graduate Degree | 15 (100.0%) | 0 (0.0%) |
| Total | 61 (61.0%) | 39 (39.0%) |
Employment Characteristics in Connellsville
Employment by Class of Employer in Connellsville
Among the 3,164 employed individuals in Connellsville, private company employees (1,998 | 63.1%), not-for-profit organizations (400 | 12.6%), and local government employees (237 | 7.5%) make up the most common classes of employment.
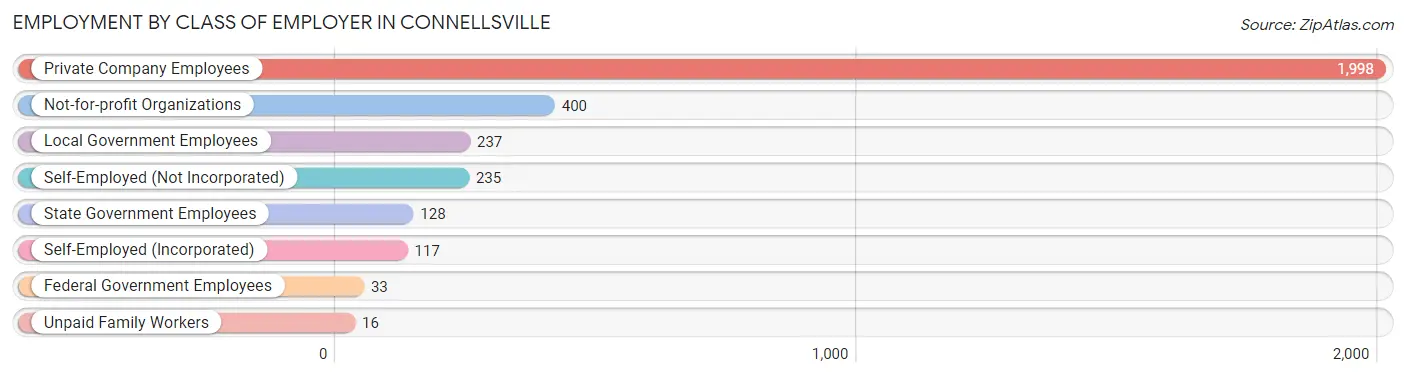
| Employer Class | # Employees | % Employees |
| Private Company Employees | 1,998 | 63.1% |
| Self-Employed (Incorporated) | 117 | 3.7% |
| Self-Employed (Not Incorporated) | 235 | 7.4% |
| Not-for-profit Organizations | 400 | 12.6% |
| Local Government Employees | 237 | 7.5% |
| State Government Employees | 128 | 4.1% |
| Federal Government Employees | 33 | 1.0% |
| Unpaid Family Workers | 16 | 0.5% |
| Total | 3,164 | 100.0% |
Employment Status by Age in Connellsville
According to the labor force statistics for Connellsville, out of the total population over 16 years of age (5,831), 59.1% or 3,446 individuals are in the labor force, with 7.3% or 252 of them unemployed. The age group with the highest labor force participation rate is 30 to 34 years, with 94.6% or 612 individuals in the labor force. Within the labor force, the 16 to 19 years age range has the highest percentage of unemployed individuals, with 38.1% or 48 of them being unemployed.
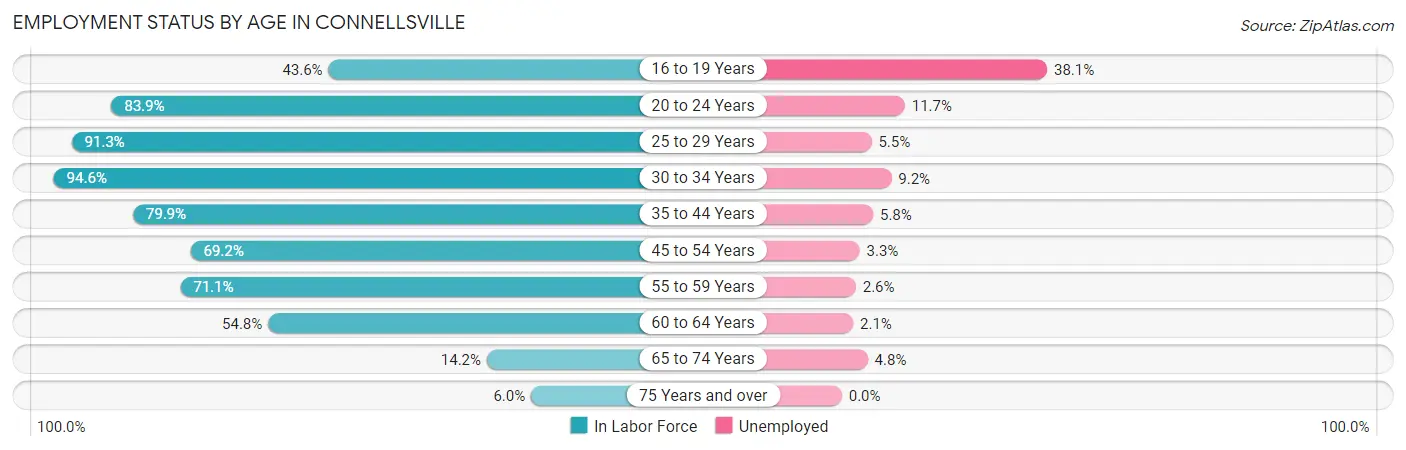
| Age Bracket | In Labor Force | Unemployed |
| 16 to 19 Years | 126 (43.6%) | 48 (38.1%) |
| 20 to 24 Years | 496 (83.9%) | 58 (11.7%) |
| 25 to 29 Years | 220 (91.3%) | 12 (5.5%) |
| 30 to 34 Years | 612 (94.6%) | 56 (9.2%) |
| 35 to 44 Years | 652 (79.9%) | 38 (5.8%) |
| 45 to 54 Years | 630 (69.2%) | 21 (3.3%) |
| 55 to 59 Years | 310 (71.1%) | 8 (2.6%) |
| 60 to 64 Years | 242 (54.8%) | 5 (2.1%) |
| 65 to 74 Years | 126 (14.2%) | 6 (4.8%) |
| 75 Years and over | 34 (6.0%) | 0 (0.0%) |
| Total | 3,446 (59.1%) | 252 (7.3%) |
Employment Status by Educational Attainment in Connellsville
According to labor force statistics for Connellsville, 76.3% of individuals (2,664) out of the total population between 25 and 64 years of age (3,492) are in the labor force, with 5.3% or 141 of them being unemployed. The group with the highest labor force participation rate are those with the educational attainment of bachelor's degree or higher, with 94.3% or 833 individuals in the labor force. Within the labor force, individuals with less than high school education have the highest percentage of unemployment, with 36.6% or 48 of them being unemployed.
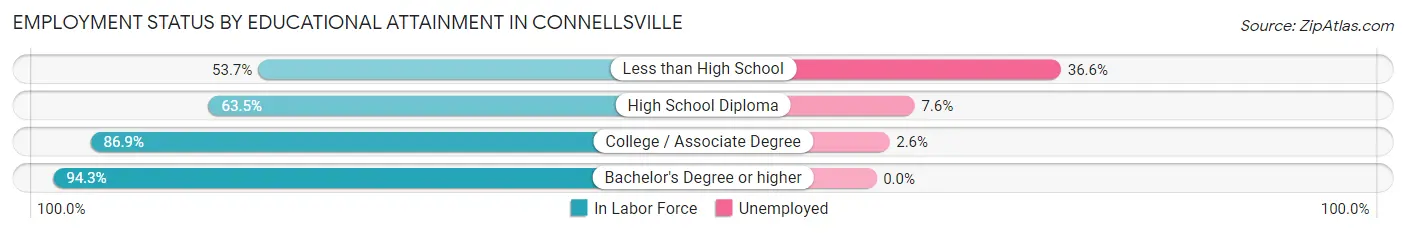
| Educational Attainment | In Labor Force | Unemployed |
| Less than High School | 131 (53.7%) | 89 (36.6%) |
| High School Diploma | 959 (63.5%) | 115 (7.6%) |
| College / Associate Degree | 742 (86.9%) | 22 (2.6%) |
| Bachelor's Degree or higher | 833 (94.3%) | 0 (0.0%) |
| Total | 2,664 (76.3%) | 185 (5.3%) |
Employment Occupations by Sex in Connellsville
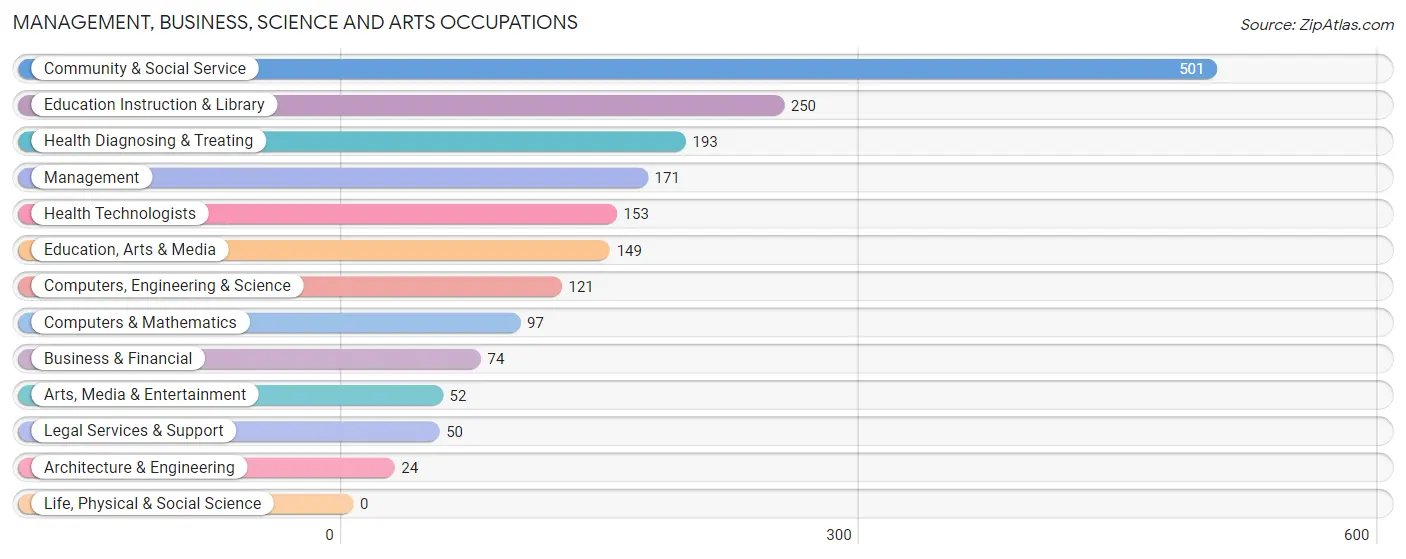
Management, Business, Science and Arts Occupations
The most common Management, Business, Science and Arts occupations in Connellsville are Community & Social Service (501 | 15.7%), Education Instruction & Library (250 | 7.8%), Health Diagnosing & Treating (193 | 6.0%), Management (171 | 5.3%), and Health Technologists (153 | 4.8%).
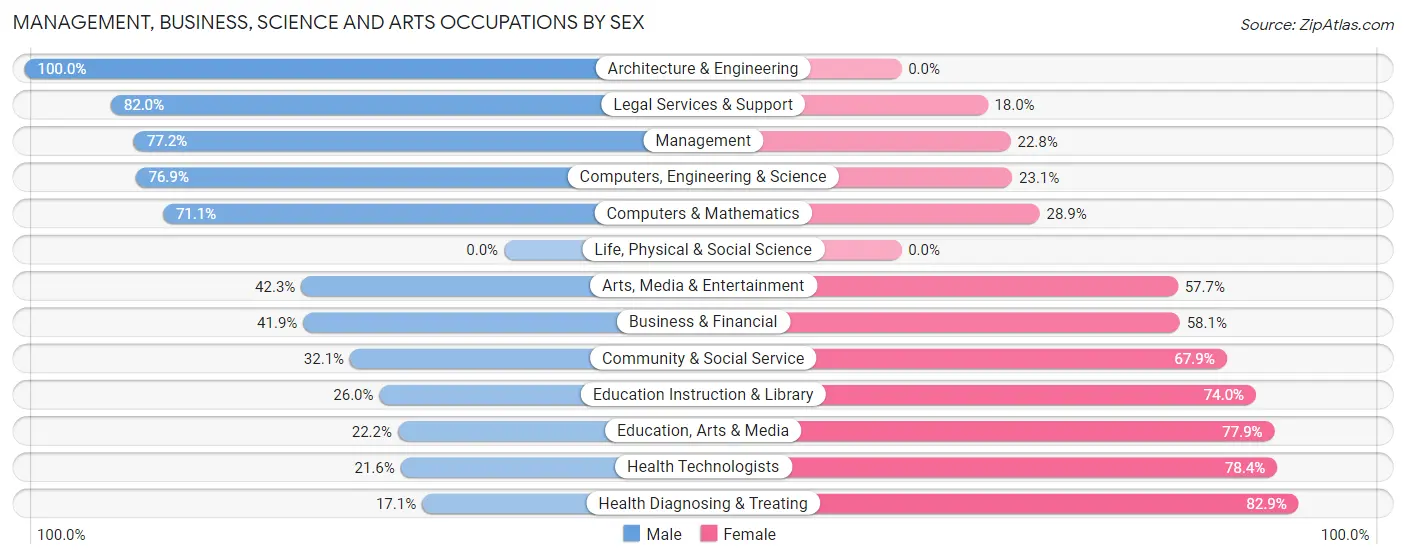
Management, Business, Science and Arts Occupations by Sex
Within the Management, Business, Science and Arts occupations in Connellsville, the most male-oriented occupations are Architecture & Engineering (100.0%), Legal Services & Support (82.0%), and Management (77.2%), while the most female-oriented occupations are Health Diagnosing & Treating (82.9%), Health Technologists (78.4%), and Education, Arts & Media (77.8%).
| Occupation | Male | Female |
| Management | 132 (77.2%) | 39 (22.8%) |
| Business & Financial | 31 (41.9%) | 43 (58.1%) |
| Computers, Engineering & Science | 93 (76.9%) | 28 (23.1%) |
| Computers & Mathematics | 69 (71.1%) | 28 (28.9%) |
| Architecture & Engineering | 24 (100.0%) | 0 (0.0%) |
| Life, Physical & Social Science | 0 (0.0%) | 0 (0.0%) |
| Community & Social Service | 161 (32.1%) | 340 (67.9%) |
| Education, Arts & Media | 33 (22.2%) | 116 (77.8%) |
| Legal Services & Support | 41 (82.0%) | 9 (18.0%) |
| Education Instruction & Library | 65 (26.0%) | 185 (74.0%) |
| Arts, Media & Entertainment | 22 (42.3%) | 30 (57.7%) |
| Health Diagnosing & Treating | 33 (17.1%) | 160 (82.9%) |
| Health Technologists | 33 (21.6%) | 120 (78.4%) |
| Total (Category) | 450 (42.4%) | 610 (57.6%) |
| Total (Overall) | 1,747 (54.7%) | 1,449 (45.3%) |
Services Occupations
The most common Services occupations in Connellsville are Healthcare Support (277 | 8.7%), Food Preparation & Serving (111 | 3.5%), Personal Care & Service (88 | 2.8%), Security & Protection (68 | 2.1%), and Cleaning & Maintenance (61 | 1.9%).

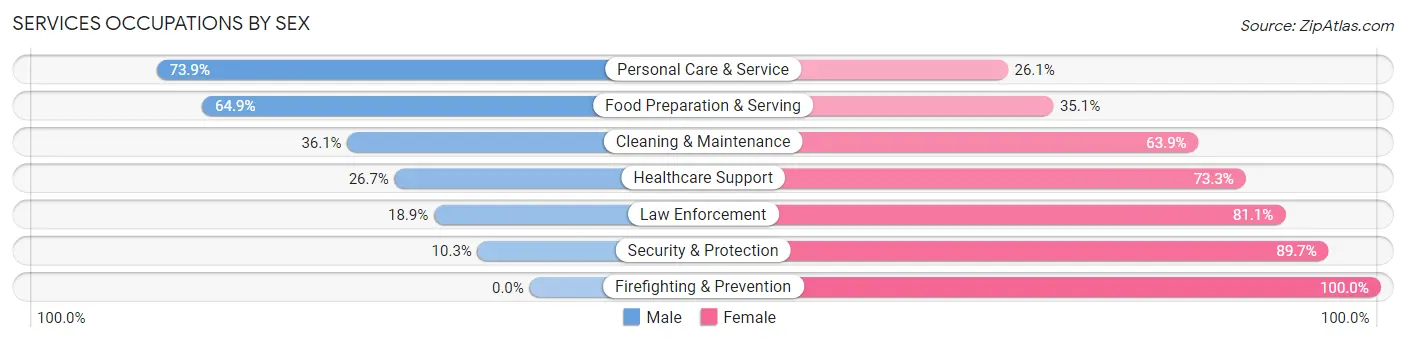
Services Occupations by Sex
Within the Services occupations in Connellsville, the most male-oriented occupations are Personal Care & Service (73.9%), Food Preparation & Serving (64.9%), and Cleaning & Maintenance (36.1%), while the most female-oriented occupations are Firefighting & Prevention (100.0%), Security & Protection (89.7%), and Law Enforcement (81.1%).
| Occupation | Male | Female |
| Healthcare Support | 74 (26.7%) | 203 (73.3%) |
| Security & Protection | 7 (10.3%) | 61 (89.7%) |
| Firefighting & Prevention | 0 (0.0%) | 31 (100.0%) |
| Law Enforcement | 7 (18.9%) | 30 (81.1%) |
| Food Preparation & Serving | 72 (64.9%) | 39 (35.1%) |
| Cleaning & Maintenance | 22 (36.1%) | 39 (63.9%) |
| Personal Care & Service | 65 (73.9%) | 23 (26.1%) |
| Total (Category) | 240 (39.7%) | 365 (60.3%) |
| Total (Overall) | 1,747 (54.7%) | 1,449 (45.3%) |
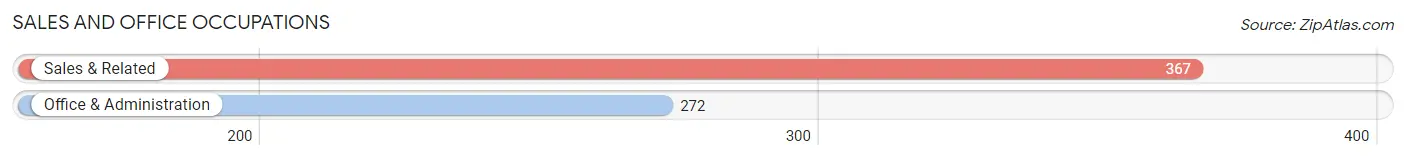
Sales and Office Occupations
The most common Sales and Office occupations in Connellsville are Sales & Related (367 | 11.5%), and Office & Administration (272 | 8.5%).
Sales and Office Occupations by Sex
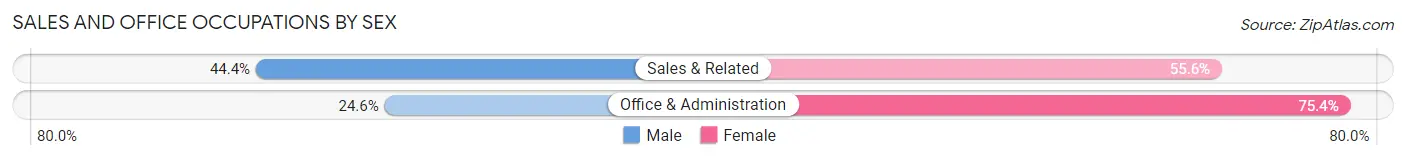
| Occupation | Male | Female |
| Sales & Related | 163 (44.4%) | 204 (55.6%) |
| Office & Administration | 67 (24.6%) | 205 (75.4%) |
| Total (Category) | 230 (36.0%) | 409 (64.0%) |
| Total (Overall) | 1,747 (54.7%) | 1,449 (45.3%) |
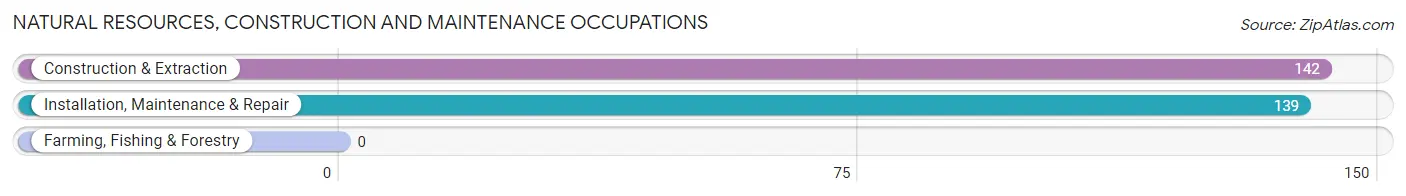
Natural Resources, Construction and Maintenance Occupations
The most common Natural Resources, Construction and Maintenance occupations in Connellsville are Construction & Extraction (142 | 4.4%), and Installation, Maintenance & Repair (139 | 4.3%).
Natural Resources, Construction and Maintenance Occupations by Sex
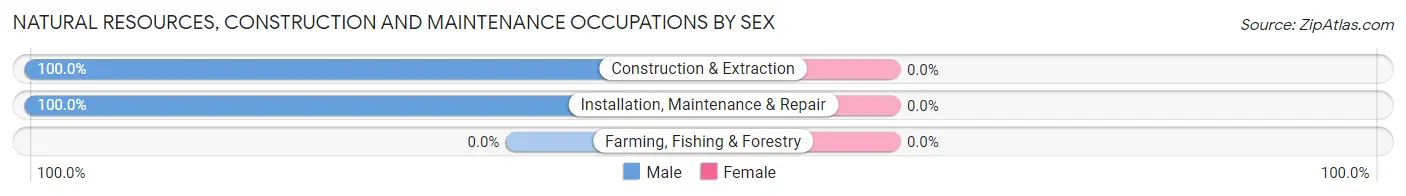
| Occupation | Male | Female |
| Farming, Fishing & Forestry | 0 (0.0%) | 0 (0.0%) |
| Construction & Extraction | 142 (100.0%) | 0 (0.0%) |
| Installation, Maintenance & Repair | 139 (100.0%) | 0 (0.0%) |
| Total (Category) | 281 (100.0%) | 0 (0.0%) |
| Total (Overall) | 1,747 (54.7%) | 1,449 (45.3%) |
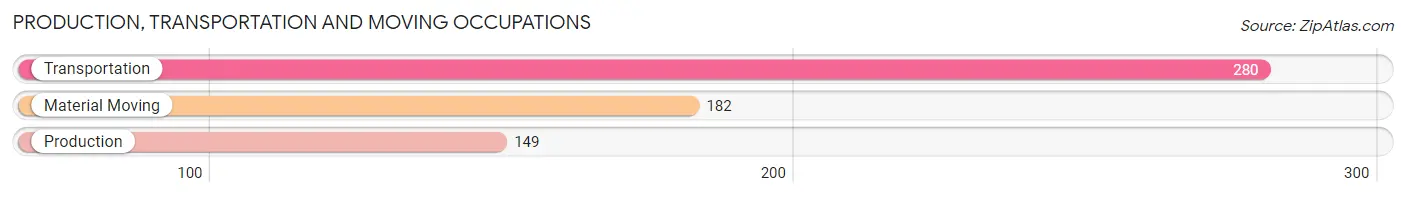
Production, Transportation and Moving Occupations
The most common Production, Transportation and Moving occupations in Connellsville are Transportation (280 | 8.8%), Material Moving (182 | 5.7%), and Production (149 | 4.7%).
Production, Transportation and Moving Occupations by Sex
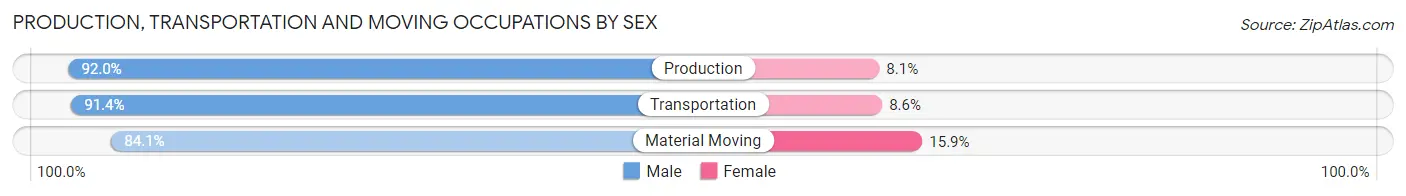
| Occupation | Male | Female |
| Production | 137 (91.9%) | 12 (8.1%) |
| Transportation | 256 (91.4%) | 24 (8.6%) |
| Material Moving | 153 (84.1%) | 29 (15.9%) |
| Total (Category) | 546 (89.4%) | 65 (10.6%) |
| Total (Overall) | 1,747 (54.7%) | 1,449 (45.3%) |
Employment Industries by Sex in Connellsville
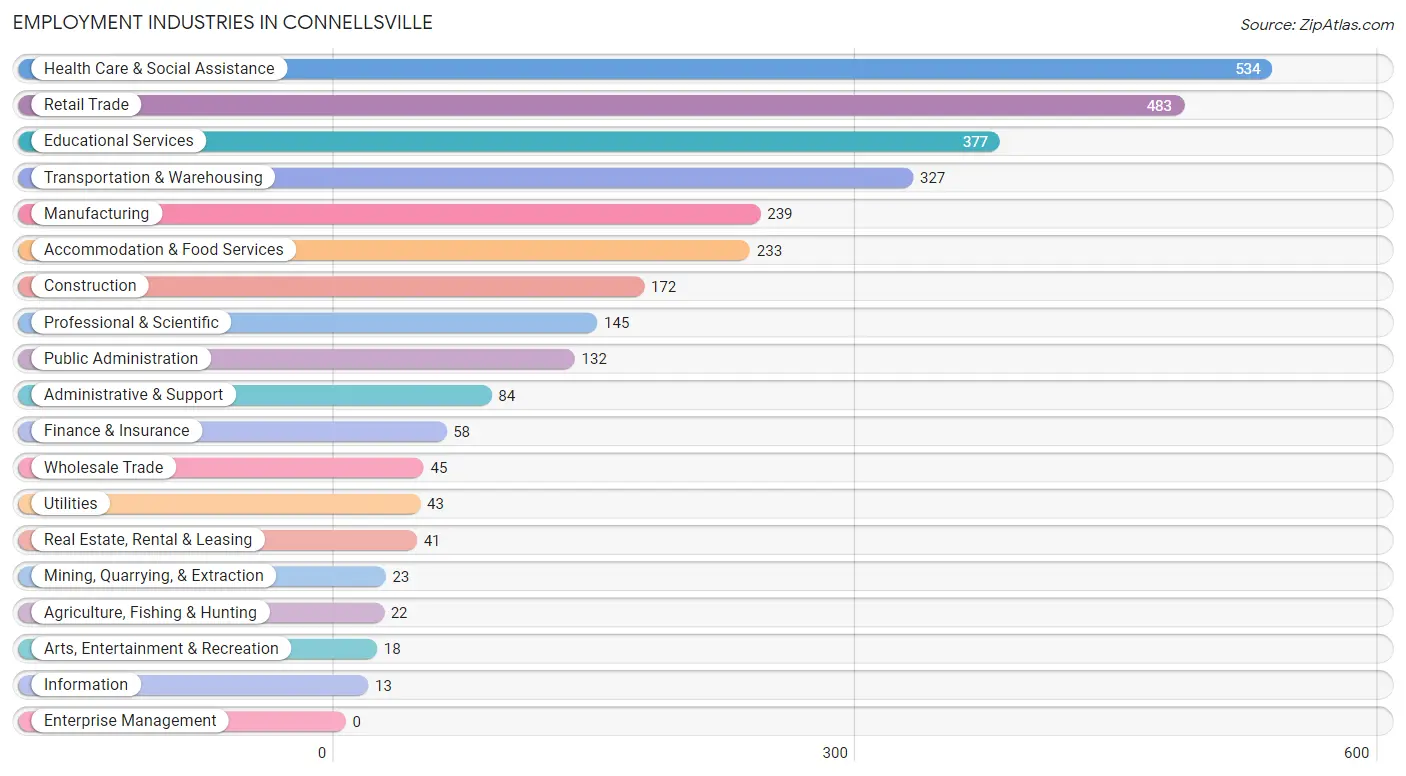
Employment Industries in Connellsville
The major employment industries in Connellsville include Health Care & Social Assistance (534 | 16.7%), Retail Trade (483 | 15.1%), Educational Services (377 | 11.8%), Transportation & Warehousing (327 | 10.2%), and Manufacturing (239 | 7.5%).
Employment Industries by Sex in Connellsville
The Connellsville industries that see more men than women are Agriculture, Fishing & Hunting (100.0%), Mining, Quarrying, & Extraction (100.0%), and Information (100.0%), whereas the industries that tend to have a higher number of women are Real Estate, Rental & Leasing (100.0%), Finance & Insurance (74.1%), and Health Care & Social Assistance (73.4%).
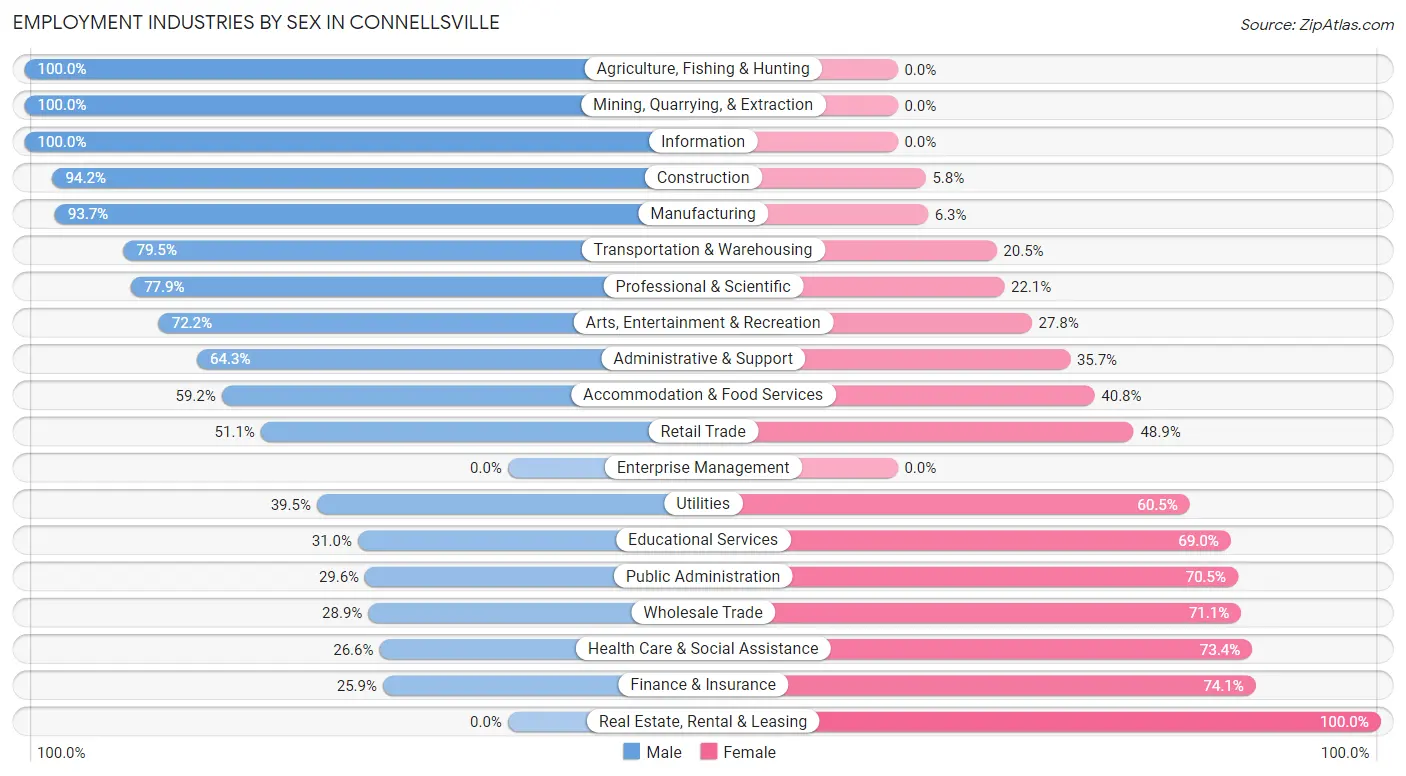
| Industry | Male | Female |
| Agriculture, Fishing & Hunting | 22 (100.0%) | 0 (0.0%) |
| Mining, Quarrying, & Extraction | 23 (100.0%) | 0 (0.0%) |
| Construction | 162 (94.2%) | 10 (5.8%) |
| Manufacturing | 224 (93.7%) | 15 (6.3%) |
| Wholesale Trade | 13 (28.9%) | 32 (71.1%) |
| Retail Trade | 247 (51.1%) | 236 (48.9%) |
| Transportation & Warehousing | 260 (79.5%) | 67 (20.5%) |
| Utilities | 17 (39.5%) | 26 (60.5%) |
| Information | 13 (100.0%) | 0 (0.0%) |
| Finance & Insurance | 15 (25.9%) | 43 (74.1%) |
| Real Estate, Rental & Leasing | 0 (0.0%) | 41 (100.0%) |
| Professional & Scientific | 113 (77.9%) | 32 (22.1%) |
| Enterprise Management | 0 (0.0%) | 0 (0.0%) |
| Administrative & Support | 54 (64.3%) | 30 (35.7%) |
| Educational Services | 117 (31.0%) | 260 (69.0%) |
| Health Care & Social Assistance | 142 (26.6%) | 392 (73.4%) |
| Arts, Entertainment & Recreation | 13 (72.2%) | 5 (27.8%) |
| Accommodation & Food Services | 138 (59.2%) | 95 (40.8%) |
| Public Administration | 39 (29.5%) | 93 (70.5%) |
| Total | 1,747 (54.7%) | 1,449 (45.3%) |
Education in Connellsville
School Enrollment in Connellsville
The most common levels of schooling among the 1,283 students in Connellsville are middle school (357 | 27.8%), high school (315 | 24.5%), and elementary school (302 | 23.5%).
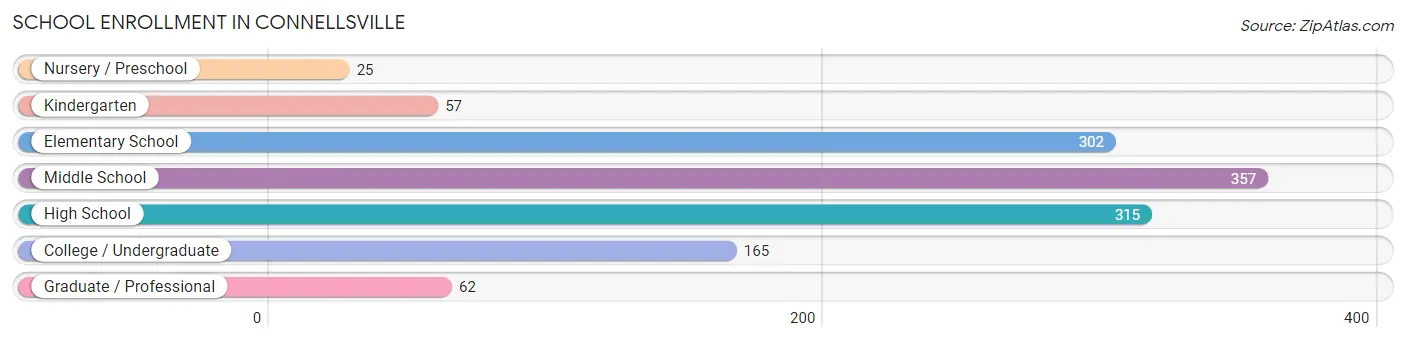
| School Level | # Students | % Students |
| Nursery / Preschool | 25 | 1.9% |
| Kindergarten | 57 | 4.4% |
| Elementary School | 302 | 23.5% |
| Middle School | 357 | 27.8% |
| High School | 315 | 24.5% |
| College / Undergraduate | 165 | 12.9% |
| Graduate / Professional | 62 | 4.8% |
| Total | 1,283 | 100.0% |
School Enrollment by Age by Funding Source in Connellsville
Out of a total of 1,283 students who are enrolled in schools in Connellsville, 204 (15.9%) attend a private institution, while the remaining 1,079 (84.1%) are enrolled in public schools. The age group of 5 to 9 year old has the highest likelihood of being enrolled in private schools, with 100 (33.9% in the age bracket) enrolled. Conversely, the age group of 15 to 17 year olds has the lowest likelihood of being enrolled in a private school, with 229 (100.0% in the age bracket) attending a public institution.
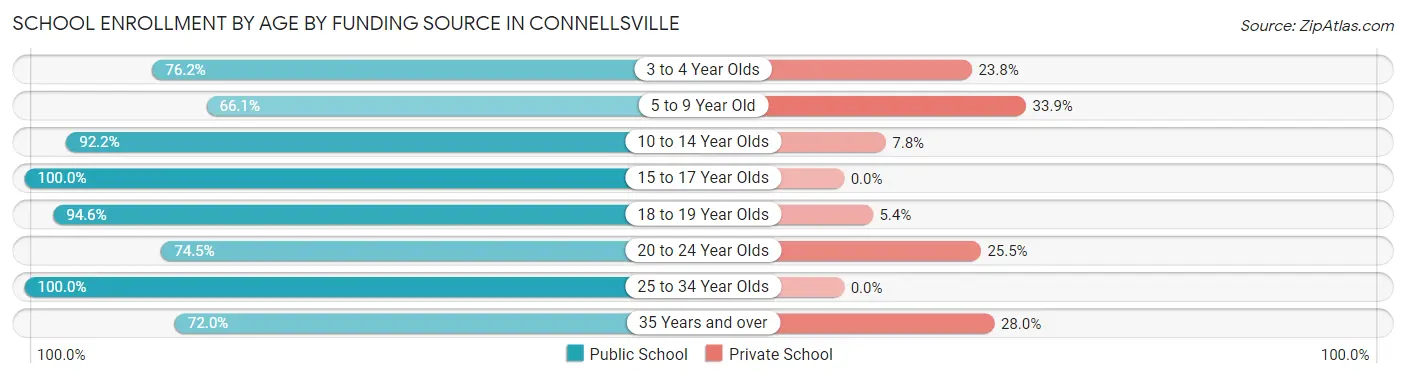
| Age Bracket | Public School | Private School |
| 3 to 4 Year Olds | 48 (76.2%) | 15 (23.8%) |
| 5 to 9 Year Old | 195 (66.1%) | 100 (33.9%) |
| 10 to 14 Year Olds | 380 (92.2%) | 32 (7.8%) |
| 15 to 17 Year Olds | 229 (100.0%) | 0 (0.0%) |
| 18 to 19 Year Olds | 53 (94.6%) | 3 (5.4%) |
| 20 to 24 Year Olds | 117 (74.5%) | 40 (25.5%) |
| 25 to 34 Year Olds | 21 (100.0%) | 0 (0.0%) |
| 35 Years and over | 36 (72.0%) | 14 (28.0%) |
| Total | 1,079 (84.1%) | 204 (15.9%) |
Educational Attainment by Field of Study in Connellsville
Education (368 | 30.5%), business (220 | 18.3%), science & technology (148 | 12.3%), computers & mathematics (70 | 5.8%), and arts & humanities (64 | 5.3%) are the most common fields of study among 1,205 individuals in Connellsville who have obtained a bachelor's degree or higher.
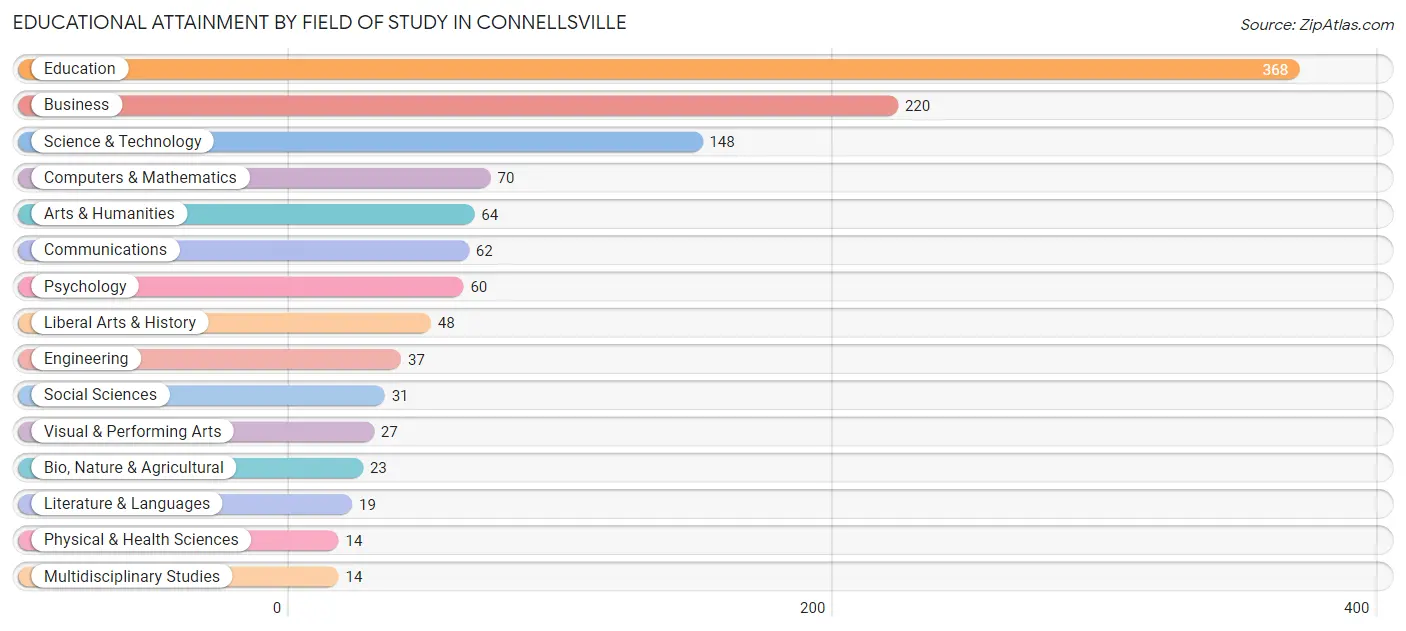
| Field of Study | # Graduates | % Graduates |
| Computers & Mathematics | 70 | 5.8% |
| Bio, Nature & Agricultural | 23 | 1.9% |
| Physical & Health Sciences | 14 | 1.2% |
| Psychology | 60 | 5.0% |
| Social Sciences | 31 | 2.6% |
| Engineering | 37 | 3.1% |
| Multidisciplinary Studies | 14 | 1.2% |
| Science & Technology | 148 | 12.3% |
| Business | 220 | 18.3% |
| Education | 368 | 30.5% |
| Literature & Languages | 19 | 1.6% |
| Liberal Arts & History | 48 | 4.0% |
| Visual & Performing Arts | 27 | 2.2% |
| Communications | 62 | 5.1% |
| Arts & Humanities | 64 | 5.3% |
| Total | 1,205 | 100.0% |
Transportation & Commute in Connellsville
Vehicle Availability by Sex in Connellsville
The most prevalent vehicle ownership categories in Connellsville are males with 2 vehicles (904, accounting for 52.1%) and females with 2 vehicles (741, making up 63.5%).
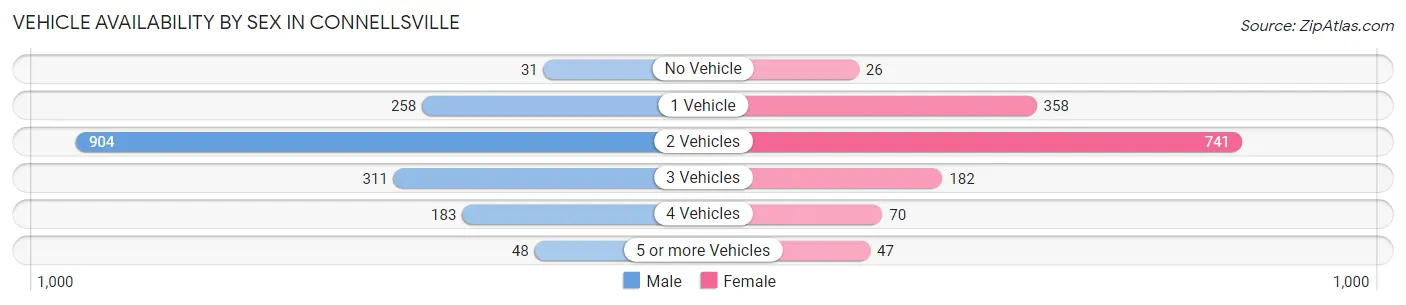
| Vehicles Available | Male | Female |
| No Vehicle | 31 (1.8%) | 26 (1.8%) |
| 1 Vehicle | 258 (14.9%) | 358 (25.1%) |
| 2 Vehicles | 904 (52.1%) | 741 (52.0%) |
| 3 Vehicles | 311 (17.9%) | 182 (12.8%) |
| 4 Vehicles | 183 (10.5%) | 70 (4.9%) |
| 5 or more Vehicles | 48 (2.8%) | 47 (3.3%) |
| Total | 1,735 (100.0%) | 1,424 (100.0%) |
Commute Time in Connellsville
The most frequently occuring commute durations in Connellsville are 20 to 24 minutes (486 commuters, 16.4%), 5 to 9 minutes (386 commuters, 13.1%), and 15 to 19 minutes (368 commuters, 12.4%).
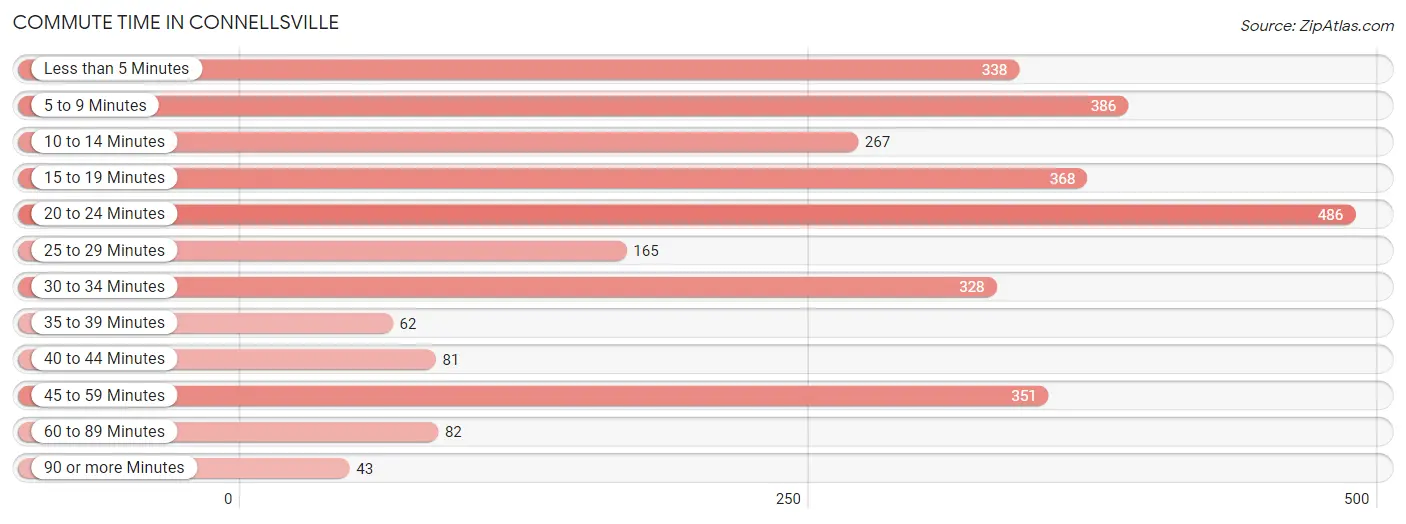
| Commute Time | # Commuters | % Commuters |
| Less than 5 Minutes | 338 | 11.4% |
| 5 to 9 Minutes | 386 | 13.1% |
| 10 to 14 Minutes | 267 | 9.0% |
| 15 to 19 Minutes | 368 | 12.4% |
| 20 to 24 Minutes | 486 | 16.4% |
| 25 to 29 Minutes | 165 | 5.6% |
| 30 to 34 Minutes | 328 | 11.1% |
| 35 to 39 Minutes | 62 | 2.1% |
| 40 to 44 Minutes | 81 | 2.7% |
| 45 to 59 Minutes | 351 | 11.9% |
| 60 to 89 Minutes | 82 | 2.8% |
| 90 or more Minutes | 43 | 1.5% |
Commute Time by Sex in Connellsville
The most common commute times in Connellsville are 20 to 24 minutes (328 commuters, 19.9%) for males and 15 to 19 minutes (234 commuters, 17.9%) for females.
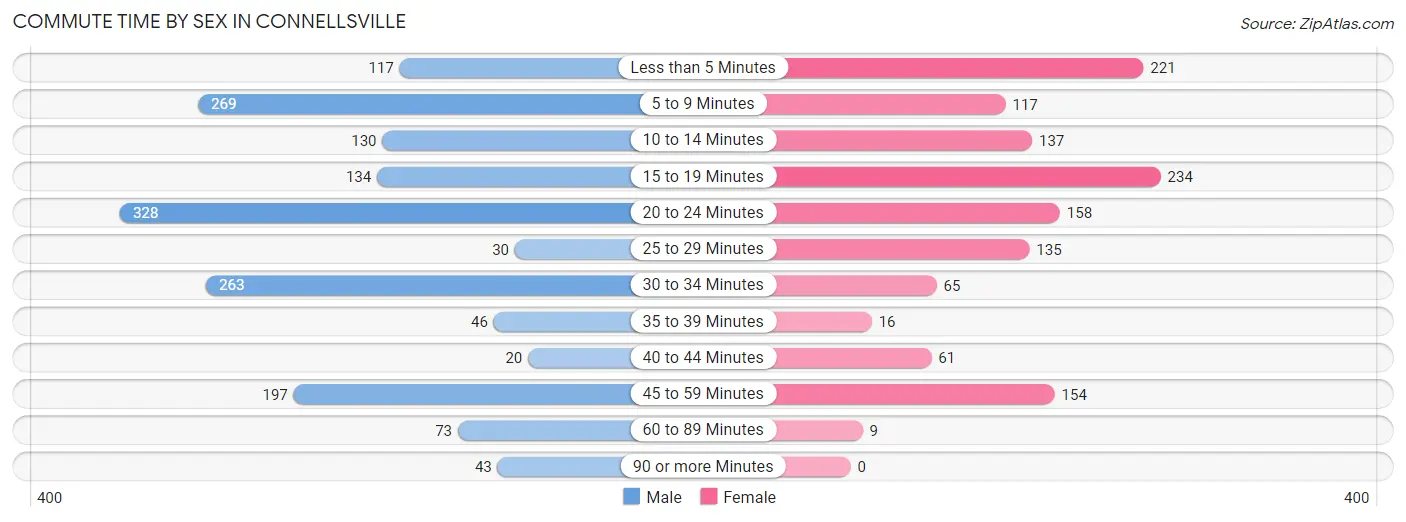
| Commute Time | Male | Female |
| Less than 5 Minutes | 117 (7.1%) | 221 (16.9%) |
| 5 to 9 Minutes | 269 (16.3%) | 117 (8.9%) |
| 10 to 14 Minutes | 130 (7.9%) | 137 (10.5%) |
| 15 to 19 Minutes | 134 (8.1%) | 234 (17.9%) |
| 20 to 24 Minutes | 328 (19.9%) | 158 (12.1%) |
| 25 to 29 Minutes | 30 (1.8%) | 135 (10.3%) |
| 30 to 34 Minutes | 263 (15.9%) | 65 (5.0%) |
| 35 to 39 Minutes | 46 (2.8%) | 16 (1.2%) |
| 40 to 44 Minutes | 20 (1.2%) | 61 (4.7%) |
| 45 to 59 Minutes | 197 (11.9%) | 154 (11.8%) |
| 60 to 89 Minutes | 73 (4.4%) | 9 (0.7%) |
| 90 or more Minutes | 43 (2.6%) | 0 (0.0%) |
Time of Departure to Work by Sex in Connellsville
The most frequent times of departure to work in Connellsville are 12:00 PM to 3:59 PM (278, 16.9%) for males and 8:00 AM to 8:29 AM (335, 25.6%) for females.
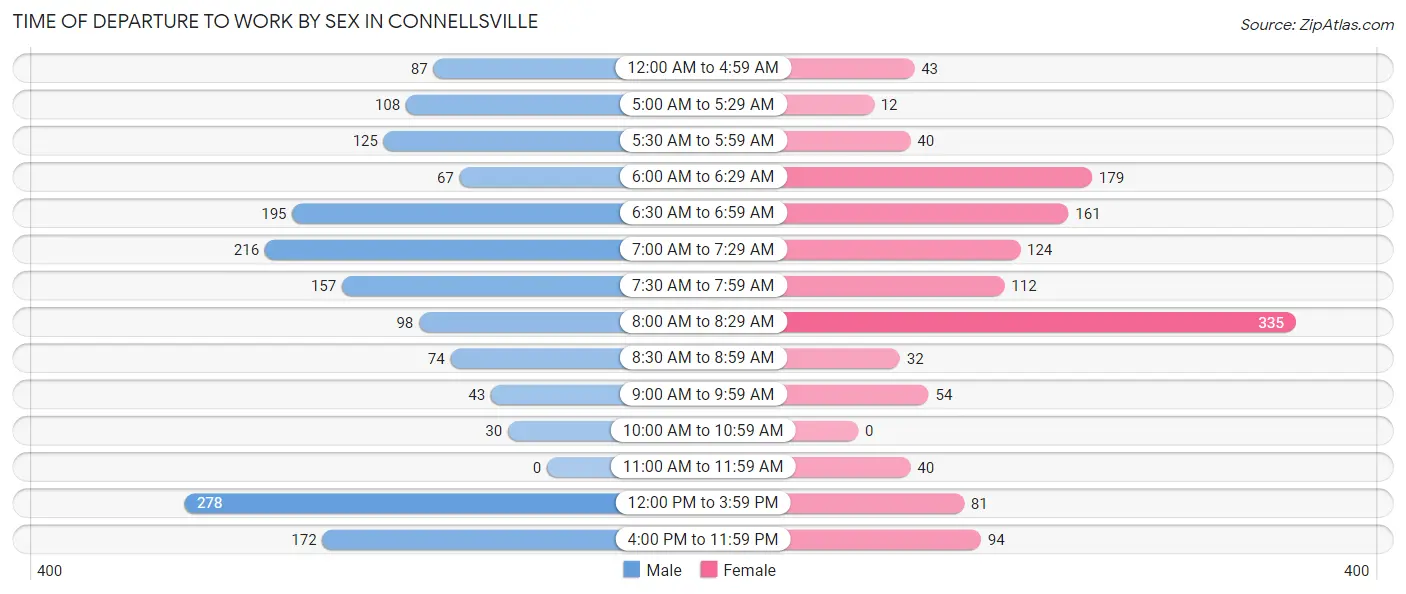
| Time of Departure | Male | Female |
| 12:00 AM to 4:59 AM | 87 (5.3%) | 43 (3.3%) |
| 5:00 AM to 5:29 AM | 108 (6.6%) | 12 (0.9%) |
| 5:30 AM to 5:59 AM | 125 (7.6%) | 40 (3.1%) |
| 6:00 AM to 6:29 AM | 67 (4.1%) | 179 (13.7%) |
| 6:30 AM to 6:59 AM | 195 (11.8%) | 161 (12.3%) |
| 7:00 AM to 7:29 AM | 216 (13.1%) | 124 (9.5%) |
| 7:30 AM to 7:59 AM | 157 (9.5%) | 112 (8.6%) |
| 8:00 AM to 8:29 AM | 98 (5.9%) | 335 (25.6%) |
| 8:30 AM to 8:59 AM | 74 (4.5%) | 32 (2.5%) |
| 9:00 AM to 9:59 AM | 43 (2.6%) | 54 (4.1%) |
| 10:00 AM to 10:59 AM | 30 (1.8%) | 0 (0.0%) |
| 11:00 AM to 11:59 AM | 0 (0.0%) | 40 (3.1%) |
| 12:00 PM to 3:59 PM | 278 (16.9%) | 81 (6.2%) |
| 4:00 PM to 11:59 PM | 172 (10.4%) | 94 (7.2%) |
| Total | 1,650 (100.0%) | 1,307 (100.0%) |
Housing Occupancy in Connellsville
Occupancy by Ownership in Connellsville
Of the total 3,293 dwellings in Connellsville, owner-occupied units account for 1,943 (59.0%), while renter-occupied units make up 1,350 (41.0%).
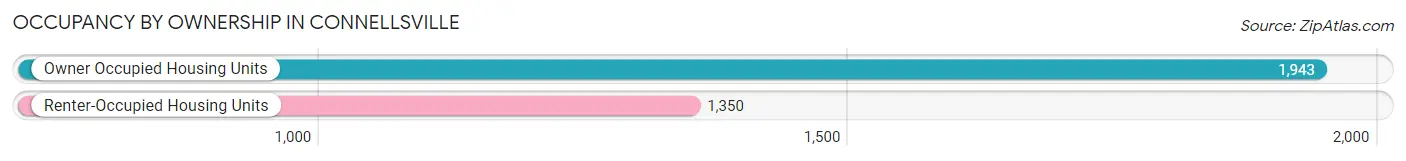
| Occupancy | # Housing Units | % Housing Units |
| Owner Occupied Housing Units | 1,943 | 59.0% |
| Renter-Occupied Housing Units | 1,350 | 41.0% |
| Total Occupied Housing Units | 3,293 | 100.0% |
Occupancy by Household Size in Connellsville
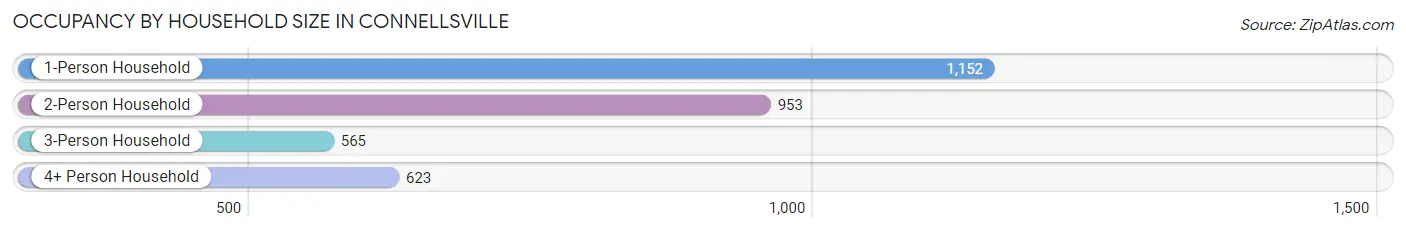
| Household Size | # Housing Units | % Housing Units |
| 1-Person Household | 1,152 | 35.0% |
| 2-Person Household | 953 | 28.9% |
| 3-Person Household | 565 | 17.2% |
| 4+ Person Household | 623 | 18.9% |
| Total Housing Units | 3,293 | 100.0% |
Occupancy by Ownership by Household Size in Connellsville
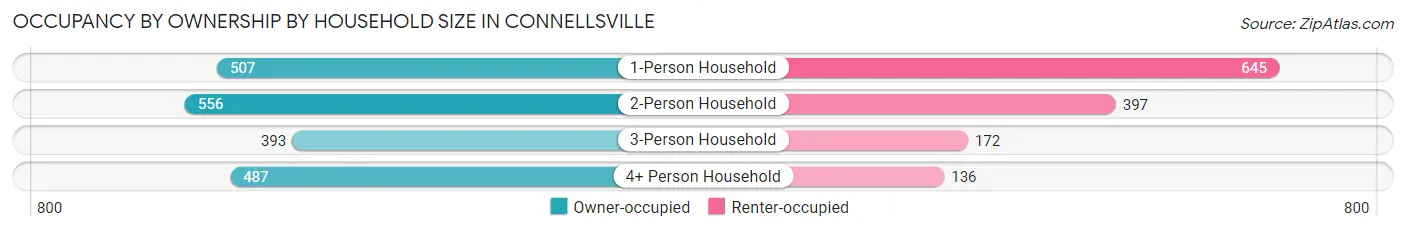
| Household Size | Owner-occupied | Renter-occupied |
| 1-Person Household | 507 (44.0%) | 645 (56.0%) |
| 2-Person Household | 556 (58.3%) | 397 (41.7%) |
| 3-Person Household | 393 (69.6%) | 172 (30.4%) |
| 4+ Person Household | 487 (78.2%) | 136 (21.8%) |
| Total Housing Units | 1,943 (59.0%) | 1,350 (41.0%) |
Occupancy by Educational Attainment in Connellsville
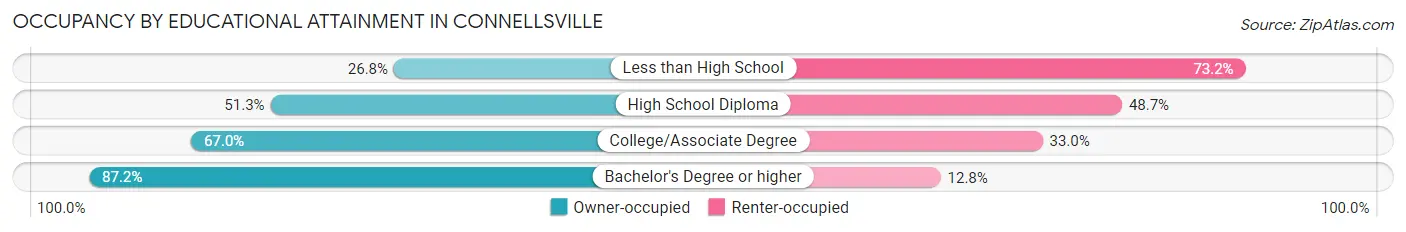
| Household Size | Owner-occupied | Renter-occupied |
| Less than High School | 120 (26.8%) | 328 (73.2%) |
| High School Diploma | 684 (51.3%) | 650 (48.7%) |
| College/Associate Degree | 593 (67.0%) | 292 (33.0%) |
| Bachelor's Degree or higher | 546 (87.2%) | 80 (12.8%) |
Occupancy by Age of Householder in Connellsville
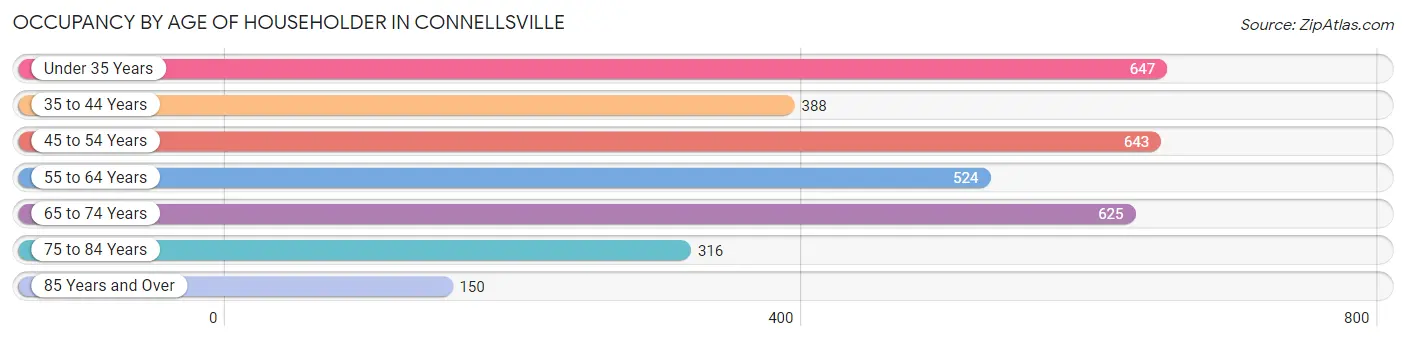
| Age Bracket | # Households | % Households |
| Under 35 Years | 647 | 19.7% |
| 35 to 44 Years | 388 | 11.8% |
| 45 to 54 Years | 643 | 19.5% |
| 55 to 64 Years | 524 | 15.9% |
| 65 to 74 Years | 625 | 19.0% |
| 75 to 84 Years | 316 | 9.6% |
| 85 Years and Over | 150 | 4.6% |
| Total | 3,293 | 100.0% |
Housing Finances in Connellsville
Median Income by Occupancy in Connellsville
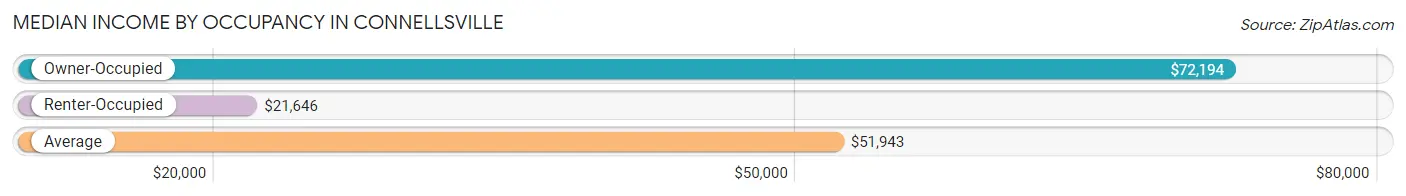
| Occupancy Type | # Households | Median Income |
| Owner-Occupied | 1,943 (59.0%) | $72,194 |
| Renter-Occupied | 1,350 (41.0%) | $21,646 |
| Average | 3,293 (100.0%) | $51,943 |
Occupancy by Householder Income Bracket in Connellsville
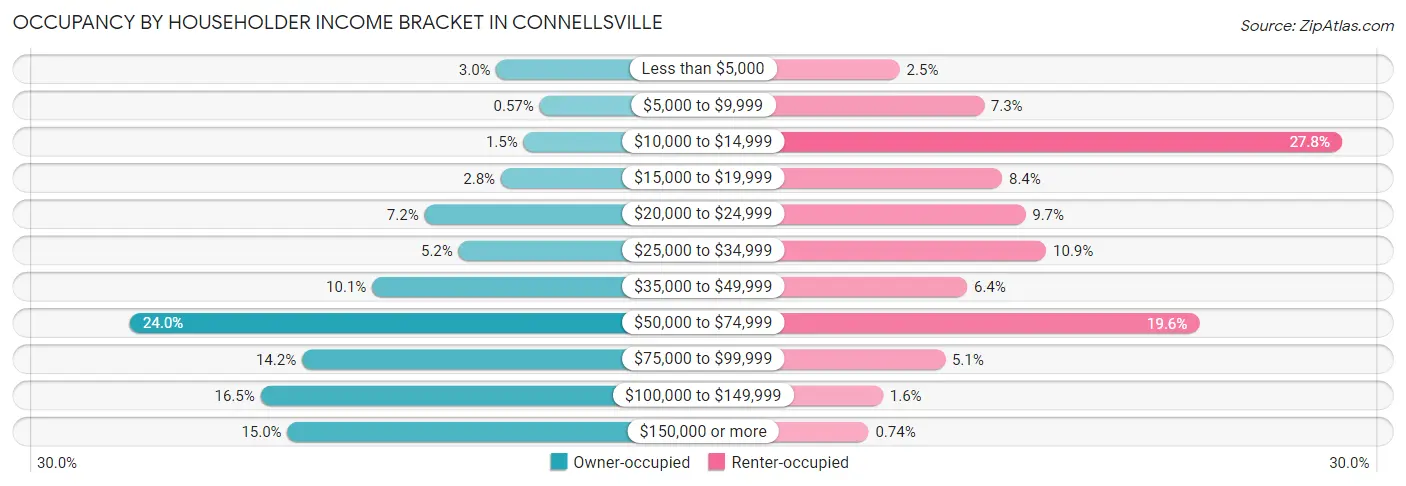
| Income Bracket | Owner-occupied | Renter-occupied |
| Less than $5,000 | 59 (3.0%) | 34 (2.5%) |
| $5,000 to $9,999 | 11 (0.6%) | 99 (7.3%) |
| $10,000 to $14,999 | 29 (1.5%) | 375 (27.8%) |
| $15,000 to $19,999 | 54 (2.8%) | 113 (8.4%) |
| $20,000 to $24,999 | 139 (7.1%) | 131 (9.7%) |
| $25,000 to $34,999 | 101 (5.2%) | 147 (10.9%) |
| $35,000 to $49,999 | 197 (10.1%) | 86 (6.4%) |
| $50,000 to $74,999 | 466 (24.0%) | 265 (19.6%) |
| $75,000 to $99,999 | 275 (14.1%) | 69 (5.1%) |
| $100,000 to $149,999 | 321 (16.5%) | 21 (1.6%) |
| $150,000 or more | 291 (15.0%) | 10 (0.7%) |
| Total | 1,943 (100.0%) | 1,350 (100.0%) |
Monthly Housing Cost Tiers in Connellsville
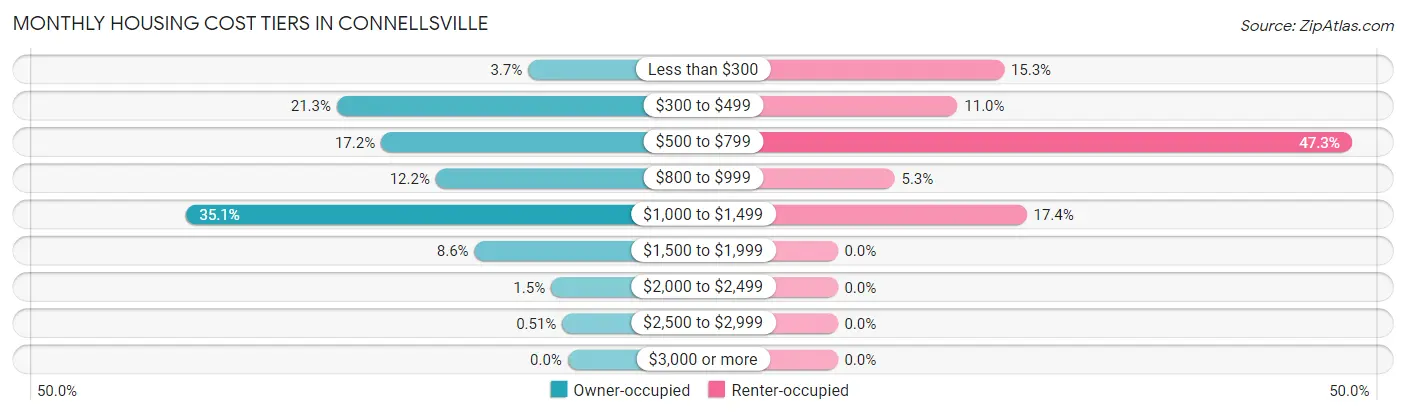
| Monthly Cost | Owner-occupied | Renter-occupied |
| Less than $300 | 71 (3.6%) | 207 (15.3%) |
| $300 to $499 | 413 (21.3%) | 149 (11.0%) |
| $500 to $799 | 334 (17.2%) | 639 (47.3%) |
| $800 to $999 | 236 (12.1%) | 71 (5.3%) |
| $1,000 to $1,499 | 682 (35.1%) | 235 (17.4%) |
| $1,500 to $1,999 | 167 (8.6%) | 0 (0.0%) |
| $2,000 to $2,499 | 30 (1.5%) | 0 (0.0%) |
| $2,500 to $2,999 | 10 (0.5%) | 0 (0.0%) |
| $3,000 or more | 0 (0.0%) | 0 (0.0%) |
| Total | 1,943 (100.0%) | 1,350 (100.0%) |
Physical Housing Characteristics in Connellsville
Housing Structures in Connellsville
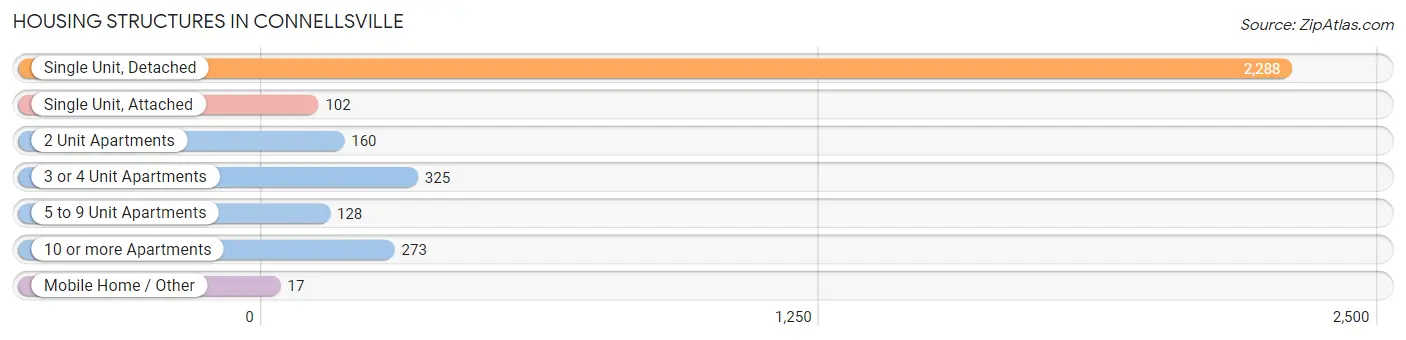
| Structure Type | # Housing Units | % Housing Units |
| Single Unit, Detached | 2,288 | 69.5% |
| Single Unit, Attached | 102 | 3.1% |
| 2 Unit Apartments | 160 | 4.9% |
| 3 or 4 Unit Apartments | 325 | 9.9% |
| 5 to 9 Unit Apartments | 128 | 3.9% |
| 10 or more Apartments | 273 | 8.3% |
| Mobile Home / Other | 17 | 0.5% |
| Total | 3,293 | 100.0% |
Housing Structures by Occupancy in Connellsville
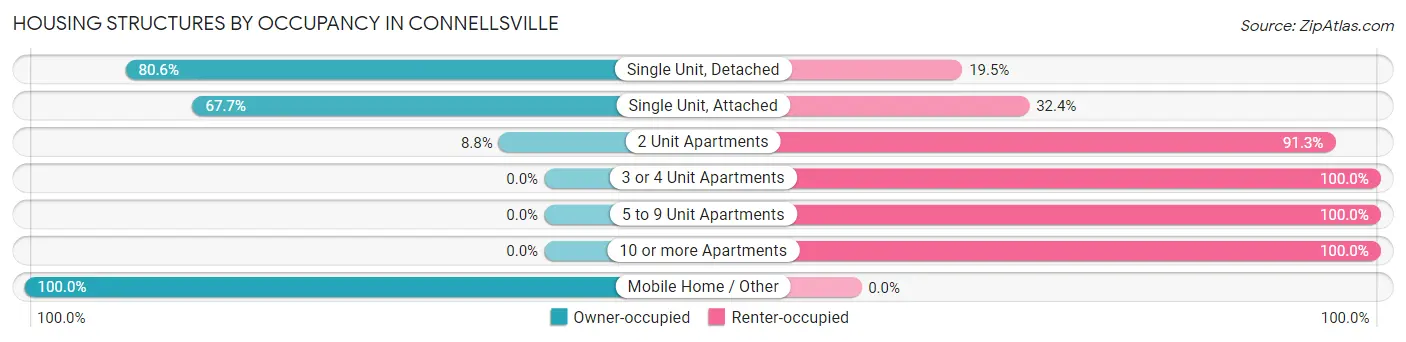
| Structure Type | Owner-occupied | Renter-occupied |
| Single Unit, Detached | 1,843 (80.5%) | 445 (19.5%) |
| Single Unit, Attached | 69 (67.6%) | 33 (32.4%) |
| 2 Unit Apartments | 14 (8.7%) | 146 (91.2%) |
| 3 or 4 Unit Apartments | 0 (0.0%) | 325 (100.0%) |
| 5 to 9 Unit Apartments | 0 (0.0%) | 128 (100.0%) |
| 10 or more Apartments | 0 (0.0%) | 273 (100.0%) |
| Mobile Home / Other | 17 (100.0%) | 0 (0.0%) |
| Total | 1,943 (59.0%) | 1,350 (41.0%) |
Housing Structures by Number of Rooms in Connellsville
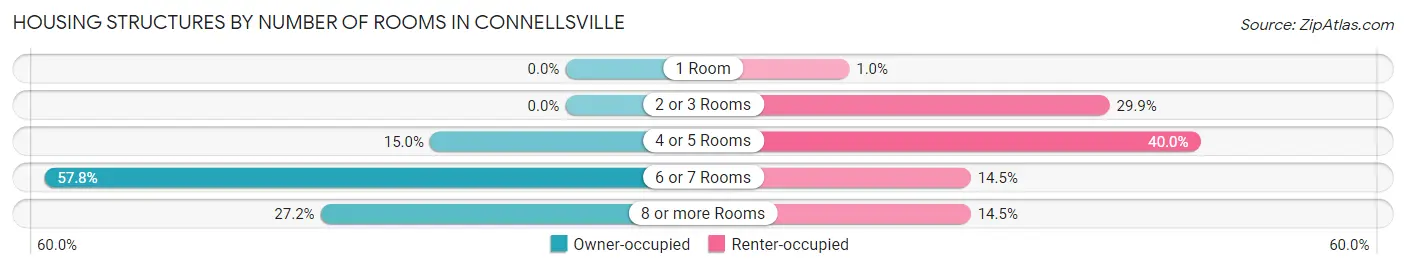
| Number of Rooms | Owner-occupied | Renter-occupied |
| 1 Room | 0 (0.0%) | 14 (1.0%) |
| 2 or 3 Rooms | 0 (0.0%) | 404 (29.9%) |
| 4 or 5 Rooms | 292 (15.0%) | 540 (40.0%) |
| 6 or 7 Rooms | 1,123 (57.8%) | 196 (14.5%) |
| 8 or more Rooms | 528 (27.2%) | 196 (14.5%) |
| Total | 1,943 (100.0%) | 1,350 (100.0%) |
Housing Structure by Heating Type in Connellsville
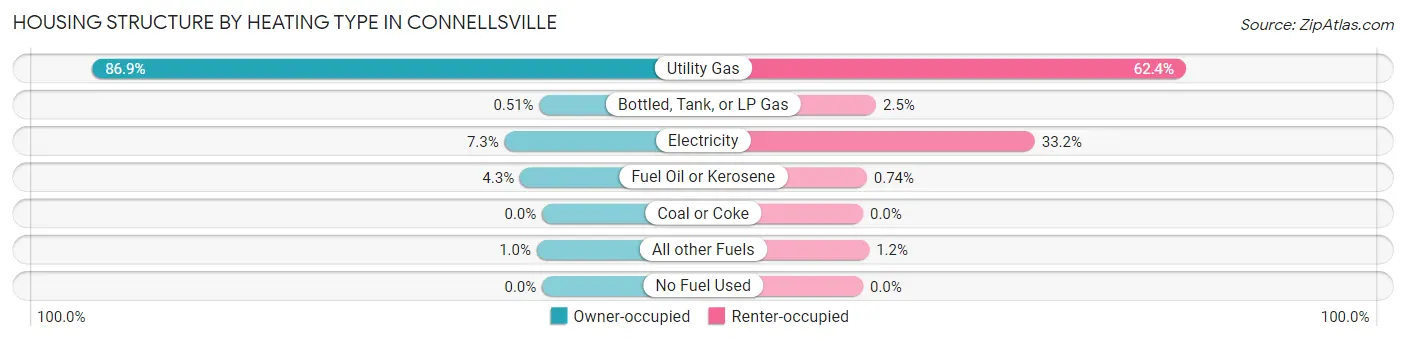
| Heating Type | Owner-occupied | Renter-occupied |
| Utility Gas | 1,689 (86.9%) | 842 (62.4%) |
| Bottled, Tank, or LP Gas | 10 (0.5%) | 34 (2.5%) |
| Electricity | 141 (7.3%) | 448 (33.2%) |
| Fuel Oil or Kerosene | 83 (4.3%) | 10 (0.7%) |
| Coal or Coke | 0 (0.0%) | 0 (0.0%) |
| All other Fuels | 20 (1.0%) | 16 (1.2%) |
| No Fuel Used | 0 (0.0%) | 0 (0.0%) |
| Total | 1,943 (100.0%) | 1,350 (100.0%) |
Household Vehicle Usage in Connellsville
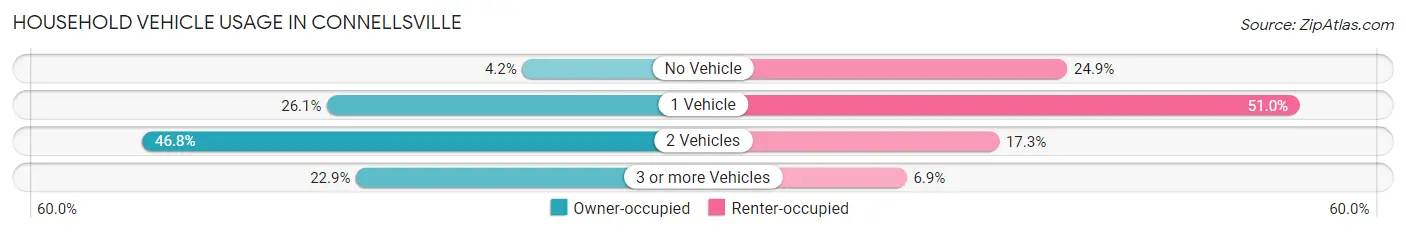
| Vehicles per Household | Owner-occupied | Renter-occupied |
| No Vehicle | 82 (4.2%) | 336 (24.9%) |
| 1 Vehicle | 507 (26.1%) | 688 (51.0%) |
| 2 Vehicles | 910 (46.8%) | 233 (17.3%) |
| 3 or more Vehicles | 444 (22.9%) | 93 (6.9%) |
| Total | 1,943 (100.0%) | 1,350 (100.0%) |
Real Estate & Mortgages in Connellsville
Real Estate and Mortgage Overview in Connellsville
| Characteristic | Without Mortgage | With Mortgage |
| Housing Units | 784 | 1,159 |
| Median Property Value | $108,100 | $119,500 |
| Median Household Income | $52,979 | $231 |
| Monthly Housing Costs | $454 | $0 |
| Real Estate Taxes | $1,184 | $4 |
Property Value by Mortgage Status in Connellsville
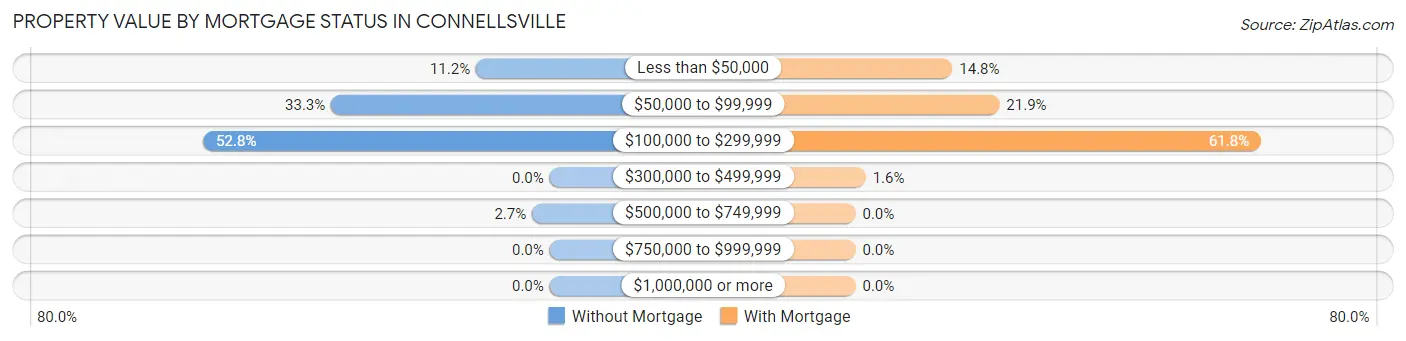
| Property Value | Without Mortgage | With Mortgage |
| Less than $50,000 | 88 (11.2%) | 171 (14.7%) |
| $50,000 to $99,999 | 261 (33.3%) | 254 (21.9%) |
| $100,000 to $299,999 | 414 (52.8%) | 716 (61.8%) |
| $300,000 to $499,999 | 0 (0.0%) | 18 (1.5%) |
| $500,000 to $749,999 | 21 (2.7%) | 0 (0.0%) |
| $750,000 to $999,999 | 0 (0.0%) | 0 (0.0%) |
| $1,000,000 or more | 0 (0.0%) | 0 (0.0%) |
| Total | 784 (100.0%) | 1,159 (100.0%) |
Household Income by Mortgage Status in Connellsville
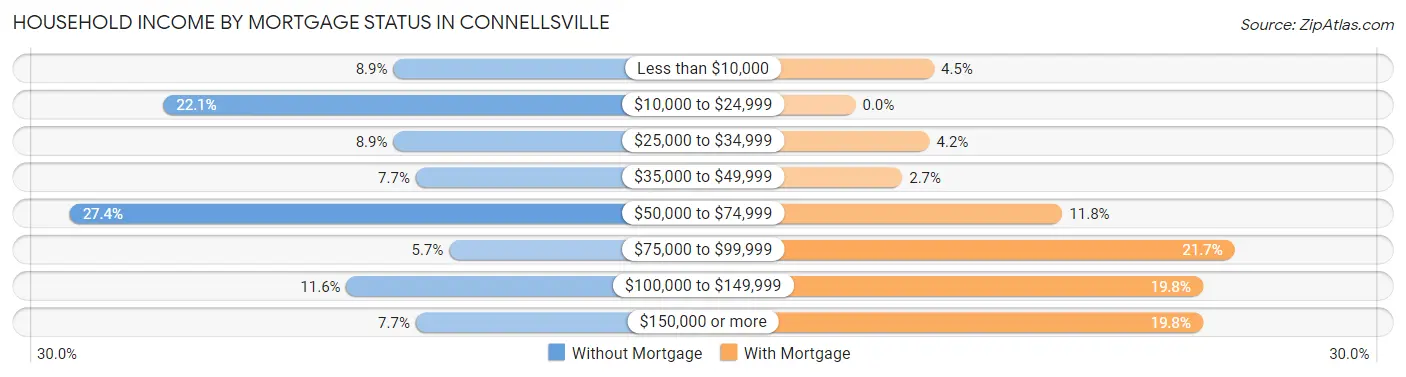
| Household Income | Without Mortgage | With Mortgage |
| Less than $10,000 | 70 (8.9%) | 52 (4.5%) |
| $10,000 to $24,999 | 173 (22.1%) | 0 (0.0%) |
| $25,000 to $34,999 | 70 (8.9%) | 49 (4.2%) |
| $35,000 to $49,999 | 60 (7.6%) | 31 (2.7%) |
| $50,000 to $74,999 | 215 (27.4%) | 137 (11.8%) |
| $75,000 to $99,999 | 45 (5.7%) | 251 (21.7%) |
| $100,000 to $149,999 | 91 (11.6%) | 230 (19.8%) |
| $150,000 or more | 60 (7.6%) | 230 (19.8%) |
| Total | 784 (100.0%) | 1,159 (100.0%) |
Property Value to Household Income Ratio in Connellsville
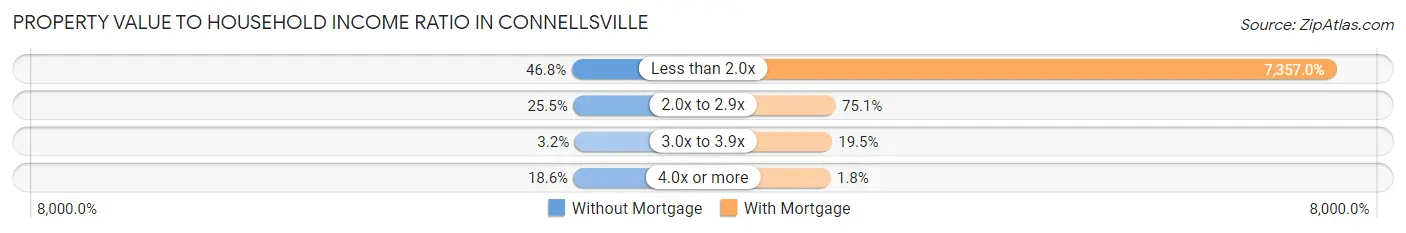
| Value-to-Income Ratio | Without Mortgage | With Mortgage |
| Less than 2.0x | 367 (46.8%) | 85,268 (7,357.0%) |
| 2.0x to 2.9x | 200 (25.5%) | 870 (75.1%) |
| 3.0x to 3.9x | 25 (3.2%) | 226 (19.5%) |
| 4.0x or more | 146 (18.6%) | 21 (1.8%) |
| Total | 784 (100.0%) | 1,159 (100.0%) |
Real Estate Taxes by Mortgage Status in Connellsville
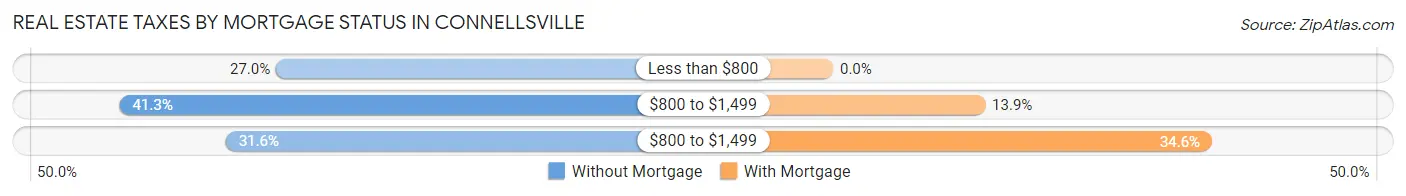
| Property Taxes | Without Mortgage | With Mortgage |
| Less than $800 | 212 (27.0%) | 0 (0.0%) |
| $800 to $1,499 | 324 (41.3%) | 161 (13.9%) |
| $800 to $1,499 | 248 (31.6%) | 401 (34.6%) |
| Total | 784 (100.0%) | 1,159 (100.0%) |
Health & Disability in Connellsville
Health Insurance Coverage by Age in Connellsville
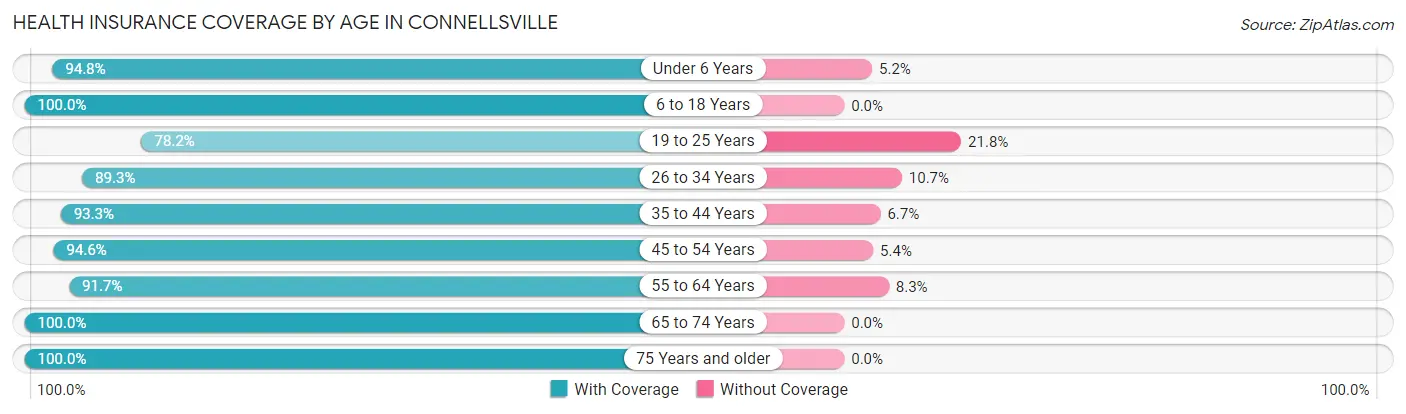
| Age Bracket | With Coverage | Without Coverage |
| Under 6 Years | 403 (94.8%) | 22 (5.2%) |
| 6 to 18 Years | 975 (100.0%) | 0 (0.0%) |
| 19 to 25 Years | 517 (78.2%) | 144 (21.8%) |
| 26 to 34 Years | 774 (89.3%) | 93 (10.7%) |
| 35 to 44 Years | 761 (93.3%) | 55 (6.7%) |
| 45 to 54 Years | 861 (94.6%) | 49 (5.4%) |
| 55 to 64 Years | 805 (91.7%) | 73 (8.3%) |
| 65 to 74 Years | 890 (100.0%) | 0 (0.0%) |
| 75 Years and older | 569 (100.0%) | 0 (0.0%) |
| Total | 6,555 (93.8%) | 436 (6.2%) |
Health Insurance Coverage by Citizenship Status in Connellsville
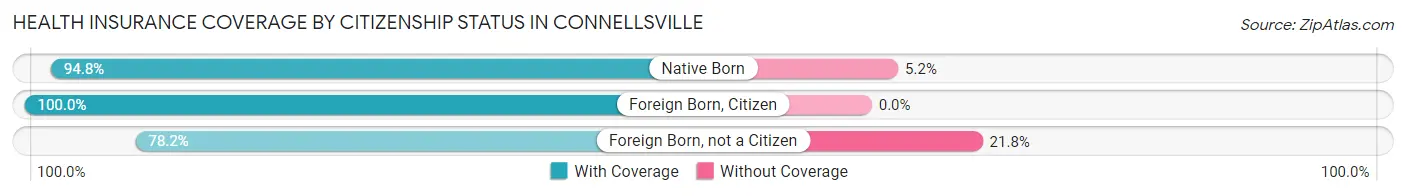
| Citizenship Status | With Coverage | Without Coverage |
| Native Born | 403 (94.8%) | 22 (5.2%) |
| Foreign Born, Citizen | 975 (100.0%) | 0 (0.0%) |
| Foreign Born, not a Citizen | 517 (78.2%) | 144 (21.8%) |
Health Insurance Coverage by Household Income in Connellsville
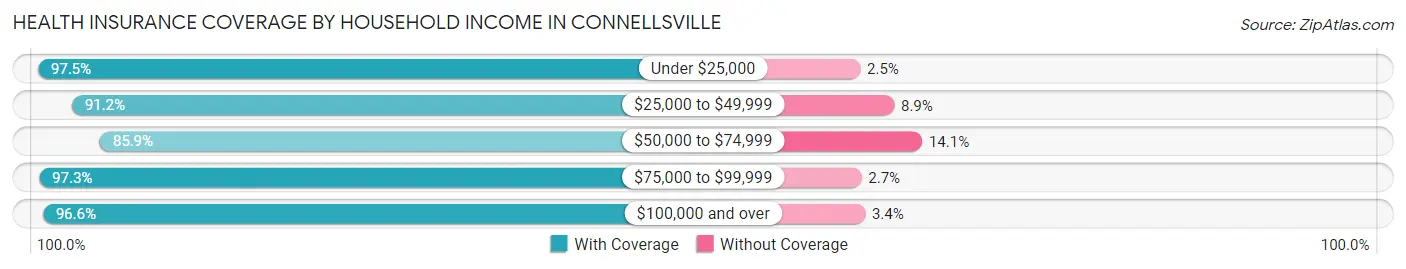
| Household Income | With Coverage | Without Coverage |
| Under $25,000 | 1,407 (97.5%) | 36 (2.5%) |
| $25,000 to $49,999 | 731 (91.1%) | 71 (8.8%) |
| $50,000 to $74,999 | 1,421 (85.9%) | 233 (14.1%) |
| $75,000 to $99,999 | 1,175 (97.3%) | 33 (2.7%) |
| $100,000 and over | 1,790 (96.6%) | 63 (3.4%) |
Public vs Private Health Insurance Coverage by Age in Connellsville
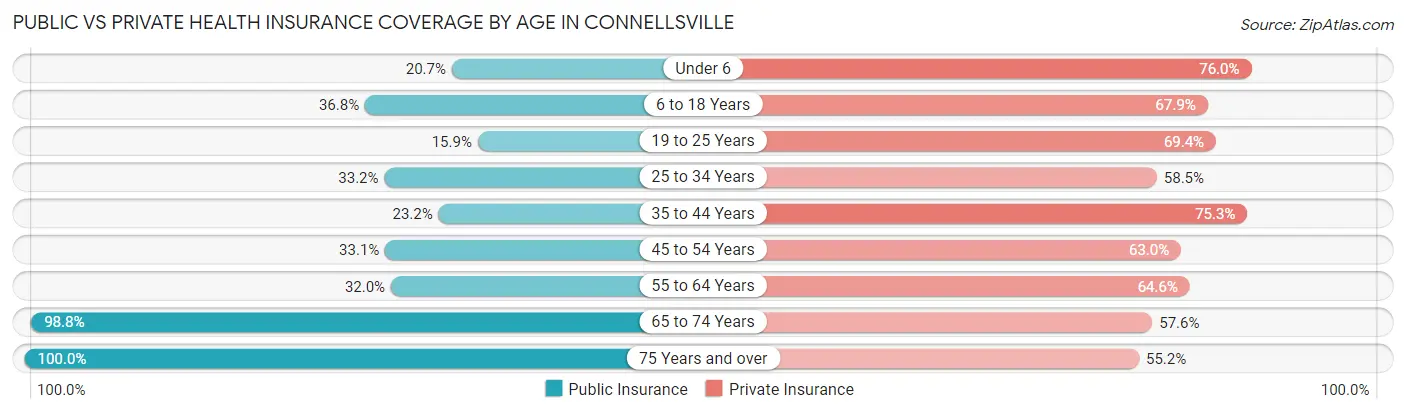
| Age Bracket | Public Insurance | Private Insurance |
| Under 6 | 88 (20.7%) | 323 (76.0%) |
| 6 to 18 Years | 359 (36.8%) | 662 (67.9%) |
| 19 to 25 Years | 105 (15.9%) | 459 (69.4%) |
| 25 to 34 Years | 288 (33.2%) | 507 (58.5%) |
| 35 to 44 Years | 189 (23.2%) | 614 (75.2%) |
| 45 to 54 Years | 301 (33.1%) | 573 (63.0%) |
| 55 to 64 Years | 281 (32.0%) | 567 (64.6%) |
| 65 to 74 Years | 879 (98.8%) | 513 (57.6%) |
| 75 Years and over | 569 (100.0%) | 314 (55.2%) |
| Total | 3,059 (43.8%) | 4,532 (64.8%) |
Disability Status by Sex by Age in Connellsville
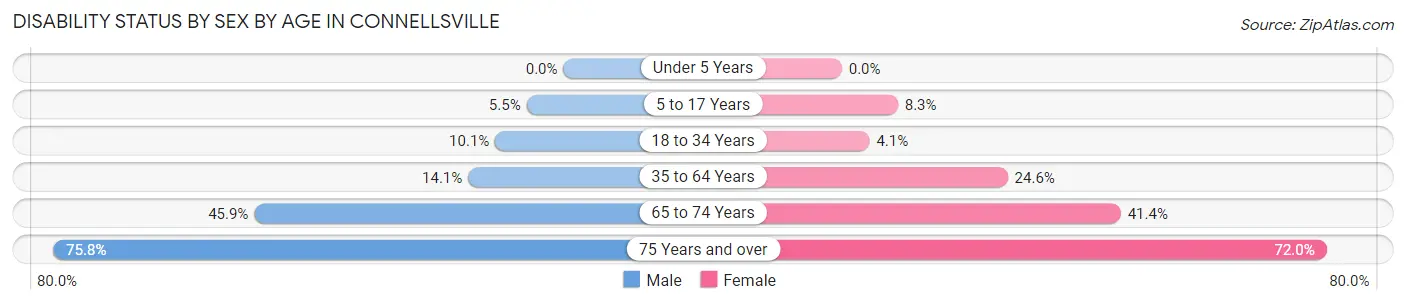
| Age Bracket | Male | Female |
| Under 5 Years | 0 (0.0%) | 0 (0.0%) |
| 5 to 17 Years | 33 (5.5%) | 28 (8.3%) |
| 18 to 34 Years | 85 (10.1%) | 31 (4.1%) |
| 35 to 64 Years | 196 (14.1%) | 300 (24.6%) |
| 65 to 74 Years | 157 (45.9%) | 227 (41.4%) |
| 75 Years and over | 150 (75.8%) | 267 (72.0%) |
Disability Class by Sex by Age in Connellsville
Disability Class: Hearing Difficulty
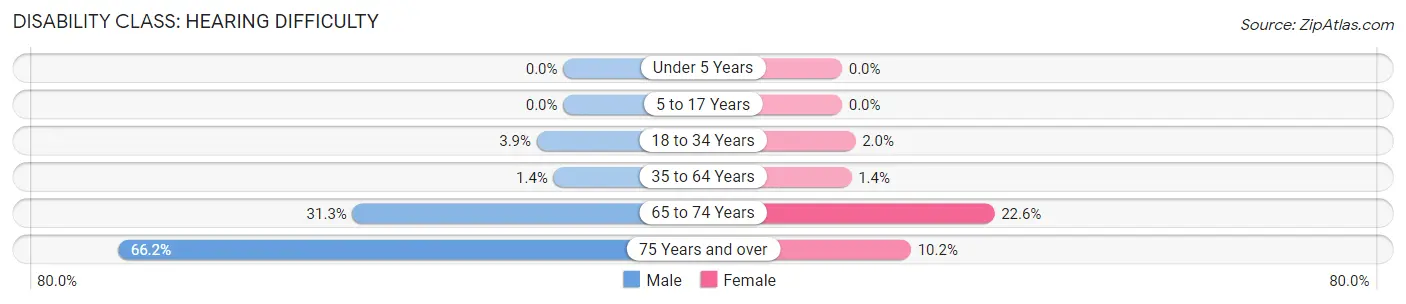
| Age Bracket | Male | Female |
| Under 5 Years | 0 (0.0%) | 0 (0.0%) |
| 5 to 17 Years | 0 (0.0%) | 0 (0.0%) |
| 18 to 34 Years | 33 (3.9%) | 15 (2.0%) |
| 35 to 64 Years | 20 (1.4%) | 17 (1.4%) |
| 65 to 74 Years | 107 (31.3%) | 124 (22.6%) |
| 75 Years and over | 131 (66.2%) | 38 (10.2%) |
Disability Class: Vision Difficulty
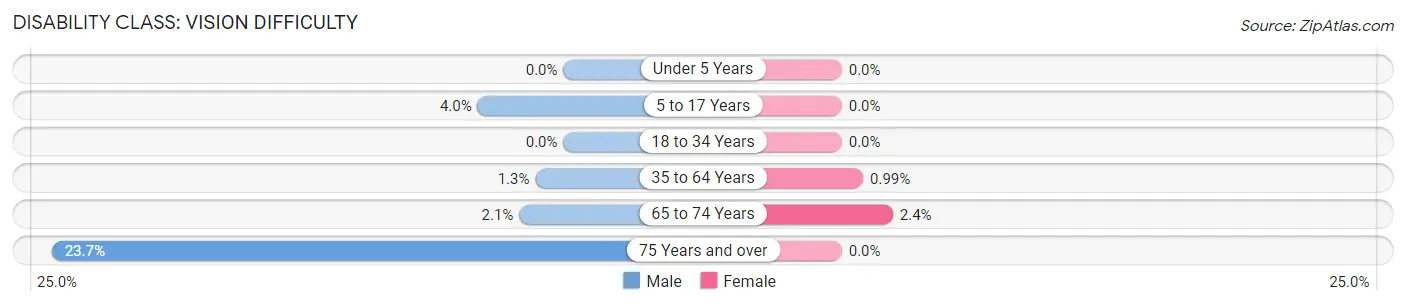
| Age Bracket | Male | Female |
| Under 5 Years | 0 (0.0%) | 0 (0.0%) |
| 5 to 17 Years | 24 (4.0%) | 0 (0.0%) |
| 18 to 34 Years | 0 (0.0%) | 0 (0.0%) |
| 35 to 64 Years | 18 (1.3%) | 12 (1.0%) |
| 65 to 74 Years | 7 (2.1%) | 13 (2.4%) |
| 75 Years and over | 47 (23.7%) | 0 (0.0%) |
Disability Class: Cognitive Difficulty
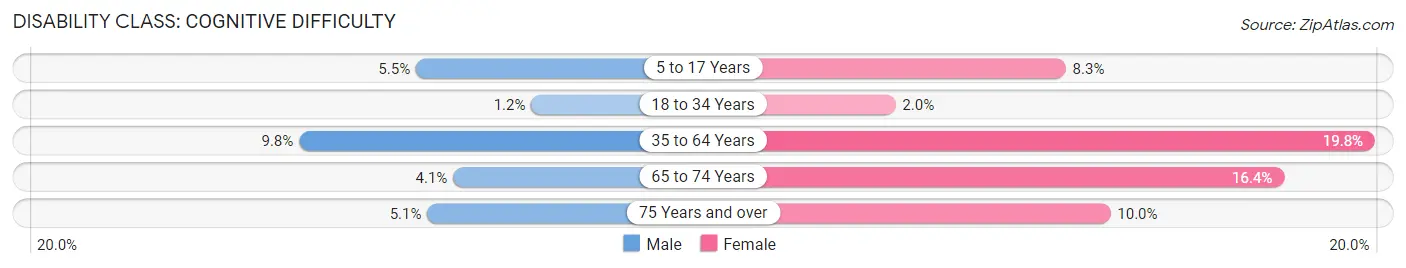
| Age Bracket | Male | Female |
| 5 to 17 Years | 33 (5.5%) | 28 (8.3%) |
| 18 to 34 Years | 10 (1.2%) | 15 (2.0%) |
| 35 to 64 Years | 136 (9.8%) | 241 (19.8%) |
| 65 to 74 Years | 14 (4.1%) | 90 (16.4%) |
| 75 Years and over | 10 (5.1%) | 37 (10.0%) |
Disability Class: Ambulatory Difficulty
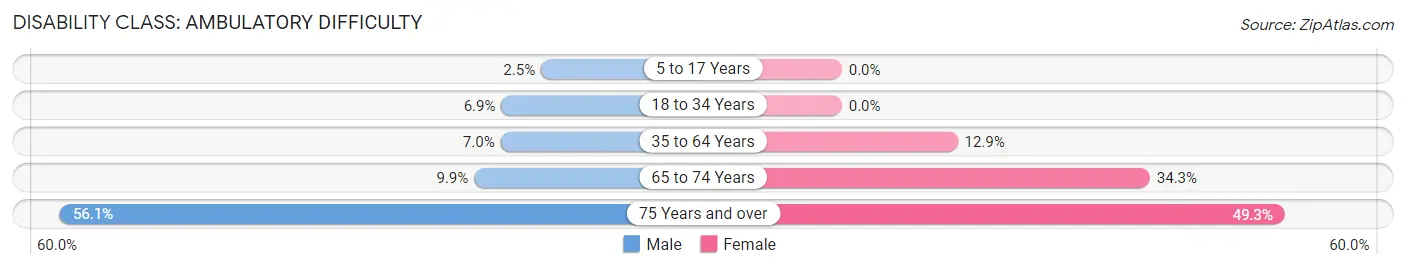
| Age Bracket | Male | Female |
| 5 to 17 Years | 15 (2.5%) | 0 (0.0%) |
| 18 to 34 Years | 58 (6.9%) | 0 (0.0%) |
| 35 to 64 Years | 97 (7.0%) | 157 (12.9%) |
| 65 to 74 Years | 34 (9.9%) | 188 (34.3%) |
| 75 Years and over | 111 (56.1%) | 183 (49.3%) |
Disability Class: Self-Care Difficulty
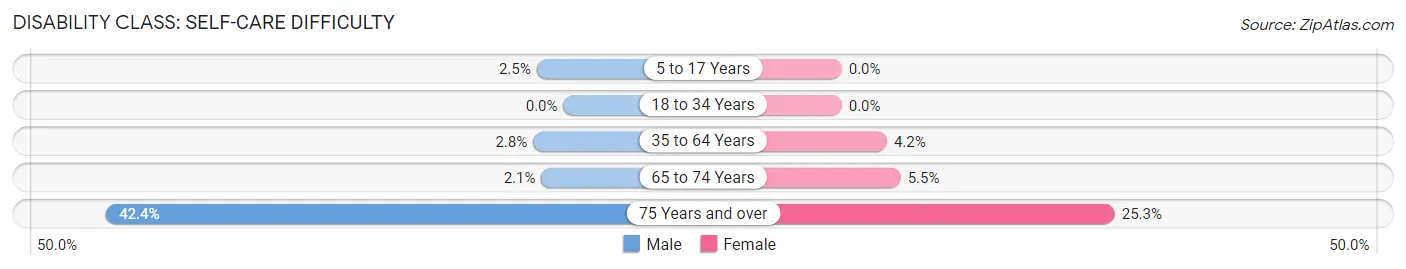
| Age Bracket | Male | Female |
| 5 to 17 Years | 15 (2.5%) | 0 (0.0%) |
| 18 to 34 Years | 0 (0.0%) | 0 (0.0%) |
| 35 to 64 Years | 39 (2.8%) | 51 (4.2%) |
| 65 to 74 Years | 7 (2.1%) | 30 (5.5%) |
| 75 Years and over | 84 (42.4%) | 94 (25.3%) |
Technology Access in Connellsville
Computing Device Access in Connellsville
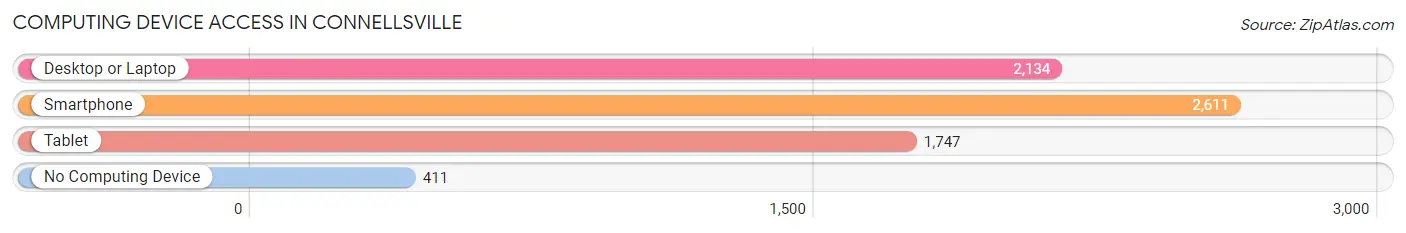
| Device Type | # Households | % Households |
| Desktop or Laptop | 2,134 | 64.8% |
| Smartphone | 2,611 | 79.3% |
| Tablet | 1,747 | 53.0% |
| No Computing Device | 411 | 12.5% |
| Total | 3,293 | 100.0% |
Internet Access in Connellsville
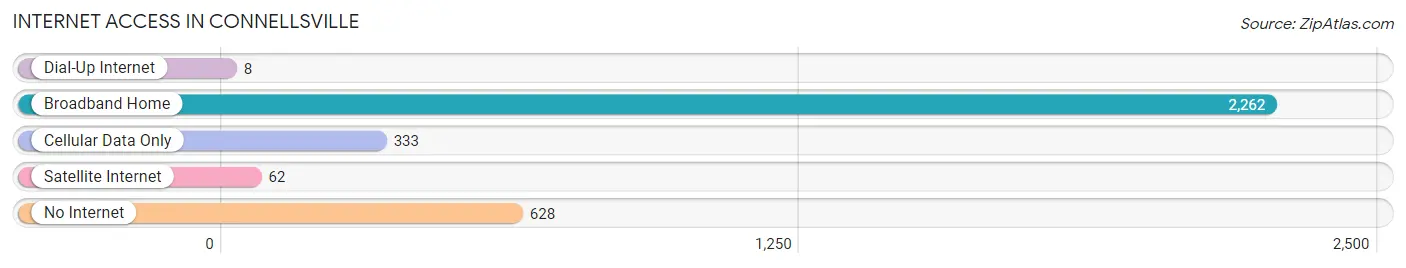
| Internet Type | # Households | % Households |
| Dial-Up Internet | 8 | 0.2% |
| Broadband Home | 2,262 | 68.7% |
| Cellular Data Only | 333 | 10.1% |
| Satellite Internet | 62 | 1.9% |
| No Internet | 628 | 19.1% |
| Total | 3,293 | 100.0% |
Connellsville Summary
Conyngham Township, Fayette County, Pennsylvania is home to the city of Connellsville. The city is located in the Laurel Highlands of the Allegheny Mountains, approximately 50 miles southeast of Pittsburgh. The city is situated along the Youghiogheny River, which is a tributary of the Monongahela River. The city is part of the Pittsburgh metropolitan area and is the largest city in Fayette County.
History
The area that is now Connellsville was first settled in 1793 by John Connell, a Scots-Irish immigrant. The city was officially incorporated in 1806 and was named after Connell. The city quickly became an important transportation hub due to its location along the Youghiogheny River. The river was used to transport coal and other goods to Pittsburgh and other cities. The city was also an important stop on the Pittsburgh and Connellsville Railroad, which was the first railroad to cross the Allegheny Mountains.
The city experienced a period of growth in the late 19th and early 20th centuries due to the coal and steel industries. The city was home to several steel mills and coal mines, which provided employment for many of the city’s residents. The city also became a center for glass production, with several glass factories located in the city.
Geography
Connellsville is located in the Laurel Highlands of the Allegheny Mountains. The city is situated along the Youghiogheny River, which is a tributary of the Monongahela River. The city is located approximately 50 miles southeast of Pittsburgh. The city has a total area of 4.2 square miles, all of which is land. The city is located in a hilly region and is surrounded by several small mountains.
Economy
The economy of Connellsville is largely based on the coal and steel industries. The city is home to several steel mills and coal mines, which provide employment for many of the city’s residents. The city is also home to several glass factories, which produce a variety of glass products. The city is also home to several retail stores, restaurants, and other businesses.
Demographics
According to the 2010 census, the population of Connellsville was 7,637. The population is largely white (94.2%) and the median household income is $30,945. The city has a poverty rate of 22.3%, which is higher than the national average. The city also has a high unemployment rate of 8.2%. The city is home to several churches, including the First United Methodist Church, the First Presbyterian Church, and the St. John’s Lutheran Church. The city is also home to several schools, including Connellsville Area High School, Connellsville Area Middle School, and Connellsville Area Elementary School.
Common Questions
What is Per Capita Income in Connellsville?
Per Capita income in Connellsville is $32,992.
What is the Median Family Income in Connellsville?
Median Family Income in Connellsville is $72,611.
What is the Median Household income in Connellsville?
Median Household Income in Connellsville is $51,943.
What is Income or Wage Gap in Connellsville?
Income or Wage Gap in Connellsville is 37.7%.
Women in Connellsville earn 62.3 cents for every dollar earned by a man.
What is Inequality or Gini Index in Connellsville?
Inequality or Gini Index in Connellsville is 0.52.
What is the Total Population of Connellsville?
Total Population of Connellsville is 7,004.
What is the Total Male Population of Connellsville?
Total Male Population of Connellsville is 3,625.
What is the Total Female Population of Connellsville?
Total Female Population of Connellsville is 3,379.
What is the Ratio of Males per 100 Females in Connellsville?
There are 107.28 Males per 100 Females in Connellsville.
What is the Ratio of Females per 100 Males in Connellsville?
There are 93.21 Females per 100 Males in Connellsville.
What is the Median Population Age in Connellsville?
Median Population Age in Connellsville is 41.2 Years.
What is the Average Family Size in Connellsville
Average Family Size in Connellsville is 2.7 People.
What is the Average Household Size in Connellsville
Average Household Size in Connellsville is 2.1 People.
How Large is the Labor Force in Connellsville?
There are 3,446 People in the Labor Forcein in Connellsville.
What is the Percentage of People in the Labor Force in Connellsville?
59.1% of People are in the Labor Force in Connellsville.
What is the Unemployment Rate in Connellsville?
Unemployment Rate in Connellsville is 7.3%.