Woodlyn, PA Map & Demographics
Woodlyn Map
Woodlyn Overview
$36,911
PER CAPITA INCOME
$100,000
AVG FAMILY INCOME
$66,818
AVG HOUSEHOLD INCOME
17.4%
WAGE / INCOME GAP [ % ]
82.6¢/ $1
WAGE / INCOME GAP [ $ ]
0.41
INEQUALITY / GINI INDEX
10,347
TOTAL POPULATION
5,266
MALE POPULATION
5,081
FEMALE POPULATION
103.64
MALES / 100 FEMALES
96.49
FEMALES / 100 MALES
39.1
MEDIAN AGE
3.4
AVG FAMILY SIZE
2.5
AVG HOUSEHOLD SIZE
5,413
LABOR FORCE [ PEOPLE ]
64.2%
PERCENT IN LABOR FORCE
5.1%
UNEMPLOYMENT RATE
Woodlyn Zip Codes
Income in Woodlyn
Income Overview in Woodlyn
Per Capita Income in Woodlyn is $36,911, while median incomes of families and households are $100,000 and $66,818 respectively.
| Characteristic | Number | Measure |
| Per Capita Income | 10,347 | $36,911 |
| Median Family Income | 2,422 | $100,000 |
| Mean Family Income | 2,422 | $110,665 |
| Median Household Income | 4,146 | $66,818 |
| Mean Household Income | 4,146 | $89,441 |
| Income Deficit | 2,422 | $0 |
| Wage / Income Gap (%) | 10,347 | 17.35% |
| Wage / Income Gap ($) | 10,347 | 82.65¢ per $1 |
| Gini / Inequality Index | 10,347 | 0.41 |
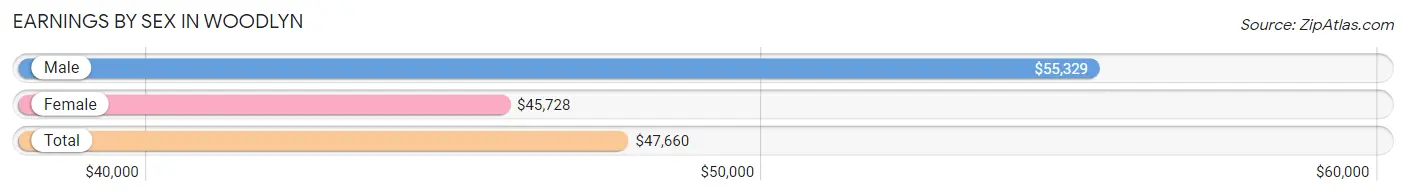
Earnings by Sex in Woodlyn
Average Earnings in Woodlyn are $47,660, $55,329 for men and $45,728 for women, a difference of 17.3%.
| Sex | Number | Average Earnings |
| Male | 3,031 (55.5%) | $55,329 |
| Female | 2,428 (44.5%) | $45,728 |
| Total | 5,459 (100.0%) | $47,660 |
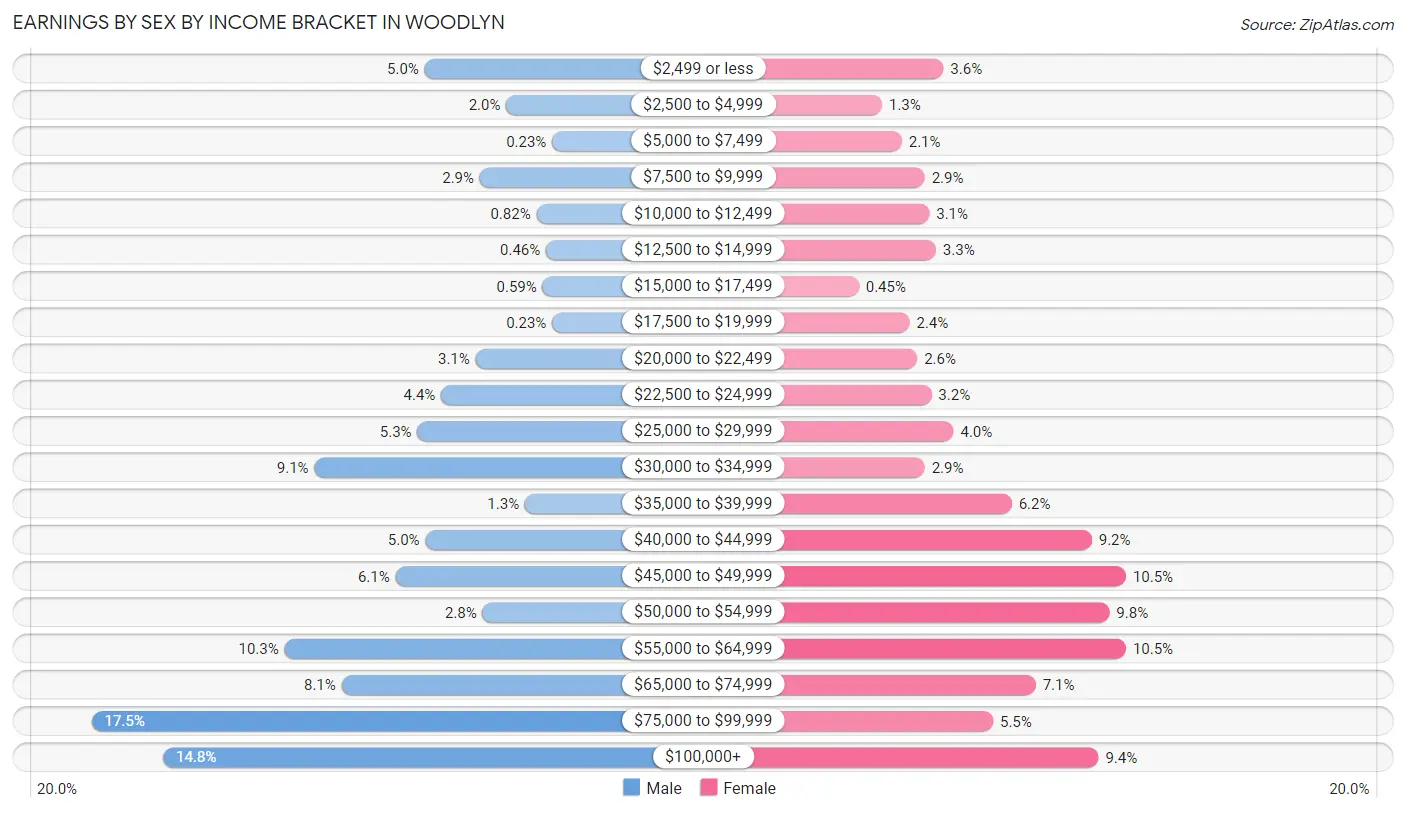
Earnings by Sex by Income Bracket in Woodlyn
The most common earnings brackets in Woodlyn are $75,000 to $99,999 for men (530 | 17.5%) and $45,000 to $49,999 for women (254 | 10.5%).
| Income | Male | Female |
| $2,499 or less | 152 (5.0%) | 88 (3.6%) |
| $2,500 to $4,999 | 59 (1.9%) | 32 (1.3%) |
| $5,000 to $7,499 | 7 (0.2%) | 50 (2.1%) |
| $7,500 to $9,999 | 89 (2.9%) | 71 (2.9%) |
| $10,000 to $12,499 | 25 (0.8%) | 75 (3.1%) |
| $12,500 to $14,999 | 14 (0.5%) | 81 (3.3%) |
| $15,000 to $17,499 | 18 (0.6%) | 11 (0.4%) |
| $17,500 to $19,999 | 7 (0.2%) | 57 (2.4%) |
| $20,000 to $22,499 | 94 (3.1%) | 64 (2.6%) |
| $22,500 to $24,999 | 133 (4.4%) | 77 (3.2%) |
| $25,000 to $29,999 | 160 (5.3%) | 97 (4.0%) |
| $30,000 to $34,999 | 277 (9.1%) | 71 (2.9%) |
| $35,000 to $39,999 | 38 (1.3%) | 150 (6.2%) |
| $40,000 to $44,999 | 151 (5.0%) | 223 (9.2%) |
| $45,000 to $49,999 | 185 (6.1%) | 254 (10.5%) |
| $50,000 to $54,999 | 86 (2.8%) | 239 (9.8%) |
| $55,000 to $64,999 | 311 (10.3%) | 254 (10.5%) |
| $65,000 to $74,999 | 246 (8.1%) | 172 (7.1%) |
| $75,000 to $99,999 | 530 (17.5%) | 133 (5.5%) |
| $100,000+ | 449 (14.8%) | 229 (9.4%) |
| Total | 3,031 (100.0%) | 2,428 (100.0%) |
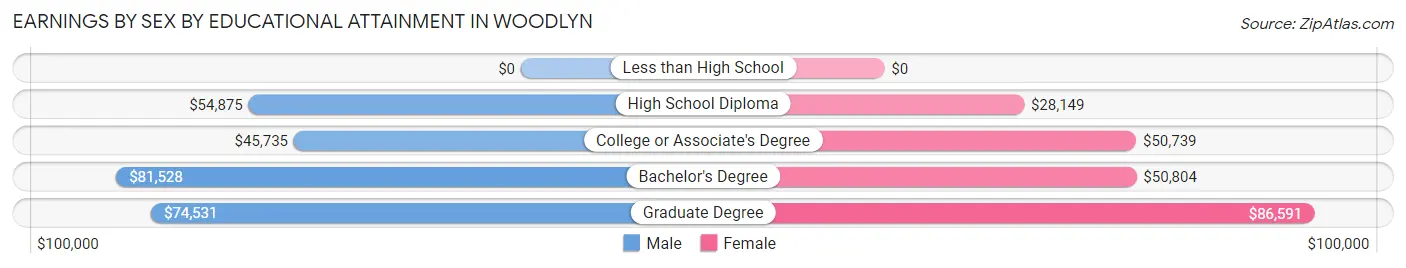
Earnings by Sex by Educational Attainment in Woodlyn
Average earnings in Woodlyn are $57,228 for men and $46,875 for women, a difference of 18.1%. Men with an educational attainment of bachelor's degree enjoy the highest average annual earnings of $81,528, while those with college or associate's degree education earn the least with $45,735. Women with an educational attainment of graduate degree earn the most with the average annual earnings of $86,591, while those with high school diploma education have the smallest earnings of $28,149.
| Educational Attainment | Male Income | Female Income |
| Less than High School | - | - |
| High School Diploma | $54,875 | $28,149 |
| College or Associate's Degree | $45,735 | $50,739 |
| Bachelor's Degree | $81,528 | $50,804 |
| Graduate Degree | $74,531 | $86,591 |
| Total | $57,228 | $46,875 |
Family Income in Woodlyn
Family Income Brackets in Woodlyn
According to the Woodlyn family income data, there are 591 families falling into the $100,000 to $149,999 income range, which is the most common income bracket and makes up 24.4% of all families. Conversely, the less than $10,000 income bracket is the least frequent group with only 2 families (0.1%) belonging to this category.
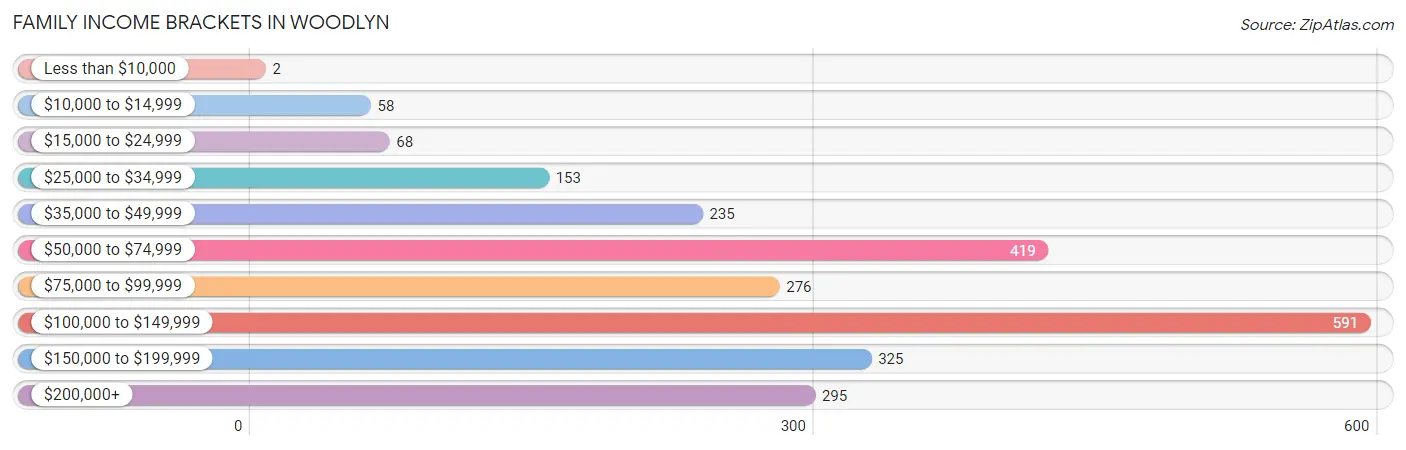
| Income Bracket | # Families | % Families |
| Less than $10,000 | 2 | 0.1% |
| $10,000 to $14,999 | 58 | 2.4% |
| $15,000 to $24,999 | 68 | 2.8% |
| $25,000 to $34,999 | 153 | 6.3% |
| $35,000 to $49,999 | 235 | 9.7% |
| $50,000 to $74,999 | 419 | 17.3% |
| $75,000 to $99,999 | 276 | 11.4% |
| $100,000 to $149,999 | 591 | 24.4% |
| $150,000 to $199,999 | 325 | 13.4% |
| $200,000+ | 295 | 12.2% |
Family Income by Famaliy Size in Woodlyn
4-person families (429 | 17.7%) account for the highest median family income in Woodlyn with $176,406 per family, while 4-person families (429 | 17.7%) have the highest median income of $44,102 per family member.
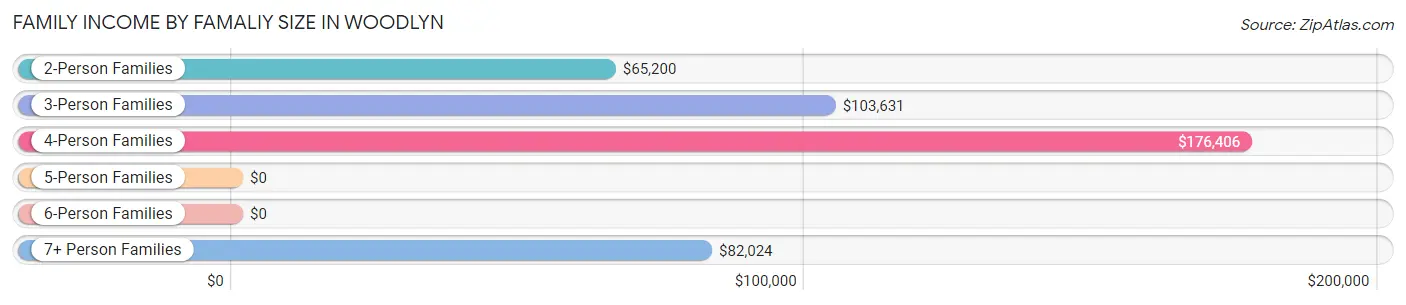
| Income Bracket | # Families | Median Income |
| 2-Person Families | 896 (37.0%) | $65,200 |
| 3-Person Families | 663 (27.4%) | $103,631 |
| 4-Person Families | 429 (17.7%) | $176,406 |
| 5-Person Families | 254 (10.5%) | $0 |
| 6-Person Families | 122 (5.0%) | $0 |
| 7+ Person Families | 58 (2.4%) | $82,024 |
| Total | 2,422 (100.0%) | $100,000 |
Family Income by Number of Earners in Woodlyn
The median family income in Woodlyn is $100,000, with families comprising 3+ earners (461) having the highest median family income of $159,554, while families with no earners (465) have the lowest median family income of $36,268, accounting for 19.0% and 19.2% of families, respectively.
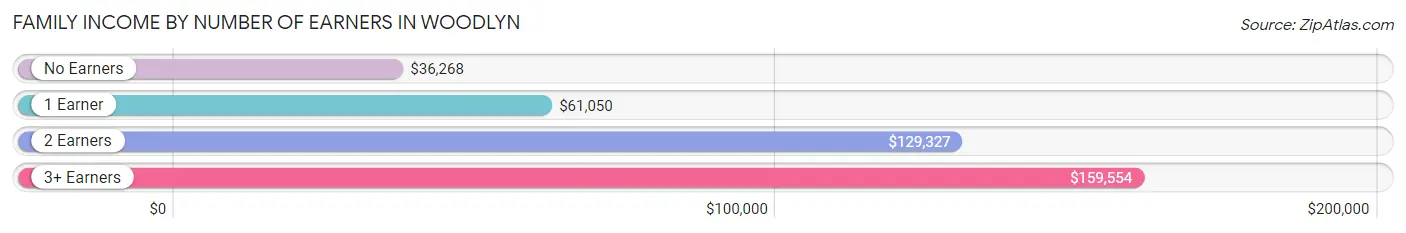
| Number of Earners | # Families | Median Income |
| No Earners | 465 (19.2%) | $36,268 |
| 1 Earner | 591 (24.4%) | $61,050 |
| 2 Earners | 905 (37.4%) | $129,327 |
| 3+ Earners | 461 (19.0%) | $159,554 |
| Total | 2,422 (100.0%) | $100,000 |
Household Income in Woodlyn
Household Income Brackets in Woodlyn
With 916 households falling in the category, the $100,000 to $149,999 income range is the most frequent in Woodlyn, accounting for 22.1% of all households. In contrast, only 166 households (4.0%) fall into the less than $10,000 income bracket, making it the least populous group.
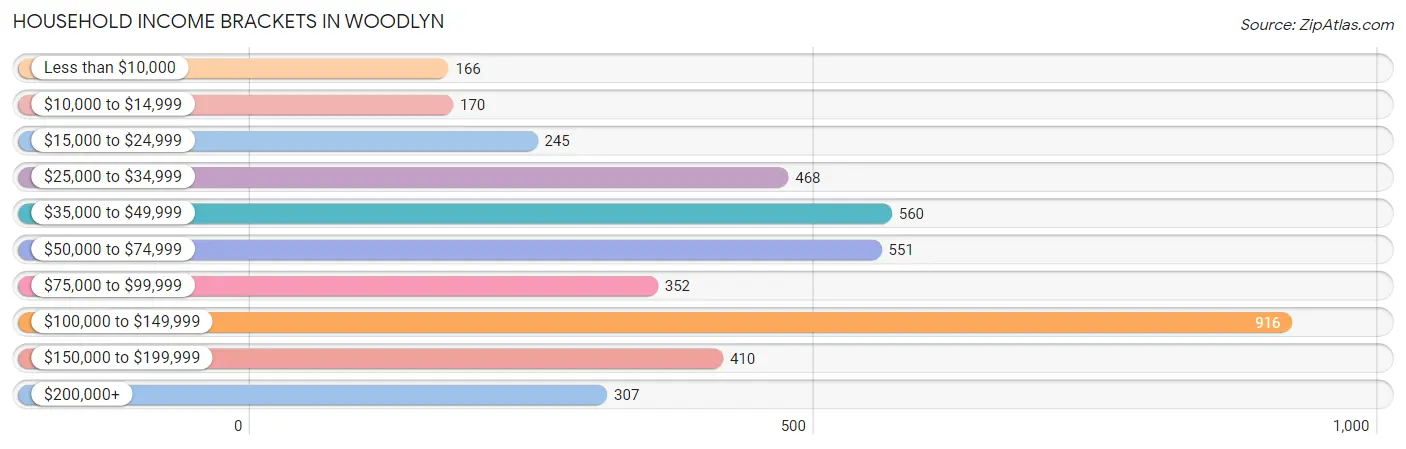
| Income Bracket | # Households | % Households |
| Less than $10,000 | 166 | 4.0% |
| $10,000 to $14,999 | 170 | 4.1% |
| $15,000 to $24,999 | 245 | 5.9% |
| $25,000 to $34,999 | 468 | 11.3% |
| $35,000 to $49,999 | 560 | 13.5% |
| $50,000 to $74,999 | 551 | 13.3% |
| $75,000 to $99,999 | 352 | 8.5% |
| $100,000 to $149,999 | 916 | 22.1% |
| $150,000 to $199,999 | 410 | 9.9% |
| $200,000+ | 307 | 7.4% |
Household Income by Householder Age in Woodlyn
The median household income in Woodlyn is $66,818, with the highest median household income of $115,800 found in the 25 to 44 years age bracket for the primary householder. A total of 1,544 households (37.2%) fall into this category. Meanwhile, the 15 to 24 years age bracket for the primary householder has the lowest median household income of $0, with 55 households (1.3%) in this group.
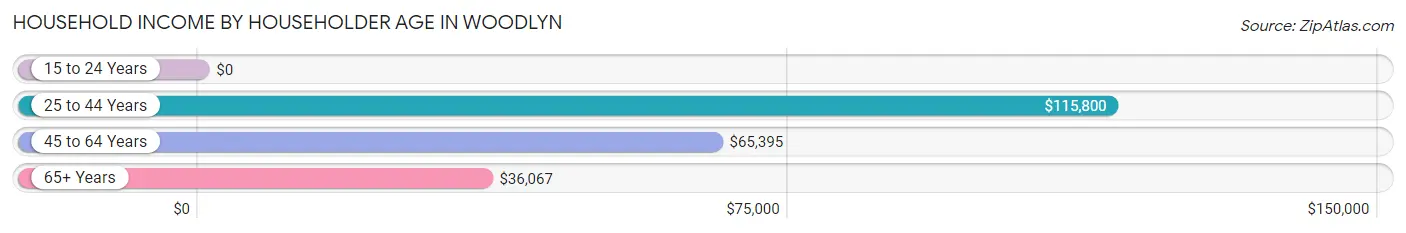
| Income Bracket | # Households | Median Income |
| 15 to 24 Years | 55 (1.3%) | $0 |
| 25 to 44 Years | 1,544 (37.2%) | $115,800 |
| 45 to 64 Years | 1,394 (33.6%) | $65,395 |
| 65+ Years | 1,153 (27.8%) | $36,067 |
| Total | 4,146 (100.0%) | $66,818 |
Poverty in Woodlyn
Income Below Poverty by Sex and Age in Woodlyn
With 5.4% poverty level for males and 7.1% for females among the residents of Woodlyn, 15 year old males and 65 to 74 year old females are the most vulnerable to poverty, with 29 males (33.0%) and 183 females (34.0%) in their respective age groups living below the poverty level.
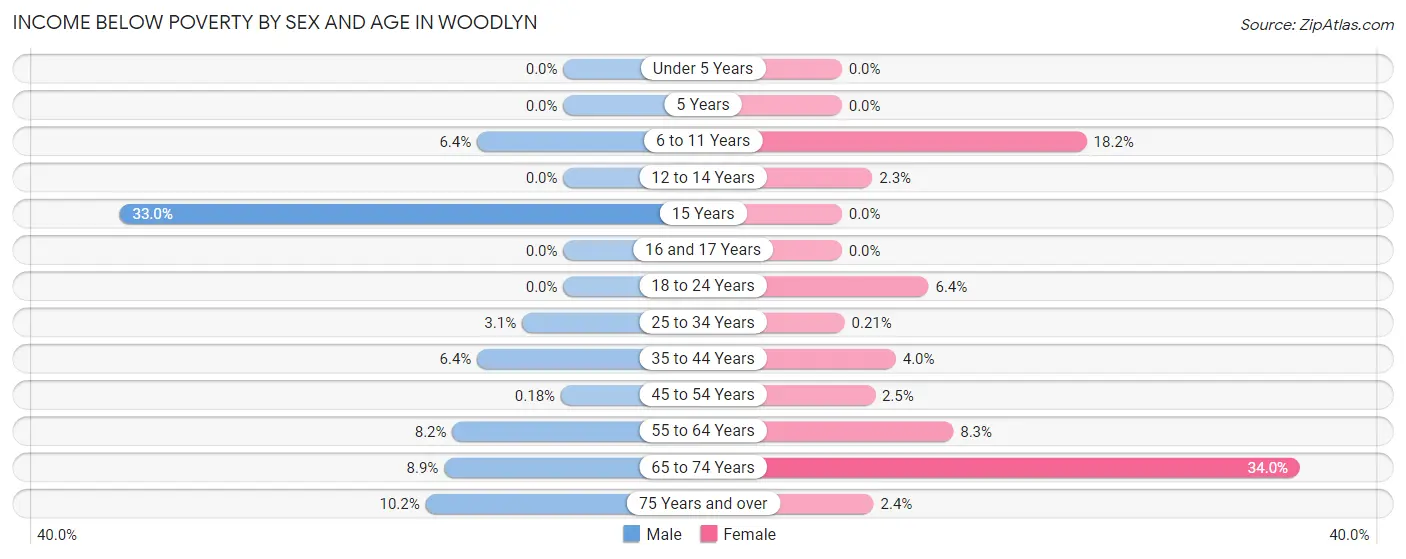
| Age Bracket | Male | Female |
| Under 5 Years | 0 (0.0%) | 0 (0.0%) |
| 5 Years | 0 (0.0%) | 0 (0.0%) |
| 6 to 11 Years | 30 (6.4%) | 40 (18.2%) |
| 12 to 14 Years | 0 (0.0%) | 3 (2.3%) |
| 15 Years | 29 (33.0%) | 0 (0.0%) |
| 16 and 17 Years | 0 (0.0%) | 0 (0.0%) |
| 18 to 24 Years | 0 (0.0%) | 19 (6.4%) |
| 25 to 34 Years | 31 (3.1%) | 2 (0.2%) |
| 35 to 44 Years | 45 (6.4%) | 30 (4.0%) |
| 45 to 54 Years | 1 (0.2%) | 10 (2.5%) |
| 55 to 64 Years | 78 (8.2%) | 61 (8.3%) |
| 65 to 74 Years | 53 (8.8%) | 183 (34.0%) |
| 75 Years and over | 18 (10.2%) | 7 (2.4%) |
| Total | 285 (5.4%) | 355 (7.1%) |
Income Above Poverty by Sex and Age in Woodlyn
According to the poverty statistics in Woodlyn, males aged under 5 years and females aged under 5 years are the age groups that are most secure financially, with 100.0% of males and 100.0% of females in these age groups living above the poverty line.
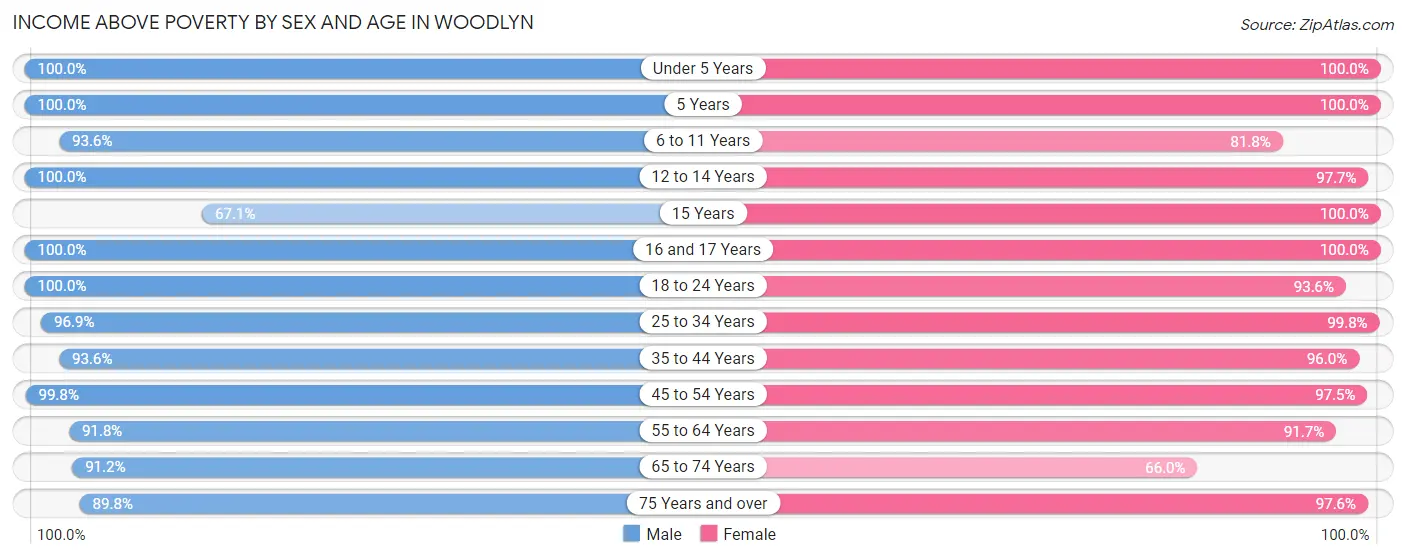
| Age Bracket | Male | Female |
| Under 5 Years | 201 (100.0%) | 322 (100.0%) |
| 5 Years | 20 (100.0%) | 34 (100.0%) |
| 6 to 11 Years | 438 (93.6%) | 180 (81.8%) |
| 12 to 14 Years | 136 (100.0%) | 129 (97.7%) |
| 15 Years | 59 (67.0%) | 230 (100.0%) |
| 16 and 17 Years | 28 (100.0%) | 139 (100.0%) |
| 18 to 24 Years | 322 (100.0%) | 276 (93.6%) |
| 25 to 34 Years | 979 (96.9%) | 930 (99.8%) |
| 35 to 44 Years | 658 (93.6%) | 718 (96.0%) |
| 45 to 54 Years | 553 (99.8%) | 397 (97.5%) |
| 55 to 64 Years | 869 (91.8%) | 676 (91.7%) |
| 65 to 74 Years | 546 (91.1%) | 355 (66.0%) |
| 75 Years and over | 158 (89.8%) | 290 (97.6%) |
| Total | 4,967 (94.6%) | 4,676 (92.9%) |
Income Below Poverty Among Married-Couple Families in Woodlyn
The poverty statistics for married-couple families in Woodlyn show that 3.9% or 74 of the total 1,880 families live below the poverty line. Families with 3 or 4 children have the highest poverty rate of 16.4%, comprising of 27 families. On the other hand, families with 1 or 2 children have the lowest poverty rate of 0.0%, which includes 0 families.
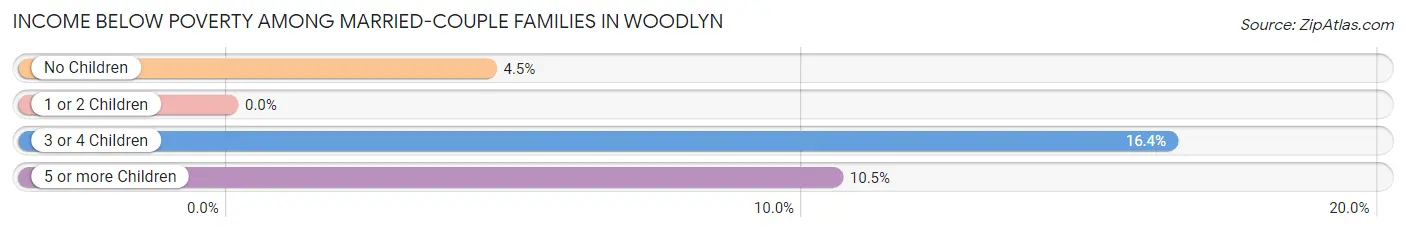
| Children | Above Poverty | Below Poverty |
| No Children | 955 (95.5%) | 45 (4.5%) |
| 1 or 2 Children | 696 (100.0%) | 0 (0.0%) |
| 3 or 4 Children | 138 (83.6%) | 27 (16.4%) |
| 5 or more Children | 17 (89.5%) | 2 (10.5%) |
| Total | 1,806 (96.1%) | 74 (3.9%) |
Income Below Poverty Among Single-Parent Households in Woodlyn
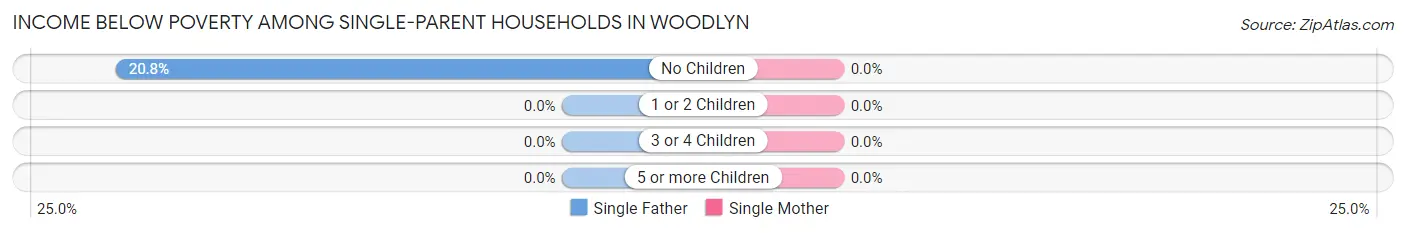
| Children | Single Father | Single Mother |
| No Children | 11 (20.7%) | 0 (0.0%) |
| 1 or 2 Children | 0 (0.0%) | 0 (0.0%) |
| 3 or 4 Children | 0 (0.0%) | 0 (0.0%) |
| 5 or more Children | 0 (0.0%) | 0 (0.0%) |
| Total | 11 (6.8%) | 0 (0.0%) |
Income Below Poverty Among Married-Couple vs Single-Parent Households in Woodlyn
The poverty data for Woodlyn shows that 74 of the married-couple family households (3.9%) and 11 of the single-parent households (2.0%) are living below the poverty level. Within the married-couple family households, those with 3 or 4 children have the highest poverty rate, with 27 households (16.4%) falling below the poverty line. Among the single-parent households, those with no children have the highest poverty rate, with 11 household (4.4%) living below poverty.
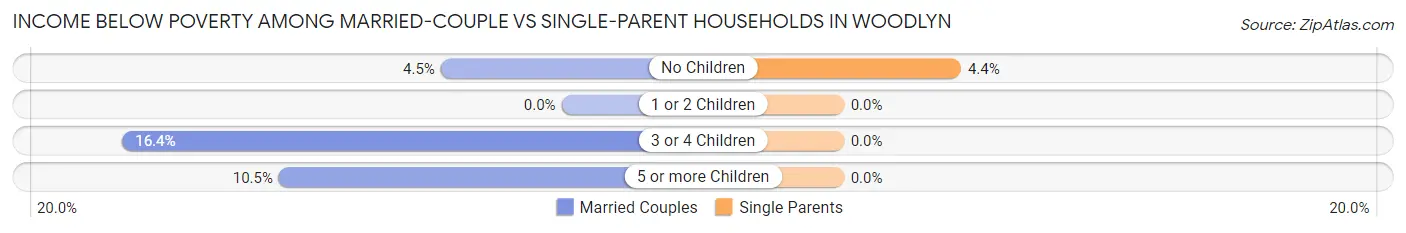
| Children | Married-Couple Families | Single-Parent Households |
| No Children | 45 (4.5%) | 11 (4.4%) |
| 1 or 2 Children | 0 (0.0%) | 0 (0.0%) |
| 3 or 4 Children | 27 (16.4%) | 0 (0.0%) |
| 5 or more Children | 2 (10.5%) | 0 (0.0%) |
| Total | 74 (3.9%) | 11 (2.0%) |
Race in Woodlyn
The most populous races in Woodlyn are White / Caucasian (8,628 | 83.4%), Black / African American (708 | 6.8%), and Hispanic or Latino (631 | 6.1%).
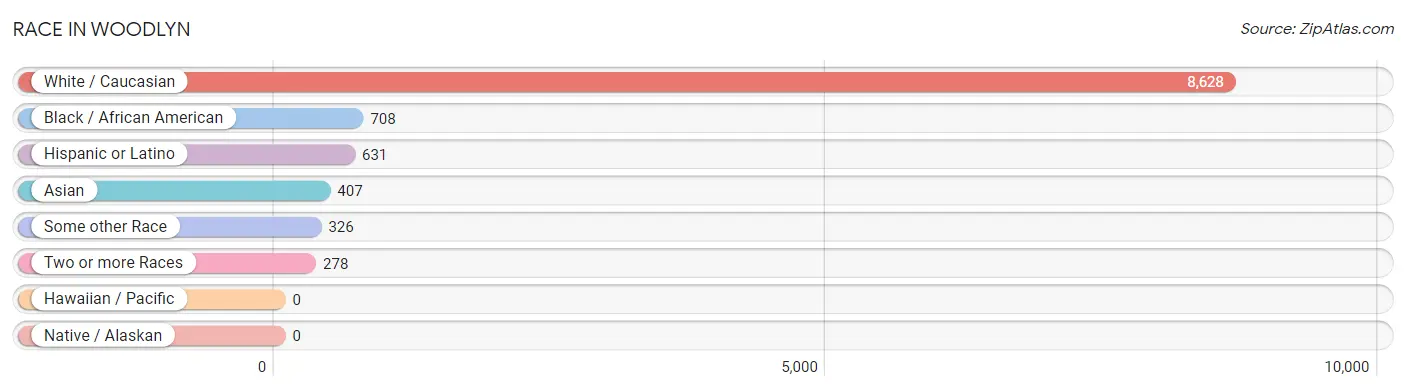
| Race | # Population | % Population |
| Asian | 407 | 3.9% |
| Black / African American | 708 | 6.8% |
| Hawaiian / Pacific | 0 | 0.0% |
| Hispanic or Latino | 631 | 6.1% |
| Native / Alaskan | 0 | 0.0% |
| White / Caucasian | 8,628 | 83.4% |
| Two or more Races | 278 | 2.7% |
| Some other Race | 326 | 3.2% |
| Total | 10,347 | 100.0% |
Ancestry in Woodlyn
The most populous ancestries reported in Woodlyn are Irish (3,158 | 30.5%), Italian (2,473 | 23.9%), German (1,169 | 11.3%), English (1,059 | 10.2%), and Polish (504 | 4.9%), together accounting for 80.8% of all Woodlyn residents.
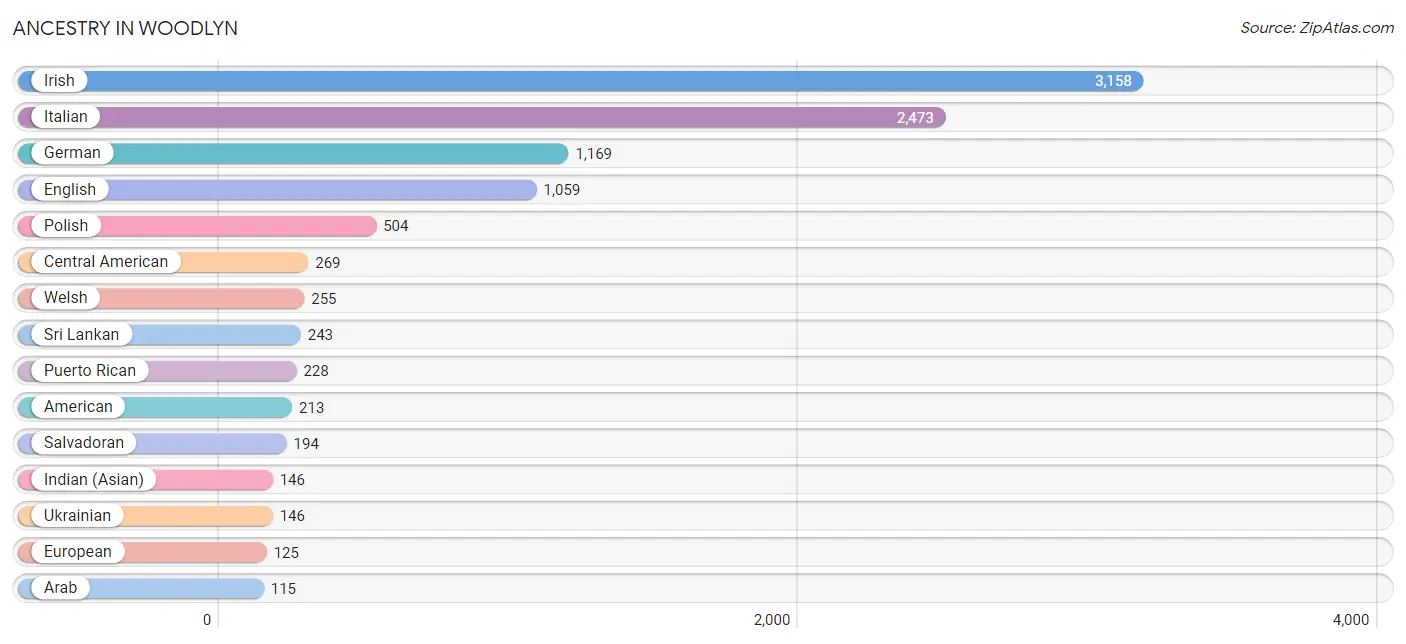
| Ancestry | # Population | % Population |
| African | 97 | 0.9% |
| Alaska Native | 15 | 0.1% |
| Albanian | 7 | 0.1% |
| American | 213 | 2.1% |
| Arab | 115 | 1.1% |
| Barbadian | 9 | 0.1% |
| Blackfeet | 12 | 0.1% |
| British | 55 | 0.5% |
| Central American | 269 | 2.6% |
| Costa Rican | 75 | 0.7% |
| Dominican | 38 | 0.4% |
| Dutch | 17 | 0.2% |
| Eastern European | 28 | 0.3% |
| Ecuadorian | 33 | 0.3% |
| English | 1,059 | 10.2% |
| European | 125 | 1.2% |
| French | 109 | 1.1% |
| German | 1,169 | 11.3% |
| Indian (Asian) | 146 | 1.4% |
| Irish | 3,158 | 30.5% |
| Italian | 2,473 | 23.9% |
| Jamaican | 7 | 0.1% |
| Korean | 12 | 0.1% |
| Lebanese | 115 | 1.1% |
| Luxembourger | 33 | 0.3% |
| Mexican | 62 | 0.6% |
| Northern European | 15 | 0.1% |
| Norwegian | 86 | 0.8% |
| Pennsylvania German | 50 | 0.5% |
| Polish | 504 | 4.9% |
| Puerto Rican | 228 | 2.2% |
| Romanian | 42 | 0.4% |
| Russian | 113 | 1.1% |
| Salvadoran | 194 | 1.9% |
| Scotch-Irish | 55 | 0.5% |
| Scottish | 75 | 0.7% |
| Slavic | 29 | 0.3% |
| South American | 33 | 0.3% |
| Sri Lankan | 243 | 2.4% |
| Subsaharan African | 97 | 0.9% |
| Swedish | 74 | 0.7% |
| Swiss | 13 | 0.1% |
| Thai | 4 | 0.0% |
| Ukrainian | 146 | 1.4% |
| Welsh | 255 | 2.5% |
| West Indian | 9 | 0.1% | View All 46 Rows |
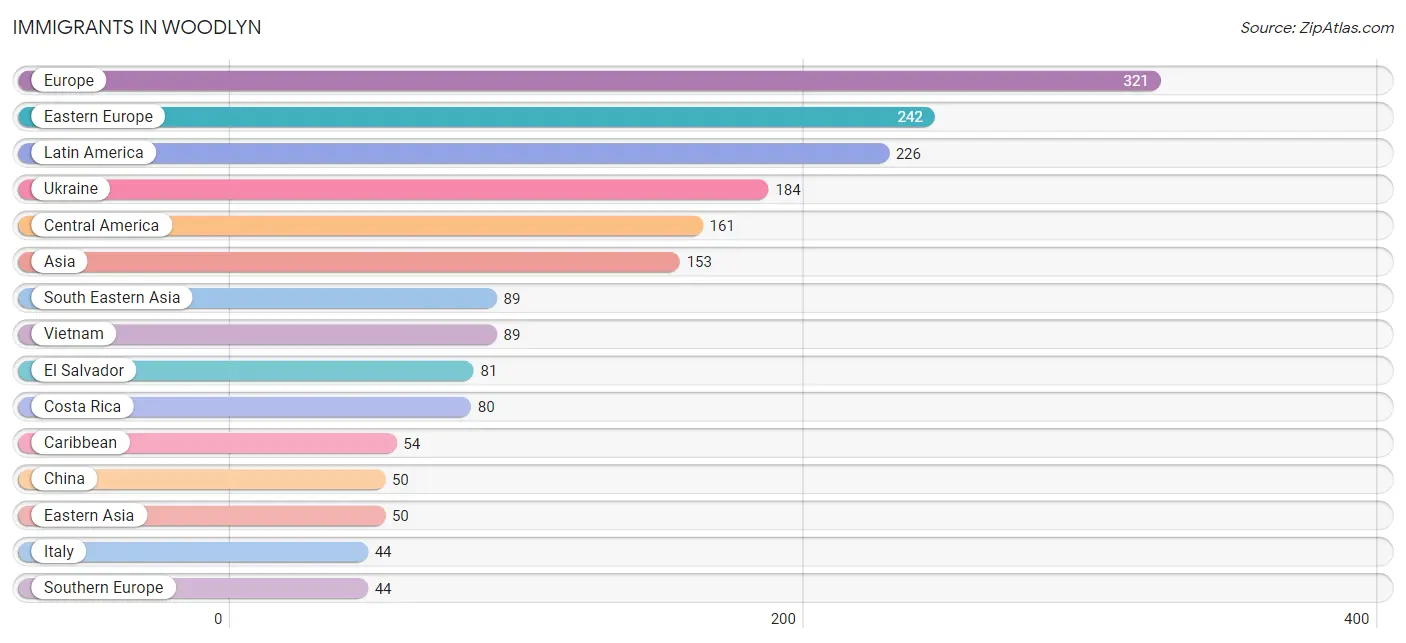
Immigrants in Woodlyn
The most numerous immigrant groups reported in Woodlyn came from Europe (321 | 3.1%), Eastern Europe (242 | 2.3%), Latin America (226 | 2.2%), Ukraine (184 | 1.8%), and Central America (161 | 1.6%), together accounting for 11.0% of all Woodlyn residents.
| Immigration Origin | # Population | % Population |
| Africa | 4 | 0.0% |
| Argentina | 11 | 0.1% |
| Asia | 153 | 1.5% |
| Barbados | 9 | 0.1% |
| Belarus | 21 | 0.2% |
| Caribbean | 54 | 0.5% |
| Central America | 161 | 1.6% |
| China | 50 | 0.5% |
| Costa Rica | 80 | 0.8% |
| Dominican Republic | 38 | 0.4% |
| Eastern Africa | 4 | 0.0% |
| Eastern Asia | 50 | 0.5% |
| Eastern Europe | 242 | 2.3% |
| El Salvador | 81 | 0.8% |
| England | 20 | 0.2% |
| Europe | 321 | 3.1% |
| India | 14 | 0.1% |
| Italy | 44 | 0.4% |
| Jamaica | 7 | 0.1% |
| Kenya | 3 | 0.0% |
| Latin America | 226 | 2.2% |
| Northern Europe | 20 | 0.2% |
| Poland | 20 | 0.2% |
| Romania | 17 | 0.2% |
| South America | 11 | 0.1% |
| South Central Asia | 14 | 0.1% |
| South Eastern Asia | 89 | 0.9% |
| Southern Europe | 44 | 0.4% |
| Ukraine | 184 | 1.8% |
| Vietnam | 89 | 0.9% |
| Western Europe | 15 | 0.1% | View All 31 Rows |
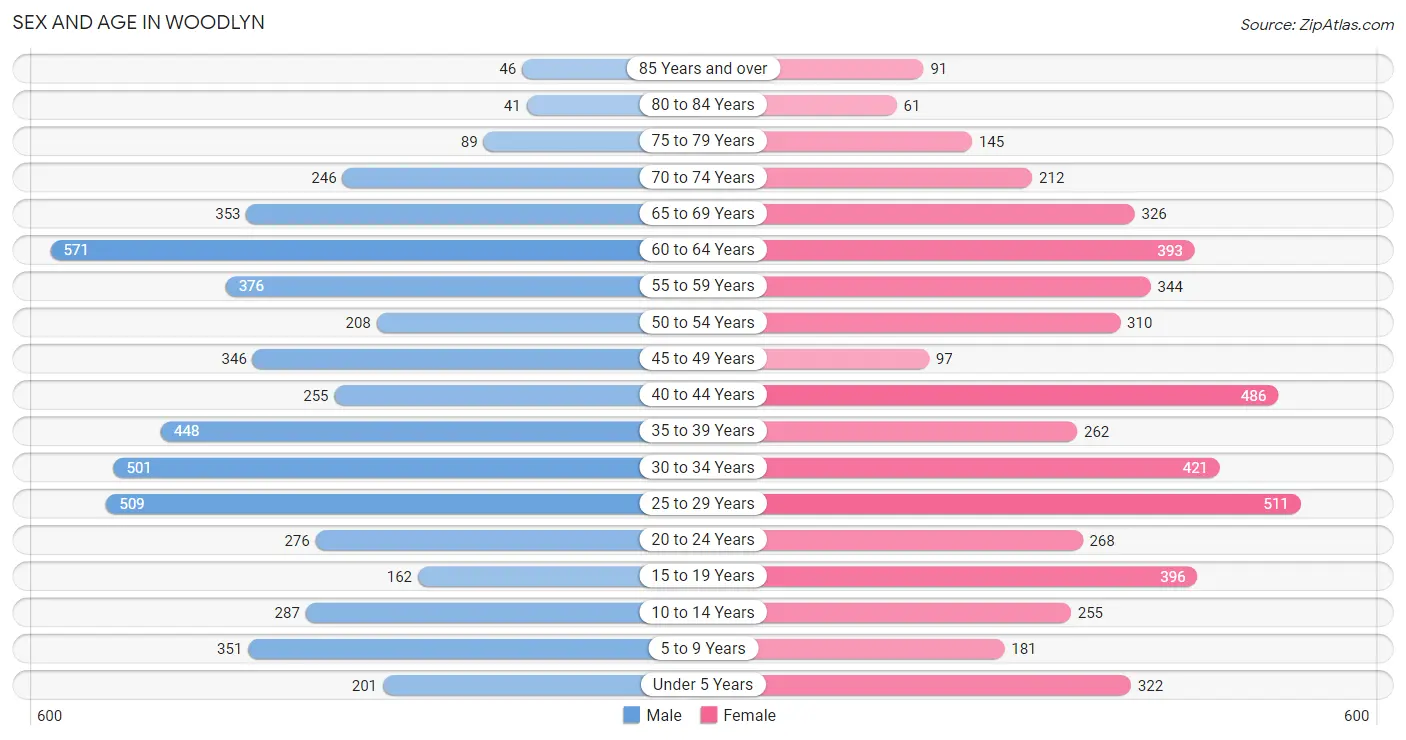
Sex and Age in Woodlyn
Sex and Age in Woodlyn
The most populous age groups in Woodlyn are 60 to 64 Years (571 | 10.8%) for men and 25 to 29 Years (511 | 10.1%) for women.
| Age Bracket | Male | Female |
| Under 5 Years | 201 (3.8%) | 322 (6.3%) |
| 5 to 9 Years | 351 (6.7%) | 181 (3.6%) |
| 10 to 14 Years | 287 (5.4%) | 255 (5.0%) |
| 15 to 19 Years | 162 (3.1%) | 396 (7.8%) |
| 20 to 24 Years | 276 (5.2%) | 268 (5.3%) |
| 25 to 29 Years | 509 (9.7%) | 511 (10.1%) |
| 30 to 34 Years | 501 (9.5%) | 421 (8.3%) |
| 35 to 39 Years | 448 (8.5%) | 262 (5.2%) |
| 40 to 44 Years | 255 (4.8%) | 486 (9.6%) |
| 45 to 49 Years | 346 (6.6%) | 97 (1.9%) |
| 50 to 54 Years | 208 (4.0%) | 310 (6.1%) |
| 55 to 59 Years | 376 (7.1%) | 344 (6.8%) |
| 60 to 64 Years | 571 (10.8%) | 393 (7.7%) |
| 65 to 69 Years | 353 (6.7%) | 326 (6.4%) |
| 70 to 74 Years | 246 (4.7%) | 212 (4.2%) |
| 75 to 79 Years | 89 (1.7%) | 145 (2.9%) |
| 80 to 84 Years | 41 (0.8%) | 61 (1.2%) |
| 85 Years and over | 46 (0.9%) | 91 (1.8%) |
| Total | 5,266 (100.0%) | 5,081 (100.0%) |
Families and Households in Woodlyn
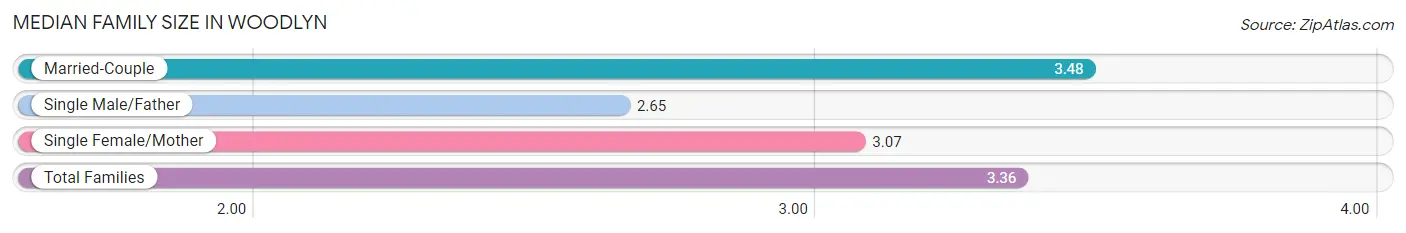
Median Family Size in Woodlyn
The median family size in Woodlyn is 3.36 persons per family, with married-couple families (1,880 | 77.6%) accounting for the largest median family size of 3.48 persons per family. On the other hand, single male/father families (162 | 6.7%) represent the smallest median family size with 2.65 persons per family.
| Family Type | # Families | Family Size |
| Married-Couple | 1,880 (77.6%) | 3.48 |
| Single Male/Father | 162 (6.7%) | 2.65 |
| Single Female/Mother | 380 (15.7%) | 3.07 |
| Total Families | 2,422 (100.0%) | 3.36 |
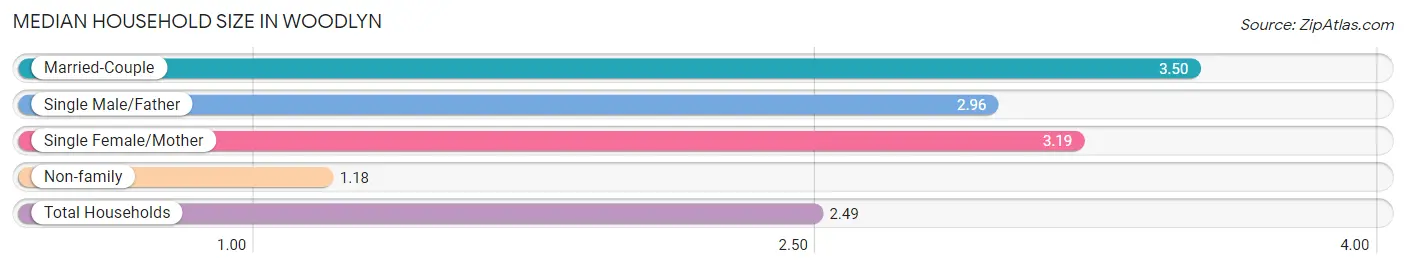
Median Household Size in Woodlyn
The median household size in Woodlyn is 2.49 persons per household, with married-couple households (1,880 | 45.3%) accounting for the largest median household size of 3.5 persons per household. non-family households (1,724 | 41.6%) represent the smallest median household size with 1.18 persons per household.
| Household Type | # Households | Household Size |
| Married-Couple | 1,880 (45.3%) | 3.50 |
| Single Male/Father | 162 (3.9%) | 2.96 |
| Single Female/Mother | 380 (9.2%) | 3.19 |
| Non-family | 1,724 (41.6%) | 1.18 |
| Total Households | 4,146 (100.0%) | 2.49 |
Household Size by Marriage Status in Woodlyn
Out of a total of 4,146 households in Woodlyn, 2,422 (58.4%) are family households, while 1,724 (41.6%) are nonfamily households. The most numerous type of family households are 2-person households, comprising 850, and the most common type of nonfamily households are 1-person households, comprising 1,469.
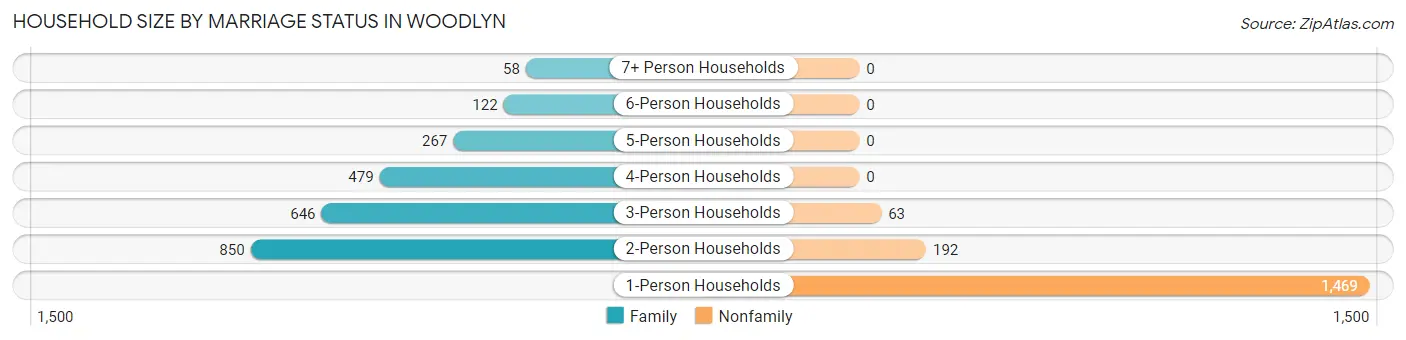
| Household Size | Family Households | Nonfamily Households |
| 1-Person Households | - | 1,469 (35.4%) |
| 2-Person Households | 850 (20.5%) | 192 (4.6%) |
| 3-Person Households | 646 (15.6%) | 63 (1.5%) |
| 4-Person Households | 479 (11.6%) | 0 (0.0%) |
| 5-Person Households | 267 (6.4%) | 0 (0.0%) |
| 6-Person Households | 122 (2.9%) | 0 (0.0%) |
| 7+ Person Households | 58 (1.4%) | 0 (0.0%) |
| Total | 2,422 (58.4%) | 1,724 (41.6%) |
Female Fertility in Woodlyn
Fertility by Age in Woodlyn
Average fertility rate in Woodlyn is 32.0 births per 1,000 women. Women in the age bracket of 20 to 34 years have the highest fertility rate with 55.0 births per 1,000 women. Women in the age bracket of 20 to 34 years acount for 83.5% of all women with births.
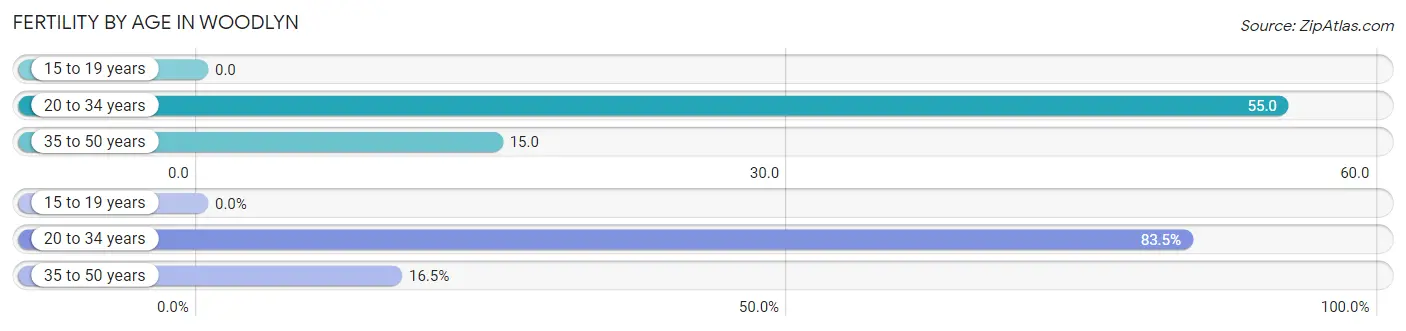
| Age Bracket | Women with Births | Births / 1,000 Women |
| 15 to 19 years | 0 (0.0%) | 0.0 |
| 20 to 34 years | 66 (83.5%) | 55.0 |
| 35 to 50 years | 13 (16.5%) | 15.0 |
| Total | 79 (100.0%) | 32.0 |
Fertility by Age by Marriage Status in Woodlyn
40.5% of women with births (79) in Woodlyn are married. The highest percentage of unmarried women with births falls into 20 to 34 years age bracket with 69.7% of them unmarried at the time of birth, while the lowest percentage of unmarried women with births belong to 35 to 50 years age bracket with 7.7% of them unmarried.
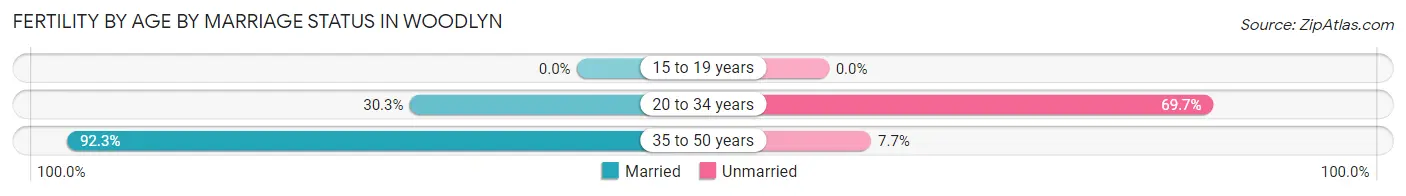
| Age Bracket | Married | Unmarried |
| 15 to 19 years | 0 (0.0%) | 0 (0.0%) |
| 20 to 34 years | 20 (30.3%) | 46 (69.7%) |
| 35 to 50 years | 12 (92.3%) | 1 (7.7%) |
| Total | 32 (40.5%) | 47 (59.5%) |
Fertility by Education in Woodlyn
Average fertility rate in Woodlyn is 32.0 births per 1,000 women. Women with the education attainment of graduate degree have the highest fertility rate of 69.0 births per 1,000 women, while women with the education attainment of less than high school have the lowest fertility at 2.0 births per 1,000 women. Women with the education attainment of bachelor's degree represent 29.1% of all women with births.
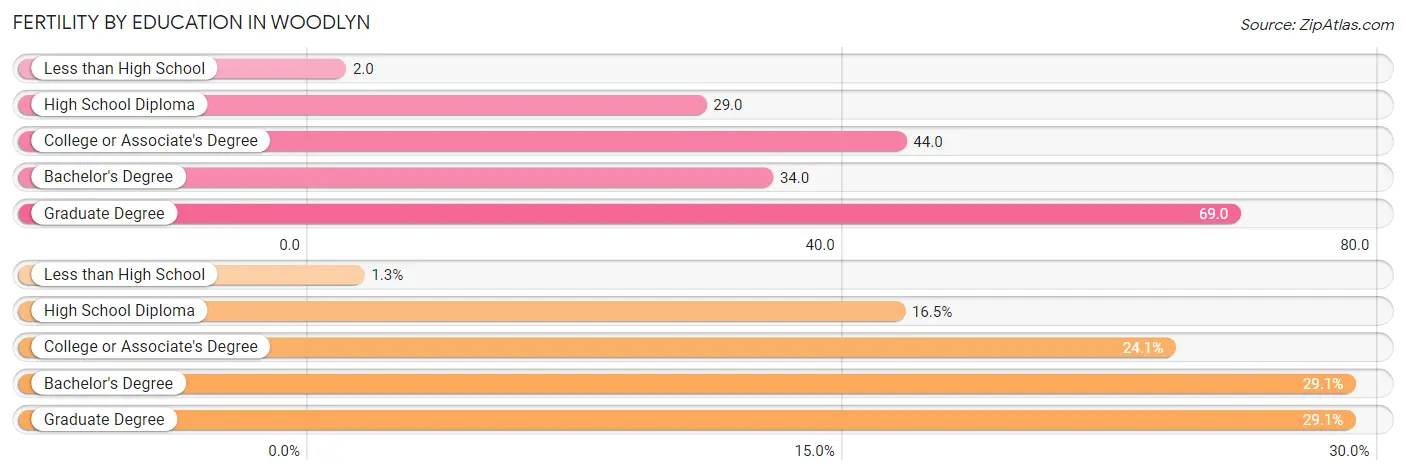
| Educational Attainment | Women with Births | Births / 1,000 Women |
| Less than High School | 1 (1.3%) | 2.0 |
| High School Diploma | 13 (16.5%) | 29.0 |
| College or Associate's Degree | 19 (24.0%) | 44.0 |
| Bachelor's Degree | 23 (29.1%) | 34.0 |
| Graduate Degree | 23 (29.1%) | 69.0 |
| Total | 79 (100.0%) | 32.0 |
Fertility by Education by Marriage Status in Woodlyn
59.5% of women with births in Woodlyn are unmarried. Women with the educational attainment of graduate degree are most likely to be married with 100.0% of them married at childbirth, while women with the educational attainment of less than high school are least likely to be married with 100.0% of them unmarried at childbirth.
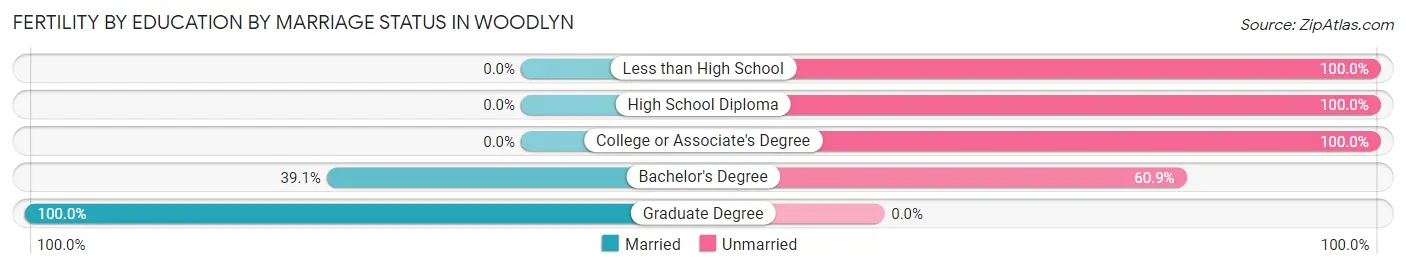
| Educational Attainment | Married | Unmarried |
| Less than High School | 0 (0.0%) | 1 (100.0%) |
| High School Diploma | 0 (0.0%) | 13 (100.0%) |
| College or Associate's Degree | 0 (0.0%) | 19 (100.0%) |
| Bachelor's Degree | 9 (39.1%) | 14 (60.9%) |
| Graduate Degree | 23 (100.0%) | 0 (0.0%) |
| Total | 32 (40.5%) | 47 (59.5%) |
Employment Characteristics in Woodlyn
Employment by Class of Employer in Woodlyn
Among the 5,070 employed individuals in Woodlyn, private company employees (3,408 | 67.2%), not-for-profit organizations (655 | 12.9%), and local government employees (473 | 9.3%) make up the most common classes of employment.
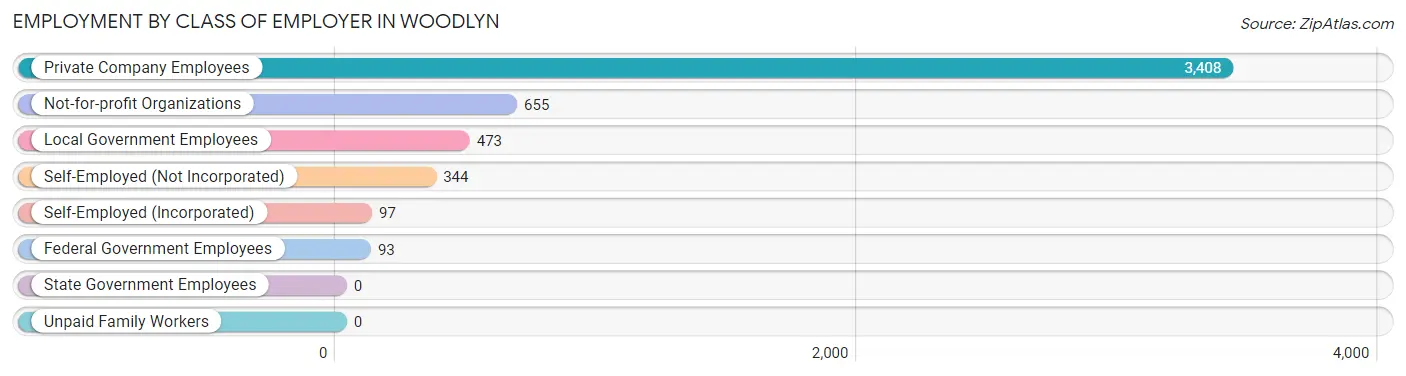
| Employer Class | # Employees | % Employees |
| Private Company Employees | 3,408 | 67.2% |
| Self-Employed (Incorporated) | 97 | 1.9% |
| Self-Employed (Not Incorporated) | 344 | 6.8% |
| Not-for-profit Organizations | 655 | 12.9% |
| Local Government Employees | 473 | 9.3% |
| State Government Employees | 0 | 0.0% |
| Federal Government Employees | 93 | 1.8% |
| Unpaid Family Workers | 0 | 0.0% |
| Total | 5,070 | 100.0% |
Employment Status by Age in Woodlyn
According to the labor force statistics for Woodlyn, out of the total population over 16 years of age (8,432), 64.2% or 5,413 individuals are in the labor force, with 5.1% or 276 of them unemployed. The age group with the highest labor force participation rate is 30 to 34 years, with 89.3% or 823 individuals in the labor force. Within the labor force, the 20 to 24 years age range has the highest percentage of unemployed individuals, with 29.5% or 105 of them being unemployed.
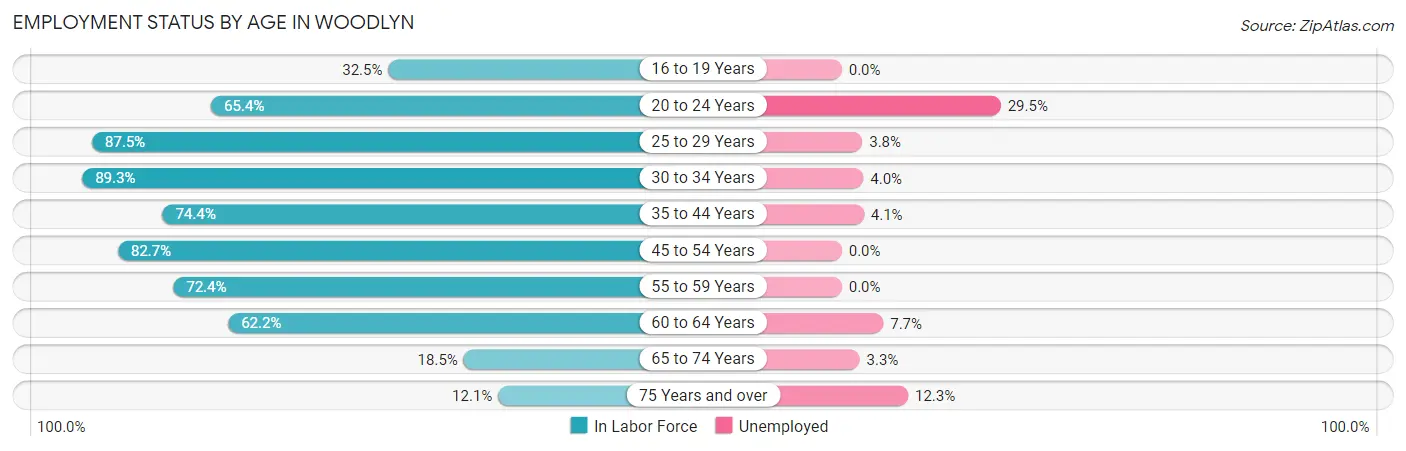
| Age Bracket | In Labor Force | Unemployed |
| 16 to 19 Years | 78 (32.5%) | 0 (0.0%) |
| 20 to 24 Years | 356 (65.4%) | 105 (29.5%) |
| 25 to 29 Years | 892 (87.5%) | 34 (3.8%) |
| 30 to 34 Years | 823 (89.3%) | 33 (4.0%) |
| 35 to 44 Years | 1,080 (74.4%) | 44 (4.1%) |
| 45 to 54 Years | 795 (82.7%) | 0 (0.0%) |
| 55 to 59 Years | 521 (72.4%) | 0 (0.0%) |
| 60 to 64 Years | 600 (62.2%) | 46 (7.7%) |
| 65 to 74 Years | 210 (18.5%) | 7 (3.3%) |
| 75 Years and over | 57 (12.1%) | 7 (12.3%) |
| Total | 5,413 (64.2%) | 276 (5.1%) |
Employment Status by Educational Attainment in Woodlyn
According to labor force statistics for Woodlyn, 78.0% of individuals (4,710) out of the total population between 25 and 64 years of age (6,038) are in the labor force, with 3.3% or 155 of them being unemployed. The group with the highest labor force participation rate are those with the educational attainment of bachelor's degree or higher, with 93.1% or 1,918 individuals in the labor force. Within the labor force, individuals with high school diploma education have the highest percentage of unemployment, with 5.7% or 89 of them being unemployed.
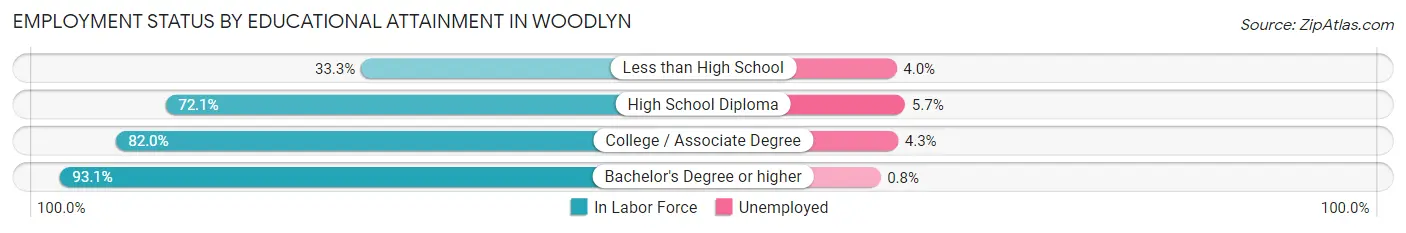
| Educational Attainment | In Labor Force | Unemployed |
| Less than High School | 173 (33.3%) | 21 (4.0%) |
| High School Diploma | 1,570 (72.1%) | 124 (5.7%) |
| College / Associate Degree | 1,050 (82.0%) | 55 (4.3%) |
| Bachelor's Degree or higher | 1,918 (93.1%) | 16 (0.8%) |
| Total | 4,710 (78.0%) | 199 (3.3%) |
Employment Occupations by Sex in Woodlyn
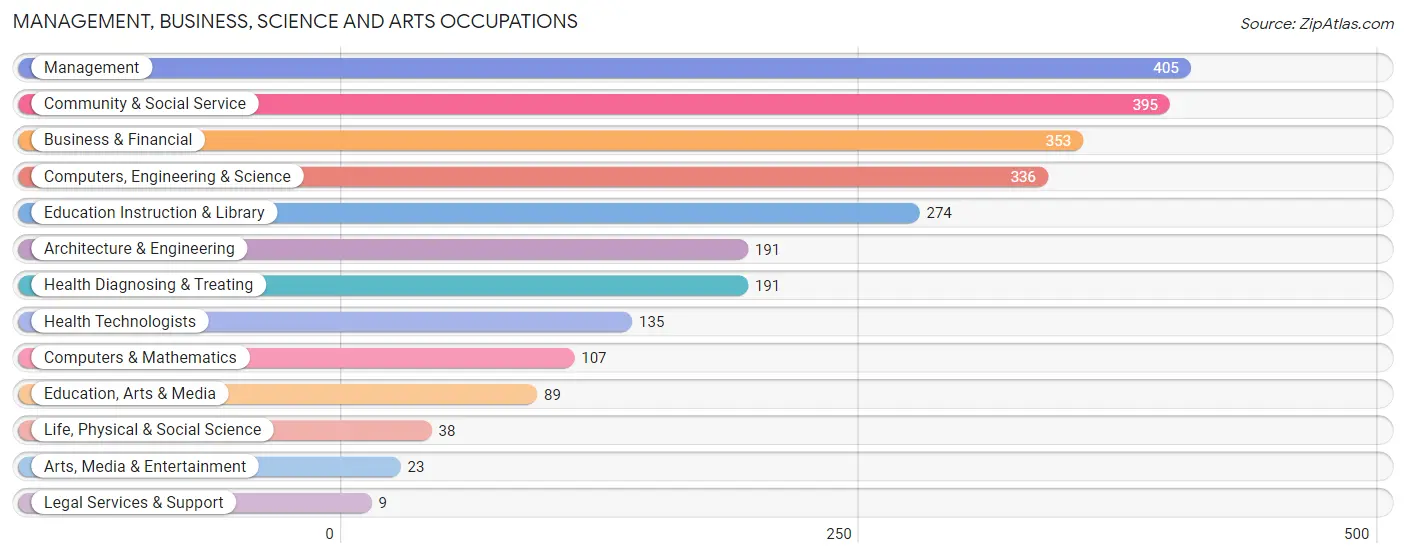
Management, Business, Science and Arts Occupations
The most common Management, Business, Science and Arts occupations in Woodlyn are Management (405 | 7.9%), Community & Social Service (395 | 7.7%), Business & Financial (353 | 6.9%), Computers, Engineering & Science (336 | 6.5%), and Education Instruction & Library (274 | 5.3%).
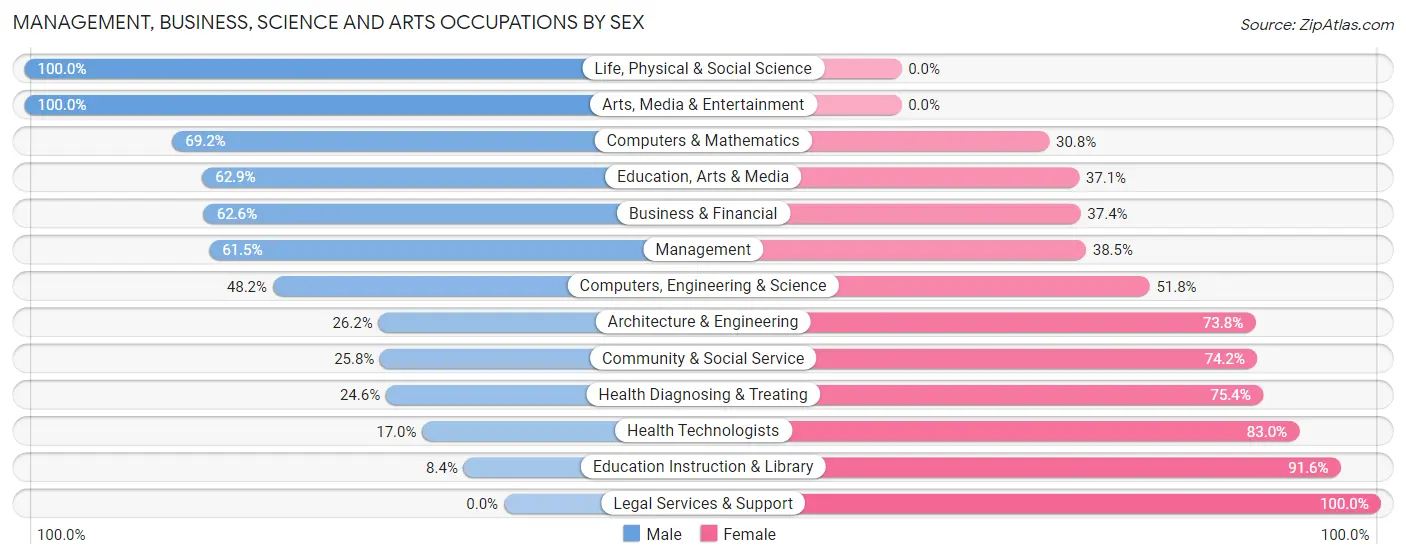
Management, Business, Science and Arts Occupations by Sex
Within the Management, Business, Science and Arts occupations in Woodlyn, the most male-oriented occupations are Life, Physical & Social Science (100.0%), Arts, Media & Entertainment (100.0%), and Computers & Mathematics (69.2%), while the most female-oriented occupations are Legal Services & Support (100.0%), Education Instruction & Library (91.6%), and Health Technologists (83.0%).
| Occupation | Male | Female |
| Management | 249 (61.5%) | 156 (38.5%) |
| Business & Financial | 221 (62.6%) | 132 (37.4%) |
| Computers, Engineering & Science | 162 (48.2%) | 174 (51.8%) |
| Computers & Mathematics | 74 (69.2%) | 33 (30.8%) |
| Architecture & Engineering | 50 (26.2%) | 141 (73.8%) |
| Life, Physical & Social Science | 38 (100.0%) | 0 (0.0%) |
| Community & Social Service | 102 (25.8%) | 293 (74.2%) |
| Education, Arts & Media | 56 (62.9%) | 33 (37.1%) |
| Legal Services & Support | 0 (0.0%) | 9 (100.0%) |
| Education Instruction & Library | 23 (8.4%) | 251 (91.6%) |
| Arts, Media & Entertainment | 23 (100.0%) | 0 (0.0%) |
| Health Diagnosing & Treating | 47 (24.6%) | 144 (75.4%) |
| Health Technologists | 23 (17.0%) | 112 (83.0%) |
| Total (Category) | 781 (46.5%) | 899 (53.5%) |
| Total (Overall) | 2,925 (57.0%) | 2,211 (43.0%) |
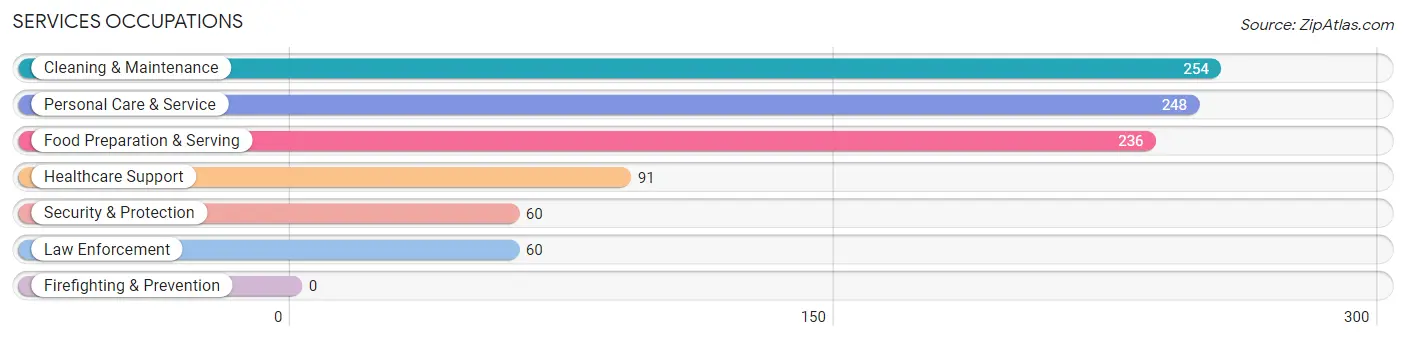
Services Occupations
The most common Services occupations in Woodlyn are Cleaning & Maintenance (254 | 5.0%), Personal Care & Service (248 | 4.8%), Food Preparation & Serving (236 | 4.6%), Healthcare Support (91 | 1.8%), and Security & Protection (60 | 1.2%).
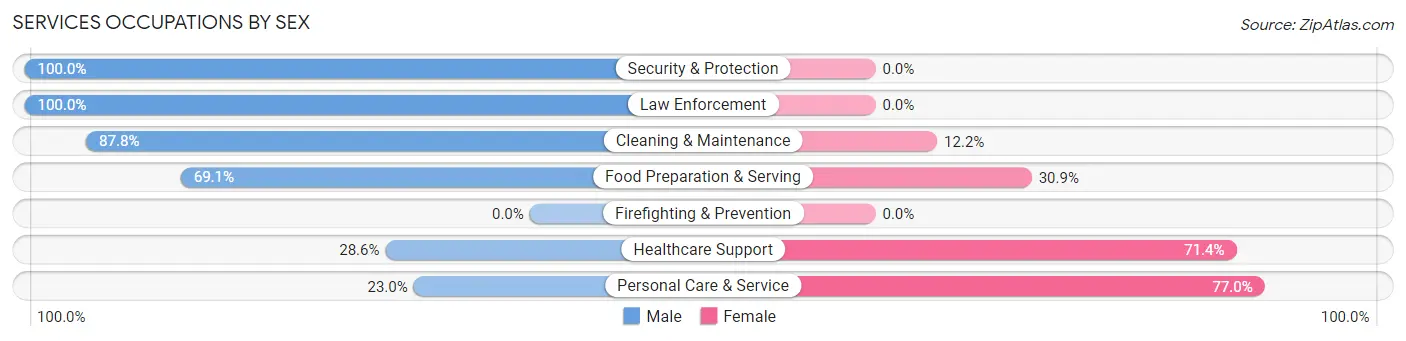
Services Occupations by Sex
Within the Services occupations in Woodlyn, the most male-oriented occupations are Security & Protection (100.0%), Law Enforcement (100.0%), and Cleaning & Maintenance (87.8%), while the most female-oriented occupations are Personal Care & Service (77.0%), Healthcare Support (71.4%), and Food Preparation & Serving (30.9%).
| Occupation | Male | Female |
| Healthcare Support | 26 (28.6%) | 65 (71.4%) |
| Security & Protection | 60 (100.0%) | 0 (0.0%) |
| Firefighting & Prevention | 0 (0.0%) | 0 (0.0%) |
| Law Enforcement | 60 (100.0%) | 0 (0.0%) |
| Food Preparation & Serving | 163 (69.1%) | 73 (30.9%) |
| Cleaning & Maintenance | 223 (87.8%) | 31 (12.2%) |
| Personal Care & Service | 57 (23.0%) | 191 (77.0%) |
| Total (Category) | 529 (59.5%) | 360 (40.5%) |
| Total (Overall) | 2,925 (57.0%) | 2,211 (43.0%) |
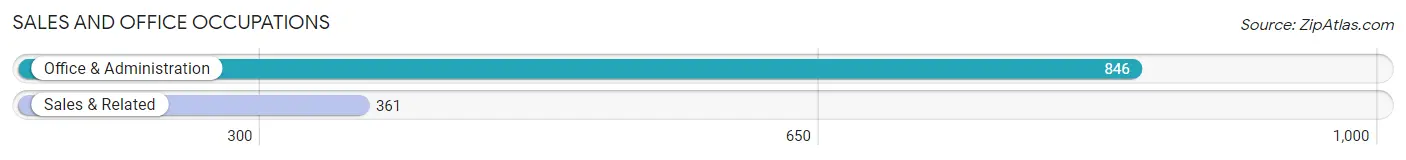
Sales and Office Occupations
The most common Sales and Office occupations in Woodlyn are Office & Administration (846 | 16.5%), and Sales & Related (361 | 7.0%).
Sales and Office Occupations by Sex
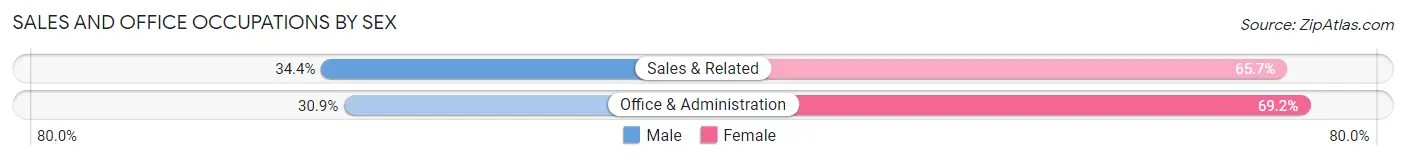
| Occupation | Male | Female |
| Sales & Related | 124 (34.4%) | 237 (65.6%) |
| Office & Administration | 261 (30.8%) | 585 (69.2%) |
| Total (Category) | 385 (31.9%) | 822 (68.1%) |
| Total (Overall) | 2,925 (57.0%) | 2,211 (43.0%) |
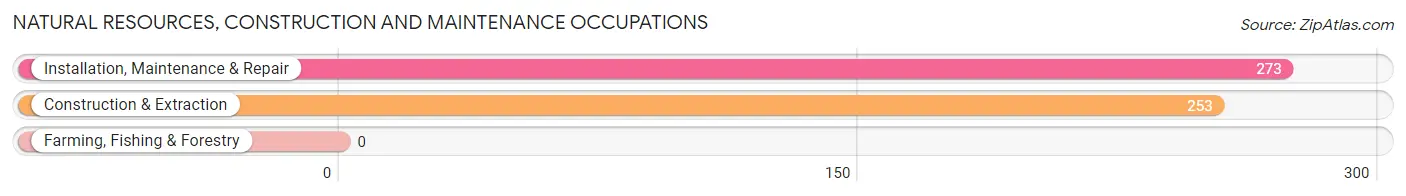
Natural Resources, Construction and Maintenance Occupations
The most common Natural Resources, Construction and Maintenance occupations in Woodlyn are Installation, Maintenance & Repair (273 | 5.3%), and Construction & Extraction (253 | 4.9%).
Natural Resources, Construction and Maintenance Occupations by Sex
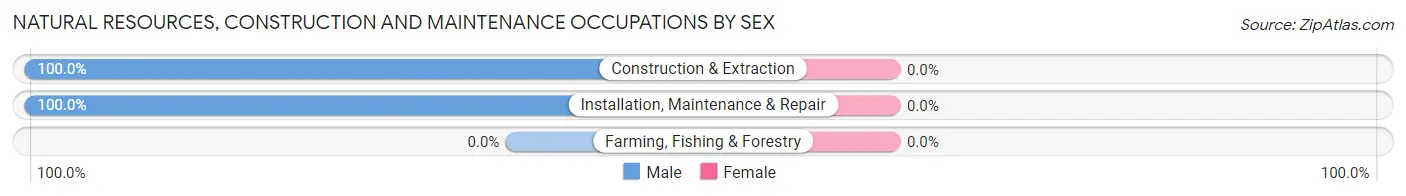
| Occupation | Male | Female |
| Farming, Fishing & Forestry | 0 (0.0%) | 0 (0.0%) |
| Construction & Extraction | 253 (100.0%) | 0 (0.0%) |
| Installation, Maintenance & Repair | 273 (100.0%) | 0 (0.0%) |
| Total (Category) | 526 (100.0%) | 0 (0.0%) |
| Total (Overall) | 2,925 (57.0%) | 2,211 (43.0%) |
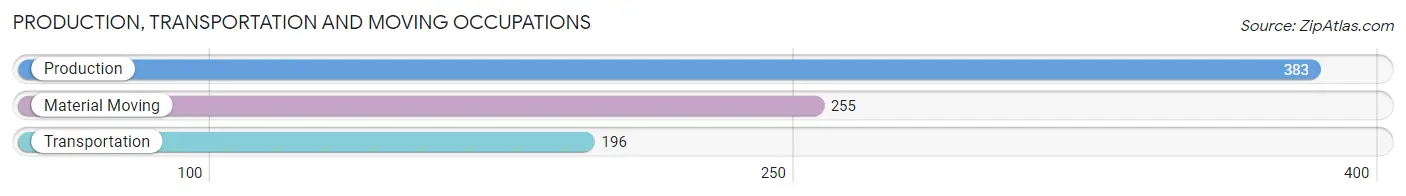
Production, Transportation and Moving Occupations
The most common Production, Transportation and Moving occupations in Woodlyn are Production (383 | 7.5%), Material Moving (255 | 5.0%), and Transportation (196 | 3.8%).
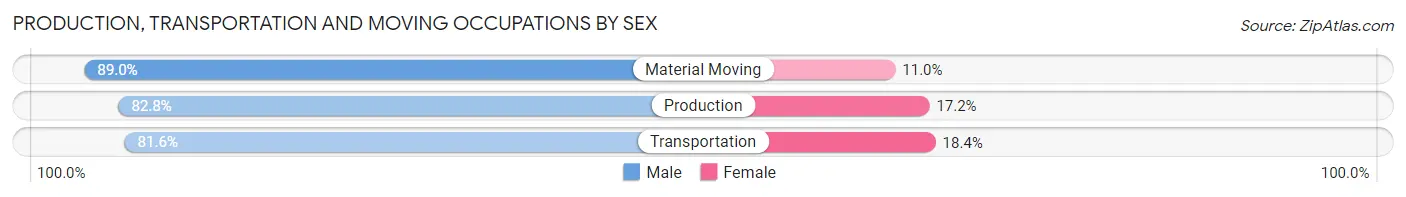
Production, Transportation and Moving Occupations by Sex
| Occupation | Male | Female |
| Production | 317 (82.8%) | 66 (17.2%) |
| Transportation | 160 (81.6%) | 36 (18.4%) |
| Material Moving | 227 (89.0%) | 28 (11.0%) |
| Total (Category) | 704 (84.4%) | 130 (15.6%) |
| Total (Overall) | 2,925 (57.0%) | 2,211 (43.0%) |
Employment Industries by Sex in Woodlyn
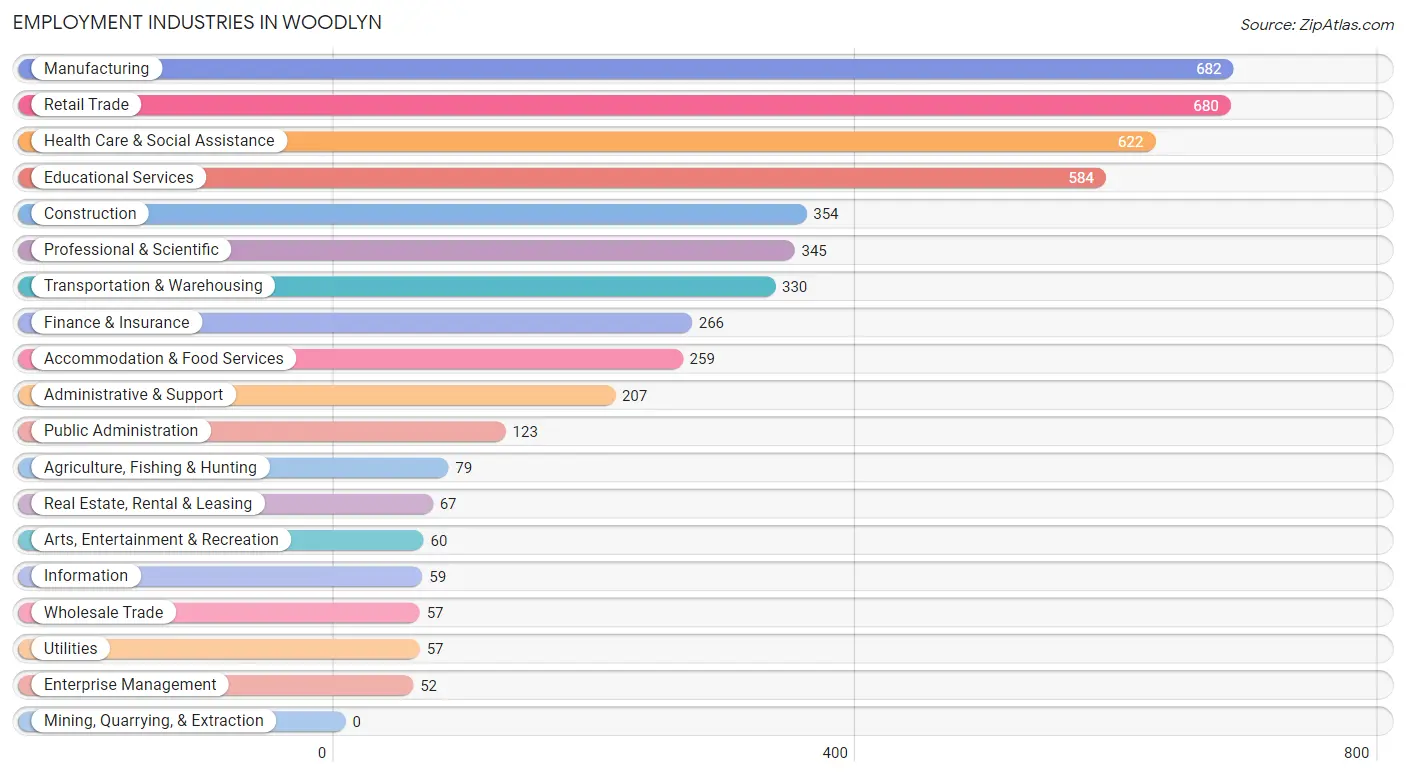
Employment Industries in Woodlyn
The major employment industries in Woodlyn include Manufacturing (682 | 13.3%), Retail Trade (680 | 13.2%), Health Care & Social Assistance (622 | 12.1%), Educational Services (584 | 11.4%), and Construction (354 | 6.9%).
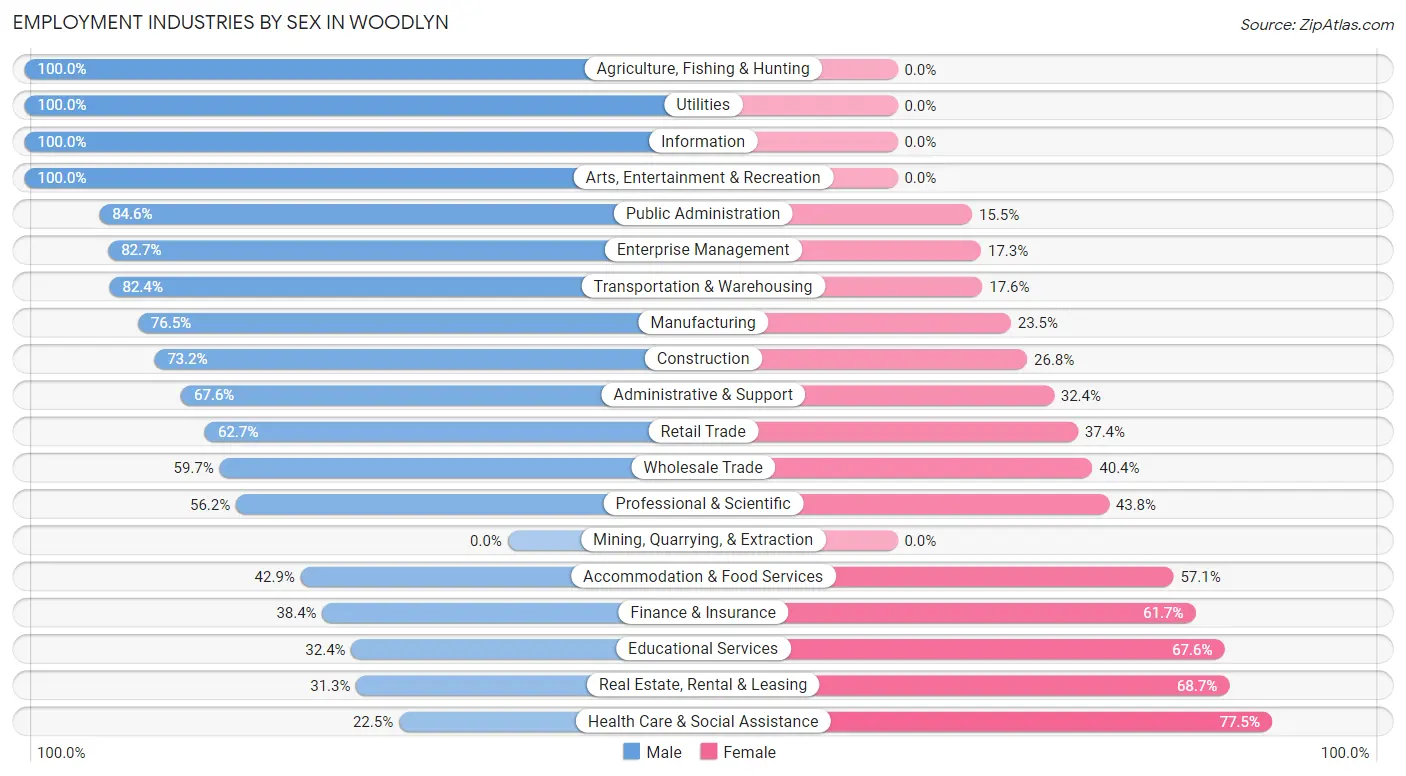
Employment Industries by Sex in Woodlyn
The Woodlyn industries that see more men than women are Agriculture, Fishing & Hunting (100.0%), Utilities (100.0%), and Information (100.0%), whereas the industries that tend to have a higher number of women are Health Care & Social Assistance (77.5%), Real Estate, Rental & Leasing (68.7%), and Educational Services (67.6%).
| Industry | Male | Female |
| Agriculture, Fishing & Hunting | 79 (100.0%) | 0 (0.0%) |
| Mining, Quarrying, & Extraction | 0 (0.0%) | 0 (0.0%) |
| Construction | 259 (73.2%) | 95 (26.8%) |
| Manufacturing | 522 (76.5%) | 160 (23.5%) |
| Wholesale Trade | 34 (59.7%) | 23 (40.4%) |
| Retail Trade | 426 (62.6%) | 254 (37.3%) |
| Transportation & Warehousing | 272 (82.4%) | 58 (17.6%) |
| Utilities | 57 (100.0%) | 0 (0.0%) |
| Information | 59 (100.0%) | 0 (0.0%) |
| Finance & Insurance | 102 (38.4%) | 164 (61.7%) |
| Real Estate, Rental & Leasing | 21 (31.3%) | 46 (68.7%) |
| Professional & Scientific | 194 (56.2%) | 151 (43.8%) |
| Enterprise Management | 43 (82.7%) | 9 (17.3%) |
| Administrative & Support | 140 (67.6%) | 67 (32.4%) |
| Educational Services | 189 (32.4%) | 395 (67.6%) |
| Health Care & Social Assistance | 140 (22.5%) | 482 (77.5%) |
| Arts, Entertainment & Recreation | 60 (100.0%) | 0 (0.0%) |
| Accommodation & Food Services | 111 (42.9%) | 148 (57.1%) |
| Public Administration | 104 (84.6%) | 19 (15.4%) |
| Total | 2,925 (57.0%) | 2,211 (43.0%) |
Education in Woodlyn
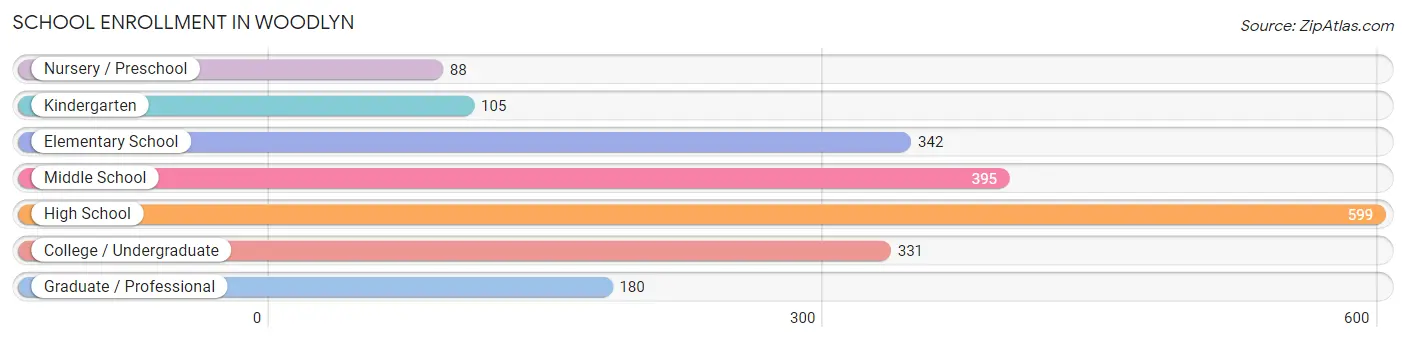
School Enrollment in Woodlyn
The most common levels of schooling among the 2,040 students in Woodlyn are high school (599 | 29.4%), middle school (395 | 19.4%), and elementary school (342 | 16.8%).
| School Level | # Students | % Students |
| Nursery / Preschool | 88 | 4.3% |
| Kindergarten | 105 | 5.1% |
| Elementary School | 342 | 16.8% |
| Middle School | 395 | 19.4% |
| High School | 599 | 29.4% |
| College / Undergraduate | 331 | 16.2% |
| Graduate / Professional | 180 | 8.8% |
| Total | 2,040 | 100.0% |
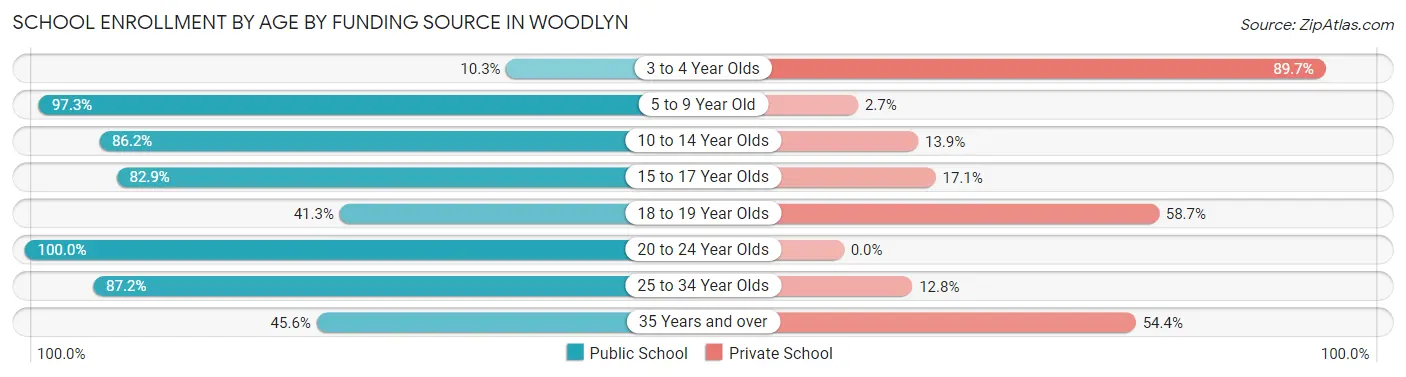
School Enrollment by Age by Funding Source in Woodlyn
Out of a total of 2,040 students who are enrolled in schools in Woodlyn, 359 (17.6%) attend a private institution, while the remaining 1,681 (82.4%) are enrolled in public schools. The age group of 3 to 4 year olds has the highest likelihood of being enrolled in private schools, with 70 (89.7% in the age bracket) enrolled. Conversely, the age group of 20 to 24 year olds has the lowest likelihood of being enrolled in a private school, with 176 (100.0% in the age bracket) attending a public institution.
| Age Bracket | Public School | Private School |
| 3 to 4 Year Olds | 8 (10.3%) | 70 (89.7%) |
| 5 to 9 Year Old | 365 (97.3%) | 10 (2.7%) |
| 10 to 14 Year Olds | 448 (86.2%) | 72 (13.9%) |
| 15 to 17 Year Olds | 402 (82.9%) | 83 (17.1%) |
| 18 to 19 Year Olds | 19 (41.3%) | 27 (58.7%) |
| 20 to 24 Year Olds | 176 (100.0%) | 0 (0.0%) |
| 25 to 34 Year Olds | 205 (87.2%) | 30 (12.8%) |
| 35 Years and over | 57 (45.6%) | 68 (54.4%) |
| Total | 1,681 (82.4%) | 359 (17.6%) |
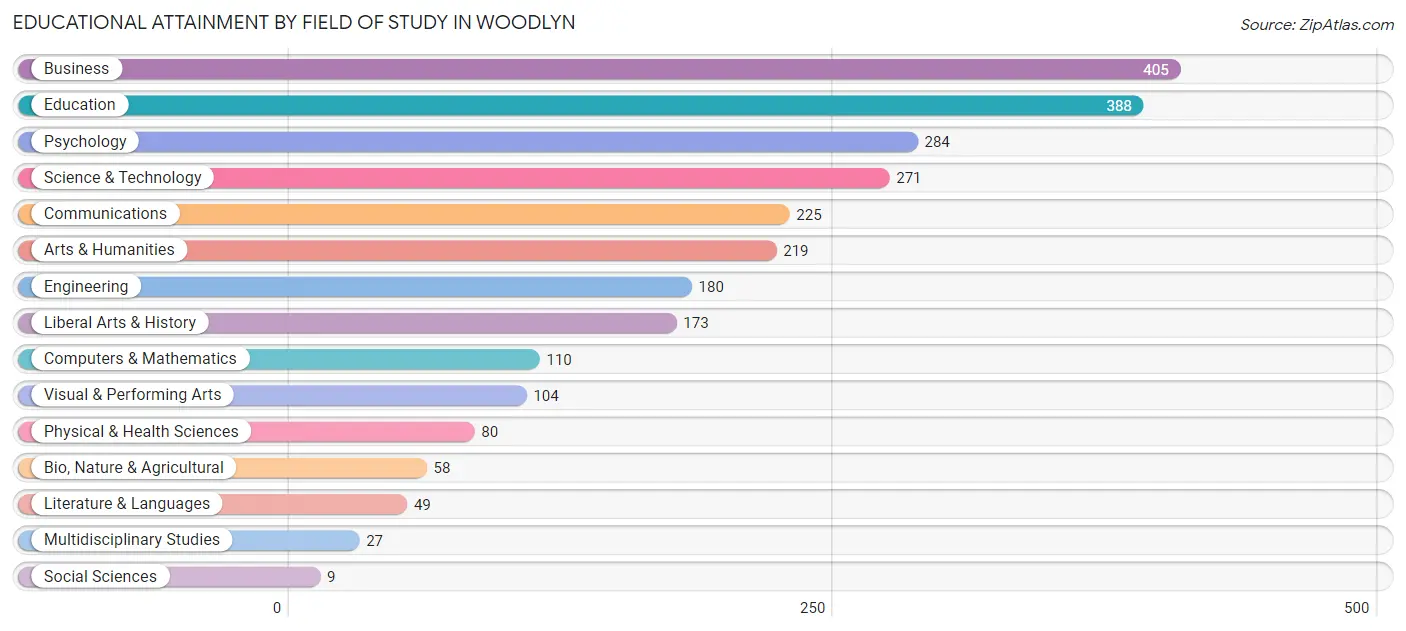
Educational Attainment by Field of Study in Woodlyn
Business (405 | 15.7%), education (388 | 15.0%), psychology (284 | 11.0%), science & technology (271 | 10.5%), and communications (225 | 8.7%) are the most common fields of study among 2,582 individuals in Woodlyn who have obtained a bachelor's degree or higher.
| Field of Study | # Graduates | % Graduates |
| Computers & Mathematics | 110 | 4.3% |
| Bio, Nature & Agricultural | 58 | 2.2% |
| Physical & Health Sciences | 80 | 3.1% |
| Psychology | 284 | 11.0% |
| Social Sciences | 9 | 0.4% |
| Engineering | 180 | 7.0% |
| Multidisciplinary Studies | 27 | 1.1% |
| Science & Technology | 271 | 10.5% |
| Business | 405 | 15.7% |
| Education | 388 | 15.0% |
| Literature & Languages | 49 | 1.9% |
| Liberal Arts & History | 173 | 6.7% |
| Visual & Performing Arts | 104 | 4.0% |
| Communications | 225 | 8.7% |
| Arts & Humanities | 219 | 8.5% |
| Total | 2,582 | 100.0% |
Transportation & Commute in Woodlyn
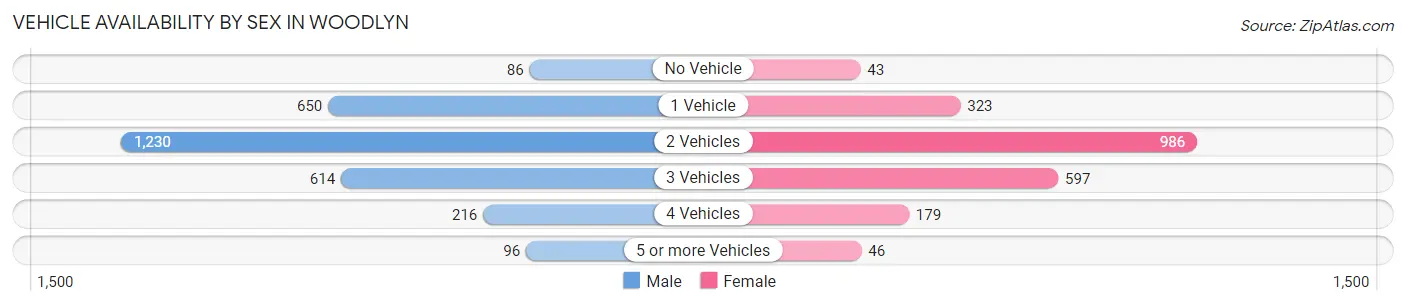
Vehicle Availability by Sex in Woodlyn
The most prevalent vehicle ownership categories in Woodlyn are males with 2 vehicles (1,230, accounting for 42.5%) and females with 2 vehicles (986, making up 56.6%).
| Vehicles Available | Male | Female |
| No Vehicle | 86 (3.0%) | 43 (2.0%) |
| 1 Vehicle | 650 (22.5%) | 323 (14.9%) |
| 2 Vehicles | 1,230 (42.5%) | 986 (45.4%) |
| 3 Vehicles | 614 (21.2%) | 597 (27.5%) |
| 4 Vehicles | 216 (7.5%) | 179 (8.2%) |
| 5 or more Vehicles | 96 (3.3%) | 46 (2.1%) |
| Total | 2,892 (100.0%) | 2,174 (100.0%) |
Commute Time in Woodlyn
The most frequently occuring commute durations in Woodlyn are 30 to 34 minutes (770 commuters, 16.3%), 10 to 14 minutes (653 commuters, 13.9%), and 15 to 19 minutes (527 commuters, 11.2%).
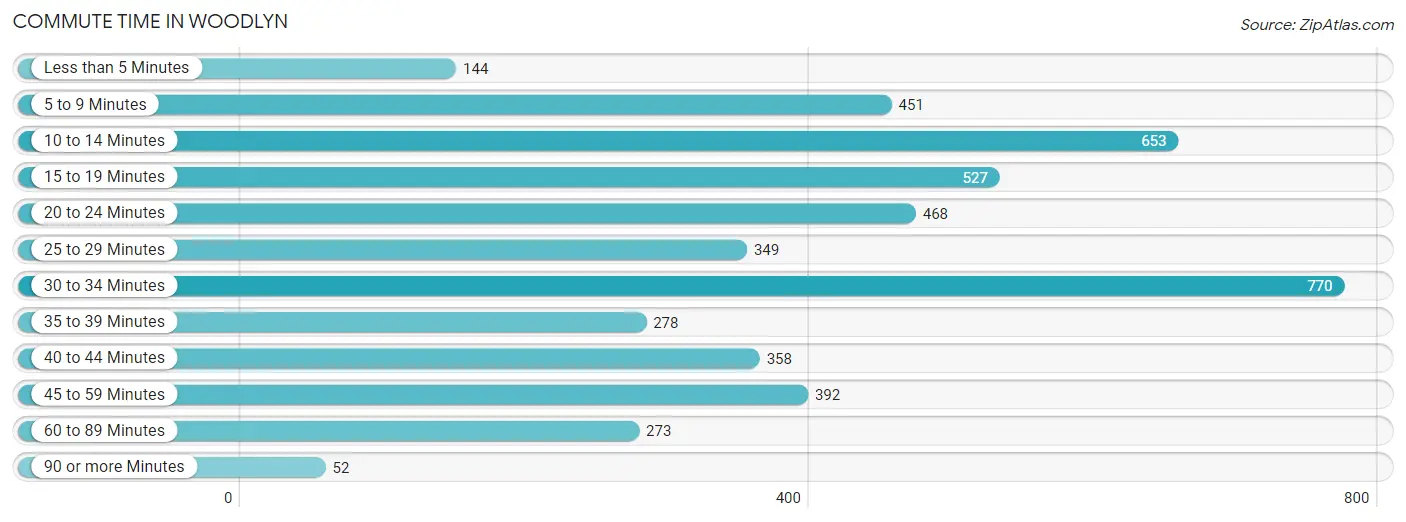
| Commute Time | # Commuters | % Commuters |
| Less than 5 Minutes | 144 | 3.0% |
| 5 to 9 Minutes | 451 | 9.6% |
| 10 to 14 Minutes | 653 | 13.9% |
| 15 to 19 Minutes | 527 | 11.2% |
| 20 to 24 Minutes | 468 | 9.9% |
| 25 to 29 Minutes | 349 | 7.4% |
| 30 to 34 Minutes | 770 | 16.3% |
| 35 to 39 Minutes | 278 | 5.9% |
| 40 to 44 Minutes | 358 | 7.6% |
| 45 to 59 Minutes | 392 | 8.3% |
| 60 to 89 Minutes | 273 | 5.8% |
| 90 or more Minutes | 52 | 1.1% |
Commute Time by Sex in Woodlyn
The most common commute times in Woodlyn are 30 to 34 minutes (483 commuters, 18.1%) for males and 10 to 14 minutes (381 commuters, 18.7%) for females.
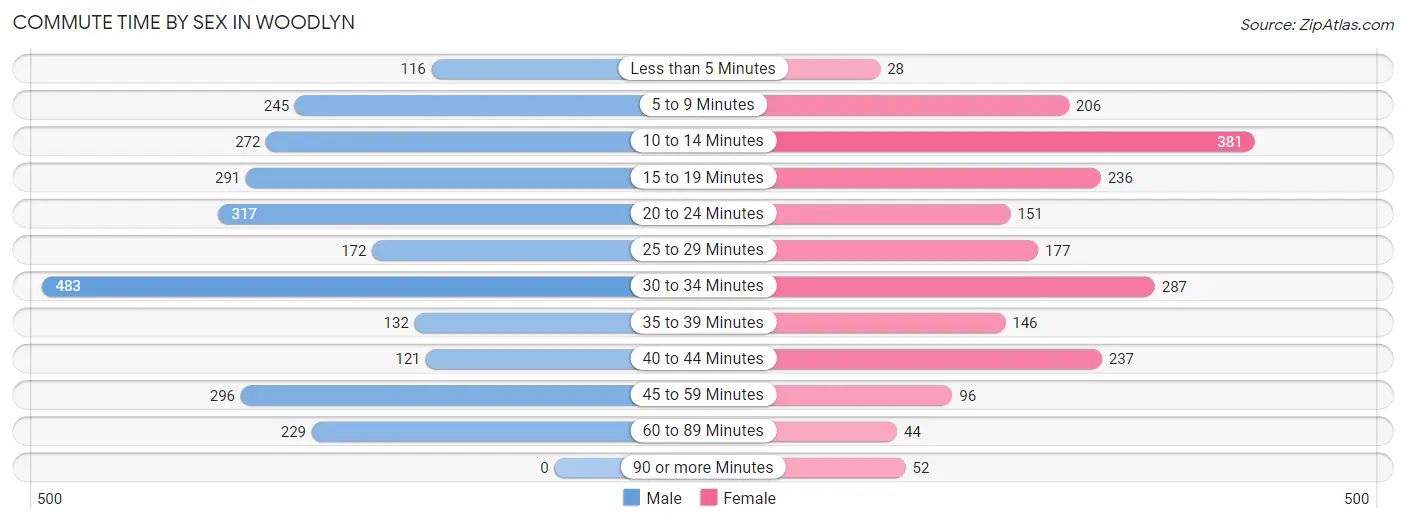
| Commute Time | Male | Female |
| Less than 5 Minutes | 116 (4.3%) | 28 (1.4%) |
| 5 to 9 Minutes | 245 (9.2%) | 206 (10.1%) |
| 10 to 14 Minutes | 272 (10.2%) | 381 (18.7%) |
| 15 to 19 Minutes | 291 (10.9%) | 236 (11.6%) |
| 20 to 24 Minutes | 317 (11.8%) | 151 (7.4%) |
| 25 to 29 Minutes | 172 (6.4%) | 177 (8.7%) |
| 30 to 34 Minutes | 483 (18.1%) | 287 (14.1%) |
| 35 to 39 Minutes | 132 (4.9%) | 146 (7.1%) |
| 40 to 44 Minutes | 121 (4.5%) | 237 (11.6%) |
| 45 to 59 Minutes | 296 (11.1%) | 96 (4.7%) |
| 60 to 89 Minutes | 229 (8.6%) | 44 (2.2%) |
| 90 or more Minutes | 0 (0.0%) | 52 (2.5%) |
Time of Departure to Work by Sex in Woodlyn
The most frequent times of departure to work in Woodlyn are 7:00 AM to 7:29 AM (320, 12.0%) for males and 9:00 AM to 9:59 AM (452, 22.2%) for females.
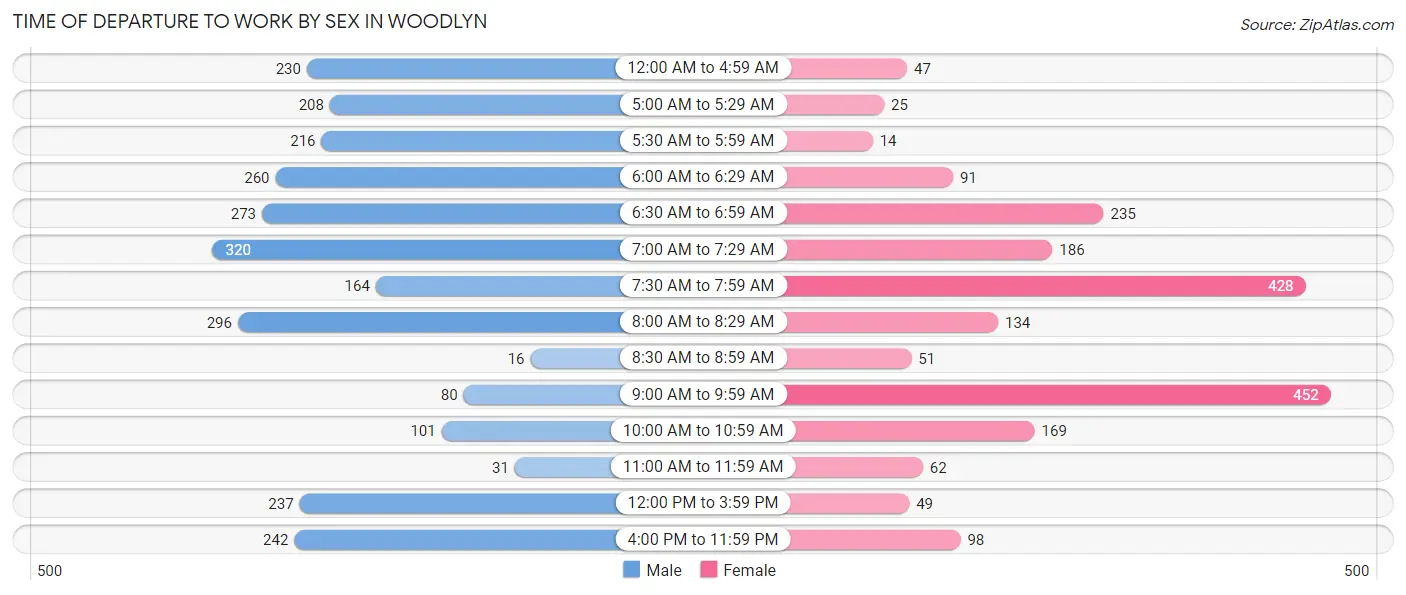
| Time of Departure | Male | Female |
| 12:00 AM to 4:59 AM | 230 (8.6%) | 47 (2.3%) |
| 5:00 AM to 5:29 AM | 208 (7.8%) | 25 (1.2%) |
| 5:30 AM to 5:59 AM | 216 (8.1%) | 14 (0.7%) |
| 6:00 AM to 6:29 AM | 260 (9.7%) | 91 (4.5%) |
| 6:30 AM to 6:59 AM | 273 (10.2%) | 235 (11.5%) |
| 7:00 AM to 7:29 AM | 320 (12.0%) | 186 (9.1%) |
| 7:30 AM to 7:59 AM | 164 (6.1%) | 428 (21.0%) |
| 8:00 AM to 8:29 AM | 296 (11.1%) | 134 (6.6%) |
| 8:30 AM to 8:59 AM | 16 (0.6%) | 51 (2.5%) |
| 9:00 AM to 9:59 AM | 80 (3.0%) | 452 (22.2%) |
| 10:00 AM to 10:59 AM | 101 (3.8%) | 169 (8.3%) |
| 11:00 AM to 11:59 AM | 31 (1.2%) | 62 (3.0%) |
| 12:00 PM to 3:59 PM | 237 (8.9%) | 49 (2.4%) |
| 4:00 PM to 11:59 PM | 242 (9.0%) | 98 (4.8%) |
| Total | 2,674 (100.0%) | 2,041 (100.0%) |
Housing Occupancy in Woodlyn
Occupancy by Ownership in Woodlyn
Of the total 4,146 dwellings in Woodlyn, owner-occupied units account for 2,971 (71.7%), while renter-occupied units make up 1,175 (28.3%).
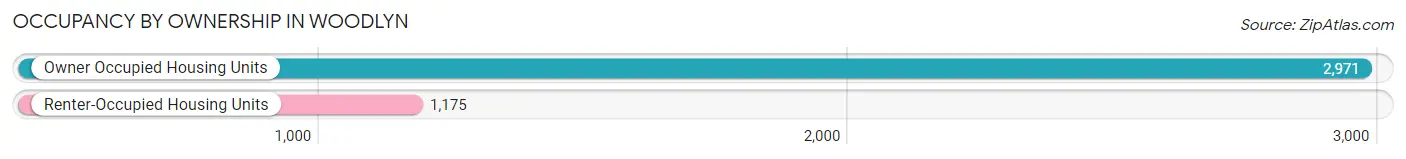
| Occupancy | # Housing Units | % Housing Units |
| Owner Occupied Housing Units | 2,971 | 71.7% |
| Renter-Occupied Housing Units | 1,175 | 28.3% |
| Total Occupied Housing Units | 4,146 | 100.0% |
Occupancy by Household Size in Woodlyn
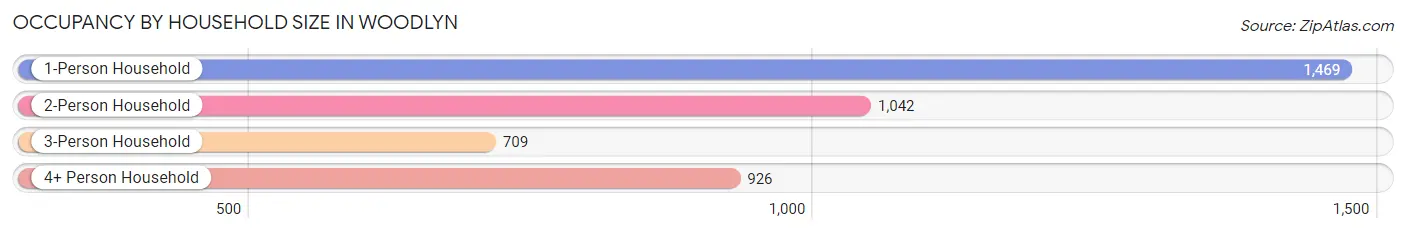
| Household Size | # Housing Units | % Housing Units |
| 1-Person Household | 1,469 | 35.4% |
| 2-Person Household | 1,042 | 25.1% |
| 3-Person Household | 709 | 17.1% |
| 4+ Person Household | 926 | 22.3% |
| Total Housing Units | 4,146 | 100.0% |
Occupancy by Ownership by Household Size in Woodlyn
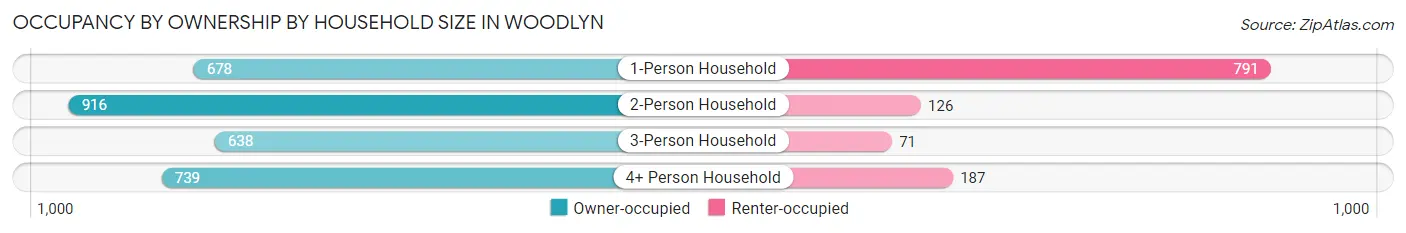
| Household Size | Owner-occupied | Renter-occupied |
| 1-Person Household | 678 (46.2%) | 791 (53.8%) |
| 2-Person Household | 916 (87.9%) | 126 (12.1%) |
| 3-Person Household | 638 (90.0%) | 71 (10.0%) |
| 4+ Person Household | 739 (79.8%) | 187 (20.2%) |
| Total Housing Units | 2,971 (71.7%) | 1,175 (28.3%) |
Occupancy by Educational Attainment in Woodlyn
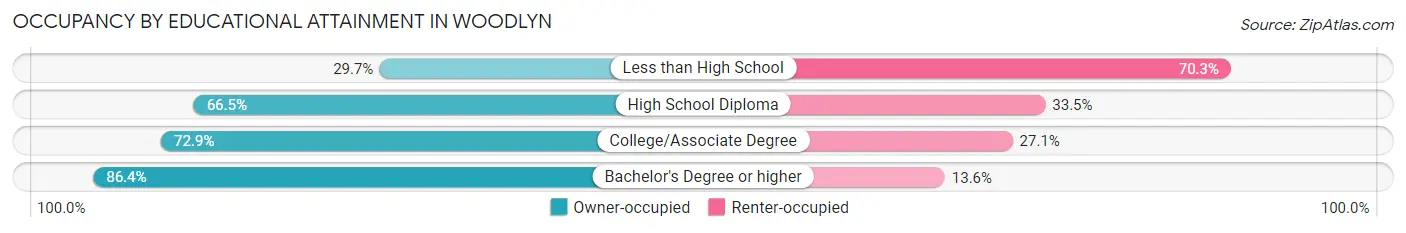
| Household Size | Owner-occupied | Renter-occupied |
| Less than High School | 98 (29.7%) | 232 (70.3%) |
| High School Diploma | 1,064 (66.5%) | 537 (33.5%) |
| College/Associate Degree | 566 (72.9%) | 210 (27.1%) |
| Bachelor's Degree or higher | 1,243 (86.4%) | 196 (13.6%) |
Occupancy by Age of Householder in Woodlyn
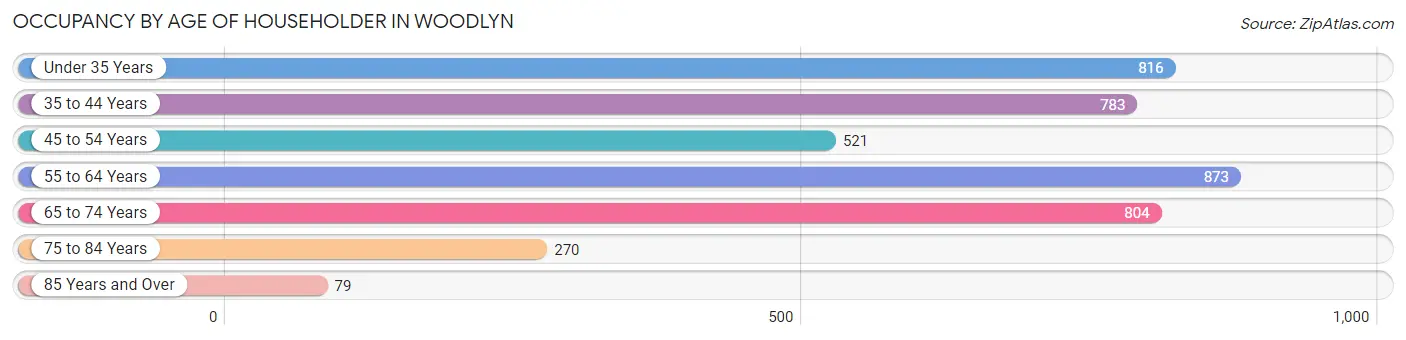
| Age Bracket | # Households | % Households |
| Under 35 Years | 816 | 19.7% |
| 35 to 44 Years | 783 | 18.9% |
| 45 to 54 Years | 521 | 12.6% |
| 55 to 64 Years | 873 | 21.1% |
| 65 to 74 Years | 804 | 19.4% |
| 75 to 84 Years | 270 | 6.5% |
| 85 Years and Over | 79 | 1.9% |
| Total | 4,146 | 100.0% |
Housing Finances in Woodlyn
Median Income by Occupancy in Woodlyn
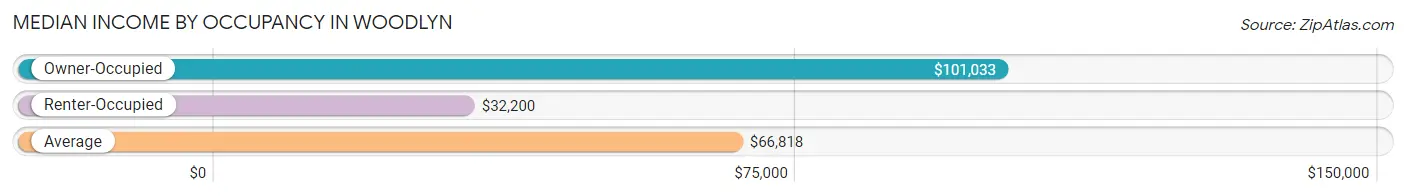
| Occupancy Type | # Households | Median Income |
| Owner-Occupied | 2,971 (71.7%) | $101,033 |
| Renter-Occupied | 1,175 (28.3%) | $32,200 |
| Average | 4,146 (100.0%) | $66,818 |
Occupancy by Householder Income Bracket in Woodlyn
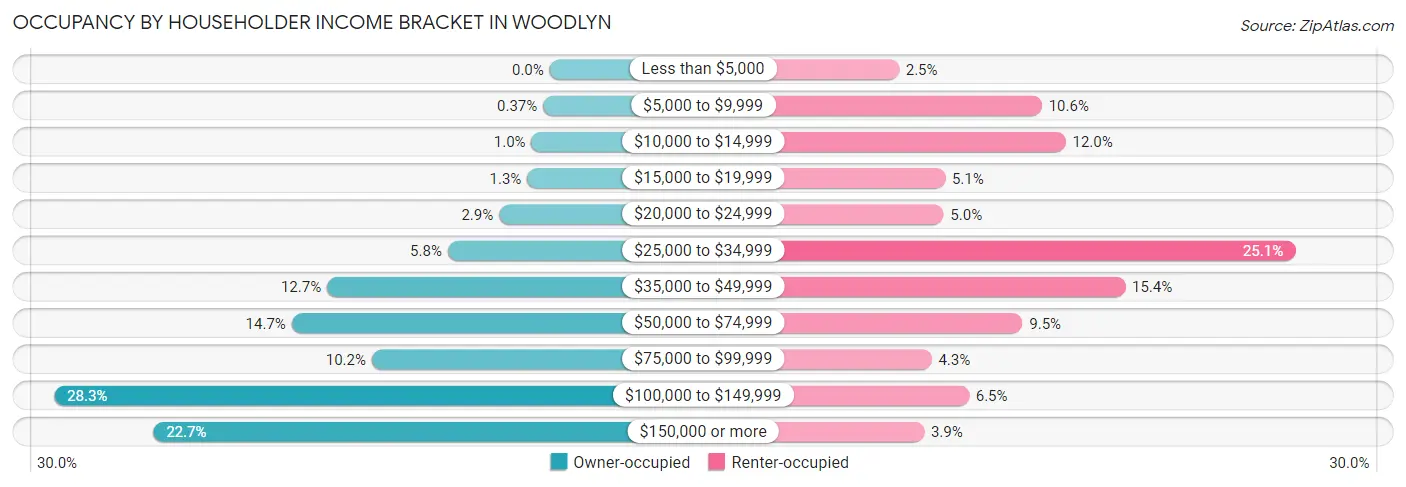
| Income Bracket | Owner-occupied | Renter-occupied |
| Less than $5,000 | 0 (0.0%) | 29 (2.5%) |
| $5,000 to $9,999 | 11 (0.4%) | 125 (10.6%) |
| $10,000 to $14,999 | 31 (1.0%) | 141 (12.0%) |
| $15,000 to $19,999 | 38 (1.3%) | 60 (5.1%) |
| $20,000 to $24,999 | 86 (2.9%) | 59 (5.0%) |
| $25,000 to $34,999 | 173 (5.8%) | 295 (25.1%) |
| $35,000 to $49,999 | 378 (12.7%) | 181 (15.4%) |
| $50,000 to $74,999 | 438 (14.7%) | 112 (9.5%) |
| $75,000 to $99,999 | 302 (10.2%) | 51 (4.3%) |
| $100,000 to $149,999 | 841 (28.3%) | 76 (6.5%) |
| $150,000 or more | 673 (22.7%) | 46 (3.9%) |
| Total | 2,971 (100.0%) | 1,175 (100.0%) |
Monthly Housing Cost Tiers in Woodlyn
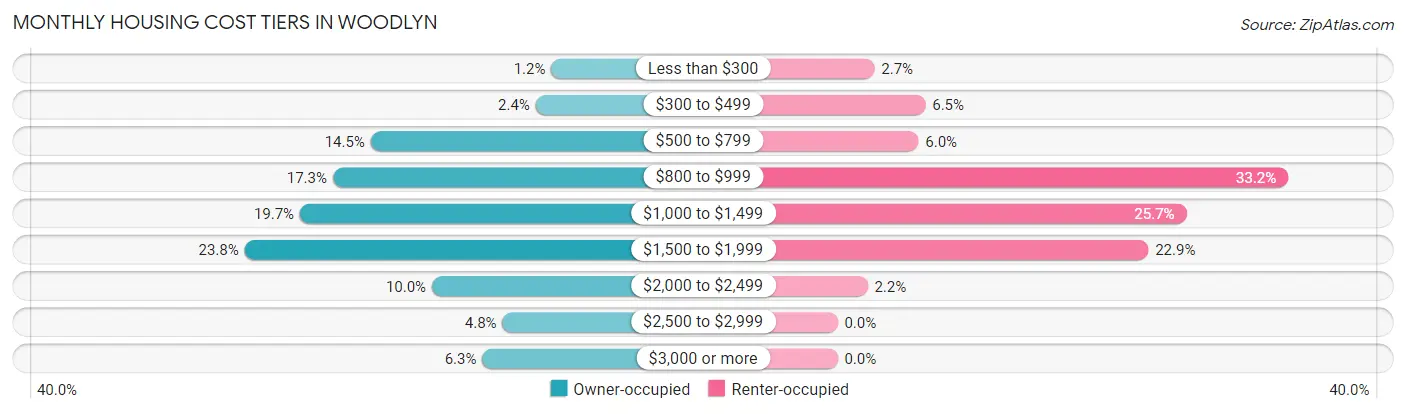
| Monthly Cost | Owner-occupied | Renter-occupied |
| Less than $300 | 36 (1.2%) | 32 (2.7%) |
| $300 to $499 | 70 (2.4%) | 76 (6.5%) |
| $500 to $799 | 431 (14.5%) | 70 (6.0%) |
| $800 to $999 | 514 (17.3%) | 390 (33.2%) |
| $1,000 to $1,499 | 586 (19.7%) | 302 (25.7%) |
| $1,500 to $1,999 | 707 (23.8%) | 269 (22.9%) |
| $2,000 to $2,499 | 297 (10.0%) | 26 (2.2%) |
| $2,500 to $2,999 | 143 (4.8%) | 0 (0.0%) |
| $3,000 or more | 187 (6.3%) | 0 (0.0%) |
| Total | 2,971 (100.0%) | 1,175 (100.0%) |
Physical Housing Characteristics in Woodlyn
Housing Structures in Woodlyn
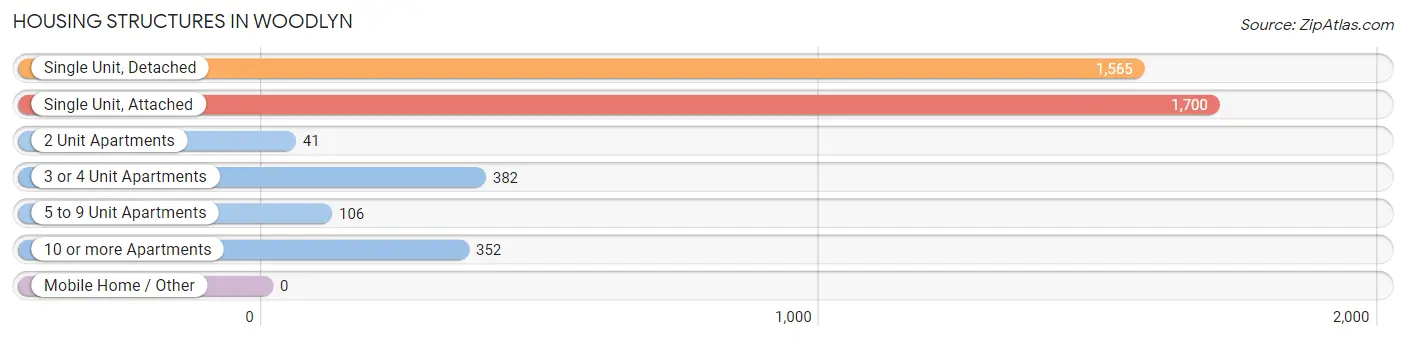
| Structure Type | # Housing Units | % Housing Units |
| Single Unit, Detached | 1,565 | 37.8% |
| Single Unit, Attached | 1,700 | 41.0% |
| 2 Unit Apartments | 41 | 1.0% |
| 3 or 4 Unit Apartments | 382 | 9.2% |
| 5 to 9 Unit Apartments | 106 | 2.6% |
| 10 or more Apartments | 352 | 8.5% |
| Mobile Home / Other | 0 | 0.0% |
| Total | 4,146 | 100.0% |
Housing Structures by Occupancy in Woodlyn
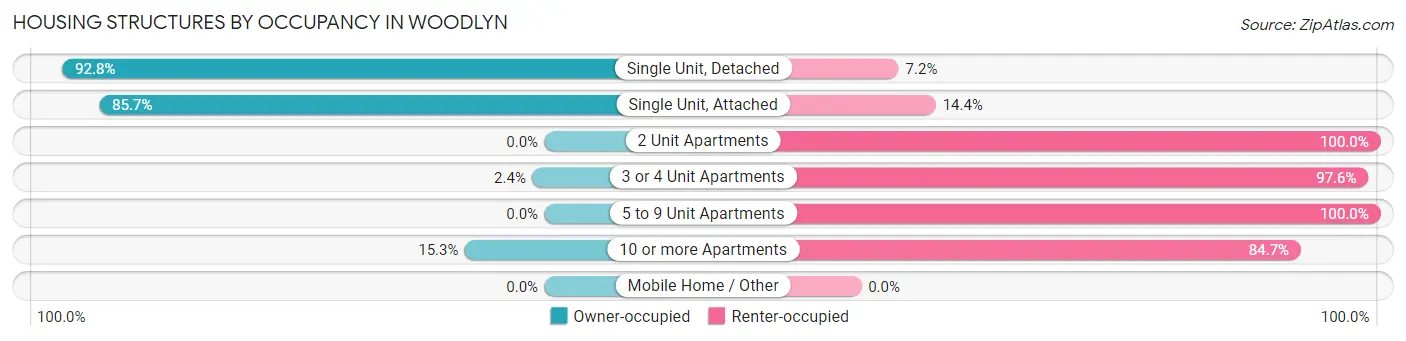
| Structure Type | Owner-occupied | Renter-occupied |
| Single Unit, Detached | 1,452 (92.8%) | 113 (7.2%) |
| Single Unit, Attached | 1,456 (85.7%) | 244 (14.3%) |
| 2 Unit Apartments | 0 (0.0%) | 41 (100.0%) |
| 3 or 4 Unit Apartments | 9 (2.4%) | 373 (97.6%) |
| 5 to 9 Unit Apartments | 0 (0.0%) | 106 (100.0%) |
| 10 or more Apartments | 54 (15.3%) | 298 (84.7%) |
| Mobile Home / Other | 0 (0.0%) | 0 (0.0%) |
| Total | 2,971 (71.7%) | 1,175 (28.3%) |
Housing Structures by Number of Rooms in Woodlyn
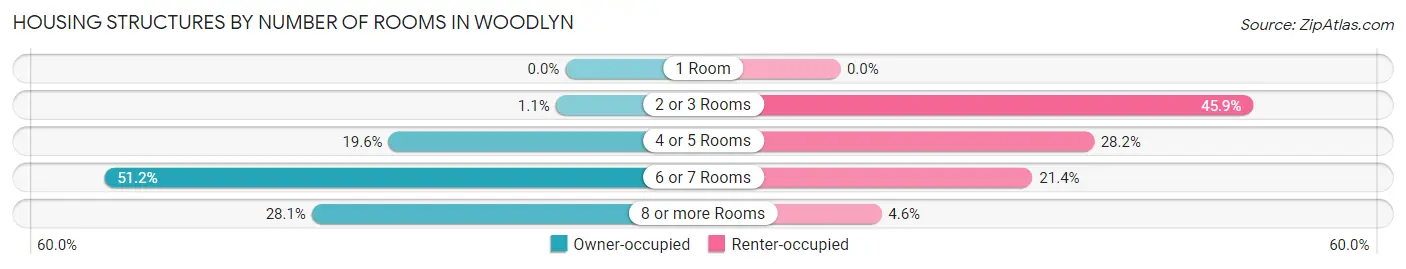
| Number of Rooms | Owner-occupied | Renter-occupied |
| 1 Room | 0 (0.0%) | 0 (0.0%) |
| 2 or 3 Rooms | 32 (1.1%) | 539 (45.9%) |
| 4 or 5 Rooms | 583 (19.6%) | 331 (28.2%) |
| 6 or 7 Rooms | 1,520 (51.2%) | 251 (21.4%) |
| 8 or more Rooms | 836 (28.1%) | 54 (4.6%) |
| Total | 2,971 (100.0%) | 1,175 (100.0%) |
Housing Structure by Heating Type in Woodlyn
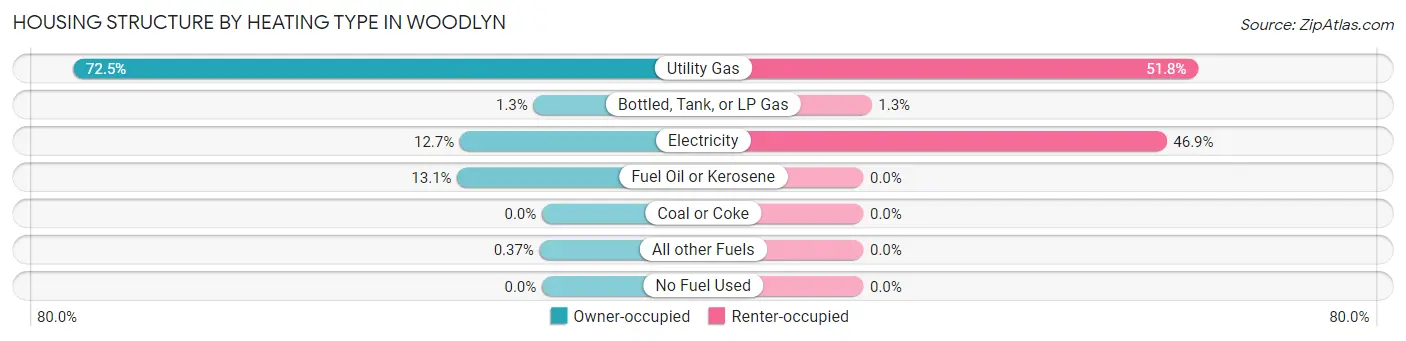
| Heating Type | Owner-occupied | Renter-occupied |
| Utility Gas | 2,155 (72.5%) | 609 (51.8%) |
| Bottled, Tank, or LP Gas | 39 (1.3%) | 15 (1.3%) |
| Electricity | 377 (12.7%) | 551 (46.9%) |
| Fuel Oil or Kerosene | 389 (13.1%) | 0 (0.0%) |
| Coal or Coke | 0 (0.0%) | 0 (0.0%) |
| All other Fuels | 11 (0.4%) | 0 (0.0%) |
| No Fuel Used | 0 (0.0%) | 0 (0.0%) |
| Total | 2,971 (100.0%) | 1,175 (100.0%) |
Household Vehicle Usage in Woodlyn
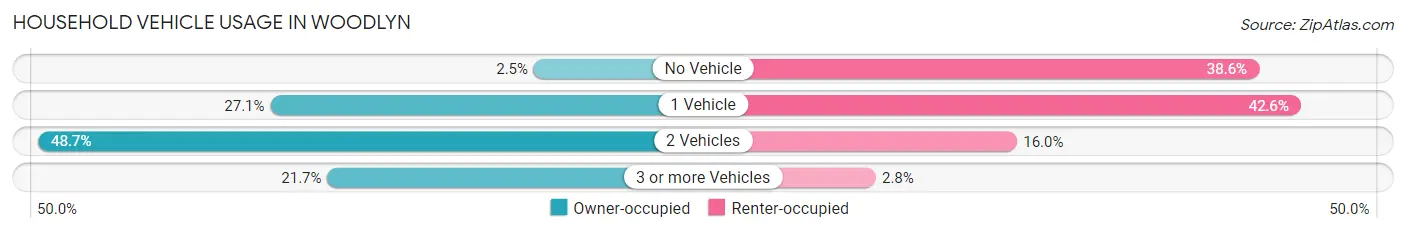
| Vehicles per Household | Owner-occupied | Renter-occupied |
| No Vehicle | 73 (2.5%) | 454 (38.6%) |
| 1 Vehicle | 804 (27.1%) | 500 (42.5%) |
| 2 Vehicles | 1,448 (48.7%) | 188 (16.0%) |
| 3 or more Vehicles | 646 (21.7%) | 33 (2.8%) |
| Total | 2,971 (100.0%) | 1,175 (100.0%) |
Real Estate & Mortgages in Woodlyn
Real Estate and Mortgage Overview in Woodlyn
| Characteristic | Without Mortgage | With Mortgage |
| Housing Units | 1,207 | 1,764 |
| Median Property Value | $224,300 | $212,900 |
| Median Household Income | $59,962 | $531 |
| Monthly Housing Costs | $823 | $187 |
| Real Estate Taxes | $6,351 | $0 |
Property Value by Mortgage Status in Woodlyn
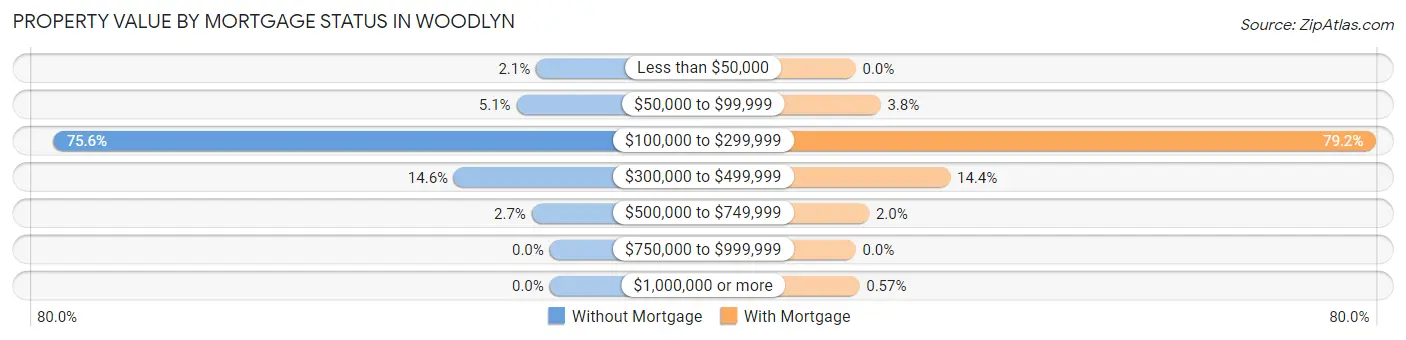
| Property Value | Without Mortgage | With Mortgage |
| Less than $50,000 | 25 (2.1%) | 0 (0.0%) |
| $50,000 to $99,999 | 61 (5.1%) | 67 (3.8%) |
| $100,000 to $299,999 | 912 (75.6%) | 1,397 (79.2%) |
| $300,000 to $499,999 | 176 (14.6%) | 254 (14.4%) |
| $500,000 to $749,999 | 33 (2.7%) | 36 (2.0%) |
| $750,000 to $999,999 | 0 (0.0%) | 0 (0.0%) |
| $1,000,000 or more | 0 (0.0%) | 10 (0.6%) |
| Total | 1,207 (100.0%) | 1,764 (100.0%) |
Household Income by Mortgage Status in Woodlyn
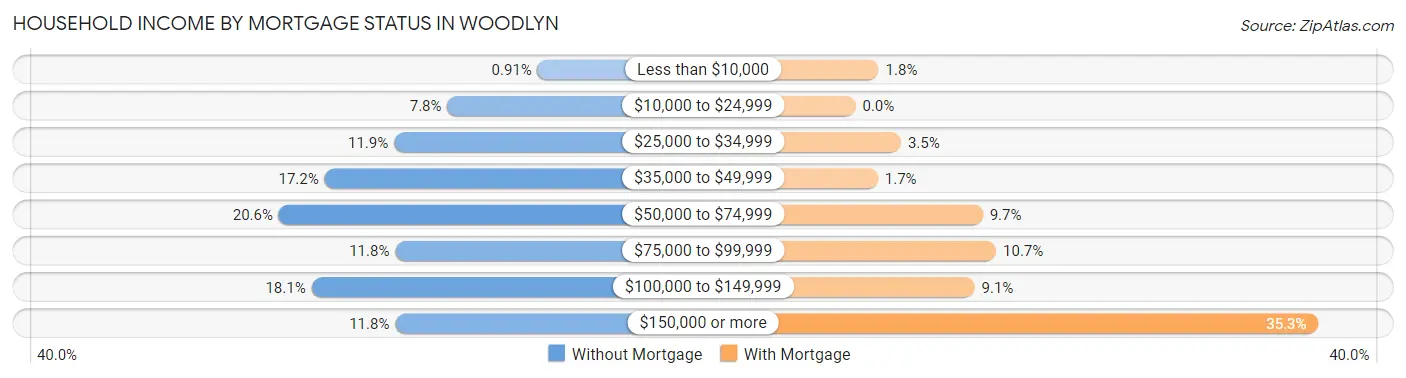
| Household Income | Without Mortgage | With Mortgage |
| Less than $10,000 | 11 (0.9%) | 31 (1.8%) |
| $10,000 to $24,999 | 94 (7.8%) | 0 (0.0%) |
| $25,000 to $34,999 | 143 (11.8%) | 61 (3.5%) |
| $35,000 to $49,999 | 207 (17.2%) | 30 (1.7%) |
| $50,000 to $74,999 | 249 (20.6%) | 171 (9.7%) |
| $75,000 to $99,999 | 142 (11.8%) | 189 (10.7%) |
| $100,000 to $149,999 | 219 (18.1%) | 160 (9.1%) |
| $150,000 or more | 142 (11.8%) | 622 (35.3%) |
| Total | 1,207 (100.0%) | 1,764 (100.0%) |
Property Value to Household Income Ratio in Woodlyn
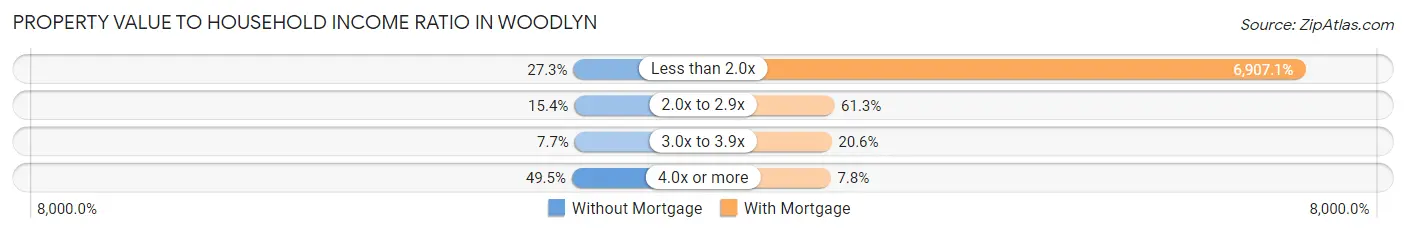
| Value-to-Income Ratio | Without Mortgage | With Mortgage |
| Less than 2.0x | 330 (27.3%) | 121,842 (6,907.1%) |
| 2.0x to 2.9x | 186 (15.4%) | 1,081 (61.3%) |
| 3.0x to 3.9x | 93 (7.7%) | 364 (20.6%) |
| 4.0x or more | 598 (49.5%) | 137 (7.8%) |
| Total | 1,207 (100.0%) | 1,764 (100.0%) |
Real Estate Taxes by Mortgage Status in Woodlyn
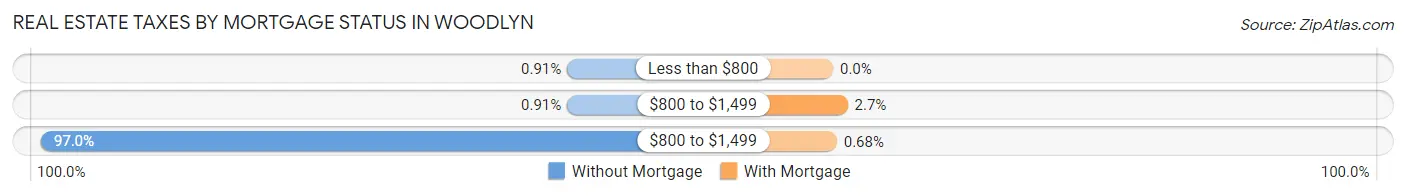
| Property Taxes | Without Mortgage | With Mortgage |
| Less than $800 | 11 (0.9%) | 0 (0.0%) |
| $800 to $1,499 | 11 (0.9%) | 47 (2.7%) |
| $800 to $1,499 | 1,171 (97.0%) | 12 (0.7%) |
| Total | 1,207 (100.0%) | 1,764 (100.0%) |
Health & Disability in Woodlyn
Health Insurance Coverage by Age in Woodlyn
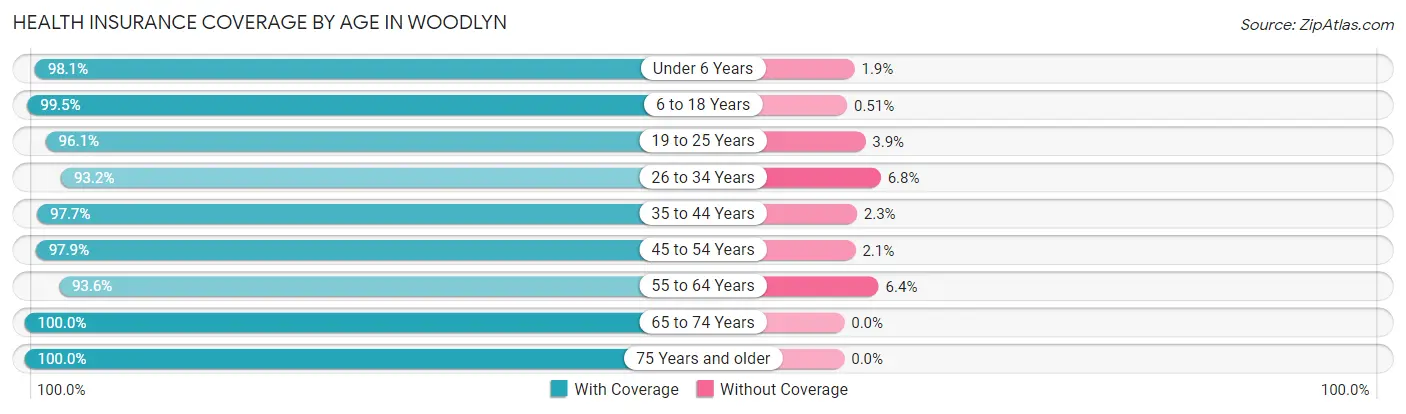
| Age Bracket | With Coverage | Without Coverage |
| Under 6 Years | 566 (98.1%) | 11 (1.9%) |
| 6 to 18 Years | 1,570 (99.5%) | 8 (0.5%) |
| 19 to 25 Years | 733 (96.1%) | 30 (3.9%) |
| 26 to 34 Years | 1,606 (93.2%) | 117 (6.8%) |
| 35 to 44 Years | 1,417 (97.7%) | 34 (2.3%) |
| 45 to 54 Years | 941 (97.9%) | 20 (2.1%) |
| 55 to 64 Years | 1,576 (93.6%) | 108 (6.4%) |
| 65 to 74 Years | 1,137 (100.0%) | 0 (0.0%) |
| 75 Years and older | 473 (100.0%) | 0 (0.0%) |
| Total | 10,019 (96.8%) | 328 (3.2%) |
Health Insurance Coverage by Citizenship Status in Woodlyn
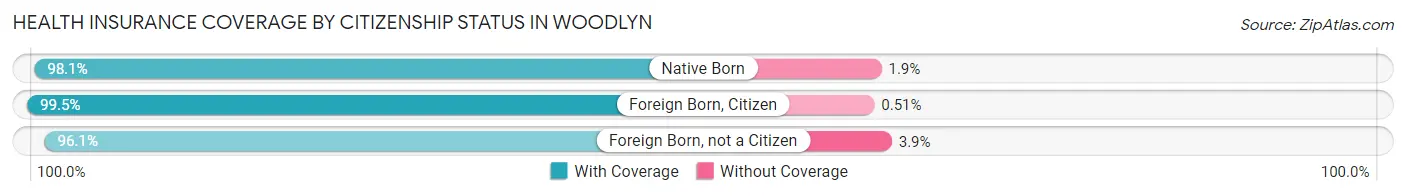
| Citizenship Status | With Coverage | Without Coverage |
| Native Born | 566 (98.1%) | 11 (1.9%) |
| Foreign Born, Citizen | 1,570 (99.5%) | 8 (0.5%) |
| Foreign Born, not a Citizen | 733 (96.1%) | 30 (3.9%) |
Health Insurance Coverage by Household Income in Woodlyn
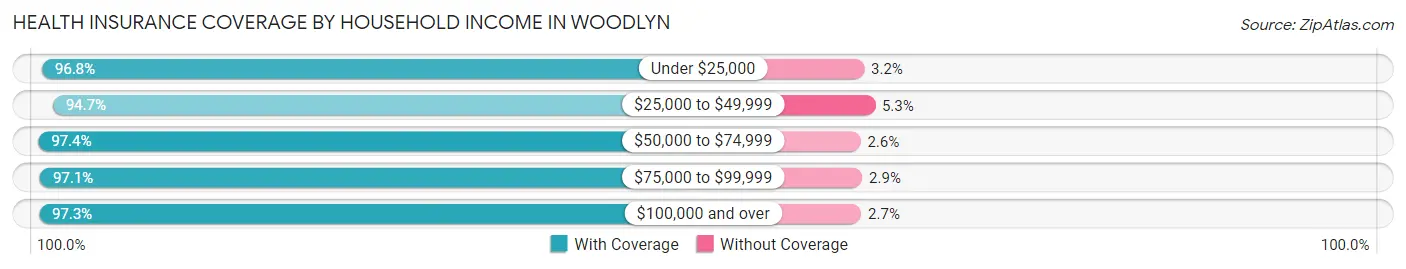
| Household Income | With Coverage | Without Coverage |
| Under $25,000 | 777 (96.8%) | 26 (3.2%) |
| $25,000 to $49,999 | 1,650 (94.7%) | 92 (5.3%) |
| $50,000 to $74,999 | 1,483 (97.4%) | 39 (2.6%) |
| $75,000 to $99,999 | 1,010 (97.1%) | 30 (2.9%) |
| $100,000 and over | 5,071 (97.3%) | 140 (2.7%) |
Public vs Private Health Insurance Coverage by Age in Woodlyn
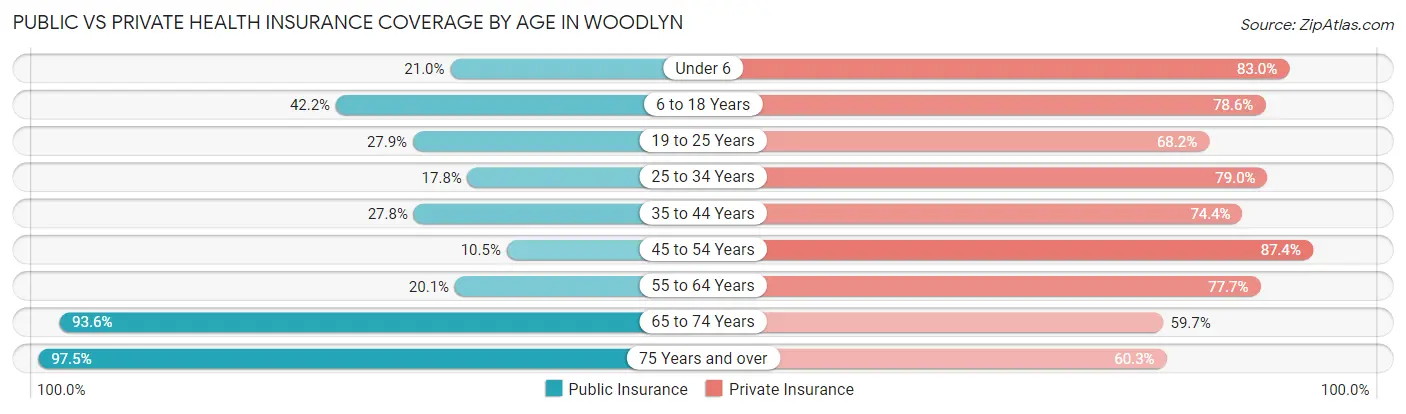
| Age Bracket | Public Insurance | Private Insurance |
| Under 6 | 121 (21.0%) | 479 (83.0%) |
| 6 to 18 Years | 666 (42.2%) | 1,240 (78.6%) |
| 19 to 25 Years | 213 (27.9%) | 520 (68.1%) |
| 25 to 34 Years | 306 (17.8%) | 1,361 (79.0%) |
| 35 to 44 Years | 403 (27.8%) | 1,079 (74.4%) |
| 45 to 54 Years | 101 (10.5%) | 840 (87.4%) |
| 55 to 64 Years | 339 (20.1%) | 1,308 (77.7%) |
| 65 to 74 Years | 1,064 (93.6%) | 679 (59.7%) |
| 75 Years and over | 461 (97.5%) | 285 (60.3%) |
| Total | 3,674 (35.5%) | 7,791 (75.3%) |
Disability Status by Sex by Age in Woodlyn
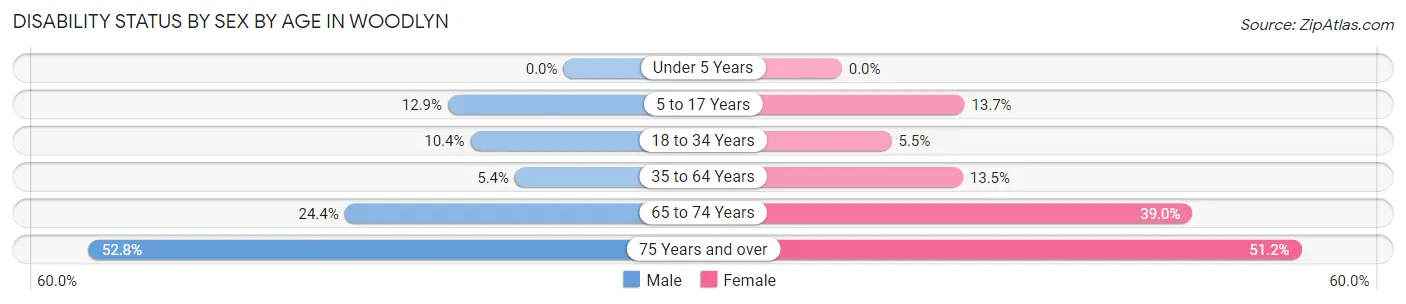
| Age Bracket | Male | Female |
| Under 5 Years | 0 (0.0%) | 0 (0.0%) |
| 5 to 17 Years | 97 (12.9%) | 110 (13.7%) |
| 18 to 34 Years | 138 (10.4%) | 68 (5.5%) |
| 35 to 64 Years | 119 (5.4%) | 255 (13.5%) |
| 65 to 74 Years | 146 (24.4%) | 210 (39.0%) |
| 75 Years and over | 93 (52.8%) | 152 (51.2%) |
Disability Class by Sex by Age in Woodlyn
Disability Class: Hearing Difficulty
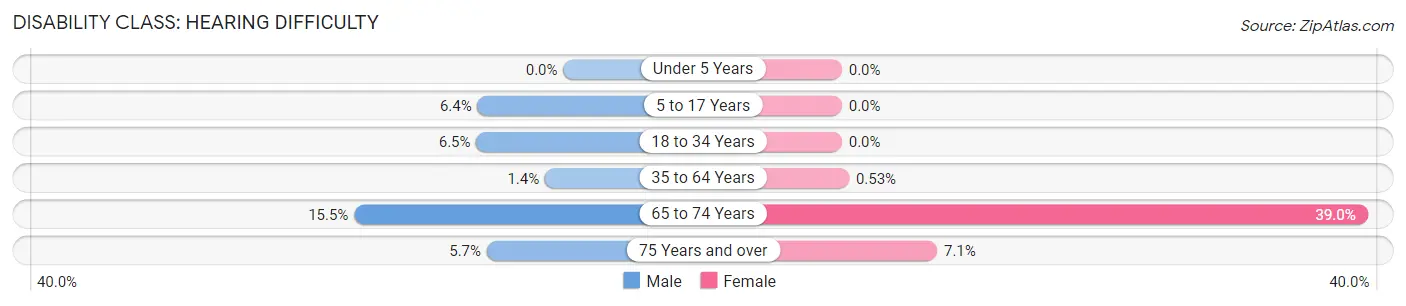
| Age Bracket | Male | Female |
| Under 5 Years | 0 (0.0%) | 0 (0.0%) |
| 5 to 17 Years | 48 (6.4%) | 0 (0.0%) |
| 18 to 34 Years | 86 (6.5%) | 0 (0.0%) |
| 35 to 64 Years | 30 (1.4%) | 10 (0.5%) |
| 65 to 74 Years | 93 (15.5%) | 210 (39.0%) |
| 75 Years and over | 10 (5.7%) | 21 (7.1%) |
Disability Class: Vision Difficulty
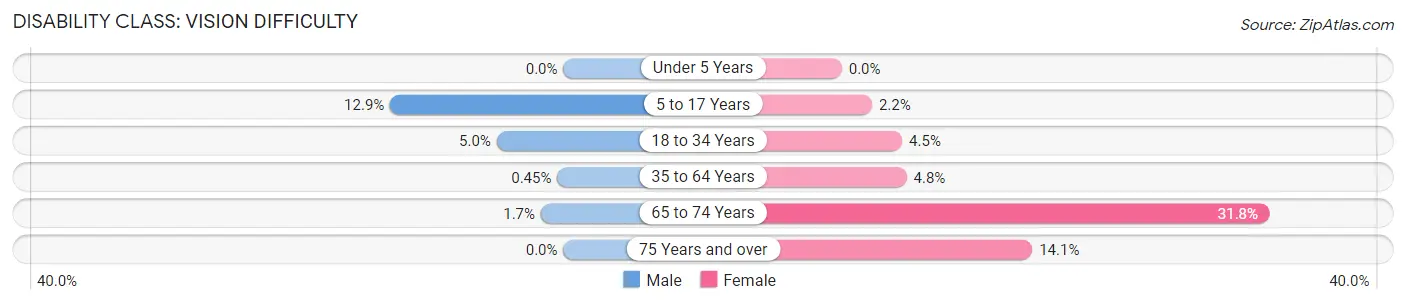
| Age Bracket | Male | Female |
| Under 5 Years | 0 (0.0%) | 0 (0.0%) |
| 5 to 17 Years | 97 (12.9%) | 18 (2.2%) |
| 18 to 34 Years | 66 (5.0%) | 55 (4.5%) |
| 35 to 64 Years | 10 (0.4%) | 91 (4.8%) |
| 65 to 74 Years | 10 (1.7%) | 171 (31.8%) |
| 75 Years and over | 0 (0.0%) | 42 (14.1%) |
Disability Class: Cognitive Difficulty
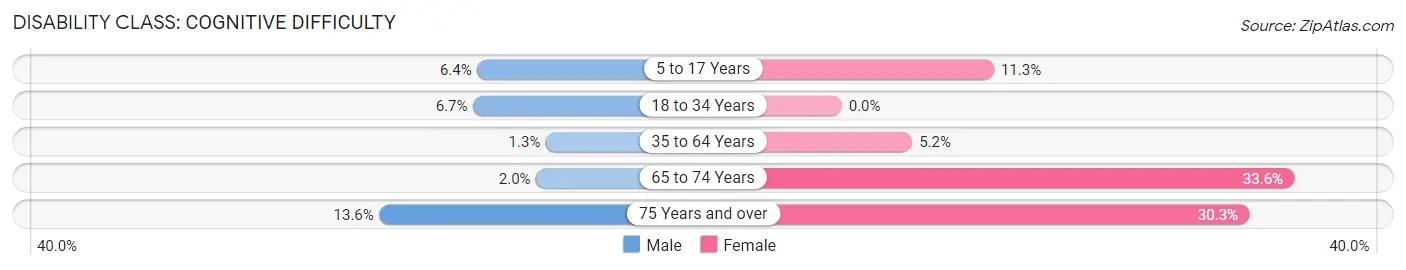
| Age Bracket | Male | Female |
| 5 to 17 Years | 48 (6.4%) | 91 (11.3%) |
| 18 to 34 Years | 89 (6.7%) | 0 (0.0%) |
| 35 to 64 Years | 28 (1.3%) | 99 (5.2%) |
| 65 to 74 Years | 12 (2.0%) | 181 (33.6%) |
| 75 Years and over | 24 (13.6%) | 90 (30.3%) |
Disability Class: Ambulatory Difficulty
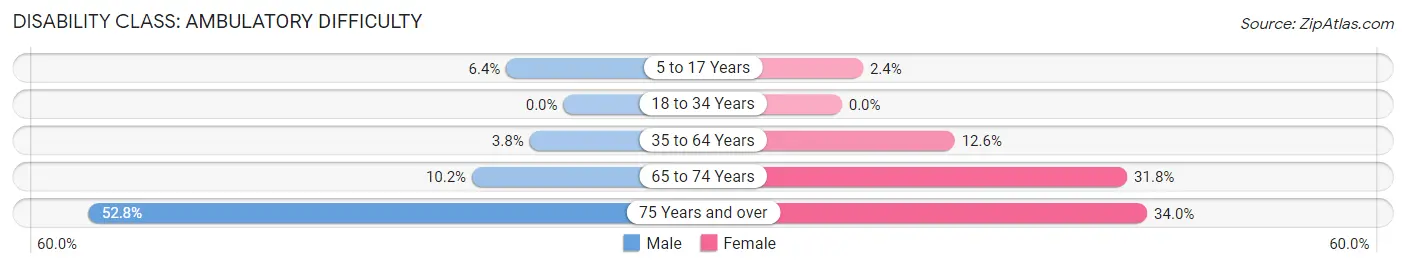
| Age Bracket | Male | Female |
| 5 to 17 Years | 48 (6.4%) | 19 (2.4%) |
| 18 to 34 Years | 0 (0.0%) | 0 (0.0%) |
| 35 to 64 Years | 83 (3.8%) | 238 (12.6%) |
| 65 to 74 Years | 61 (10.2%) | 171 (31.8%) |
| 75 Years and over | 93 (52.8%) | 101 (34.0%) |
Disability Class: Self-Care Difficulty
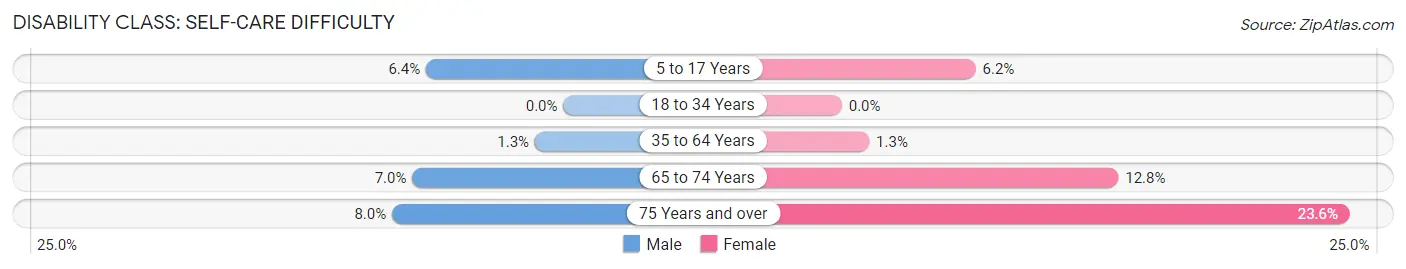
| Age Bracket | Male | Female |
| 5 to 17 Years | 48 (6.4%) | 50 (6.2%) |
| 18 to 34 Years | 0 (0.0%) | 0 (0.0%) |
| 35 to 64 Years | 29 (1.3%) | 24 (1.3%) |
| 65 to 74 Years | 42 (7.0%) | 69 (12.8%) |
| 75 Years and over | 14 (8.0%) | 70 (23.6%) |
Technology Access in Woodlyn
Computing Device Access in Woodlyn
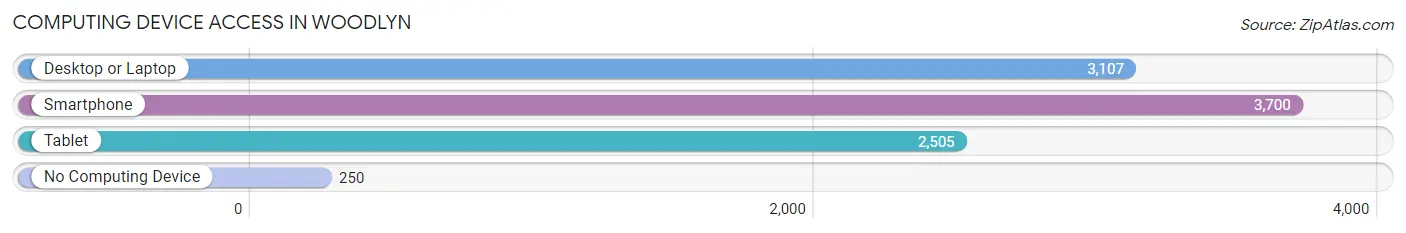
| Device Type | # Households | % Households |
| Desktop or Laptop | 3,107 | 74.9% |
| Smartphone | 3,700 | 89.2% |
| Tablet | 2,505 | 60.4% |
| No Computing Device | 250 | 6.0% |
| Total | 4,146 | 100.0% |
Internet Access in Woodlyn
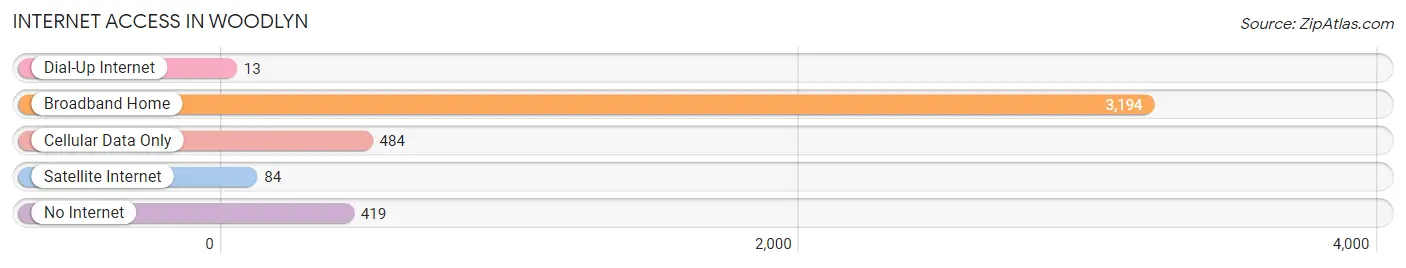
| Internet Type | # Households | % Households |
| Dial-Up Internet | 13 | 0.3% |
| Broadband Home | 3,194 | 77.0% |
| Cellular Data Only | 484 | 11.7% |
| Satellite Internet | 84 | 2.0% |
| No Internet | 419 | 10.1% |
| Total | 4,146 | 100.0% |
Woodlyn Summary
Woodlyn, Pennsylvania is a small borough located in Delaware County, Pennsylvania. It is situated just outside of Philadelphia and is part of the Philadelphia metropolitan area. The population of Woodlyn was 4,845 at the 2010 census.
Geography
Woodlyn is located at 39°54'45" North, 75°17'45" West (39.912500, -75.295833). It is situated in the southeastern corner of Delaware County, Pennsylvania, and is bordered by Ridley Township to the north, Ridley Park to the east, and Tinicum Township to the south and west. The borough is located approximately 8 miles southwest of Philadelphia.
The total area of Woodlyn is 0.7 square miles, all of which is land. The borough is located in the Piedmont region of Pennsylvania, and is characterized by rolling hills and valleys. The borough is drained by Ridley Creek, which flows through the center of the borough.
History
Woodlyn was first settled in the late 1700s by a group of Quakers from England. The borough was originally known as “Woodland”, and was incorporated in 1891. The name was changed to Woodlyn in 1895.
The borough was primarily a farming community until the early 1900s, when the Pennsylvania Railroad began to expand its lines through the area. This led to an influx of new residents and businesses, and the borough began to grow rapidly.
Economy
Woodlyn is primarily a residential community, with most of its residents commuting to nearby Philadelphia for work. The borough does have a few small businesses, including a few restaurants, a grocery store, and a few retail stores.
The median household income in Woodlyn is $50,945, which is slightly higher than the national average. The median home value is $179,400, which is also slightly higher than the national average.
Demographics
As of the 2010 census, the population of Woodlyn was 4,845. The racial makeup of the borough was 87.3% White, 8.2% African American, 0.7% Asian, 0.3% Native American, and 3.5% from other races. Hispanic or Latino of any race were 2.2% of the population.
The median age in Woodlyn is 41.3 years, which is slightly higher than the national average. The gender makeup of the borough is 48.7% male and 51.3% female.
Conclusion
Woodlyn, Pennsylvania is a small borough located in Delaware County, Pennsylvania. It is situated just outside of Philadelphia and is part of the Philadelphia metropolitan area. The borough has a long history, dating back to the late 1700s, and has grown steadily over the years. Woodlyn is primarily a residential community, with most of its residents commuting to nearby Philadelphia for work. The population of Woodlyn was 4,845 at the 2010 census, and the median household income is slightly higher than the national average.
Common Questions
What is Per Capita Income in Woodlyn?
Per Capita income in Woodlyn is $36,911.
What is the Median Family Income in Woodlyn?
Median Family Income in Woodlyn is $100,000.
What is the Median Household income in Woodlyn?
Median Household Income in Woodlyn is $66,818.
What is Income or Wage Gap in Woodlyn?
Income or Wage Gap in Woodlyn is 17.4%.
Women in Woodlyn earn 82.6 cents for every dollar earned by a man.
What is Inequality or Gini Index in Woodlyn?
Inequality or Gini Index in Woodlyn is 0.41.
What is the Total Population of Woodlyn?
Total Population of Woodlyn is 10,347.
What is the Total Male Population of Woodlyn?
Total Male Population of Woodlyn is 5,266.
What is the Total Female Population of Woodlyn?
Total Female Population of Woodlyn is 5,081.
What is the Ratio of Males per 100 Females in Woodlyn?
There are 103.64 Males per 100 Females in Woodlyn.
What is the Ratio of Females per 100 Males in Woodlyn?
There are 96.49 Females per 100 Males in Woodlyn.
What is the Median Population Age in Woodlyn?
Median Population Age in Woodlyn is 39.1 Years.
What is the Average Family Size in Woodlyn
Average Family Size in Woodlyn is 3.4 People.
What is the Average Household Size in Woodlyn
Average Household Size in Woodlyn is 2.5 People.
How Large is the Labor Force in Woodlyn?
There are 5,413 People in the Labor Forcein in Woodlyn.
What is the Percentage of People in the Labor Force in Woodlyn?
64.2% of People are in the Labor Force in Woodlyn.
What is the Unemployment Rate in Woodlyn?
Unemployment Rate in Woodlyn is 5.1%.