Zip Codes with the Highest Percentage of Population Employed in Health Diagnosing & Treating in Eugene, OR
RELATED REPORTS & OPTIONS
Health Diagnosing & Treating
Eugene
Compare Zip Codes
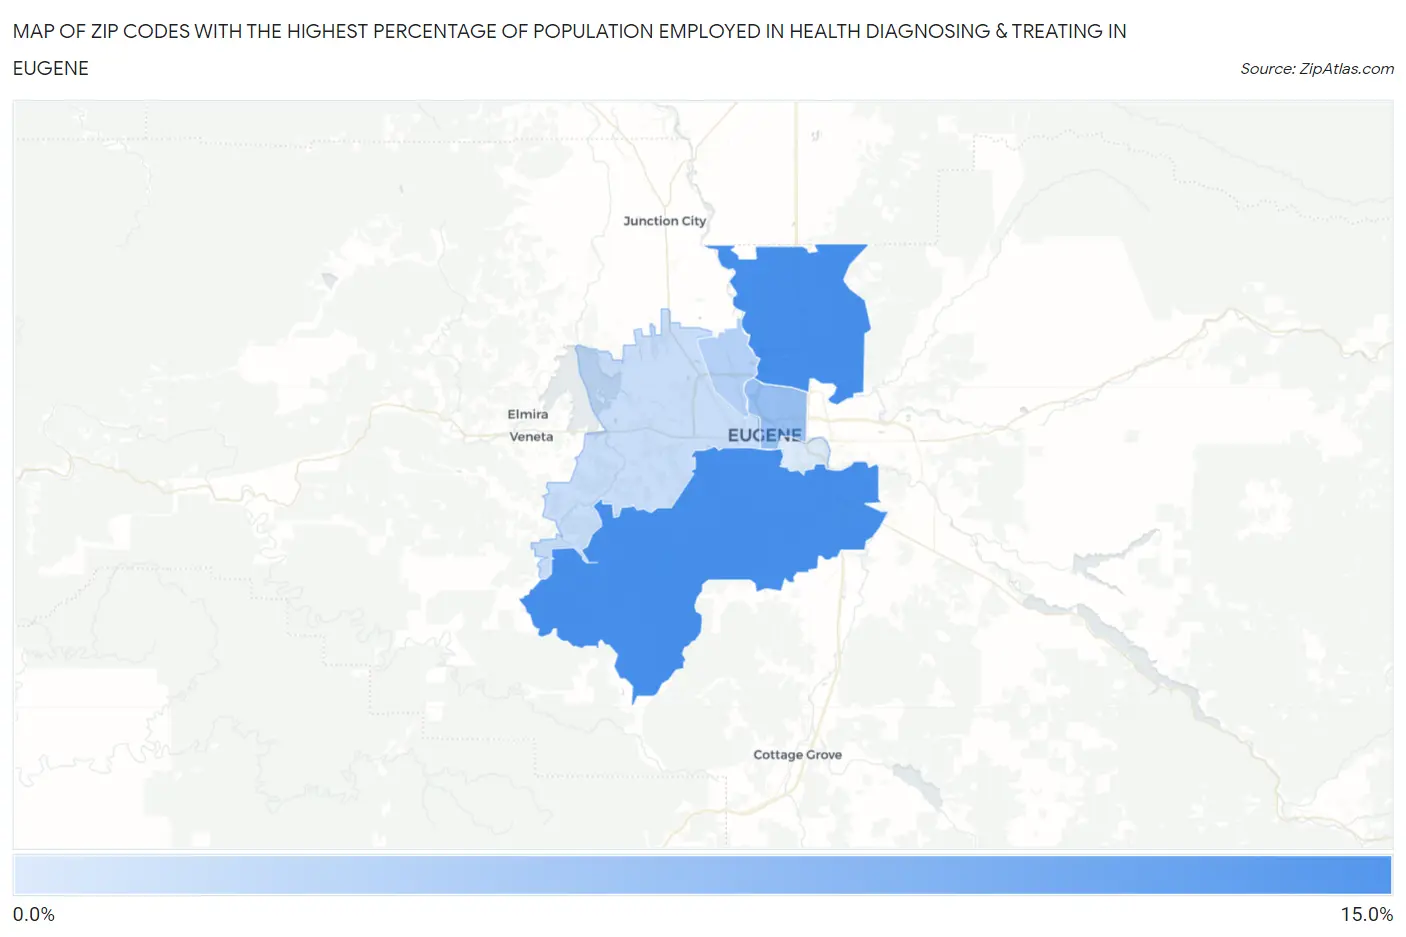
Map of Zip Codes with the Highest Percentage of Population Employed in Health Diagnosing & Treating in Eugene
3.7%
10.4%
Zip Codes with the Highest Percentage of Population Employed in Health Diagnosing & Treating in Eugene, OR
| Zip Code | % Employed | vs State | vs National | |
| 1. | 97405 | 10.4% | 6.1%(+4.29)#28 | 6.2%(+4.12)#3,455 |
| 2. | 97408 | 10.3% | 6.1%(+4.25)#29 | 6.2%(+4.07)#3,518 |
| 3. | 97401 | 6.7% | 6.1%(+0.658)#98 | 6.2%(+0.482)#11,239 |
| 4. | 97404 | 5.5% | 6.1%(-0.607)#146 | 6.2%(-0.782)#15,925 |
| 5. | 97402 | 4.5% | 6.1%(-1.54)#198 | 6.2%(-1.71)#19,528 |
| 6. | 97403 | 3.7% | 6.1%(-2.42)#230 | 6.2%(-2.59)#22,452 |
1
Common Questions
What are the Top 5 Zip Codes with the Highest Percentage of Population Employed in Health Diagnosing & Treating in Eugene, OR?
Top 5 Zip Codes with the Highest Percentage of Population Employed in Health Diagnosing & Treating in Eugene, OR are:
What zip code has the Highest Percentage of Population Employed in Health Diagnosing & Treating in Eugene, OR?
97405 has the Highest Percentage of Population Employed in Health Diagnosing & Treating in Eugene, OR with 10.4%.
What is the Percentage of Population Employed in Health Diagnosing & Treating in Eugene, OR?
Percentage of Population Employed in Health Diagnosing & Treating in Eugene is 7.1%.
What is the Percentage of Population Employed in Health Diagnosing & Treating in Oregon?
Percentage of Population Employed in Health Diagnosing & Treating in Oregon is 6.1%.
What is the Percentage of Population Employed in Health Diagnosing & Treating in the United States?
Percentage of Population Employed in Health Diagnosing & Treating in the United States is 6.2%.