Zip Codes with the Highest Percentage of Population Employed in Health Diagnosing & Treating in Beaverton, OR
RELATED REPORTS & OPTIONS
Health Diagnosing & Treating
Beaverton
Compare Zip Codes
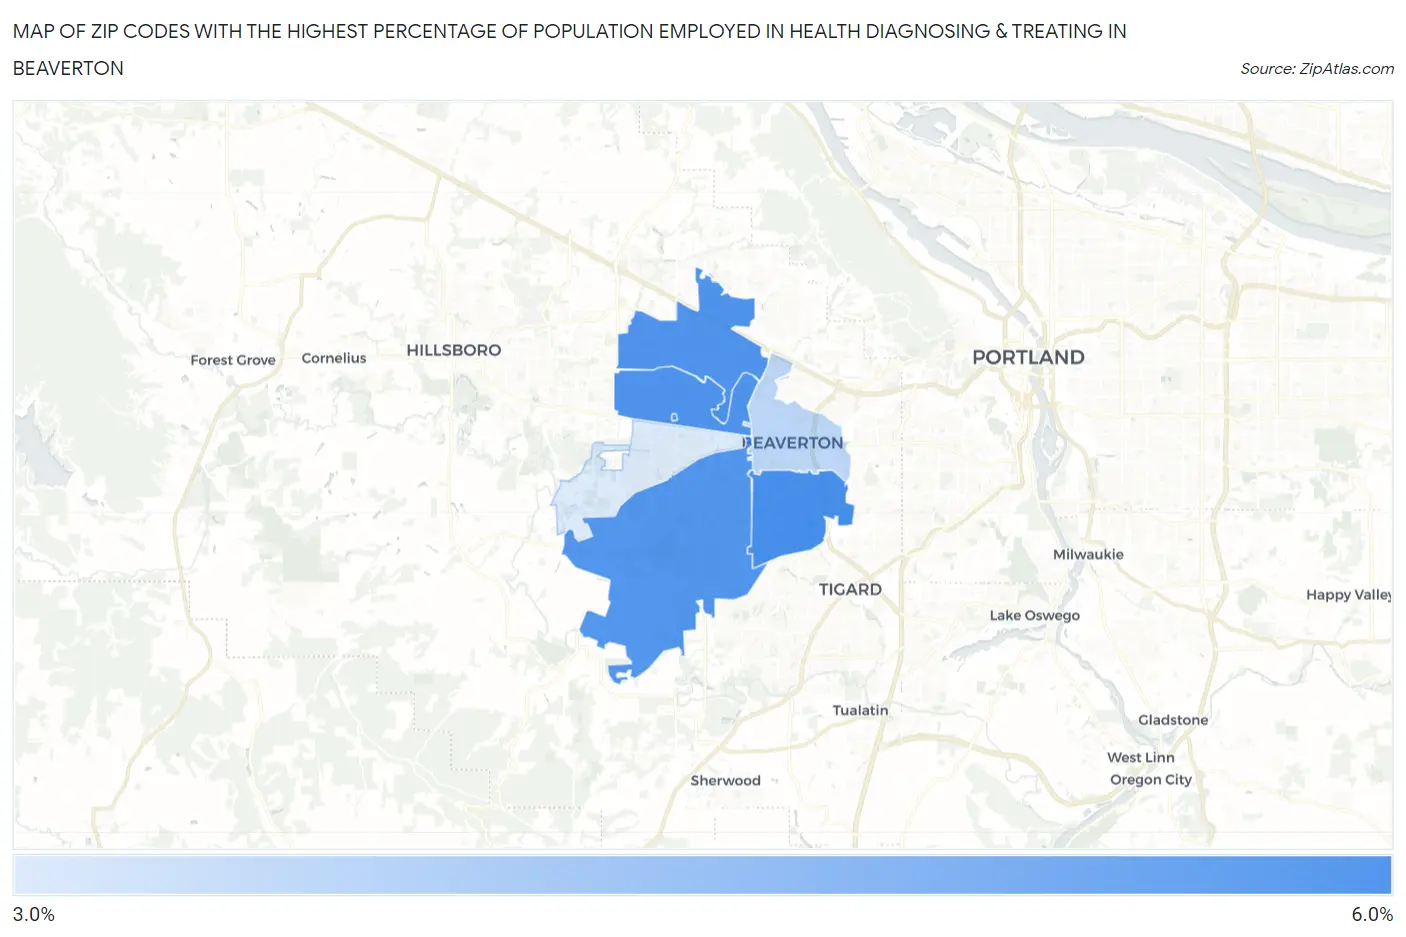
Map of Zip Codes with the Highest Percentage of Population Employed in Health Diagnosing & Treating in Beaverton
3.7%
5.9%
Zip Codes with the Highest Percentage of Population Employed in Health Diagnosing & Treating in Beaverton, OR
| Zip Code | % Employed | vs State | vs National | |
| 1. | 97008 | 5.9% | 6.1%(-0.215)#128 | 6.2%(-0.390)#14,402 |
| 2. | 97003 | 5.7% | 6.1%(-0.320)#131 | 6.2%(-0.495)#14,796 |
| 3. | 97006 | 5.7% | 6.1%(-0.353)#132 | 6.2%(-0.529)#14,919 |
| 4. | 97007 | 5.7% | 6.1%(-0.369)#133 | 6.2%(-0.545)#14,992 |
| 5. | 97005 | 4.1% | 6.1%(-1.95)#214 | 6.2%(-2.13)#20,995 |
| 6. | 97078 | 3.7% | 6.1%(-2.41)#229 | 6.2%(-2.58)#22,423 |
1
Common Questions
What are the Top 5 Zip Codes with the Highest Percentage of Population Employed in Health Diagnosing & Treating in Beaverton, OR?
Top 5 Zip Codes with the Highest Percentage of Population Employed in Health Diagnosing & Treating in Beaverton, OR are:
What zip code has the Highest Percentage of Population Employed in Health Diagnosing & Treating in Beaverton, OR?
97008 has the Highest Percentage of Population Employed in Health Diagnosing & Treating in Beaverton, OR with 5.9%.
What is the Percentage of Population Employed in Health Diagnosing & Treating in Beaverton, OR?
Percentage of Population Employed in Health Diagnosing & Treating in Beaverton is 6.0%.
What is the Percentage of Population Employed in Health Diagnosing & Treating in Oregon?
Percentage of Population Employed in Health Diagnosing & Treating in Oregon is 6.1%.
What is the Percentage of Population Employed in Health Diagnosing & Treating in the United States?
Percentage of Population Employed in Health Diagnosing & Treating in the United States is 6.2%.