Zip Codes with the Highest Percentage of Population Employed in Health Diagnosing & Treating in Springfield, OR
RELATED REPORTS & OPTIONS
Health Diagnosing & Treating
Springfield
Compare Zip Codes
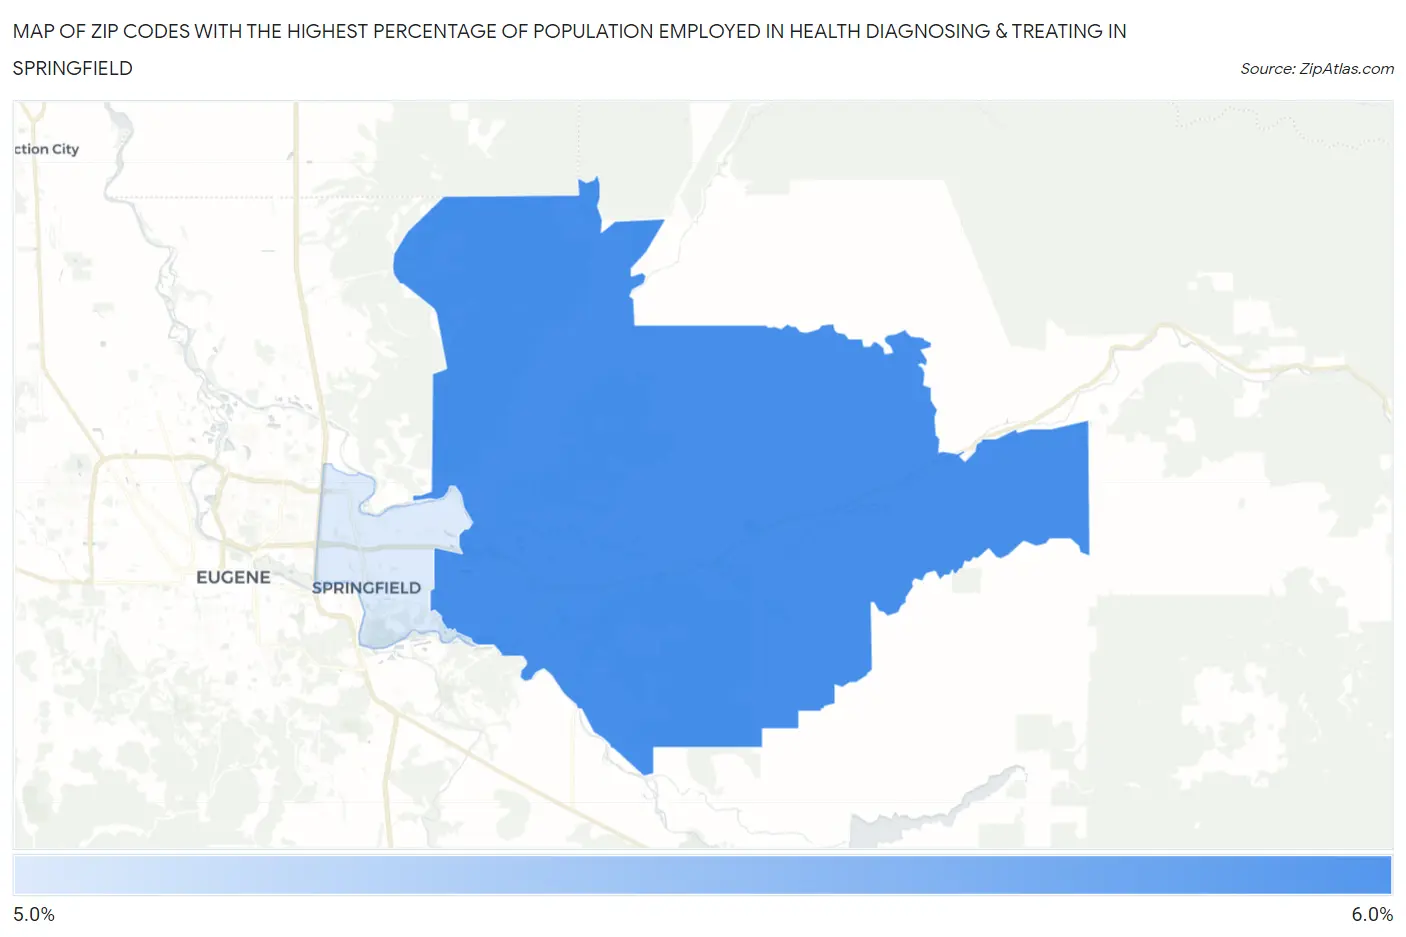
Map of Zip Codes with the Highest Percentage of Population Employed in Health Diagnosing & Treating in Springfield
5.1%
5.8%
Zip Codes with the Highest Percentage of Population Employed in Health Diagnosing & Treating in Springfield, OR
| Zip Code | % Employed | vs State | vs National | |
| 1. | 97478 | 5.8% | 6.1%(-0.229)#129 | 6.2%(-0.405)#14,452 |
| 2. | 97477 | 5.1% | 6.1%(-0.941)#169 | 6.2%(-1.12)#17,230 |
1
Common Questions
What are the Top Zip Codes with the Highest Percentage of Population Employed in Health Diagnosing & Treating in Springfield, OR?
Top Zip Codes with the Highest Percentage of Population Employed in Health Diagnosing & Treating in Springfield, OR are:
What zip code has the Highest Percentage of Population Employed in Health Diagnosing & Treating in Springfield, OR?
97478 has the Highest Percentage of Population Employed in Health Diagnosing & Treating in Springfield, OR with 5.8%.
What is the Percentage of Population Employed in Health Diagnosing & Treating in Springfield, OR?
Percentage of Population Employed in Health Diagnosing & Treating in Springfield is 4.6%.
What is the Percentage of Population Employed in Health Diagnosing & Treating in Oregon?
Percentage of Population Employed in Health Diagnosing & Treating in Oregon is 6.1%.
What is the Percentage of Population Employed in Health Diagnosing & Treating in the United States?
Percentage of Population Employed in Health Diagnosing & Treating in the United States is 6.2%.