Zip Codes with the Highest Percentage of Owner-Occupied Units in Tulsa, OK

RELATED REPORTS & OPTIONS

Highest Owner-Occupied
Population
Families and Households
Female Fertility
Female Fertility (Unmarried)
Race (Community Size)
Race (Percentage)
Ancestry (Community Size)
AfghanAfricanAleutAmericanApacheArabArapahoArgentineanArmenianAustralianAustrianBahamianBangladeshiBasqueBelgianBelizeanBhutaneseBlackfeetBolivianBrazilianBritishBulgarianBurmeseCajunCanadianCelticCentral AmericanCentral American IndianCherokeeCheyenneChickasawChileanChippewaChoctawColombianComancheCosta RicanCreekCroatianCubanCzechCzechoslovakianDanishDelawareDominicanDutchDutch West IndianEastern EuropeanEcuadorianEgyptianEnglishEstonianEthiopianEuropeanFilipinoFinnishFrenchFrench American IndianFrench CanadianGermanGerman RussianGhanaianGreekGuamanian / ChamorroGuatemalanHaitianHonduranHungarianIcelanderIndian (Asian)IndonesianInupiatIranianIraqiIrishIroquoisIsraeliItalianJamaicanJapaneseJordanianKenyanKiowaKoreanLaotianLatvianLebaneseLiberianLithuanianLumbeeLuxembourgerMalaysianMexicanMexican American IndianMoroccanNative HawaiianNavajoNicaraguanNigerianNorthern EuropeanNorwegianOsageOttawaPakistaniPalestinianPanamanianPennsylvania GermanPeruvianPimaPolishPortuguesePotawatomiPuebloPuerto RicanRomanianRussianSalvadoranSamoanScandinavianScotch-IrishScottishSeminoleSiouxSlavicSlovakSloveneSouth AmericanSouth American IndianSpaniardSpanishSpanish AmericanSri LankanSubsaharan AfricanSudaneseSwedishSwissSyrianThaiTlingit-HaidaTrinidadian and TobagonianTurkishUgandanUkrainianUruguayanVenezuelanVietnameseWelshWest IndianYugoslavian
Ancestry (Percentage)
AfghanAfricanAleutAmericanApacheArabArapahoArgentineanArmenianAustralianAustrianBahamianBangladeshiBasqueBelgianBelizeanBhutaneseBlackfeetBolivianBrazilianBritishBulgarianBurmeseCajunCanadianCelticCentral AmericanCentral American IndianCherokeeCheyenneChickasawChileanChippewaChoctawColombianComancheCosta RicanCreekCroatianCubanCzechCzechoslovakianDanishDelawareDominicanDutchDutch West IndianEastern EuropeanEcuadorianEgyptianEnglishEstonianEthiopianEuropeanFilipinoFinnishFrenchFrench American IndianFrench CanadianGermanGerman RussianGhanaianGreekGuamanian / ChamorroGuatemalanHaitianHonduranHungarianIcelanderIndian (Asian)IndonesianInupiatIranianIraqiIrishIroquoisIsraeliItalianJamaicanJapaneseJordanianKenyanKiowaKoreanLaotianLatvianLebaneseLiberianLithuanianLumbeeLuxembourgerMalaysianMexicanMexican American IndianMoroccanNative HawaiianNavajoNicaraguanNigerianNorthern EuropeanNorwegianOsageOttawaPakistaniPalestinianPanamanianPennsylvania GermanPeruvianPimaPolishPortuguesePotawatomiPuebloPuerto RicanRomanianRussianSalvadoranSamoanScandinavianScotch-IrishScottishSeminoleSiouxSlavicSlovakSloveneSouth AmericanSouth American IndianSpaniardSpanishSpanish AmericanSri LankanSubsaharan AfricanSudaneseSwedishSwissSyrianThaiTlingit-HaidaTrinidadian and TobagonianTurkishUgandanUkrainianUruguayanVenezuelanVietnameseWelshWest IndianYugoslavian
Immigrant Origin (Total)
AfghanistanAfricaArgentinaAsiaAustraliaAustriaBahamasBangladeshBelgiumBelizeBoliviaBrazilBurma / MyanmarCameroonCanadaCaribbeanCentral AmericaChileChinaColombiaCosta RicaCubaDenmarkDominican RepublicEastern AfricaEastern AsiaEastern EuropeEcuadorEgyptEl SalvadorEnglandEritreaEthiopiaEuropeFranceGermanyGhanaGreeceGuatemalaHaitiHondurasHong KongIndiaIndonesiaIranIraqIrelandIsraelItalyJamaicaJapanJordanKazakhstanKenyaKoreaKuwaitLaosLatin AmericaLatviaLebanonLiberiaMalaysiaMexicoMicronesiaMiddle AfricaMoroccoNepalNetherlandsNicaraguaNigeriaNorthern AfricaNorthern EuropeNorwayOceaniaPakistanPanamaPeruPhilippinesPolandPortugalRomaniaRussiaSaudi ArabiaScotlandSouth AfricaSouth AmericaSouth Central AsiaSouth Eastern AsiaSouthern EuropeSpainSwedenSyriaTaiwanThailandTrinidad and TobagoTurkeyUgandaUkraineUruguayVenezuelaVietnamWestern AfricaWestern AsiaWestern EuropeZaireZimbabwe
Immigrant Origin (Percentage)
AfghanistanAfricaArgentinaAsiaAustraliaAustriaBahamasBangladeshBelgiumBelizeBoliviaBrazilBurma / MyanmarCameroonCanadaCaribbeanCentral AmericaChileChinaColombiaCosta RicaCubaDenmarkDominican RepublicEastern AfricaEastern AsiaEastern EuropeEcuadorEgyptEl SalvadorEnglandEritreaEthiopiaEuropeFranceGermanyGhanaGreeceGuatemalaHaitiHondurasHong KongIndiaIndonesiaIranIraqIrelandIsraelItalyJamaicaJapanJordanKazakhstanKenyaKoreaKuwaitLaosLatin AmericaLatviaLebanonLiberiaMalaysiaMexicoMicronesiaMiddle AfricaMoroccoNepalNetherlandsNicaraguaNigeriaNorthern AfricaNorthern EuropeNorwayOceaniaPakistanPanamaPeruPhilippinesPolandPortugalRomaniaRussiaSaudi ArabiaScotlandSouth AfricaSouth AmericaSouth Central AsiaSouth Eastern AsiaSouthern EuropeSpainSwedenSyriaTaiwanThailandTrinidad and TobagoTurkeyUgandaUkraineUruguayVenezuelaVietnamWestern AfricaWestern AsiaWestern EuropeZaireZimbabwe
Income
Income (Families)
Income (Households)
Poverty
Poverty (Families)
Unemployment
Employment Occupations
Employment Industries
Employer Class
Commute Time
Commute Means
School Enrollment
Education by Degree Field
Occupancy
Finances
Physical Characteristics
Tulsa
Compare Zip Codes
Comparison Subject

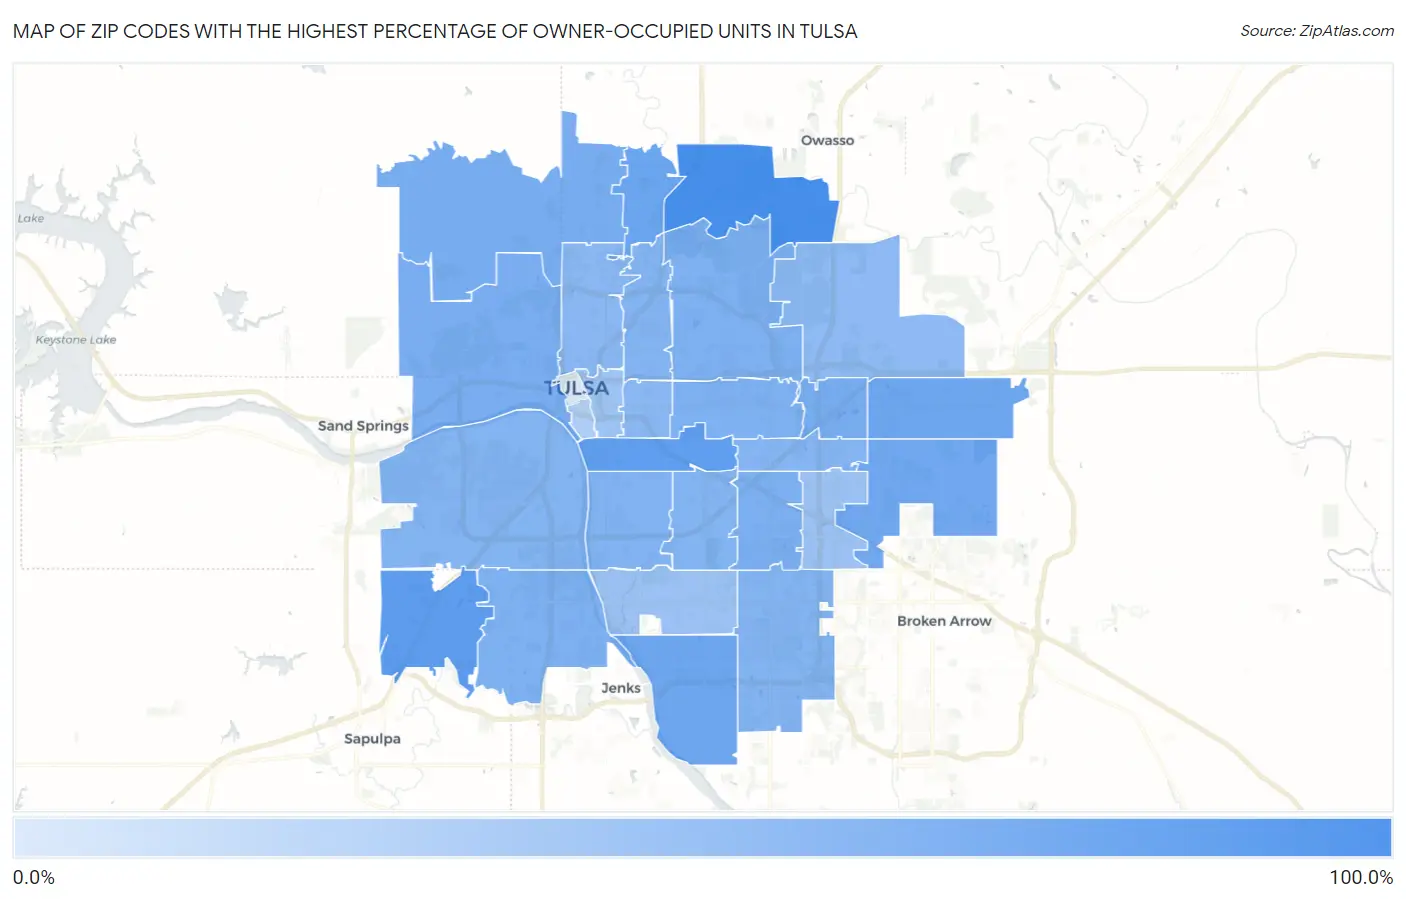
Map of Zip Codes with the Highest Percentage of Owner-Occupied Units in Tulsa

0.0%
100.0%
Zip Codes with the Highest Percentage of Owner-Occupied Units in Tulsa Map

Zip Codes with the Highest Percentage of Owner-Occupied Units in Tulsa, OK

Zip Code % Owner-Occupied vs State vs National
1.74117100.0%65.9%(+34.1)#1564.8%(+35.2)#1,490
2.7413179.1%65.9%(+13.1)#28164.8%(+14.3)#15,461
3.7411477.9%65.9%(+12.0)#30264.8%(+13.1)#16,541
4.7413069.7%65.9%(+3.79)#47964.8%(+4.91)#22,931
5.7410867.8%65.9%(+1.83)#49964.8%(+2.96)#24,102
6.7413767.8%65.9%(+1.83)#50064.8%(+2.96)#24,103
7.7413465.3%65.9%(-0.631)#52964.8%(+0.493)#25,310
8.7412660.9%65.9%(-5.04)#56164.8%(-3.92)#27,129
9.7412859.7%65.9%(-6.22)#56764.8%(-5.09)#27,493
10.7412758.0%65.9%(-7.99)#57664.8%(-6.87)#27,992
11.7414557.6%65.9%(-8.39)#58064.8%(-7.26)#28,095
12.7413256.0%65.9%(-9.90)#58864.8%(-8.78)#28,485
13.7411255.9%65.9%(-10.0)#58964.8%(-8.88)#28,516
14.7411554.8%65.9%(-11.1)#59664.8%(-9.97)#28,797
15.7410554.3%65.9%(-11.7)#59864.8%(-10.6)#28,920
16.7410752.8%65.9%(-13.2)#60264.8%(-12.1)#29,220
17.7413551.9%65.9%(-14.1)#60664.8%(-12.9)#29,400
18.7411051.4%65.9%(-14.6)#60964.8%(-13.4)#29,474
19.7413351.4%65.9%(-14.6)#61064.8%(-13.4)#29,479
20.7412949.8%65.9%(-16.2)#61264.8%(-15.0)#29,775
21.7410447.4%65.9%(-18.6)#61864.8%(-17.5)#30,144
22.7410647.0%65.9%(-18.9)#61964.8%(-17.8)#30,200
23.7411644.7%65.9%(-21.2)#62464.8%(-20.1)#30,522
24.7413636.8%65.9%(-29.1)#63764.8%(-28.0)#31,281
25.7414634.7%65.9%(-31.2)#64064.8%(-30.1)#31,456
26.7412033.9%65.9%(-32.1)#64264.8%(-30.9)#31,524
27.7411924.9%65.9%(-41.1)#64564.8%(-39.9)#31,988
28.741030.85%65.9%(-65.1)#65164.8%(-64.0)#32,494

Common Questions

What are the Top 10 Zip Codes with the Highest Percentage of Owner-Occupied Units in Tulsa, OK?
Top 10 Zip Codes with the Highest Percentage of Owner-Occupied Units in Tulsa, OK are:
#1
100.0%
#2
79.1%
#3
77.9%
#4
69.7%
#5
67.8%
#6
67.8%
#7
65.3%
#8
60.9%
#9
59.7%
#10
58.0%
What zip code has the Highest Percentage of Owner-Occupied Units in Tulsa, OK?
74117 has the Highest Percentage of Owner-Occupied Units in Tulsa, OK with 100.0%.
What is the Percentage of Owner-Occupied Units in Tulsa, OK?
Percentage of Owner-Occupied Units in Tulsa is 52.3%.
What is the Percentage of Owner-Occupied Units in Oklahoma?
Percentage of Owner-Occupied Units in Oklahoma is 65.9%.
What is the Percentage of Owner-Occupied Units in the United States?
Percentage of Owner-Occupied Units in the United States is 64.8%.