Zip Codes with the Highest Percentage of Households with Income Above $100,000 in Trenton, NJ

RELATED REPORTS & OPTIONS

Household Income | $100k+
Population
Families and Households
Female Fertility
Female Fertility (Unmarried)
Race (Community Size)
Race (Percentage)
Ancestry (Community Size)
AfricanAlbanianAmericanArabArgentineanArmenianAustrianBarbadianBelgianBhutaneseBrazilianBritishBritish West IndianBulgarianBurmeseCanadianCentral AmericanCentral American IndianCherokeeChileanChippewaColombianCosta RicanCroatianCubanCzechCzechoslovakianDanishDominicanDutchEastern EuropeanEcuadorianEgyptianEnglishEstonianEthiopianEuropeanFilipinoFinnishFrenchFrench CanadianGermanGhanaianGreekGuamanian / ChamorroGuatemalanGuyaneseHaitianHonduranHungarianIndian (Asian)IndonesianIrishIroquoisIsraeliItalianJamaicanKoreanLaotianLatvianLebaneseLiberianLithuanianMexicanMoroccanNicaraguanNigerianNorthern EuropeanNorwegianPakistaniPalestinianPanamanianPennsylvania GermanPeruvianPolishPortuguesePuerto RicanRomanianRussianSalvadoranSamoanScandinavianScotch-IrishScottishSenegaleseSerbianSiouxSlavicSlovakSouth AmericanSpaniardSpanishSri LankanSubsaharan AfricanSwedishSwissSyrianThaiTrinidadian and TobagonianTurkishU.S. Virgin IslanderUkrainianUruguayanVenezuelanVietnameseWelshWest IndianYugoslavian
Ancestry (Percentage)
AfricanAlbanianAmericanArabArgentineanArmenianAustrianBarbadianBelgianBhutaneseBrazilianBritishBritish West IndianBulgarianBurmeseCanadianCentral AmericanCentral American IndianCherokeeChileanChippewaColombianCosta RicanCroatianCubanCzechCzechoslovakianDanishDominicanDutchEastern EuropeanEcuadorianEgyptianEnglishEstonianEthiopianEuropeanFilipinoFinnishFrenchFrench CanadianGermanGhanaianGreekGuamanian / ChamorroGuatemalanGuyaneseHaitianHonduranHungarianIndian (Asian)IndonesianIrishIroquoisIsraeliItalianJamaicanKoreanLaotianLatvianLebaneseLiberianLithuanianMexicanMoroccanNicaraguanNigerianNorthern EuropeanNorwegianPakistaniPalestinianPanamanianPennsylvania GermanPeruvianPolishPortuguesePuerto RicanRomanianRussianSalvadoranSamoanScandinavianScotch-IrishScottishSenegaleseSerbianSiouxSlavicSlovakSouth AmericanSpaniardSpanishSri LankanSubsaharan AfricanSwedishSwissSyrianThaiTrinidadian and TobagonianTurkishU.S. Virgin IslanderUkrainianUruguayanVenezuelanVietnameseWelshWest IndianYugoslavian
Immigrant Origin (Total)
Immigrant Origin (Percentage)
Income
Income (Families)
Income (Households)
Poverty
Poverty (Families)
Unemployment
Employment Occupations
Employment Industries
Employer Class
Commute Time
Commute Means
School Enrollment
Education by Degree Field
Occupancy
Finances
Physical Characteristics
Trenton
Compare Zip Codes
Comparison Subject

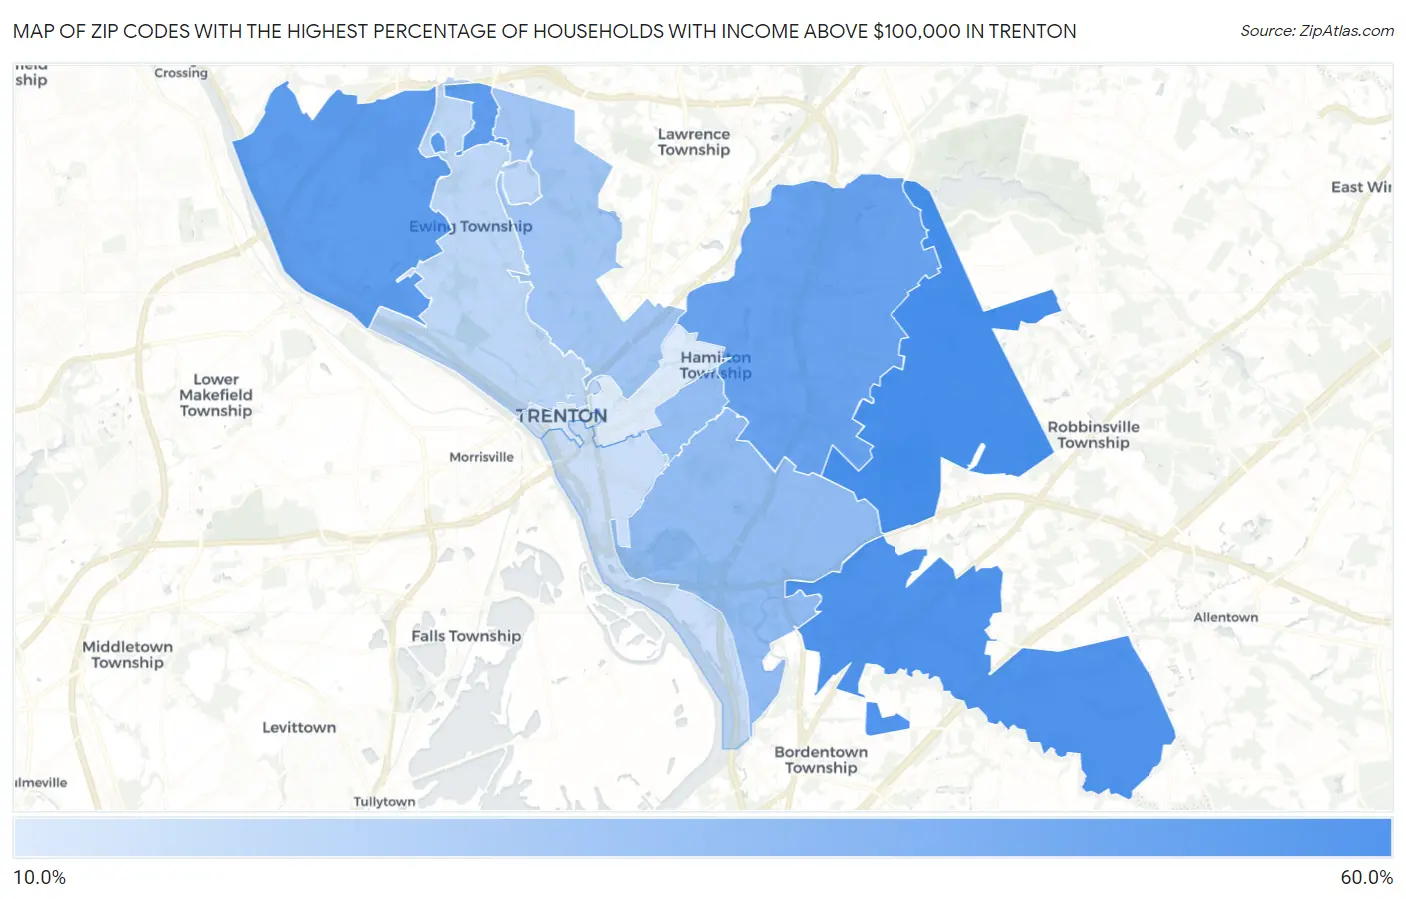
Map of Zip Codes with the Highest Percentage of Households with Income Above $100,000 in Trenton

0.0%
60.0%
Zip Codes with the Highest Percentage of Households with Income Above $100,000 in Trenton Map

Zip Codes with the Highest Percentage of Households with Income Above $100,000 in Trenton, NJ

Zip Code Households with Income > $100k vs State vs National
1.0869058.1%48.7%(+9.40)#22237.3%(+20.8)#2,740
2.0862055.6%48.7%(+6.90)#25837.3%(+18.3)#3,297
3.0862850.9%48.7%(+2.20)#32837.3%(+13.6)#4,577
4.0861947.8%48.7%(-0.900)#35737.3%(+10.5)#5,563
5.0861036.1%48.7%(-12.6)#47837.3%(-1.20)#11,074
6.0862935.3%48.7%(-13.4)#48537.3%(-2.00)#11,596
7.0863831.1%48.7%(-17.6)#50737.3%(-6.20)#14,558
8.0861823.8%48.7%(-24.9)#54137.3%(-13.5)#20,819
9.0861120.5%48.7%(-28.2)#55537.3%(-16.8)#23,631
10.0860916.3%48.7%(-32.4)#56737.3%(-21.0)#26,714
11.0860816.1%48.7%(-32.6)#56837.3%(-21.2)#26,899

Common Questions

What are the Top 10 Zip Codes with the Highest Percentage of Households with Income Above $100,000 in Trenton, NJ?
Top 10 Zip Codes with the Highest Percentage of Households with Income Above $100,000 in Trenton, NJ are:
#1
58.1%
#2
55.6%
#3
50.9%
#4
47.8%
#5
36.1%
#6
35.3%
#7
31.1%
#8
23.8%
#9
20.5%
#10
16.3%
What zip code has the Highest Percentage of Households with Income Above $100,000 in Trenton, NJ?
08690 has the Highest Percentage of Households with Income Above $100,000 in Trenton, NJ with 58.1%.
What is the Percentage of Households with Income Above $100,000 in Trenton, NJ?
Percentage of Households with Income Above $100,000 in Trenton is 20.1%.
What is the Percentage of Households with Income Above $100,000 in New Jersey?
Percentage of Households with Income Above $100,000 in New Jersey is 48.7%.
What is the Percentage of Households with Income Above $100,000 in the United States?
Percentage of Households with Income Above $100,000 in the United States is 37.3%.