New England, ND Map & Demographics
New England Map
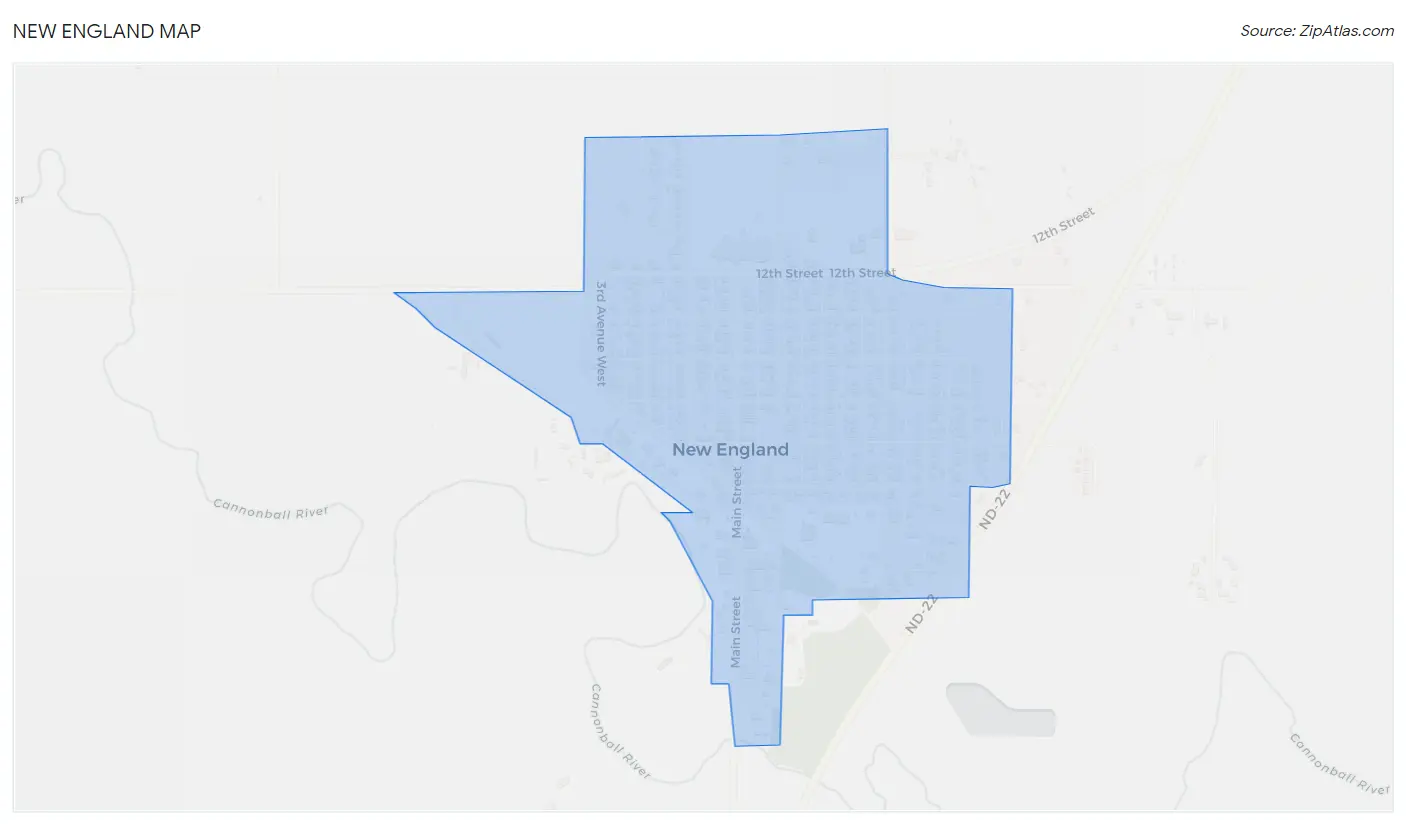
New England Overview
$38,265
PER CAPITA INCOME
$88,438
AVG FAMILY INCOME
$70,735
AVG HOUSEHOLD INCOME
45.3%
WAGE / INCOME GAP [ % ]
54.7¢/ $1
WAGE / INCOME GAP [ $ ]
0.56
INEQUALITY / GINI INDEX
810
TOTAL POPULATION
339
MALE POPULATION
471
FEMALE POPULATION
71.97
MALES / 100 FEMALES
138.94
FEMALES / 100 MALES
32.6
MEDIAN AGE
3.5
AVG FAMILY SIZE
2.6
AVG HOUSEHOLD SIZE
404
LABOR FORCE [ PEOPLE ]
60.5%
PERCENT IN LABOR FORCE
6.9%
UNEMPLOYMENT RATE
New England Zip Codes
New England Area Codes
Income in New England
Income Overview in New England
Per Capita Income in New England is $38,265, while median incomes of families and households are $88,438 and $70,735 respectively.
| Characteristic | Number | Measure |
| Per Capita Income | 810 | $38,265 |
| Median Family Income | 155 | $88,438 |
| Mean Family Income | 155 | $131,579 |
| Median Household Income | 268 | $70,735 |
| Mean Household Income | 268 | $92,662 |
| Income Deficit | 155 | $0 |
| Wage / Income Gap (%) | 810 | 45.25% |
| Wage / Income Gap ($) | 810 | 54.75¢ per $1 |
| Gini / Inequality Index | 810 | 0.56 |
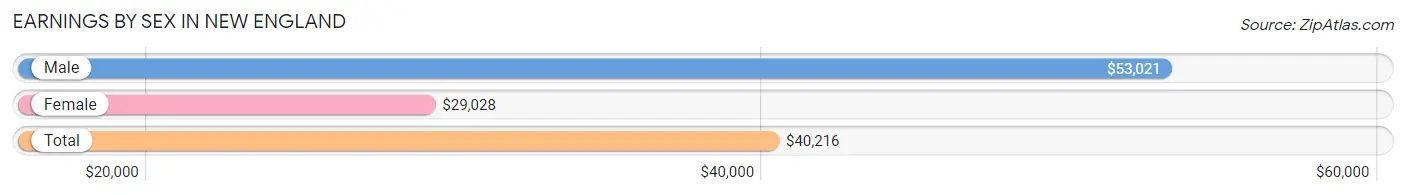
Earnings by Sex in New England
Average Earnings in New England are $40,216, $53,021 for men and $29,028 for women, a difference of 45.3%.
| Sex | Number | Average Earnings |
| Male | 211 (42.9%) | $53,021 |
| Female | 281 (57.1%) | $29,028 |
| Total | 492 (100.0%) | $40,216 |
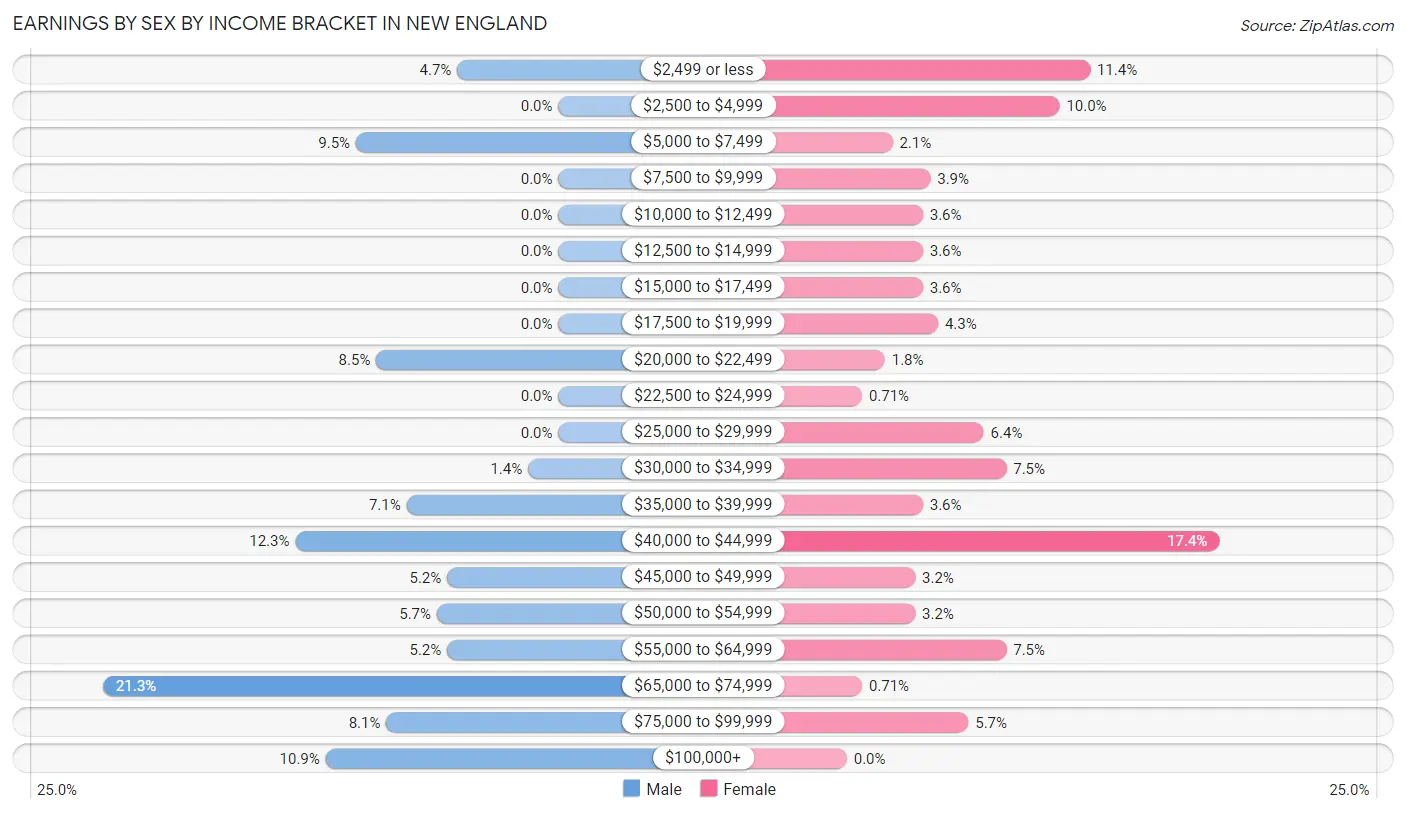
Earnings by Sex by Income Bracket in New England
The most common earnings brackets in New England are $65,000 to $74,999 for men (45 | 21.3%) and $40,000 to $44,999 for women (49 | 17.4%).
| Income | Male | Female |
| $2,499 or less | 10 (4.7%) | 32 (11.4%) |
| $2,500 to $4,999 | 0 (0.0%) | 28 (10.0%) |
| $5,000 to $7,499 | 20 (9.5%) | 6 (2.1%) |
| $7,500 to $9,999 | 0 (0.0%) | 11 (3.9%) |
| $10,000 to $12,499 | 0 (0.0%) | 10 (3.6%) |
| $12,500 to $14,999 | 0 (0.0%) | 10 (3.6%) |
| $15,000 to $17,499 | 0 (0.0%) | 10 (3.6%) |
| $17,500 to $19,999 | 0 (0.0%) | 12 (4.3%) |
| $20,000 to $22,499 | 18 (8.5%) | 5 (1.8%) |
| $22,500 to $24,999 | 0 (0.0%) | 2 (0.7%) |
| $25,000 to $29,999 | 0 (0.0%) | 18 (6.4%) |
| $30,000 to $34,999 | 3 (1.4%) | 21 (7.5%) |
| $35,000 to $39,999 | 15 (7.1%) | 10 (3.6%) |
| $40,000 to $44,999 | 26 (12.3%) | 49 (17.4%) |
| $45,000 to $49,999 | 11 (5.2%) | 9 (3.2%) |
| $50,000 to $54,999 | 12 (5.7%) | 9 (3.2%) |
| $55,000 to $64,999 | 11 (5.2%) | 21 (7.5%) |
| $65,000 to $74,999 | 45 (21.3%) | 2 (0.7%) |
| $75,000 to $99,999 | 17 (8.1%) | 16 (5.7%) |
| $100,000+ | 23 (10.9%) | 0 (0.0%) |
| Total | 211 (100.0%) | 281 (100.0%) |
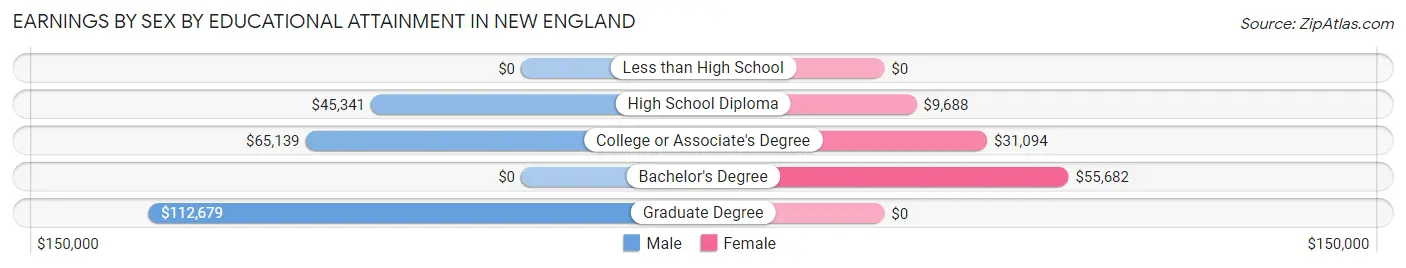
Earnings by Sex by Educational Attainment in New England
Average earnings in New England are $54,063 for men and $28,750 for women, a difference of 46.8%. Men with an educational attainment of graduate degree enjoy the highest average annual earnings of $112,679, while those with high school diploma education earn the least with $45,341. Women with an educational attainment of bachelor's degree earn the most with the average annual earnings of $55,682, while those with high school diploma education have the smallest earnings of $9,688.
| Educational Attainment | Male Income | Female Income |
| Less than High School | - | - |
| High School Diploma | $45,341 | $9,688 |
| College or Associate's Degree | $65,139 | $31,094 |
| Bachelor's Degree | - | - |
| Graduate Degree | $112,679 | $0 |
| Total | $54,063 | $28,750 |
Family Income in New England
Family Income Brackets in New England
According to the New England family income data, there are 43 families falling into the $100,000 to $149,999 income range, which is the most common income bracket and makes up 27.7% of all families.
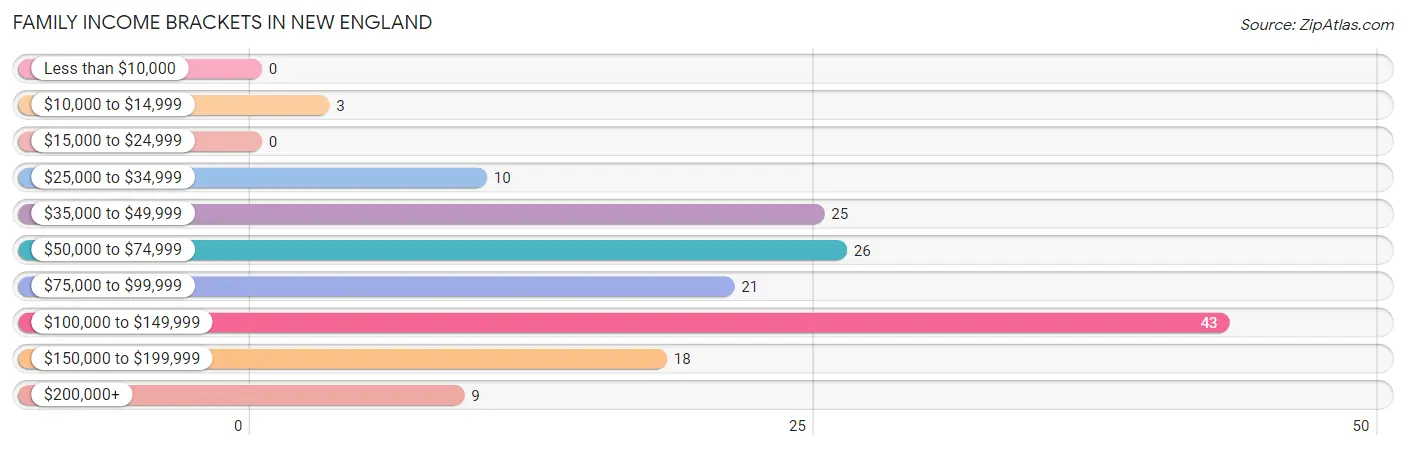
| Income Bracket | # Families | % Families |
| Less than $10,000 | 0 | 0.0% |
| $10,000 to $14,999 | 3 | 1.9% |
| $15,000 to $24,999 | 0 | 0.0% |
| $25,000 to $34,999 | 10 | 6.5% |
| $35,000 to $49,999 | 25 | 16.1% |
| $50,000 to $74,999 | 26 | 16.8% |
| $75,000 to $99,999 | 21 | 13.5% |
| $100,000 to $149,999 | 43 | 27.7% |
| $150,000 to $199,999 | 18 | 11.6% |
| $200,000+ | 9 | 5.8% |
Family Income by Famaliy Size in New England
4-person families (10 | 6.5%) account for the highest median family income in New England with $141,250 per family, while 3-person families (27 | 17.4%) have the highest median income of $36,172 per family member.
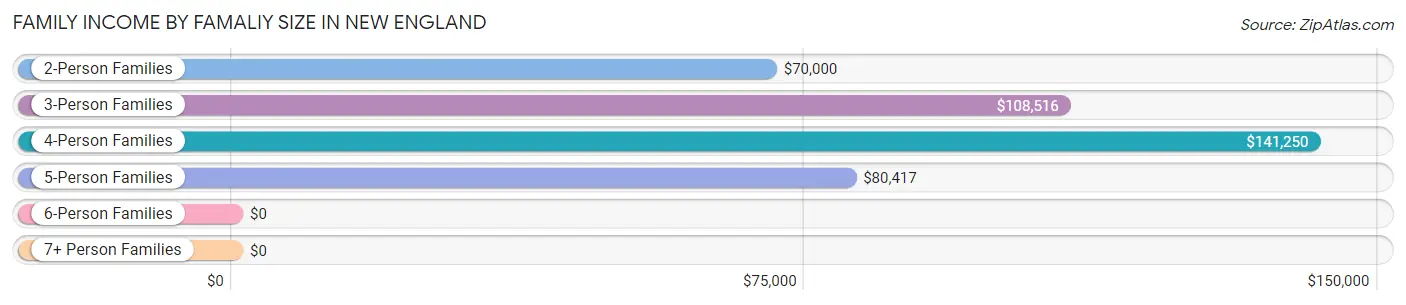
| Income Bracket | # Families | Median Income |
| 2-Person Families | 86 (55.5%) | $70,000 |
| 3-Person Families | 27 (17.4%) | $108,516 |
| 4-Person Families | 10 (6.5%) | $141,250 |
| 5-Person Families | 11 (7.1%) | $80,417 |
| 6-Person Families | 13 (8.4%) | $0 |
| 7+ Person Families | 8 (5.2%) | $0 |
| Total | 155 (100.0%) | $88,438 |
Family Income by Number of Earners in New England
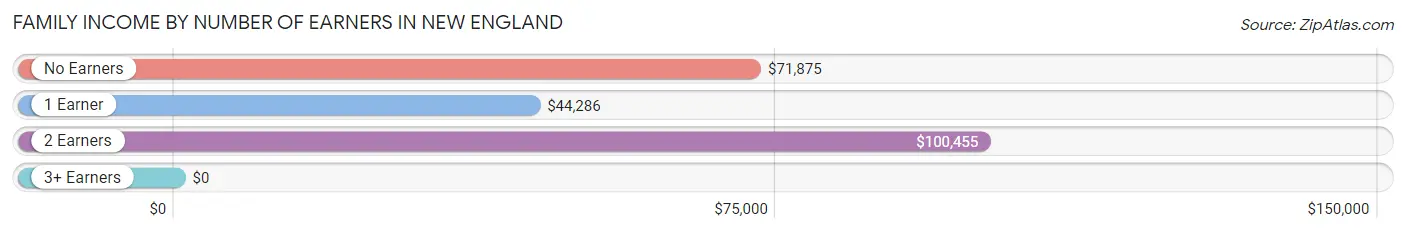
| Number of Earners | # Families | Median Income |
| No Earners | 17 (11.0%) | $71,875 |
| 1 Earner | 62 (40.0%) | $44,286 |
| 2 Earners | 48 (31.0%) | $100,455 |
| 3+ Earners | 28 (18.1%) | $0 |
| Total | 155 (100.0%) | $88,438 |
Household Income in New England
Household Income Brackets in New England
With 50 households falling in the category, the $75,000 to $99,999 income range is the most frequent in New England, accounting for 18.7% of all households. In contrast, only 9 households (3.4%) fall into the $200,000+ income bracket, making it the least populous group.
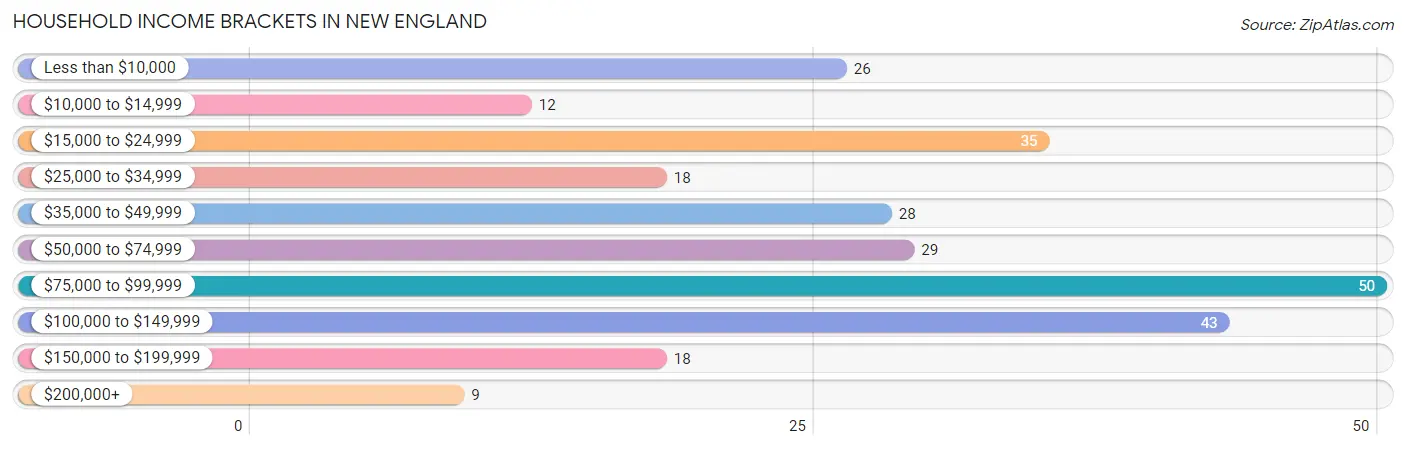
| Income Bracket | # Households | % Households |
| Less than $10,000 | 26 | 9.7% |
| $10,000 to $14,999 | 12 | 4.5% |
| $15,000 to $24,999 | 35 | 13.1% |
| $25,000 to $34,999 | 18 | 6.7% |
| $35,000 to $49,999 | 28 | 10.4% |
| $50,000 to $74,999 | 29 | 10.8% |
| $75,000 to $99,999 | 50 | 18.7% |
| $100,000 to $149,999 | 43 | 16.0% |
| $150,000 to $199,999 | 18 | 6.7% |
| $200,000+ | 9 | 3.4% |
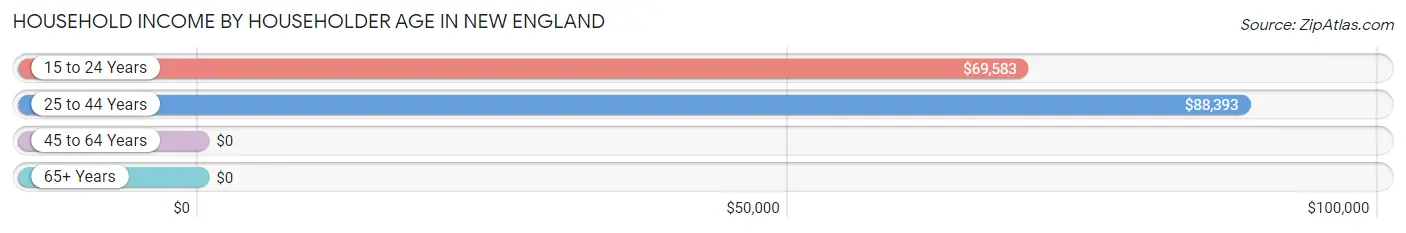
Household Income by Householder Age in New England
The median household income in New England is $70,735, with the highest median household income of $88,393 found in the 25 to 44 years age bracket for the primary householder. A total of 105 households (39.2%) fall into this category. Meanwhile, the 45 to 64 years age bracket for the primary householder has the lowest median household income of $0, with 66 households (24.6%) in this group.
| Income Bracket | # Households | Median Income |
| 15 to 24 Years | 15 (5.6%) | $69,583 |
| 25 to 44 Years | 105 (39.2%) | $88,393 |
| 45 to 64 Years | 66 (24.6%) | $0 |
| 65+ Years | 82 (30.6%) | $0 |
| Total | 268 (100.0%) | $70,735 |
Poverty in New England
Income Below Poverty by Sex and Age in New England
With 10.6% poverty level for males and 10.3% for females among the residents of New England, 45 to 54 year old males and 55 to 64 year old females are the most vulnerable to poverty, with 19 males (50.0%) and 26 females (72.2%) in their respective age groups living below the poverty level.
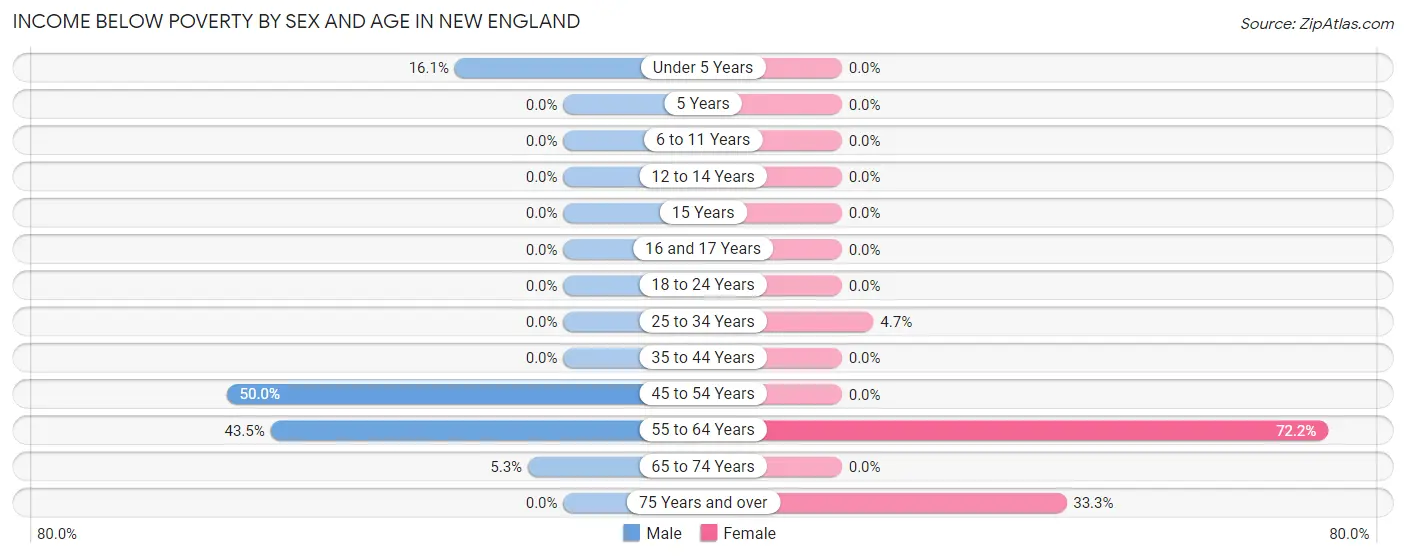
| Age Bracket | Male | Female |
| Under 5 Years | 5 (16.1%) | 0 (0.0%) |
| 5 Years | 0 (0.0%) | 0 (0.0%) |
| 6 to 11 Years | 0 (0.0%) | 0 (0.0%) |
| 12 to 14 Years | 0 (0.0%) | 0 (0.0%) |
| 15 Years | 0 (0.0%) | 0 (0.0%) |
| 16 and 17 Years | 0 (0.0%) | 0 (0.0%) |
| 18 to 24 Years | 0 (0.0%) | 0 (0.0%) |
| 25 to 34 Years | 0 (0.0%) | 3 (4.7%) |
| 35 to 44 Years | 0 (0.0%) | 0 (0.0%) |
| 45 to 54 Years | 19 (50.0%) | 0 (0.0%) |
| 55 to 64 Years | 10 (43.5%) | 26 (72.2%) |
| 65 to 74 Years | 2 (5.3%) | 0 (0.0%) |
| 75 Years and over | 0 (0.0%) | 7 (33.3%) |
| Total | 36 (10.6%) | 36 (10.3%) |
Income Above Poverty by Sex and Age in New England
According to the poverty statistics in New England, males aged 6 to 11 years and females aged under 5 years are the age groups that are most secure financially, with 100.0% of males and 100.0% of females in these age groups living above the poverty line.
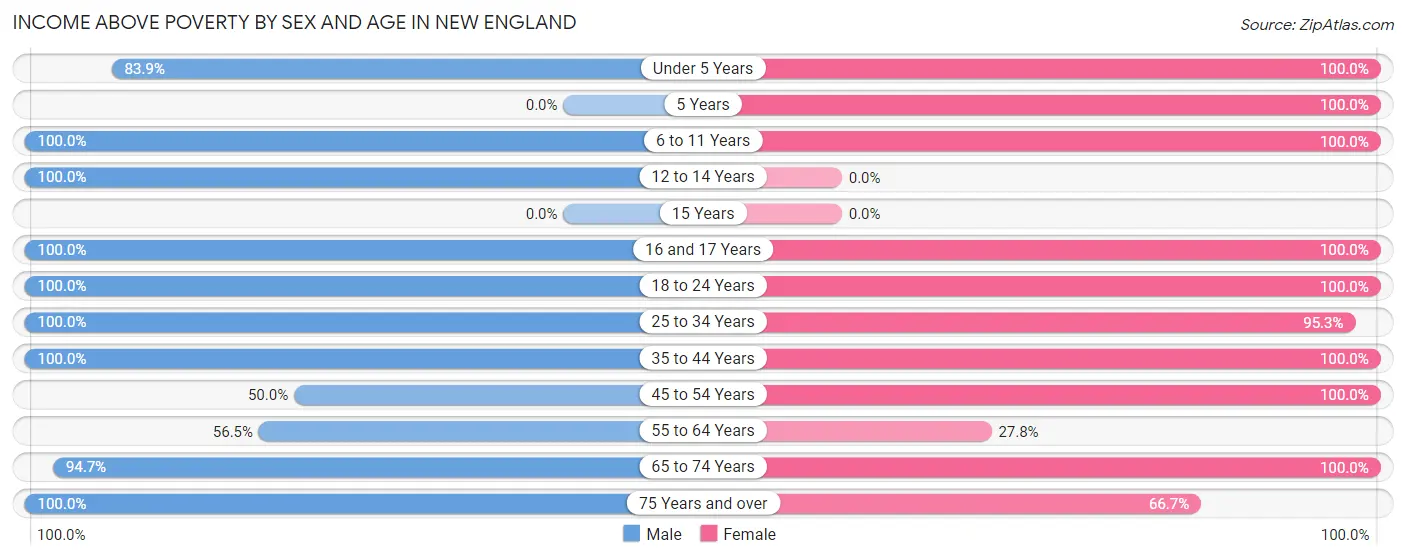
| Age Bracket | Male | Female |
| Under 5 Years | 26 (83.9%) | 36 (100.0%) |
| 5 Years | 0 (0.0%) | 3 (100.0%) |
| 6 to 11 Years | 26 (100.0%) | 39 (100.0%) |
| 12 to 14 Years | 7 (100.0%) | 0 (0.0%) |
| 15 Years | 0 (0.0%) | 0 (0.0%) |
| 16 and 17 Years | 11 (100.0%) | 6 (100.0%) |
| 18 to 24 Years | 43 (100.0%) | 61 (100.0%) |
| 25 to 34 Years | 70 (100.0%) | 61 (95.3%) |
| 35 to 44 Years | 37 (100.0%) | 26 (100.0%) |
| 45 to 54 Years | 19 (50.0%) | 27 (100.0%) |
| 55 to 64 Years | 13 (56.5%) | 10 (27.8%) |
| 65 to 74 Years | 36 (94.7%) | 31 (100.0%) |
| 75 Years and over | 15 (100.0%) | 14 (66.7%) |
| Total | 303 (89.4%) | 314 (89.7%) |
Income Below Poverty Among Married-Couple Families in New England
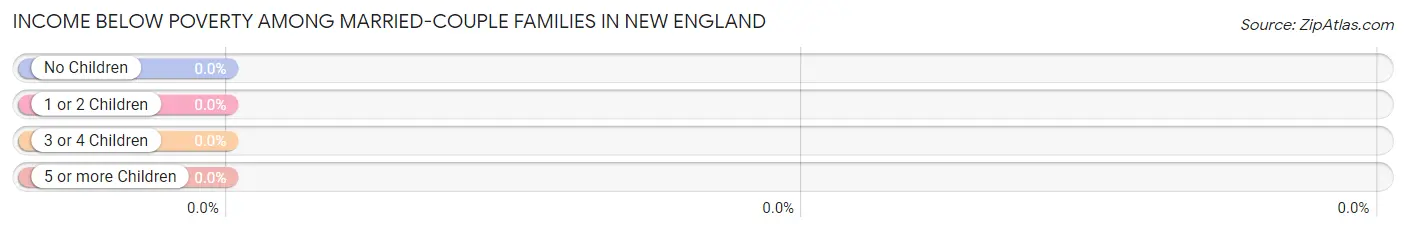
| Children | Above Poverty | Below Poverty |
| No Children | 72 (100.0%) | 0 (0.0%) |
| 1 or 2 Children | 22 (100.0%) | 0 (0.0%) |
| 3 or 4 Children | 24 (100.0%) | 0 (0.0%) |
| 5 or more Children | 0 (0.0%) | 0 (0.0%) |
| Total | 118 (100.0%) | 0 (0.0%) |
Income Below Poverty Among Single-Parent Households in New England
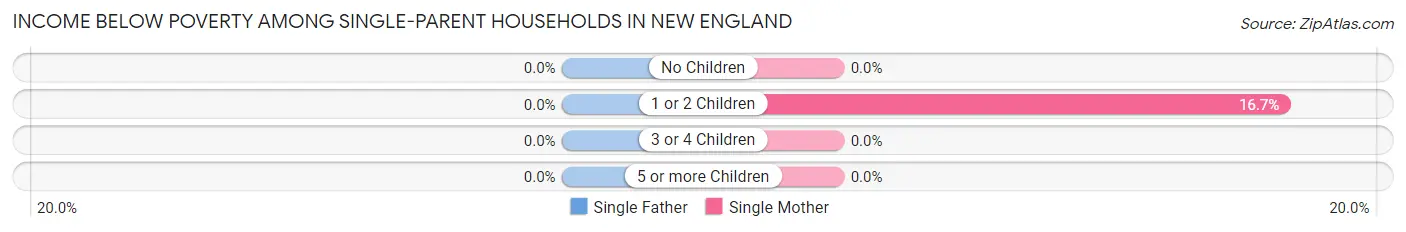
| Children | Single Father | Single Mother |
| No Children | 0 (0.0%) | 0 (0.0%) |
| 1 or 2 Children | 0 (0.0%) | 3 (16.7%) |
| 3 or 4 Children | 0 (0.0%) | 0 (0.0%) |
| 5 or more Children | 0 (0.0%) | 0 (0.0%) |
| Total | 0 (0.0%) | 3 (8.3%) |
Income Below Poverty Among Married-Couple vs Single-Parent Households in New England
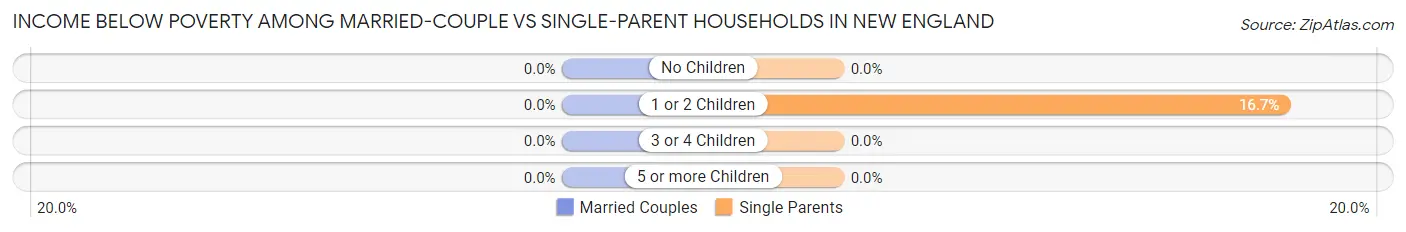
| Children | Married-Couple Families | Single-Parent Households |
| No Children | 0 (0.0%) | 0 (0.0%) |
| 1 or 2 Children | 0 (0.0%) | 3 (16.7%) |
| 3 or 4 Children | 0 (0.0%) | 0 (0.0%) |
| 5 or more Children | 0 (0.0%) | 0 (0.0%) |
| Total | 0 (0.0%) | 3 (8.1%) |
Race in New England
The most populous races in New England are White / Caucasian (693 | 85.6%), Native / Alaskan (57 | 7.0%), and Two or more Races (44 | 5.4%).
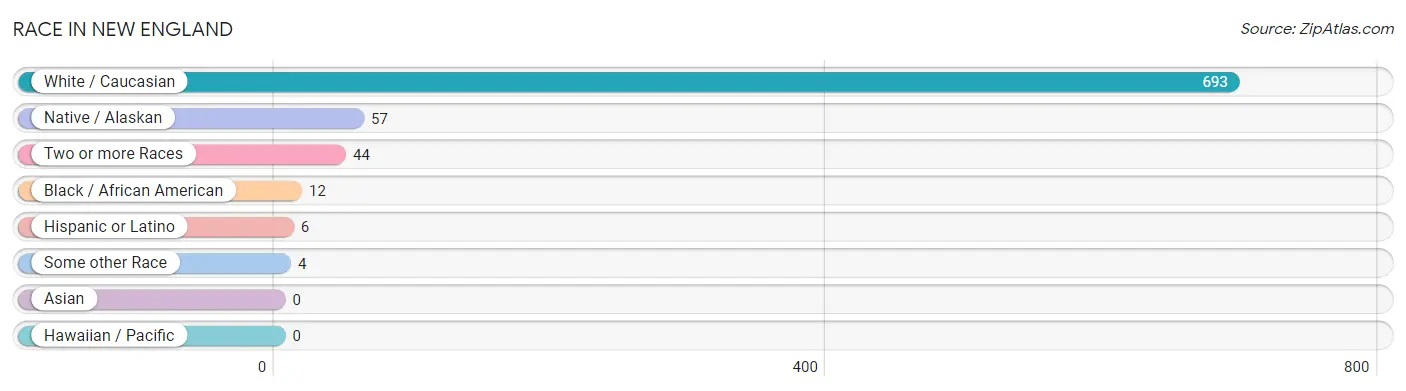
| Race | # Population | % Population |
| Asian | 0 | 0.0% |
| Black / African American | 12 | 1.5% |
| Hawaiian / Pacific | 0 | 0.0% |
| Hispanic or Latino | 6 | 0.7% |
| Native / Alaskan | 57 | 7.0% |
| White / Caucasian | 693 | 85.6% |
| Two or more Races | 44 | 5.4% |
| Some other Race | 4 | 0.5% |
| Total | 810 | 100.0% |
Ancestry in New England
The most populous ancestries reported in New England are German (260 | 32.1%), Irish (157 | 19.4%), Polish (72 | 8.9%), English (58 | 7.2%), and Choctaw (38 | 4.7%), together accounting for 72.2% of all New England residents.
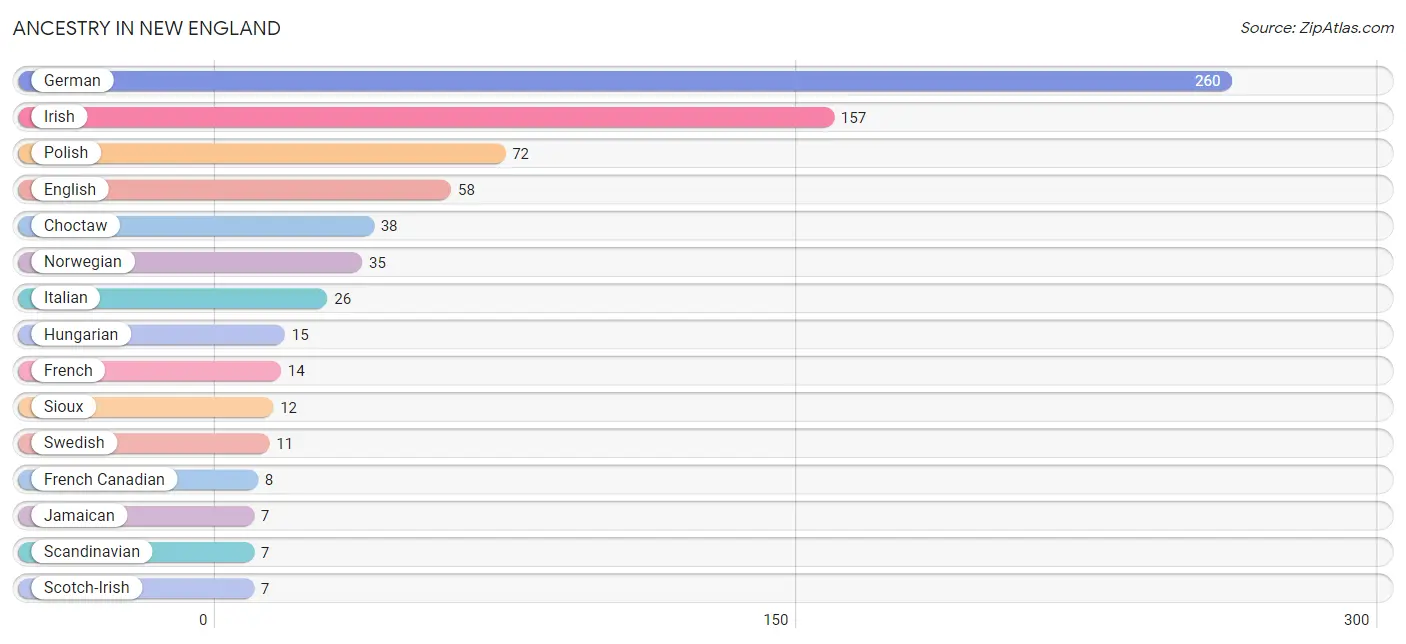
| Ancestry | # Population | % Population |
| Chippewa | 5 | 0.6% |
| Choctaw | 38 | 4.7% |
| Czech | 4 | 0.5% |
| English | 58 | 7.2% |
| Finnish | 3 | 0.4% |
| French | 14 | 1.7% |
| French Canadian | 8 | 1.0% |
| German | 260 | 32.1% |
| Hungarian | 15 | 1.8% |
| Irish | 157 | 19.4% |
| Italian | 26 | 3.2% |
| Jamaican | 7 | 0.9% |
| Mexican | 6 | 0.7% |
| Norwegian | 35 | 4.3% |
| Polish | 72 | 8.9% |
| Russian | 2 | 0.3% |
| Scandinavian | 7 | 0.9% |
| Scotch-Irish | 7 | 0.9% |
| Scottish | 6 | 0.7% |
| Sioux | 12 | 1.5% |
| Swedish | 11 | 1.4% |
| Welsh | 3 | 0.4% |
| Yugoslavian | 2 | 0.3% | View All 23 Rows |
Immigrants in New England
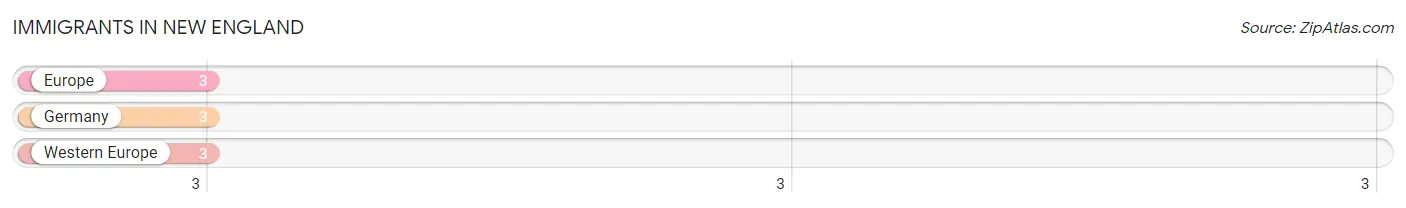
The most numerous immigrant groups reported in New England came from Europe (3 | 0.4%), Germany (3 | 0.4%), and Western Europe (3 | 0.4%), together accounting for 1.1% of all New England residents.
| Immigration Origin | # Population | % Population |
| Europe | 3 | 0.4% |
| Germany | 3 | 0.4% |
| Western Europe | 3 | 0.4% | View All 3 Rows |
Sex and Age in New England
Sex and Age in New England
The most populous age groups in New England are 20 to 24 Years (40 | 11.8%) for men and 20 to 24 Years (66 | 14.0%) for women.
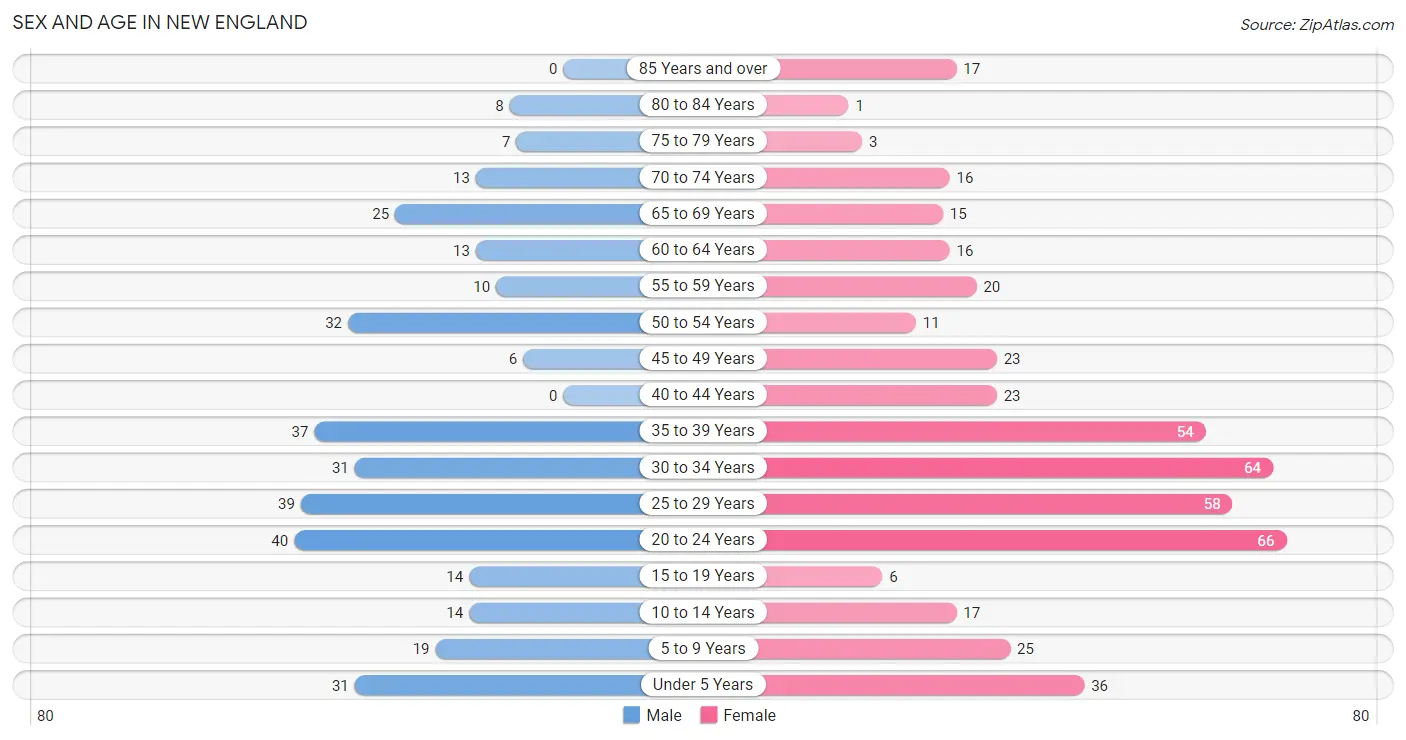
| Age Bracket | Male | Female |
| Under 5 Years | 31 (9.1%) | 36 (7.6%) |
| 5 to 9 Years | 19 (5.6%) | 25 (5.3%) |
| 10 to 14 Years | 14 (4.1%) | 17 (3.6%) |
| 15 to 19 Years | 14 (4.1%) | 6 (1.3%) |
| 20 to 24 Years | 40 (11.8%) | 66 (14.0%) |
| 25 to 29 Years | 39 (11.5%) | 58 (12.3%) |
| 30 to 34 Years | 31 (9.1%) | 64 (13.6%) |
| 35 to 39 Years | 37 (10.9%) | 54 (11.5%) |
| 40 to 44 Years | 0 (0.0%) | 23 (4.9%) |
| 45 to 49 Years | 6 (1.8%) | 23 (4.9%) |
| 50 to 54 Years | 32 (9.4%) | 11 (2.3%) |
| 55 to 59 Years | 10 (2.9%) | 20 (4.3%) |
| 60 to 64 Years | 13 (3.8%) | 16 (3.4%) |
| 65 to 69 Years | 25 (7.4%) | 15 (3.2%) |
| 70 to 74 Years | 13 (3.8%) | 16 (3.4%) |
| 75 to 79 Years | 7 (2.1%) | 3 (0.6%) |
| 80 to 84 Years | 8 (2.4%) | 1 (0.2%) |
| 85 Years and over | 0 (0.0%) | 17 (3.6%) |
| Total | 339 (100.0%) | 471 (100.0%) |
Families and Households in New England
Median Family Size in New England
The median family size in New England is 3.47 persons per family, with single male/father families (1 | 0.6%) accounting for the largest median family size of 35 persons per family. On the other hand, single female/mother families (36 | 23.2%) represent the smallest median family size with 2.08 persons per family.
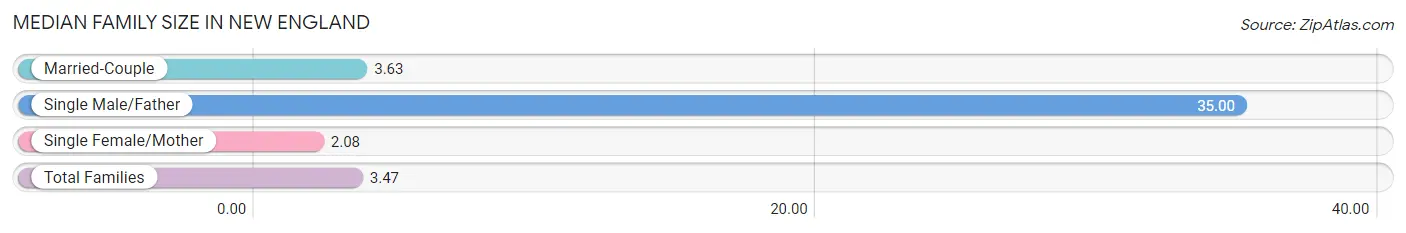
| Family Type | # Families | Family Size |
| Married-Couple | 118 (76.1%) | 3.63 |
| Single Male/Father | 1 (0.6%) | 35.00 |
| Single Female/Mother | 36 (23.2%) | 2.08 |
| Total Families | 155 (100.0%) | 3.47 |
Median Household Size in New England
The median household size in New England is 2.57 persons per household, with single male/father households (1 | 0.4%) accounting for the largest median household size of 42 persons per household. non-family households (113 | 42.2%) represent the smallest median household size with 1.16 persons per household.
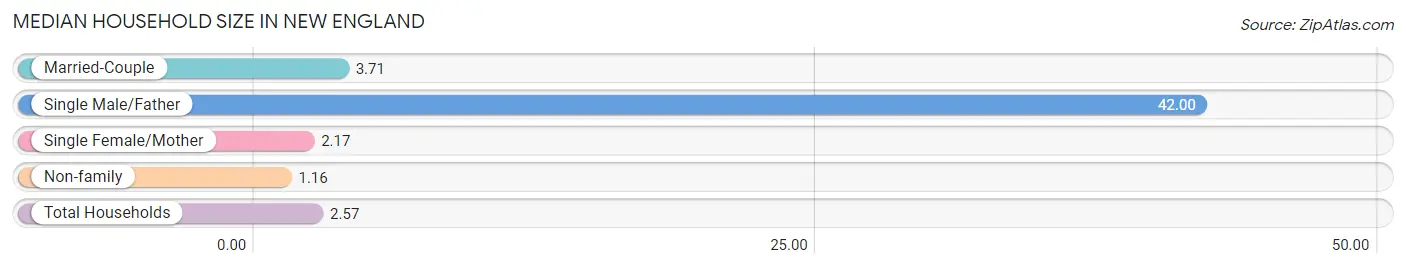
| Household Type | # Households | Household Size |
| Married-Couple | 118 (44.0%) | 3.71 |
| Single Male/Father | 1 (0.4%) | 42.00 |
| Single Female/Mother | 36 (13.4%) | 2.17 |
| Non-family | 113 (42.2%) | 1.16 |
| Total Households | 268 (100.0%) | 2.57 |
Household Size by Marriage Status in New England
Out of a total of 268 households in New England, 155 (57.8%) are family households, while 113 (42.2%) are nonfamily households. The most numerous type of family households are 2-person households, comprising 72, and the most common type of nonfamily households are 1-person households, comprising 97.
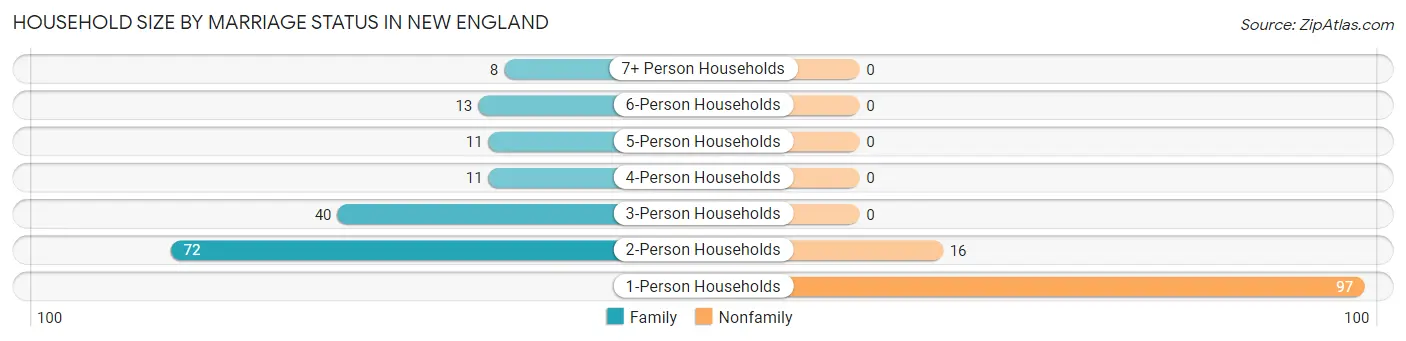
| Household Size | Family Households | Nonfamily Households |
| 1-Person Households | - | 97 (36.2%) |
| 2-Person Households | 72 (26.9%) | 16 (6.0%) |
| 3-Person Households | 40 (14.9%) | 0 (0.0%) |
| 4-Person Households | 11 (4.1%) | 0 (0.0%) |
| 5-Person Households | 11 (4.1%) | 0 (0.0%) |
| 6-Person Households | 13 (4.9%) | 0 (0.0%) |
| 7+ Person Households | 8 (3.0%) | 0 (0.0%) |
| Total | 155 (57.8%) | 113 (42.2%) |
Female Fertility in New England
Fertility by Age in New England
Average fertility rate in New England is 122.0 births per 1,000 women. Women in the age bracket of 20 to 34 years have the highest fertility rate with 191.0 births per 1,000 women. Women in the age bracket of 20 to 34 years acount for 100.0% of all women with births.
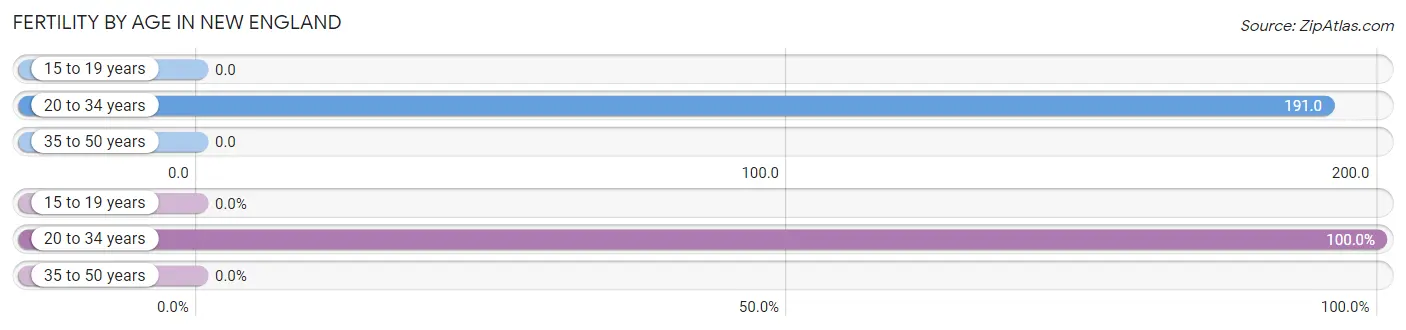
| Age Bracket | Women with Births | Births / 1,000 Women |
| 15 to 19 years | 0 (0.0%) | 0.0 |
| 20 to 34 years | 36 (100.0%) | 191.0 |
| 35 to 50 years | 0 (0.0%) | 0.0 |
| Total | 36 (100.0%) | 122.0 |
Fertility by Age by Marriage Status in New England
44.4% of women with births (36) in New England are married. The highest percentage of unmarried women with births falls into 20 to 34 years age bracket with 55.6% of them unmarried at the time of birth, while the lowest percentage of unmarried women with births belong to 20 to 34 years age bracket with 55.6% of them unmarried.
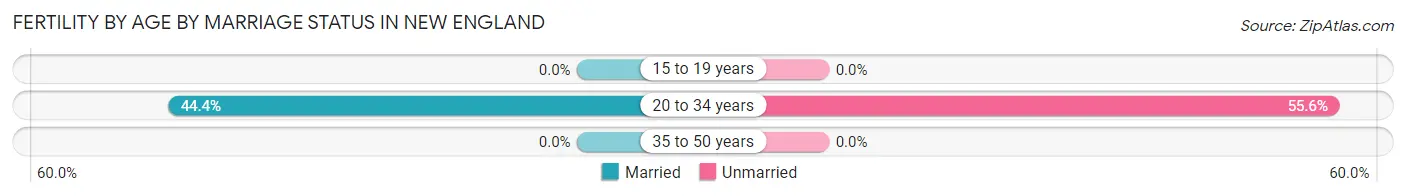
| Age Bracket | Married | Unmarried |
| 15 to 19 years | 0 (0.0%) | 0 (0.0%) |
| 20 to 34 years | 16 (44.4%) | 20 (55.6%) |
| 35 to 50 years | 0 (0.0%) | 0 (0.0%) |
| Total | 16 (44.4%) | 20 (55.6%) |
Fertility by Education in New England
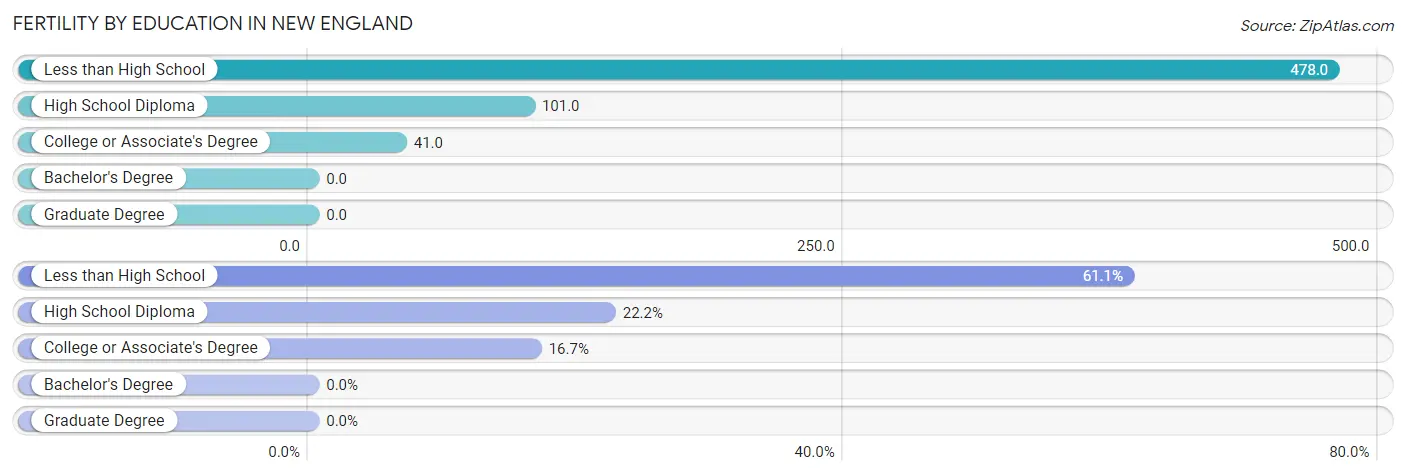
| Educational Attainment | Women with Births | Births / 1,000 Women |
| Less than High School | 22 (61.1%) | 478.0 |
| High School Diploma | 8 (22.2%) | 101.0 |
| College or Associate's Degree | 6 (16.7%) | 41.0 |
| Bachelor's Degree | 0 (0.0%) | 0.0 |
| Graduate Degree | 0 (0.0%) | 0.0 |
| Total | 36 (100.0%) | 122.0 |
Fertility by Education by Marriage Status in New England
55.6% of women with births in New England are unmarried. Women with the educational attainment of college or associate's degree are most likely to be married with 100.0% of them married at childbirth, while women with the educational attainment of high school diploma are least likely to be married with 100.0% of them unmarried at childbirth.
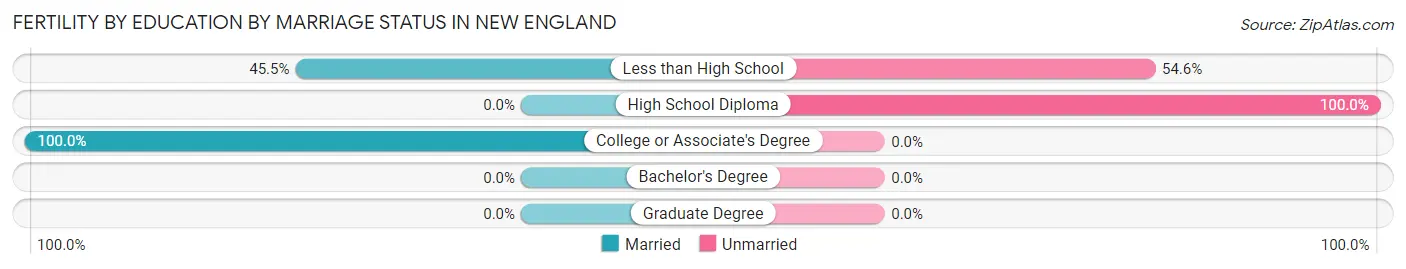
| Educational Attainment | Married | Unmarried |
| Less than High School | 10 (45.5%) | 12 (54.5%) |
| High School Diploma | 0 (0.0%) | 8 (100.0%) |
| College or Associate's Degree | 6 (100.0%) | 0 (0.0%) |
| Bachelor's Degree | 0 (0.0%) | 0 (0.0%) |
| Graduate Degree | 0 (0.0%) | 0 (0.0%) |
| Total | 16 (44.4%) | 20 (55.6%) |
Employment Characteristics in New England
Employment by Class of Employer in New England
Among the 360 employed individuals in New England, private company employees (212 | 58.9%), self-employed (not incorporated) (59 | 16.4%), and not-for-profit organizations (37 | 10.3%) make up the most common classes of employment.
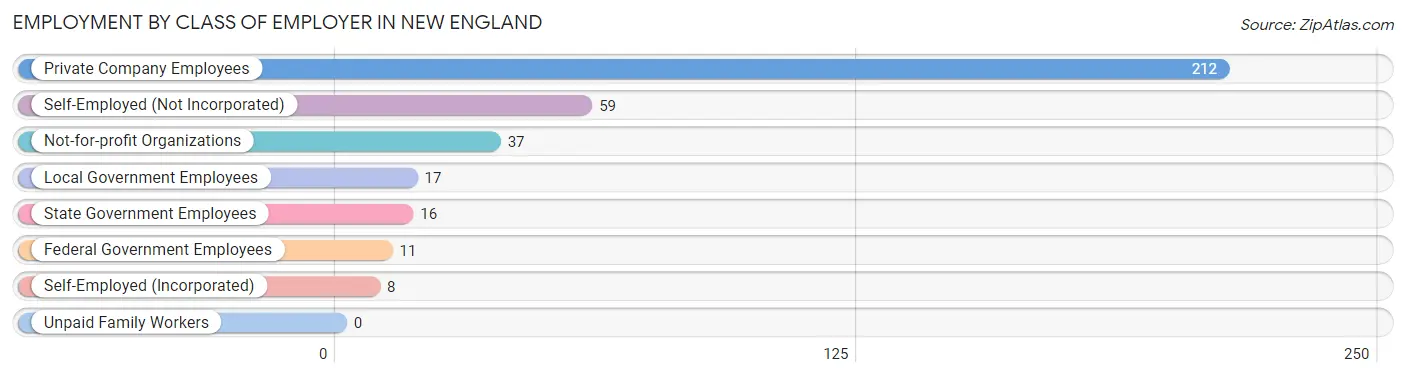
| Employer Class | # Employees | % Employees |
| Private Company Employees | 212 | 58.9% |
| Self-Employed (Incorporated) | 8 | 2.2% |
| Self-Employed (Not Incorporated) | 59 | 16.4% |
| Not-for-profit Organizations | 37 | 10.3% |
| Local Government Employees | 17 | 4.7% |
| State Government Employees | 16 | 4.4% |
| Federal Government Employees | 11 | 3.1% |
| Unpaid Family Workers | 0 | 0.0% |
| Total | 360 | 100.0% |
Employment Status by Age in New England
According to the labor force statistics for New England, out of the total population over 16 years of age (668), 60.5% or 404 individuals are in the labor force, with 6.9% or 28 of them unemployed. The age group with the highest labor force participation rate is 20 to 24 years, with 95.3% or 101 individuals in the labor force. Within the labor force, the 55 to 59 years age range has the highest percentage of unemployed individuals, with 38.1% or 8 of them being unemployed.
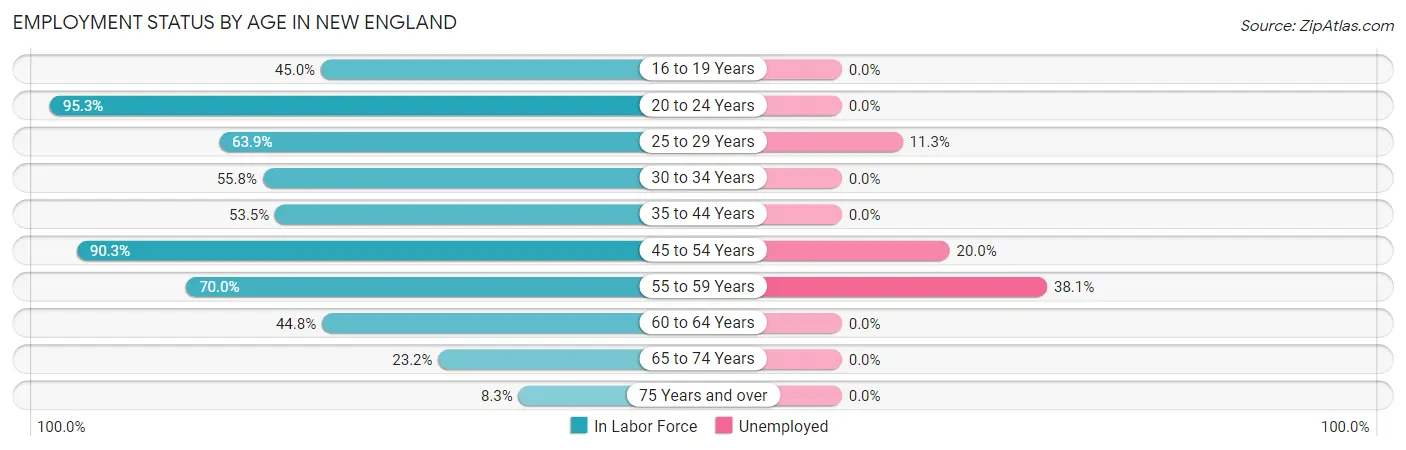
| Age Bracket | In Labor Force | Unemployed |
| 16 to 19 Years | 9 (45.0%) | 0 (0.0%) |
| 20 to 24 Years | 101 (95.3%) | 0 (0.0%) |
| 25 to 29 Years | 62 (63.9%) | 7 (11.3%) |
| 30 to 34 Years | 53 (55.8%) | 0 (0.0%) |
| 35 to 44 Years | 61 (53.5%) | 0 (0.0%) |
| 45 to 54 Years | 65 (90.3%) | 13 (20.0%) |
| 55 to 59 Years | 21 (70.0%) | 8 (38.1%) |
| 60 to 64 Years | 13 (44.8%) | 0 (0.0%) |
| 65 to 74 Years | 16 (23.2%) | 0 (0.0%) |
| 75 Years and over | 3 (8.3%) | 0 (0.0%) |
| Total | 404 (60.5%) | 28 (6.9%) |
Employment Status by Educational Attainment in New England
According to labor force statistics for New England, 62.9% of individuals (275) out of the total population between 25 and 64 years of age (437) are in the labor force, with 10.2% or 28 of them being unemployed. The group with the highest labor force participation rate are those with the educational attainment of bachelor's degree or higher, with 100.0% or 38 individuals in the labor force. Within the labor force, individuals with high school diploma education have the highest percentage of unemployment, with 13.3% or 15 of them being unemployed.
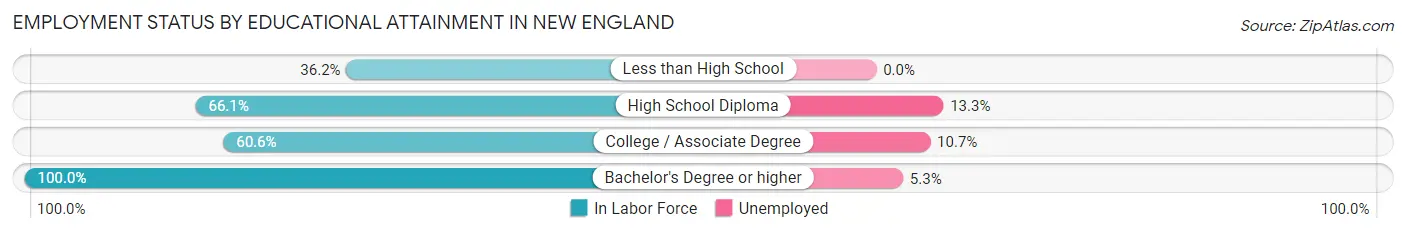
| Educational Attainment | In Labor Force | Unemployed |
| Less than High School | 21 (36.2%) | 0 (0.0%) |
| High School Diploma | 113 (66.1%) | 23 (13.3%) |
| College / Associate Degree | 103 (60.6%) | 18 (10.7%) |
| Bachelor's Degree or higher | 38 (100.0%) | 2 (5.3%) |
| Total | 275 (62.9%) | 45 (10.2%) |
Employment Occupations by Sex in New England
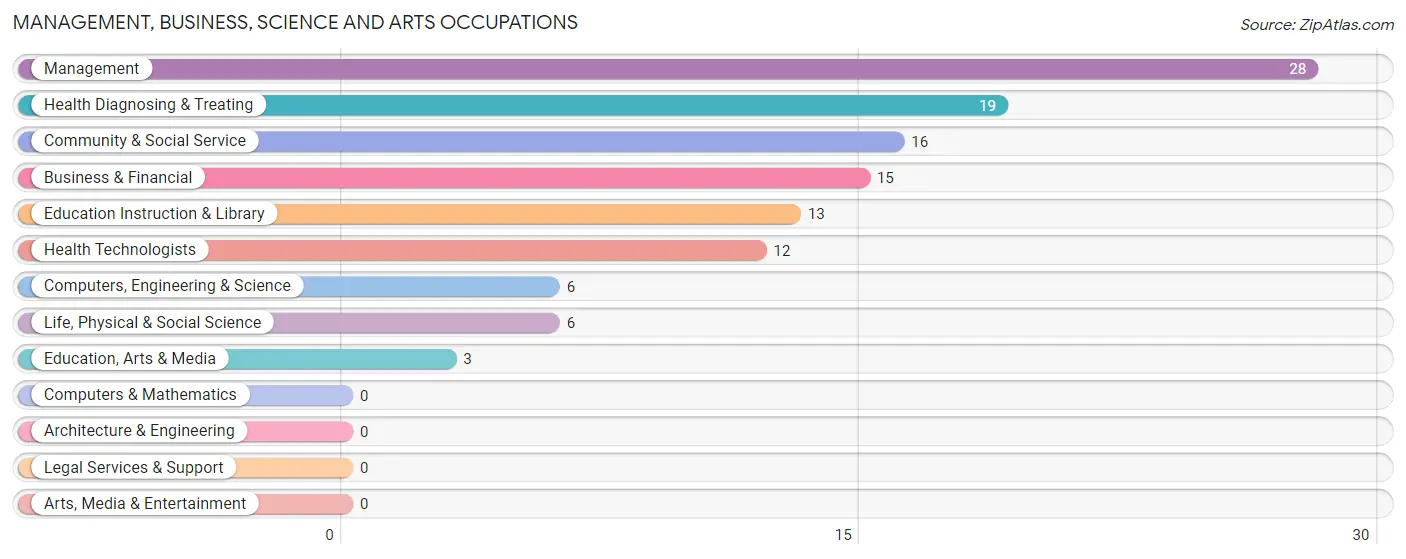
Management, Business, Science and Arts Occupations
The most common Management, Business, Science and Arts occupations in New England are Management (28 | 7.4%), Health Diagnosing & Treating (19 | 5.1%), Community & Social Service (16 | 4.3%), Business & Financial (15 | 4.0%), and Education Instruction & Library (13 | 3.5%).
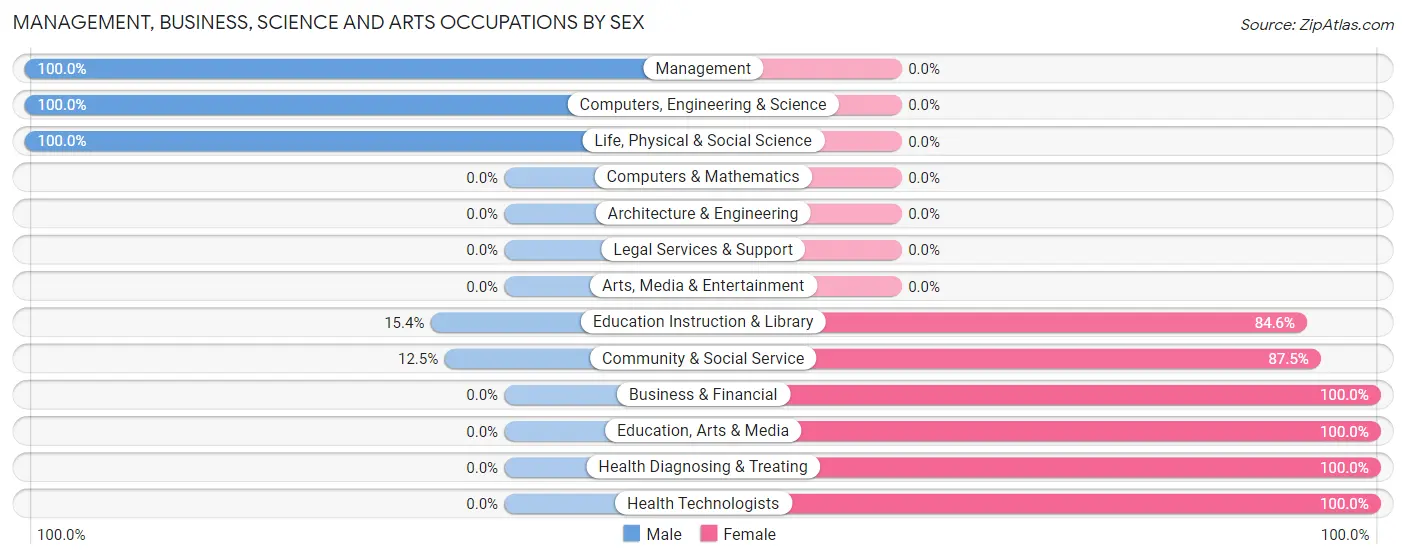
Management, Business, Science and Arts Occupations by Sex
Within the Management, Business, Science and Arts occupations in New England, the most male-oriented occupations are Management (100.0%), Computers, Engineering & Science (100.0%), and Life, Physical & Social Science (100.0%), while the most female-oriented occupations are Business & Financial (100.0%), Education, Arts & Media (100.0%), and Health Diagnosing & Treating (100.0%).
| Occupation | Male | Female |
| Management | 28 (100.0%) | 0 (0.0%) |
| Business & Financial | 0 (0.0%) | 15 (100.0%) |
| Computers, Engineering & Science | 6 (100.0%) | 0 (0.0%) |
| Computers & Mathematics | 0 (0.0%) | 0 (0.0%) |
| Architecture & Engineering | 0 (0.0%) | 0 (0.0%) |
| Life, Physical & Social Science | 6 (100.0%) | 0 (0.0%) |
| Community & Social Service | 2 (12.5%) | 14 (87.5%) |
| Education, Arts & Media | 0 (0.0%) | 3 (100.0%) |
| Legal Services & Support | 0 (0.0%) | 0 (0.0%) |
| Education Instruction & Library | 2 (15.4%) | 11 (84.6%) |
| Arts, Media & Entertainment | 0 (0.0%) | 0 (0.0%) |
| Health Diagnosing & Treating | 0 (0.0%) | 19 (100.0%) |
| Health Technologists | 0 (0.0%) | 12 (100.0%) |
| Total (Category) | 36 (42.9%) | 48 (57.1%) |
| Total (Overall) | 201 (53.5%) | 175 (46.5%) |
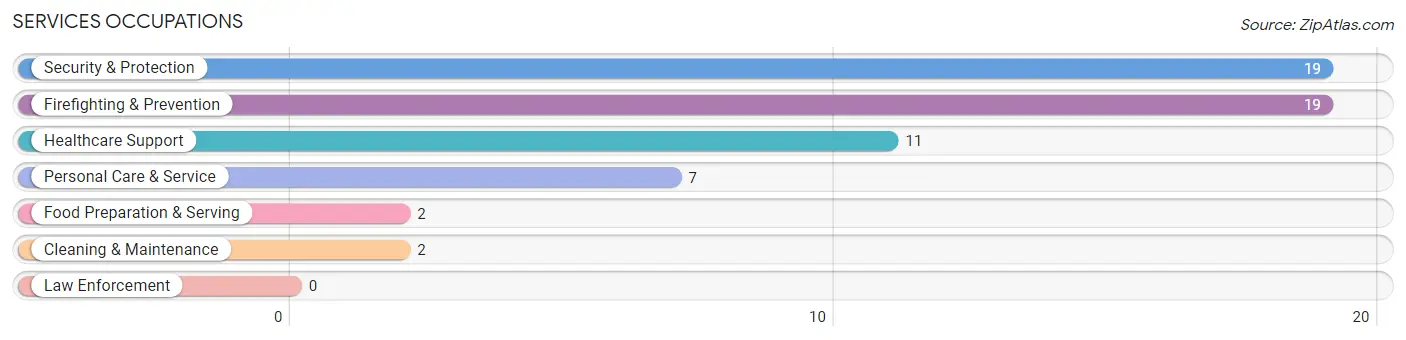
Services Occupations
The most common Services occupations in New England are Security & Protection (19 | 5.1%), Firefighting & Prevention (19 | 5.1%), Healthcare Support (11 | 2.9%), Personal Care & Service (7 | 1.9%), and Food Preparation & Serving (2 | 0.5%).
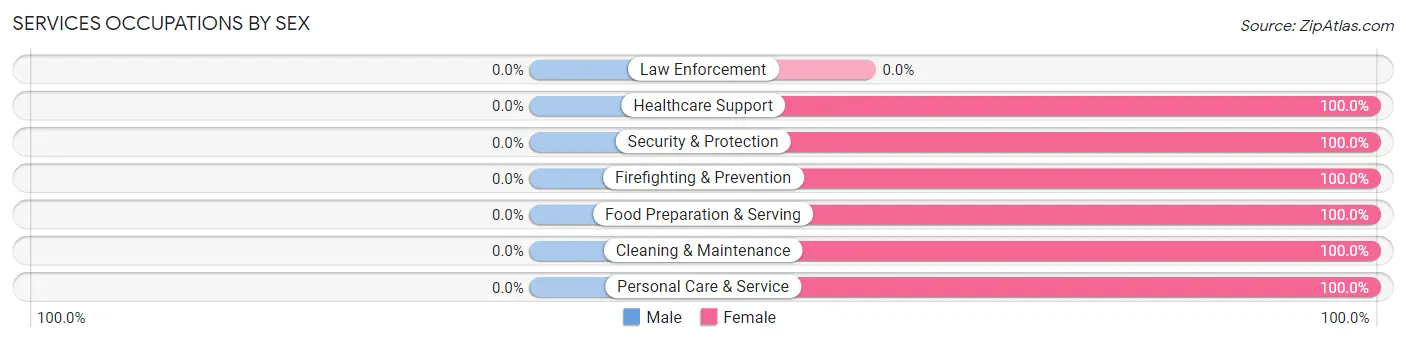
Services Occupations by Sex
| Occupation | Male | Female |
| Healthcare Support | 0 (0.0%) | 11 (100.0%) |
| Security & Protection | 0 (0.0%) | 19 (100.0%) |
| Firefighting & Prevention | 0 (0.0%) | 19 (100.0%) |
| Law Enforcement | 0 (0.0%) | 0 (0.0%) |
| Food Preparation & Serving | 0 (0.0%) | 2 (100.0%) |
| Cleaning & Maintenance | 0 (0.0%) | 2 (100.0%) |
| Personal Care & Service | 0 (0.0%) | 7 (100.0%) |
| Total (Category) | 0 (0.0%) | 41 (100.0%) |
| Total (Overall) | 201 (53.5%) | 175 (46.5%) |
Sales and Office Occupations
The most common Sales and Office occupations in New England are Office & Administration (44 | 11.7%), and Sales & Related (26 | 6.9%).

Sales and Office Occupations by Sex

| Occupation | Male | Female |
| Sales & Related | 24 (92.3%) | 2 (7.7%) |
| Office & Administration | 11 (25.0%) | 33 (75.0%) |
| Total (Category) | 35 (50.0%) | 35 (50.0%) |
| Total (Overall) | 201 (53.5%) | 175 (46.5%) |
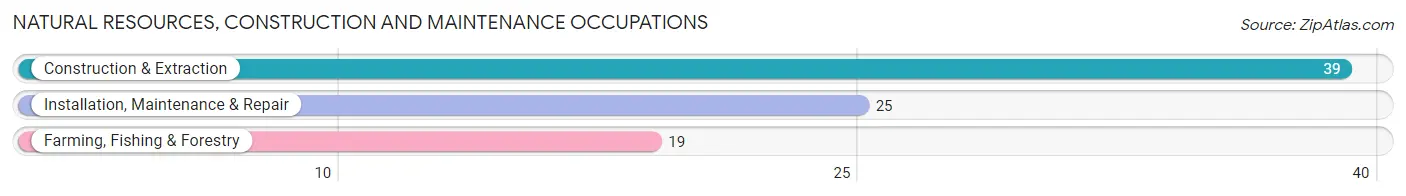
Natural Resources, Construction and Maintenance Occupations
The most common Natural Resources, Construction and Maintenance occupations in New England are Construction & Extraction (39 | 10.4%), Installation, Maintenance & Repair (25 | 6.7%), and Farming, Fishing & Forestry (19 | 5.1%).
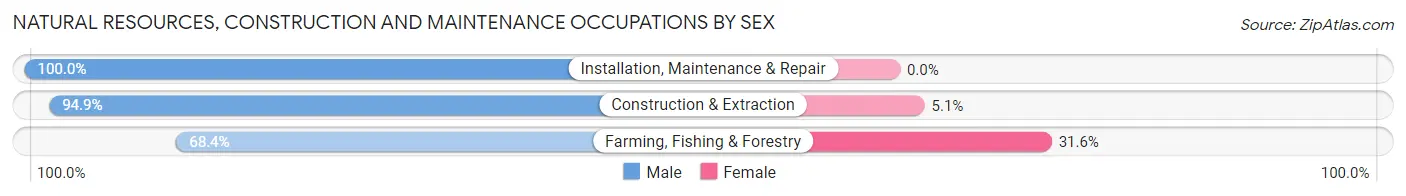
Natural Resources, Construction and Maintenance Occupations by Sex
| Occupation | Male | Female |
| Farming, Fishing & Forestry | 13 (68.4%) | 6 (31.6%) |
| Construction & Extraction | 37 (94.9%) | 2 (5.1%) |
| Installation, Maintenance & Repair | 25 (100.0%) | 0 (0.0%) |
| Total (Category) | 75 (90.4%) | 8 (9.6%) |
| Total (Overall) | 201 (53.5%) | 175 (46.5%) |
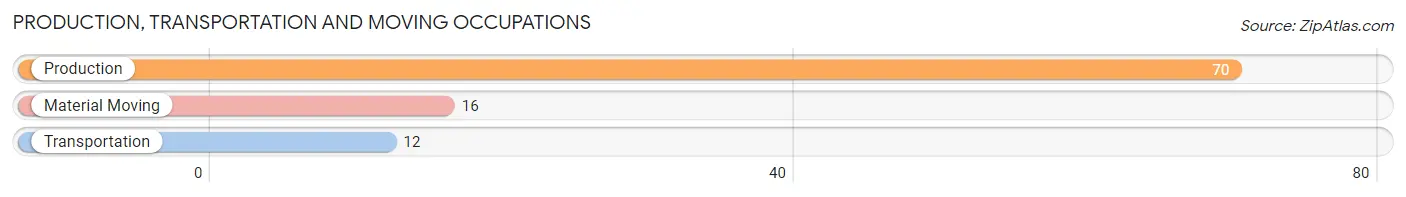
Production, Transportation and Moving Occupations
The most common Production, Transportation and Moving occupations in New England are Production (70 | 18.6%), Material Moving (16 | 4.3%), and Transportation (12 | 3.2%).
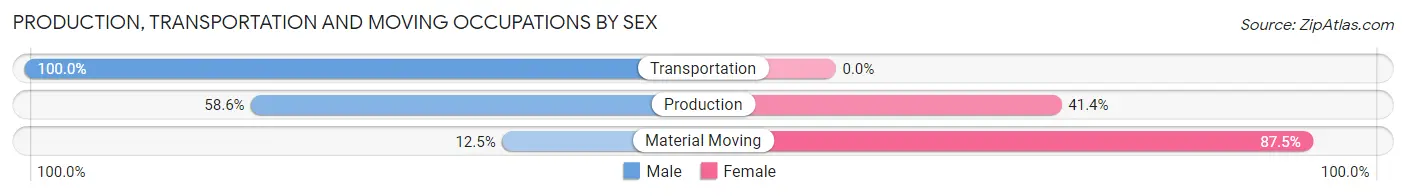
Production, Transportation and Moving Occupations by Sex
| Occupation | Male | Female |
| Production | 41 (58.6%) | 29 (41.4%) |
| Transportation | 12 (100.0%) | 0 (0.0%) |
| Material Moving | 2 (12.5%) | 14 (87.5%) |
| Total (Category) | 55 (56.1%) | 43 (43.9%) |
| Total (Overall) | 201 (53.5%) | 175 (46.5%) |
Employment Industries by Sex in New England
Employment Industries in New England
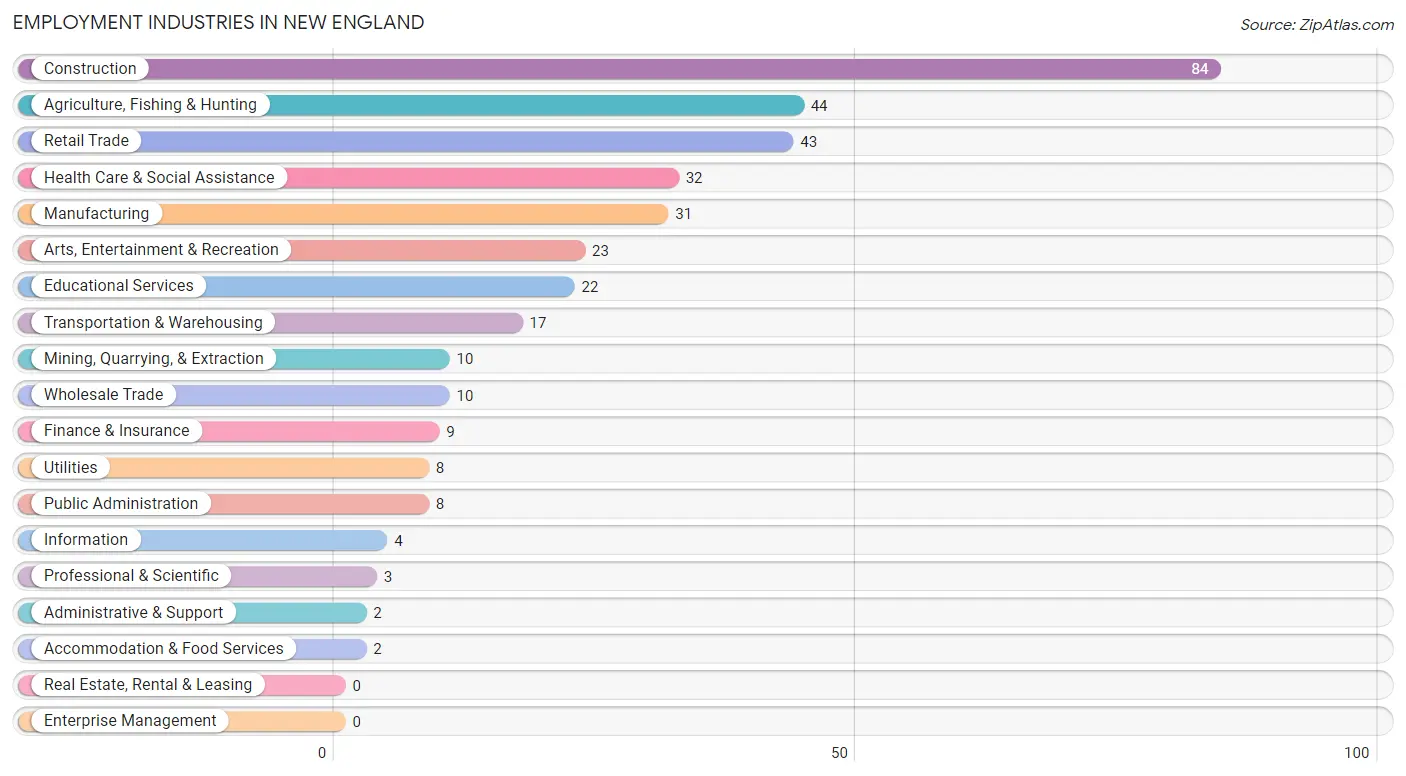
The major employment industries in New England include Construction (84 | 22.3%), Agriculture, Fishing & Hunting (44 | 11.7%), Retail Trade (43 | 11.4%), Health Care & Social Assistance (32 | 8.5%), and Manufacturing (31 | 8.2%).
Employment Industries by Sex in New England
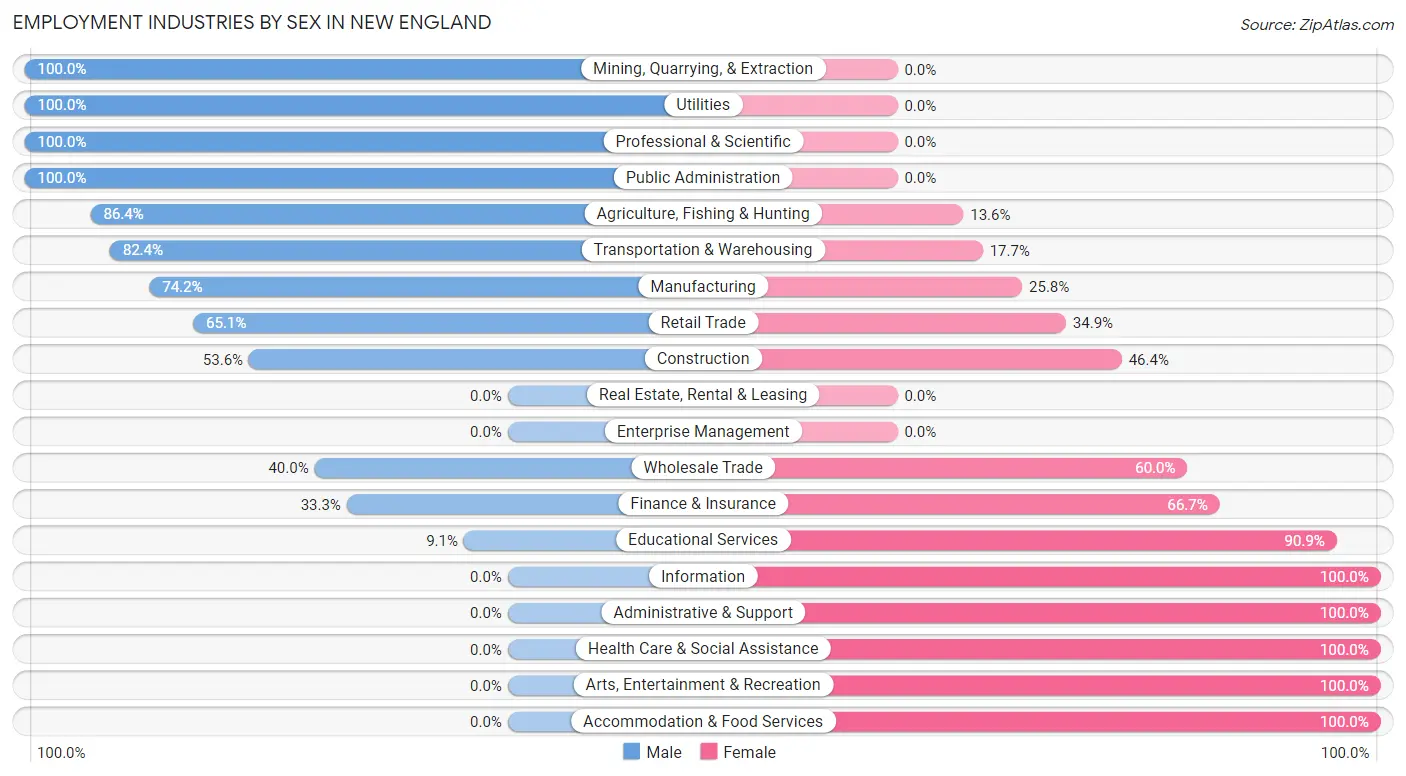
The New England industries that see more men than women are Mining, Quarrying, & Extraction (100.0%), Utilities (100.0%), and Professional & Scientific (100.0%), whereas the industries that tend to have a higher number of women are Information (100.0%), Administrative & Support (100.0%), and Health Care & Social Assistance (100.0%).
| Industry | Male | Female |
| Agriculture, Fishing & Hunting | 38 (86.4%) | 6 (13.6%) |
| Mining, Quarrying, & Extraction | 10 (100.0%) | 0 (0.0%) |
| Construction | 45 (53.6%) | 39 (46.4%) |
| Manufacturing | 23 (74.2%) | 8 (25.8%) |
| Wholesale Trade | 4 (40.0%) | 6 (60.0%) |
| Retail Trade | 28 (65.1%) | 15 (34.9%) |
| Transportation & Warehousing | 14 (82.4%) | 3 (17.6%) |
| Utilities | 8 (100.0%) | 0 (0.0%) |
| Information | 0 (0.0%) | 4 (100.0%) |
| Finance & Insurance | 3 (33.3%) | 6 (66.7%) |
| Real Estate, Rental & Leasing | 0 (0.0%) | 0 (0.0%) |
| Professional & Scientific | 3 (100.0%) | 0 (0.0%) |
| Enterprise Management | 0 (0.0%) | 0 (0.0%) |
| Administrative & Support | 0 (0.0%) | 2 (100.0%) |
| Educational Services | 2 (9.1%) | 20 (90.9%) |
| Health Care & Social Assistance | 0 (0.0%) | 32 (100.0%) |
| Arts, Entertainment & Recreation | 0 (0.0%) | 23 (100.0%) |
| Accommodation & Food Services | 0 (0.0%) | 2 (100.0%) |
| Public Administration | 8 (100.0%) | 0 (0.0%) |
| Total | 201 (53.5%) | 175 (46.5%) |
Education in New England
School Enrollment in New England
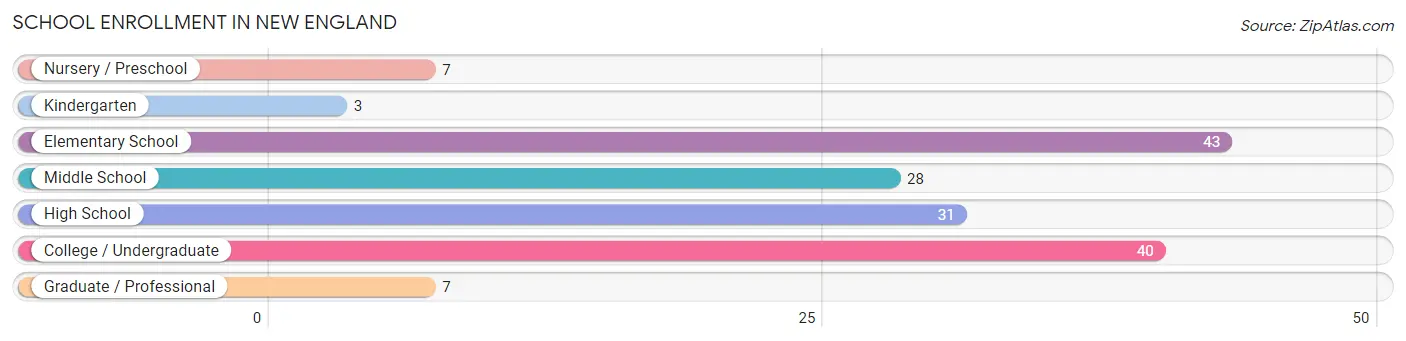
The most common levels of schooling among the 159 students in New England are elementary school (43 | 27.0%), college / undergraduate (40 | 25.2%), and high school (31 | 19.5%).
| School Level | # Students | % Students |
| Nursery / Preschool | 7 | 4.4% |
| Kindergarten | 3 | 1.9% |
| Elementary School | 43 | 27.0% |
| Middle School | 28 | 17.6% |
| High School | 31 | 19.5% |
| College / Undergraduate | 40 | 25.2% |
| Graduate / Professional | 7 | 4.4% |
| Total | 159 | 100.0% |
School Enrollment by Age by Funding Source in New England
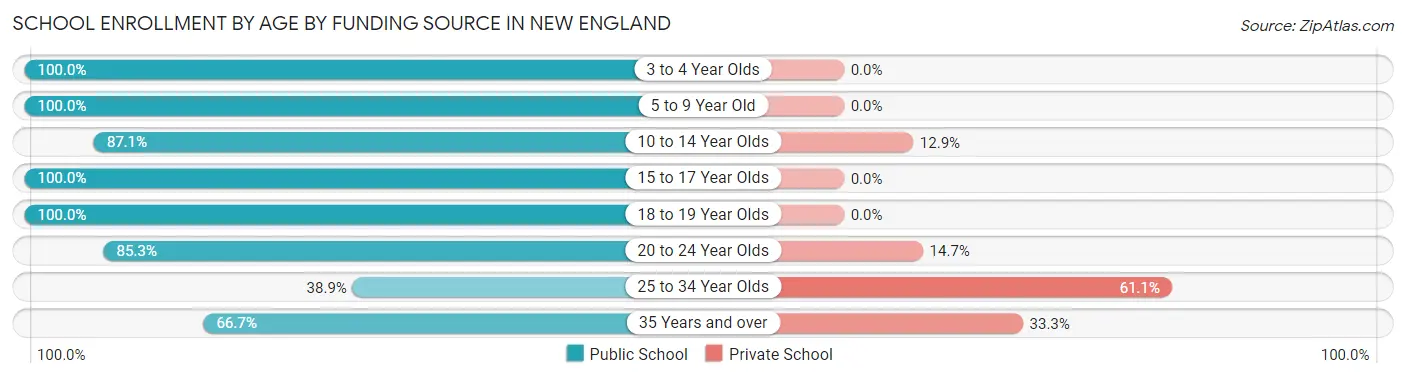
Out of a total of 159 students who are enrolled in schools in New England, 25 (15.7%) attend a private institution, while the remaining 134 (84.3%) are enrolled in public schools. The age group of 25 to 34 year olds has the highest likelihood of being enrolled in private schools, with 11 (61.1% in the age bracket) enrolled. Conversely, the age group of 3 to 4 year olds has the lowest likelihood of being enrolled in a private school, with 4 (100.0% in the age bracket) attending a public institution.
| Age Bracket | Public School | Private School |
| 3 to 4 Year Olds | 4 (100.0%) | 0 (0.0%) |
| 5 to 9 Year Old | 39 (100.0%) | 0 (0.0%) |
| 10 to 14 Year Olds | 27 (87.1%) | 4 (12.9%) |
| 15 to 17 Year Olds | 17 (100.0%) | 0 (0.0%) |
| 18 to 19 Year Olds | 1 (100.0%) | 0 (0.0%) |
| 20 to 24 Year Olds | 29 (85.3%) | 5 (14.7%) |
| 25 to 34 Year Olds | 7 (38.9%) | 11 (61.1%) |
| 35 Years and over | 10 (66.7%) | 5 (33.3%) |
| Total | 134 (84.3%) | 25 (15.7%) |
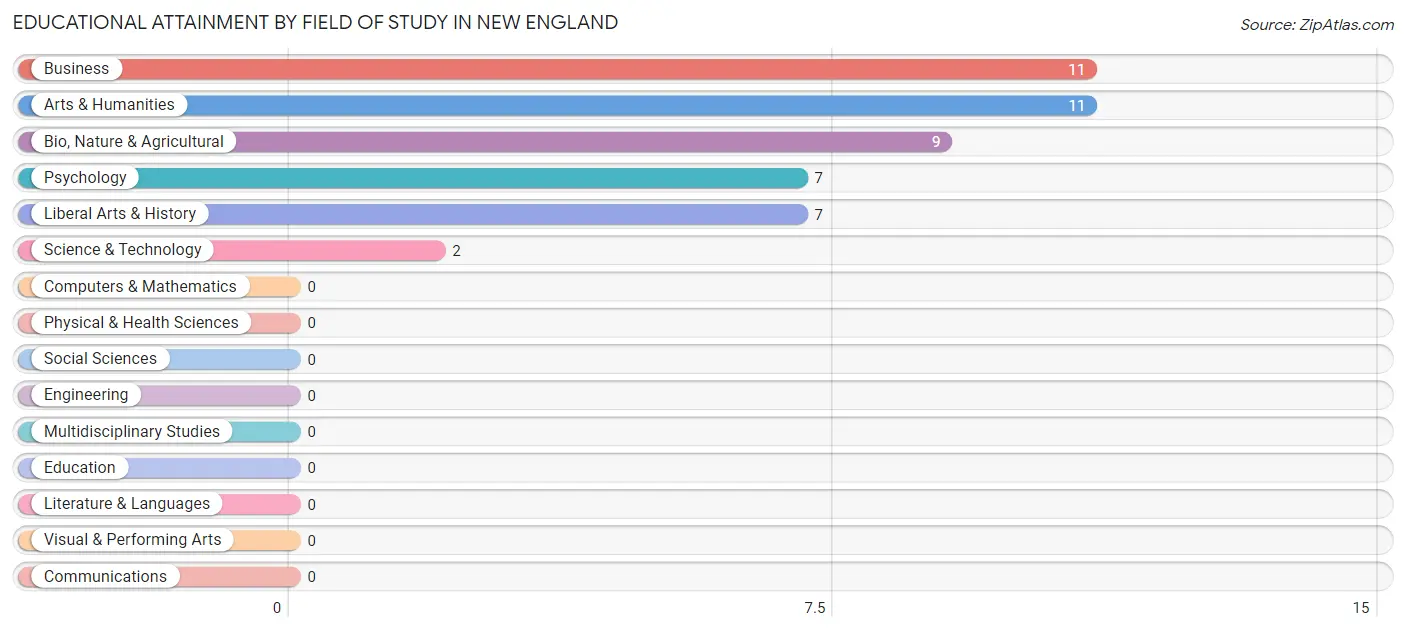
Educational Attainment by Field of Study in New England
Business (11 | 23.4%), arts & humanities (11 | 23.4%), bio, nature & agricultural (9 | 19.2%), psychology (7 | 14.9%), and liberal arts & history (7 | 14.9%) are the most common fields of study among 47 individuals in New England who have obtained a bachelor's degree or higher.
| Field of Study | # Graduates | % Graduates |
| Computers & Mathematics | 0 | 0.0% |
| Bio, Nature & Agricultural | 9 | 19.2% |
| Physical & Health Sciences | 0 | 0.0% |
| Psychology | 7 | 14.9% |
| Social Sciences | 0 | 0.0% |
| Engineering | 0 | 0.0% |
| Multidisciplinary Studies | 0 | 0.0% |
| Science & Technology | 2 | 4.3% |
| Business | 11 | 23.4% |
| Education | 0 | 0.0% |
| Literature & Languages | 0 | 0.0% |
| Liberal Arts & History | 7 | 14.9% |
| Visual & Performing Arts | 0 | 0.0% |
| Communications | 0 | 0.0% |
| Arts & Humanities | 11 | 23.4% |
| Total | 47 | 100.0% |
Transportation & Commute in New England
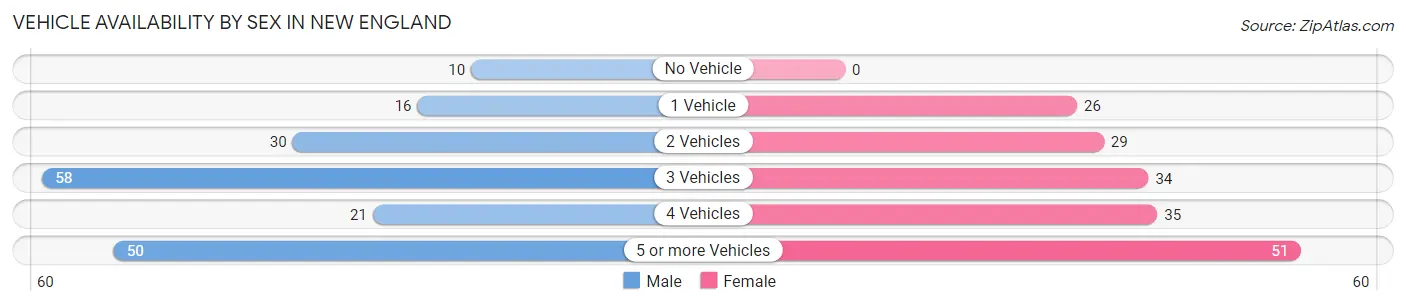
Vehicle Availability by Sex in New England
The most prevalent vehicle ownership categories in New England are males with 3 vehicles (58, accounting for 31.4%) and females with 3 vehicles (34, making up 33.1%).
| Vehicles Available | Male | Female |
| No Vehicle | 10 (5.4%) | 0 (0.0%) |
| 1 Vehicle | 16 (8.6%) | 26 (14.9%) |
| 2 Vehicles | 30 (16.2%) | 29 (16.6%) |
| 3 Vehicles | 58 (31.4%) | 34 (19.4%) |
| 4 Vehicles | 21 (11.4%) | 35 (20.0%) |
| 5 or more Vehicles | 50 (27.0%) | 51 (29.1%) |
| Total | 185 (100.0%) | 175 (100.0%) |
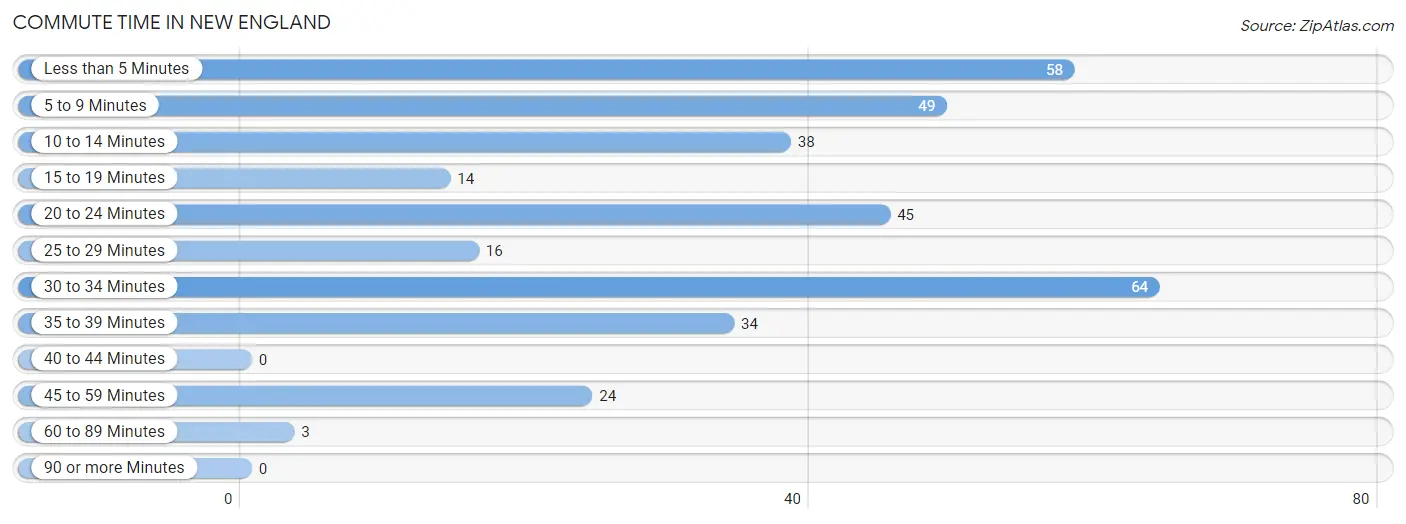
Commute Time in New England
The most frequently occuring commute durations in New England are 30 to 34 minutes (64 commuters, 18.5%), less than 5 minutes (58 commuters, 16.8%), and 5 to 9 minutes (49 commuters, 14.2%).
| Commute Time | # Commuters | % Commuters |
| Less than 5 Minutes | 58 | 16.8% |
| 5 to 9 Minutes | 49 | 14.2% |
| 10 to 14 Minutes | 38 | 11.0% |
| 15 to 19 Minutes | 14 | 4.1% |
| 20 to 24 Minutes | 45 | 13.0% |
| 25 to 29 Minutes | 16 | 4.6% |
| 30 to 34 Minutes | 64 | 18.5% |
| 35 to 39 Minutes | 34 | 9.9% |
| 40 to 44 Minutes | 0 | 0.0% |
| 45 to 59 Minutes | 24 | 7.0% |
| 60 to 89 Minutes | 3 | 0.9% |
| 90 or more Minutes | 0 | 0.0% |
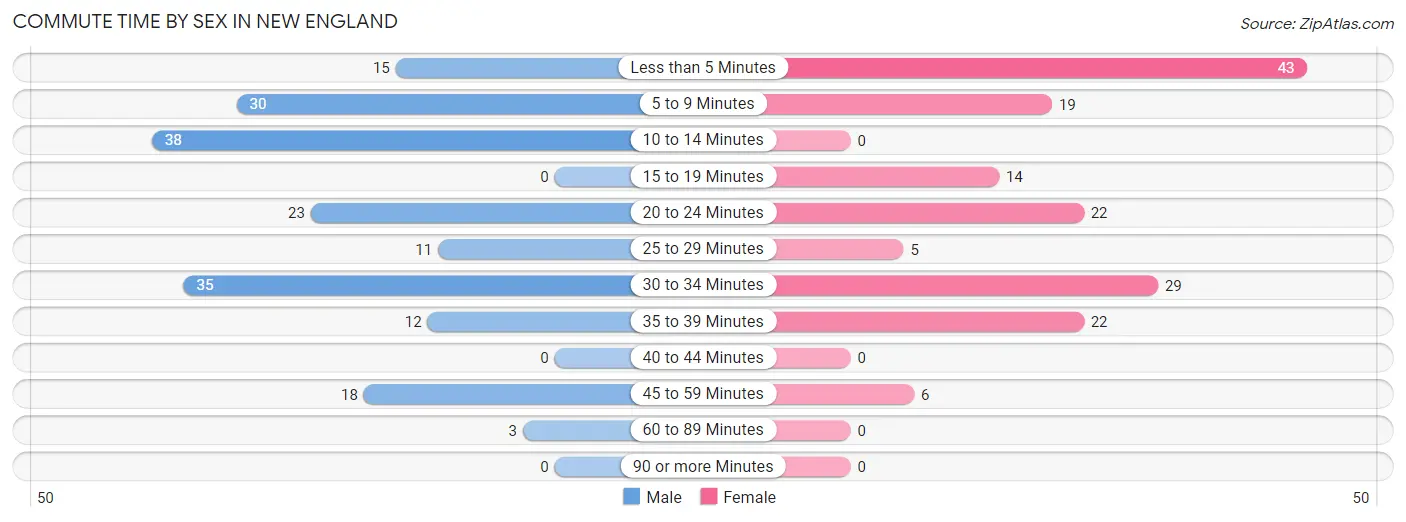
Commute Time by Sex in New England
The most common commute times in New England are 10 to 14 minutes (38 commuters, 20.5%) for males and less than 5 minutes (43 commuters, 26.9%) for females.
| Commute Time | Male | Female |
| Less than 5 Minutes | 15 (8.1%) | 43 (26.9%) |
| 5 to 9 Minutes | 30 (16.2%) | 19 (11.9%) |
| 10 to 14 Minutes | 38 (20.5%) | 0 (0.0%) |
| 15 to 19 Minutes | 0 (0.0%) | 14 (8.7%) |
| 20 to 24 Minutes | 23 (12.4%) | 22 (13.8%) |
| 25 to 29 Minutes | 11 (5.9%) | 5 (3.1%) |
| 30 to 34 Minutes | 35 (18.9%) | 29 (18.1%) |
| 35 to 39 Minutes | 12 (6.5%) | 22 (13.8%) |
| 40 to 44 Minutes | 0 (0.0%) | 0 (0.0%) |
| 45 to 59 Minutes | 18 (9.7%) | 6 (3.7%) |
| 60 to 89 Minutes | 3 (1.6%) | 0 (0.0%) |
| 90 or more Minutes | 0 (0.0%) | 0 (0.0%) |
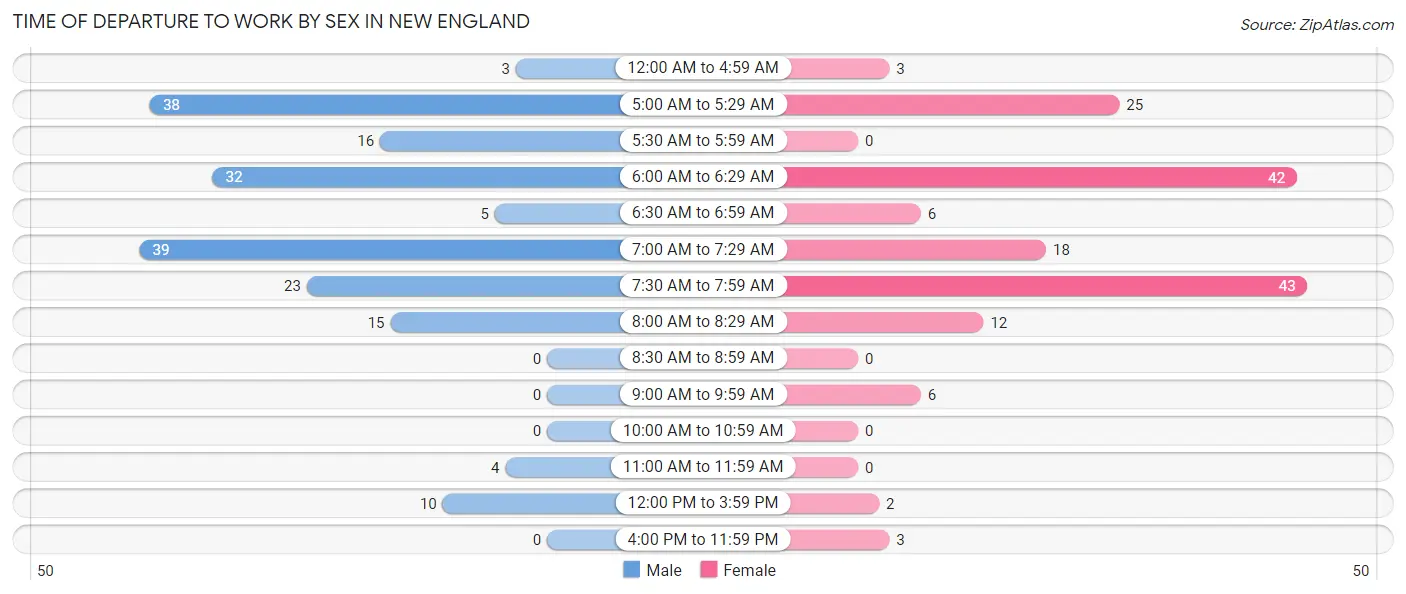
Time of Departure to Work by Sex in New England
The most frequent times of departure to work in New England are 7:00 AM to 7:29 AM (39, 21.1%) for males and 7:30 AM to 7:59 AM (43, 26.9%) for females.
| Time of Departure | Male | Female |
| 12:00 AM to 4:59 AM | 3 (1.6%) | 3 (1.9%) |
| 5:00 AM to 5:29 AM | 38 (20.5%) | 25 (15.6%) |
| 5:30 AM to 5:59 AM | 16 (8.6%) | 0 (0.0%) |
| 6:00 AM to 6:29 AM | 32 (17.3%) | 42 (26.3%) |
| 6:30 AM to 6:59 AM | 5 (2.7%) | 6 (3.7%) |
| 7:00 AM to 7:29 AM | 39 (21.1%) | 18 (11.3%) |
| 7:30 AM to 7:59 AM | 23 (12.4%) | 43 (26.9%) |
| 8:00 AM to 8:29 AM | 15 (8.1%) | 12 (7.5%) |
| 8:30 AM to 8:59 AM | 0 (0.0%) | 0 (0.0%) |
| 9:00 AM to 9:59 AM | 0 (0.0%) | 6 (3.7%) |
| 10:00 AM to 10:59 AM | 0 (0.0%) | 0 (0.0%) |
| 11:00 AM to 11:59 AM | 4 (2.2%) | 0 (0.0%) |
| 12:00 PM to 3:59 PM | 10 (5.4%) | 2 (1.3%) |
| 4:00 PM to 11:59 PM | 0 (0.0%) | 3 (1.9%) |
| Total | 185 (100.0%) | 160 (100.0%) |
Housing Occupancy in New England
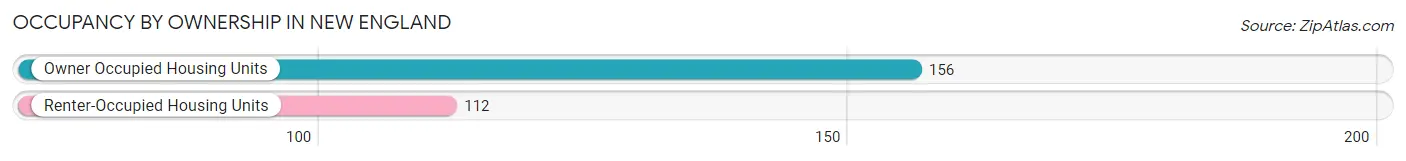
Occupancy by Ownership in New England
Of the total 268 dwellings in New England, owner-occupied units account for 156 (58.2%), while renter-occupied units make up 112 (41.8%).
| Occupancy | # Housing Units | % Housing Units |
| Owner Occupied Housing Units | 156 | 58.2% |
| Renter-Occupied Housing Units | 112 | 41.8% |
| Total Occupied Housing Units | 268 | 100.0% |
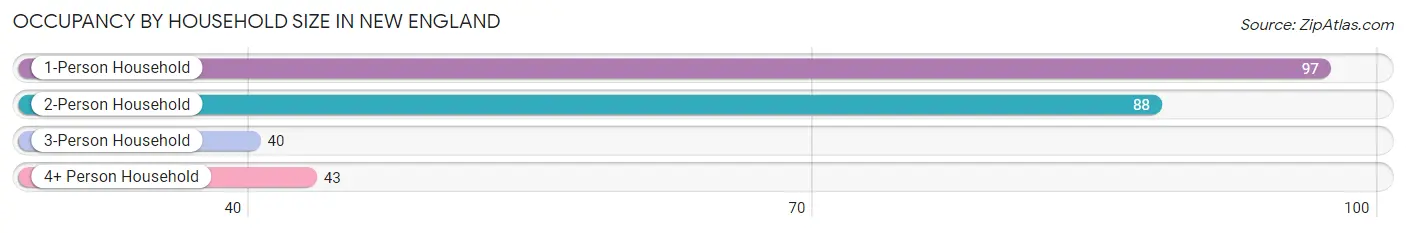
Occupancy by Household Size in New England
| Household Size | # Housing Units | % Housing Units |
| 1-Person Household | 97 | 36.2% |
| 2-Person Household | 88 | 32.8% |
| 3-Person Household | 40 | 14.9% |
| 4+ Person Household | 43 | 16.0% |
| Total Housing Units | 268 | 100.0% |
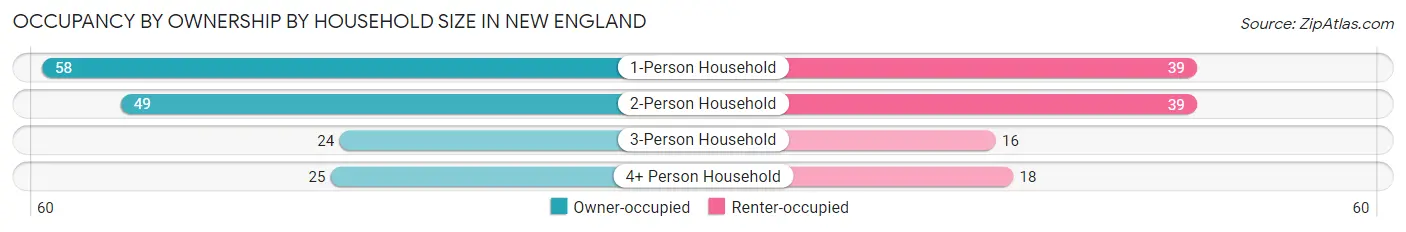
Occupancy by Ownership by Household Size in New England
| Household Size | Owner-occupied | Renter-occupied |
| 1-Person Household | 58 (59.8%) | 39 (40.2%) |
| 2-Person Household | 49 (55.7%) | 39 (44.3%) |
| 3-Person Household | 24 (60.0%) | 16 (40.0%) |
| 4+ Person Household | 25 (58.1%) | 18 (41.9%) |
| Total Housing Units | 156 (58.2%) | 112 (41.8%) |
Occupancy by Educational Attainment in New England
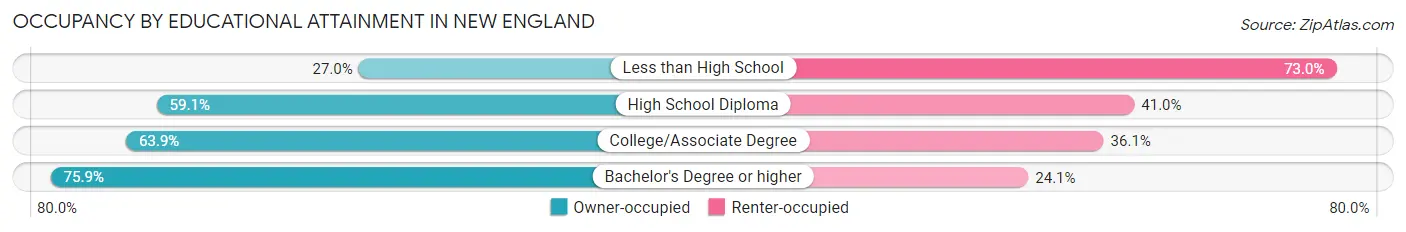
| Household Size | Owner-occupied | Renter-occupied |
| Less than High School | 10 (27.0%) | 27 (73.0%) |
| High School Diploma | 62 (59.1%) | 43 (40.9%) |
| College/Associate Degree | 62 (63.9%) | 35 (36.1%) |
| Bachelor's Degree or higher | 22 (75.9%) | 7 (24.1%) |
Occupancy by Age of Householder in New England
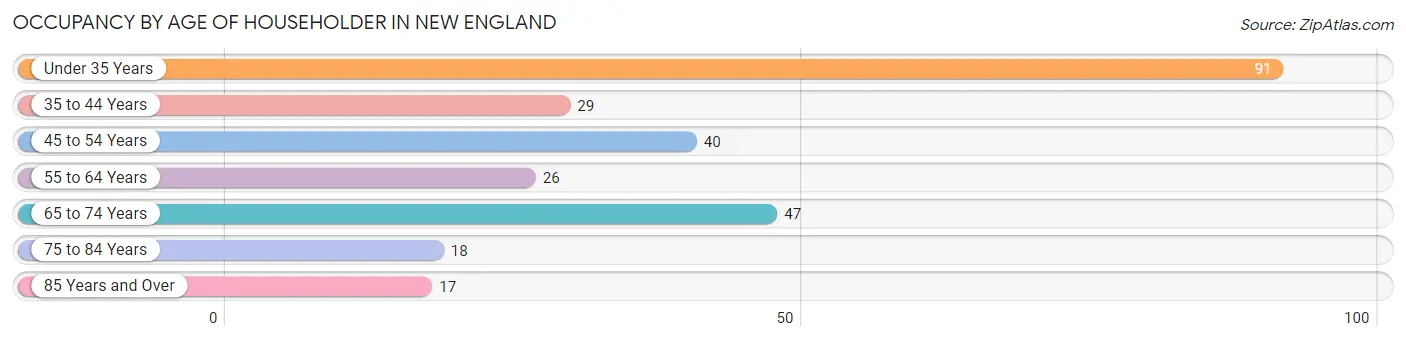
| Age Bracket | # Households | % Households |
| Under 35 Years | 91 | 34.0% |
| 35 to 44 Years | 29 | 10.8% |
| 45 to 54 Years | 40 | 14.9% |
| 55 to 64 Years | 26 | 9.7% |
| 65 to 74 Years | 47 | 17.5% |
| 75 to 84 Years | 18 | 6.7% |
| 85 Years and Over | 17 | 6.3% |
| Total | 268 | 100.0% |
Housing Finances in New England
Median Income by Occupancy in New England
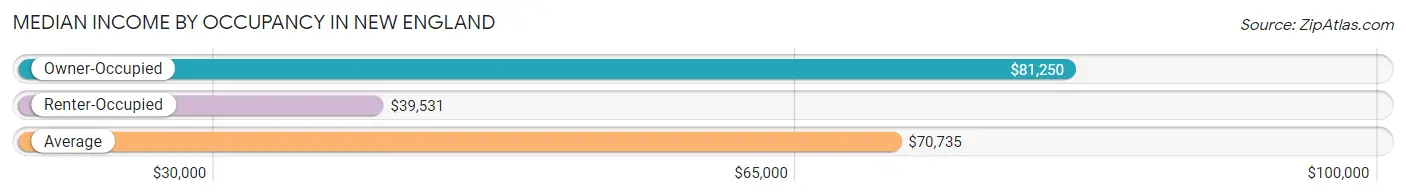
| Occupancy Type | # Households | Median Income |
| Owner-Occupied | 156 (58.2%) | $81,250 |
| Renter-Occupied | 112 (41.8%) | $39,531 |
| Average | 268 (100.0%) | $70,735 |
Occupancy by Householder Income Bracket in New England
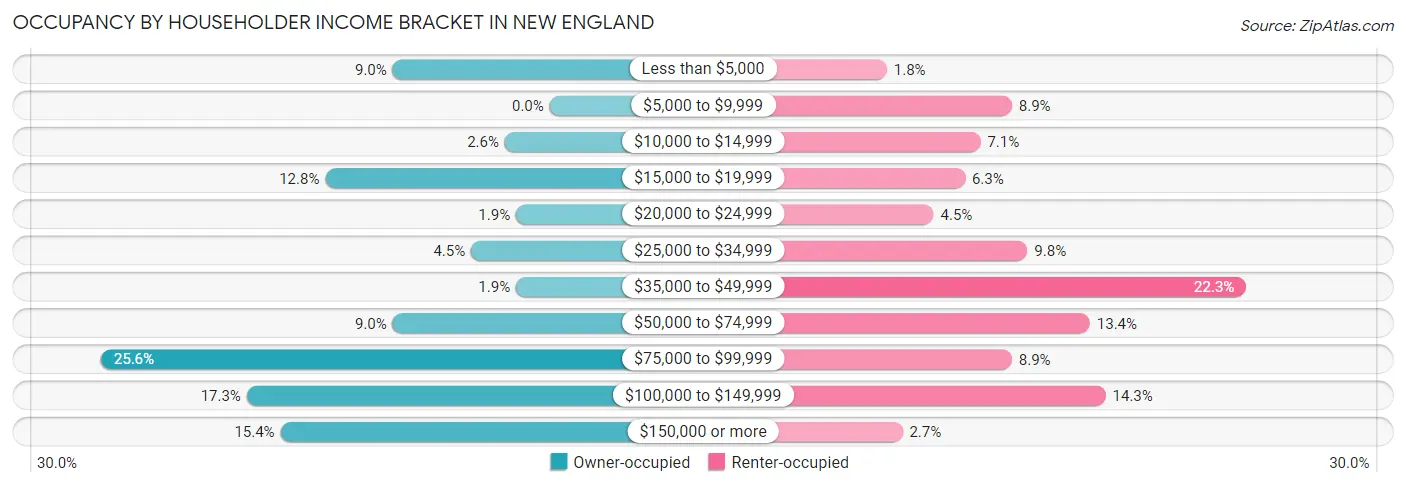
| Income Bracket | Owner-occupied | Renter-occupied |
| Less than $5,000 | 14 (9.0%) | 2 (1.8%) |
| $5,000 to $9,999 | 0 (0.0%) | 10 (8.9%) |
| $10,000 to $14,999 | 4 (2.6%) | 8 (7.1%) |
| $15,000 to $19,999 | 20 (12.8%) | 7 (6.2%) |
| $20,000 to $24,999 | 3 (1.9%) | 5 (4.5%) |
| $25,000 to $34,999 | 7 (4.5%) | 11 (9.8%) |
| $35,000 to $49,999 | 3 (1.9%) | 25 (22.3%) |
| $50,000 to $74,999 | 14 (9.0%) | 15 (13.4%) |
| $75,000 to $99,999 | 40 (25.6%) | 10 (8.9%) |
| $100,000 to $149,999 | 27 (17.3%) | 16 (14.3%) |
| $150,000 or more | 24 (15.4%) | 3 (2.7%) |
| Total | 156 (100.0%) | 112 (100.0%) |
Monthly Housing Cost Tiers in New England
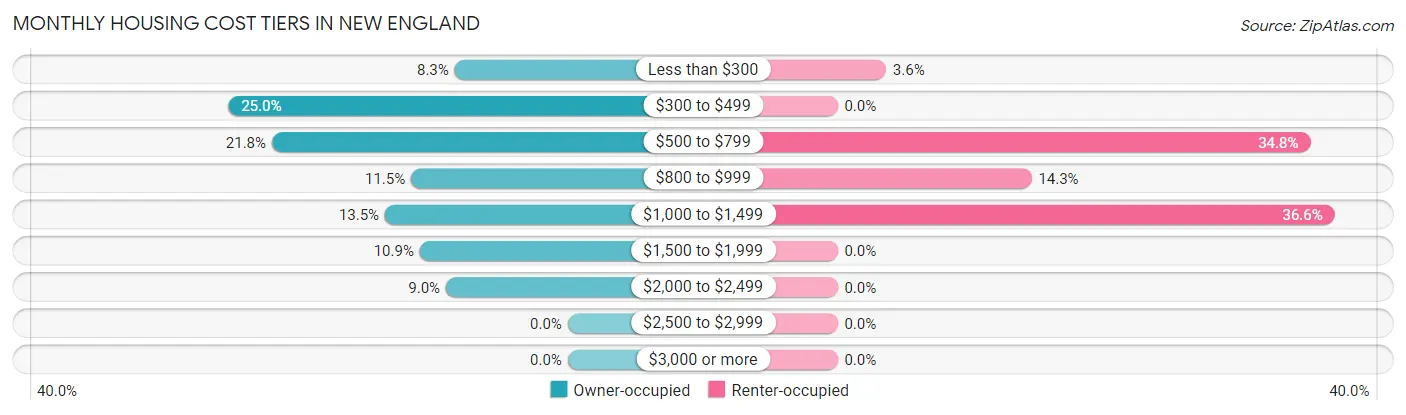
| Monthly Cost | Owner-occupied | Renter-occupied |
| Less than $300 | 13 (8.3%) | 4 (3.6%) |
| $300 to $499 | 39 (25.0%) | 0 (0.0%) |
| $500 to $799 | 34 (21.8%) | 39 (34.8%) |
| $800 to $999 | 18 (11.5%) | 16 (14.3%) |
| $1,000 to $1,499 | 21 (13.5%) | 41 (36.6%) |
| $1,500 to $1,999 | 17 (10.9%) | 0 (0.0%) |
| $2,000 to $2,499 | 14 (9.0%) | 0 (0.0%) |
| $2,500 to $2,999 | 0 (0.0%) | 0 (0.0%) |
| $3,000 or more | 0 (0.0%) | 0 (0.0%) |
| Total | 156 (100.0%) | 112 (100.0%) |
Physical Housing Characteristics in New England
Housing Structures in New England
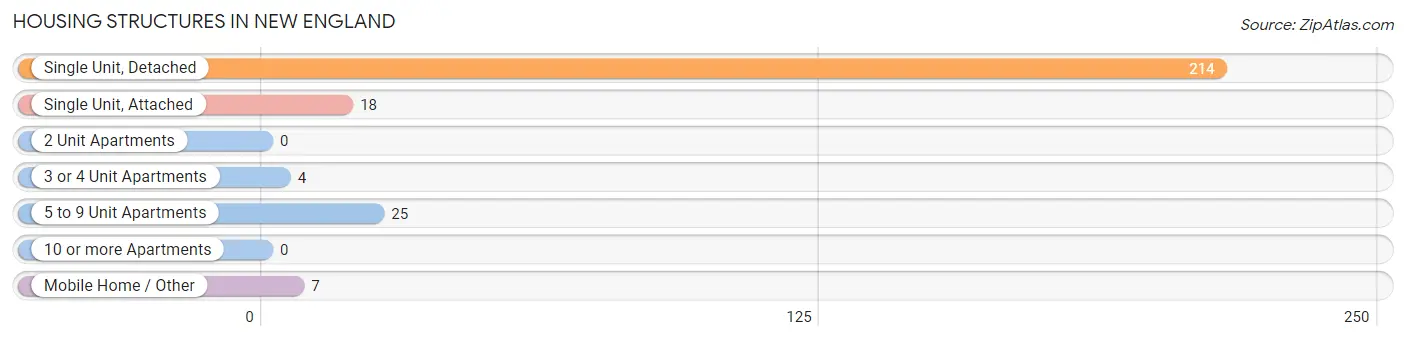
| Structure Type | # Housing Units | % Housing Units |
| Single Unit, Detached | 214 | 79.8% |
| Single Unit, Attached | 18 | 6.7% |
| 2 Unit Apartments | 0 | 0.0% |
| 3 or 4 Unit Apartments | 4 | 1.5% |
| 5 to 9 Unit Apartments | 25 | 9.3% |
| 10 or more Apartments | 0 | 0.0% |
| Mobile Home / Other | 7 | 2.6% |
| Total | 268 | 100.0% |
Housing Structures by Occupancy in New England
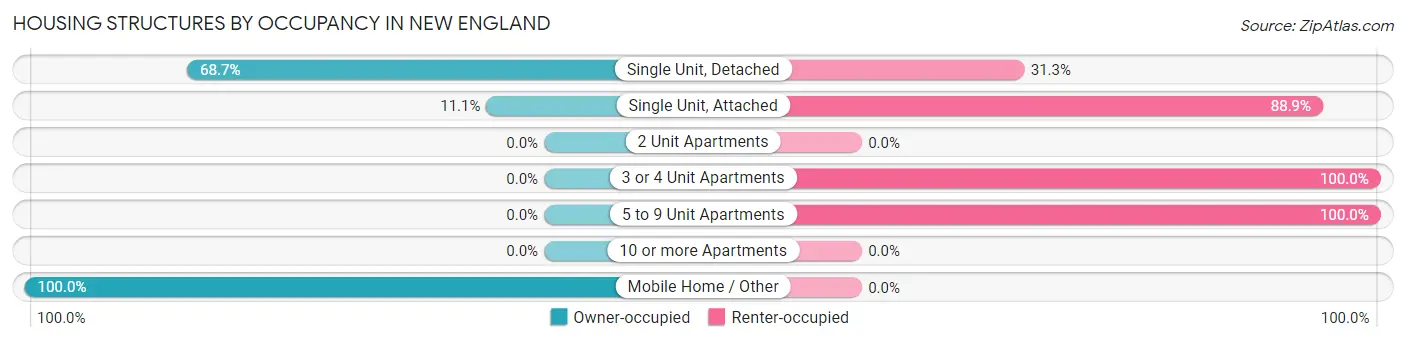
| Structure Type | Owner-occupied | Renter-occupied |
| Single Unit, Detached | 147 (68.7%) | 67 (31.3%) |
| Single Unit, Attached | 2 (11.1%) | 16 (88.9%) |
| 2 Unit Apartments | 0 (0.0%) | 0 (0.0%) |
| 3 or 4 Unit Apartments | 0 (0.0%) | 4 (100.0%) |
| 5 to 9 Unit Apartments | 0 (0.0%) | 25 (100.0%) |
| 10 or more Apartments | 0 (0.0%) | 0 (0.0%) |
| Mobile Home / Other | 7 (100.0%) | 0 (0.0%) |
| Total | 156 (58.2%) | 112 (41.8%) |
Housing Structures by Number of Rooms in New England
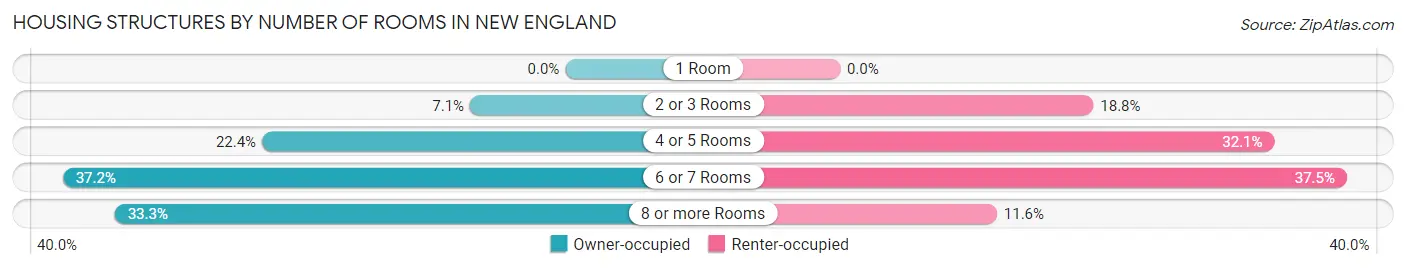
| Number of Rooms | Owner-occupied | Renter-occupied |
| 1 Room | 0 (0.0%) | 0 (0.0%) |
| 2 or 3 Rooms | 11 (7.0%) | 21 (18.8%) |
| 4 or 5 Rooms | 35 (22.4%) | 36 (32.1%) |
| 6 or 7 Rooms | 58 (37.2%) | 42 (37.5%) |
| 8 or more Rooms | 52 (33.3%) | 13 (11.6%) |
| Total | 156 (100.0%) | 112 (100.0%) |
Housing Structure by Heating Type in New England
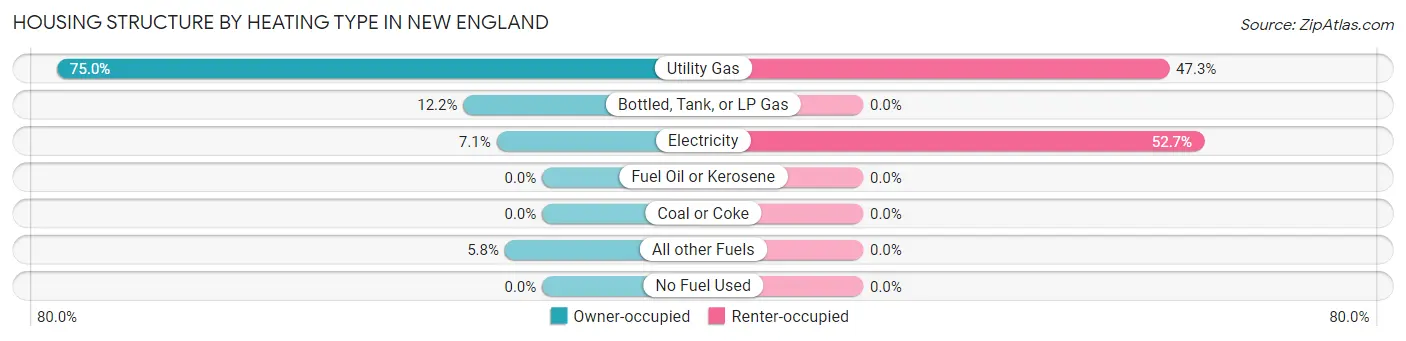
| Heating Type | Owner-occupied | Renter-occupied |
| Utility Gas | 117 (75.0%) | 53 (47.3%) |
| Bottled, Tank, or LP Gas | 19 (12.2%) | 0 (0.0%) |
| Electricity | 11 (7.0%) | 59 (52.7%) |
| Fuel Oil or Kerosene | 0 (0.0%) | 0 (0.0%) |
| Coal or Coke | 0 (0.0%) | 0 (0.0%) |
| All other Fuels | 9 (5.8%) | 0 (0.0%) |
| No Fuel Used | 0 (0.0%) | 0 (0.0%) |
| Total | 156 (100.0%) | 112 (100.0%) |
Household Vehicle Usage in New England
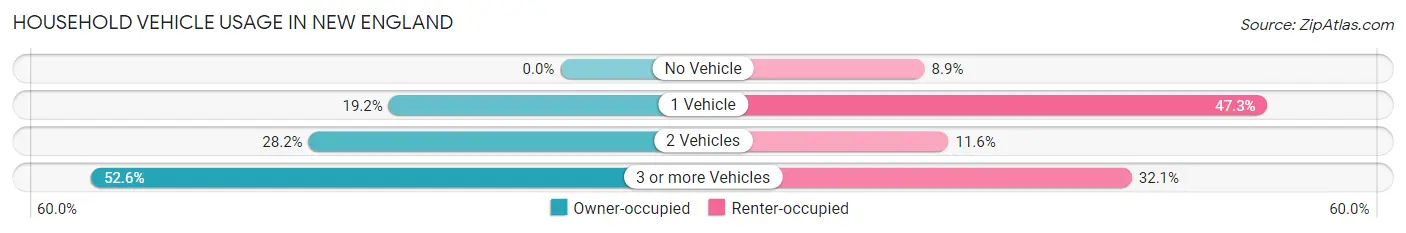
| Vehicles per Household | Owner-occupied | Renter-occupied |
| No Vehicle | 0 (0.0%) | 10 (8.9%) |
| 1 Vehicle | 30 (19.2%) | 53 (47.3%) |
| 2 Vehicles | 44 (28.2%) | 13 (11.6%) |
| 3 or more Vehicles | 82 (52.6%) | 36 (32.1%) |
| Total | 156 (100.0%) | 112 (100.0%) |
Real Estate & Mortgages in New England
Real Estate and Mortgage Overview in New England
| Characteristic | Without Mortgage | With Mortgage |
| Housing Units | 82 | 74 |
| Median Property Value | $123,400 | $146,300 |
| Median Household Income | - | - |
| Monthly Housing Costs | $435 | $0 |
| Real Estate Taxes | $1,167 | $2 |
Property Value by Mortgage Status in New England
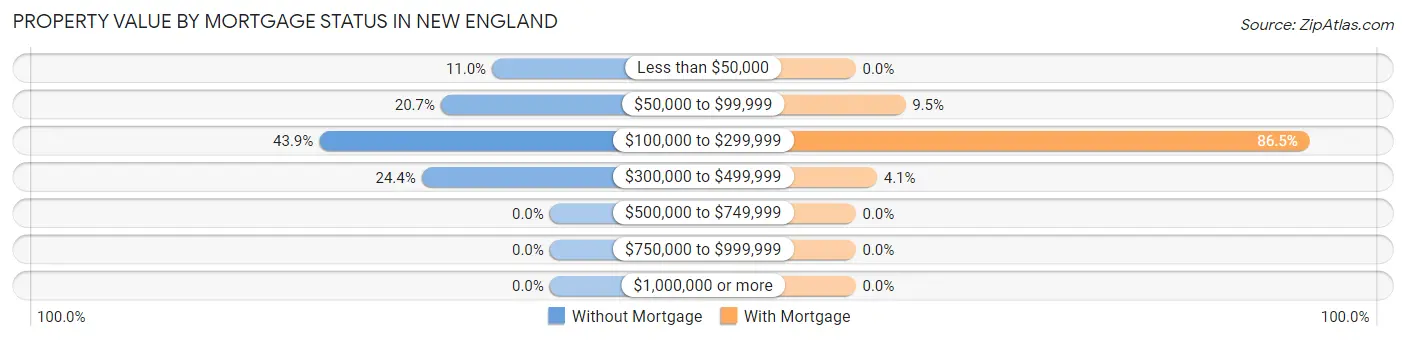
| Property Value | Without Mortgage | With Mortgage |
| Less than $50,000 | 9 (11.0%) | 0 (0.0%) |
| $50,000 to $99,999 | 17 (20.7%) | 7 (9.5%) |
| $100,000 to $299,999 | 36 (43.9%) | 64 (86.5%) |
| $300,000 to $499,999 | 20 (24.4%) | 3 (4.1%) |
| $500,000 to $749,999 | 0 (0.0%) | 0 (0.0%) |
| $750,000 to $999,999 | 0 (0.0%) | 0 (0.0%) |
| $1,000,000 or more | 0 (0.0%) | 0 (0.0%) |
| Total | 82 (100.0%) | 74 (100.0%) |
Household Income by Mortgage Status in New England
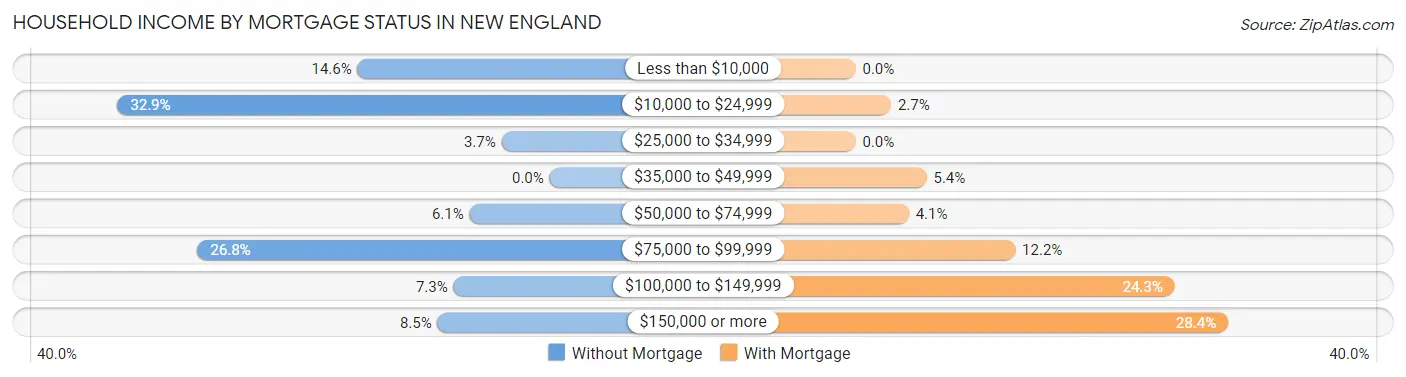
| Household Income | Without Mortgage | With Mortgage |
| Less than $10,000 | 12 (14.6%) | 0 (0.0%) |
| $10,000 to $24,999 | 27 (32.9%) | 2 (2.7%) |
| $25,000 to $34,999 | 3 (3.7%) | 0 (0.0%) |
| $35,000 to $49,999 | 0 (0.0%) | 4 (5.4%) |
| $50,000 to $74,999 | 5 (6.1%) | 3 (4.1%) |
| $75,000 to $99,999 | 22 (26.8%) | 9 (12.2%) |
| $100,000 to $149,999 | 6 (7.3%) | 18 (24.3%) |
| $150,000 or more | 7 (8.5%) | 21 (28.4%) |
| Total | 82 (100.0%) | 74 (100.0%) |
Property Value to Household Income Ratio in New England
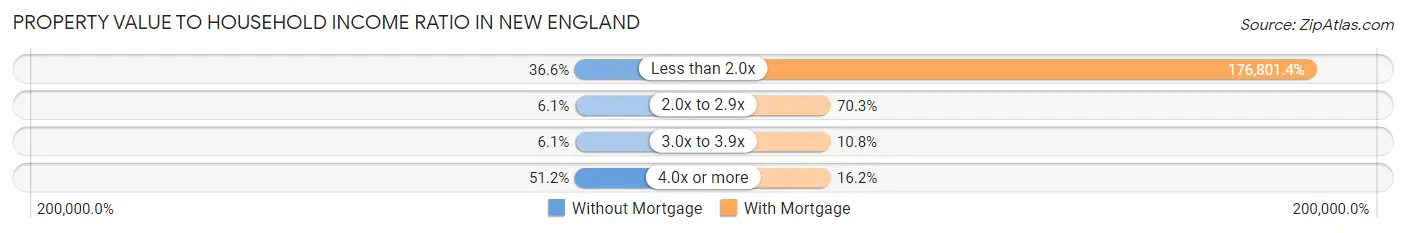
| Value-to-Income Ratio | Without Mortgage | With Mortgage |
| Less than 2.0x | 30 (36.6%) | 130,833 (176,801.4%) |
| 2.0x to 2.9x | 5 (6.1%) | 52 (70.3%) |
| 3.0x to 3.9x | 5 (6.1%) | 8 (10.8%) |
| 4.0x or more | 42 (51.2%) | 12 (16.2%) |
| Total | 82 (100.0%) | 74 (100.0%) |
Real Estate Taxes by Mortgage Status in New England
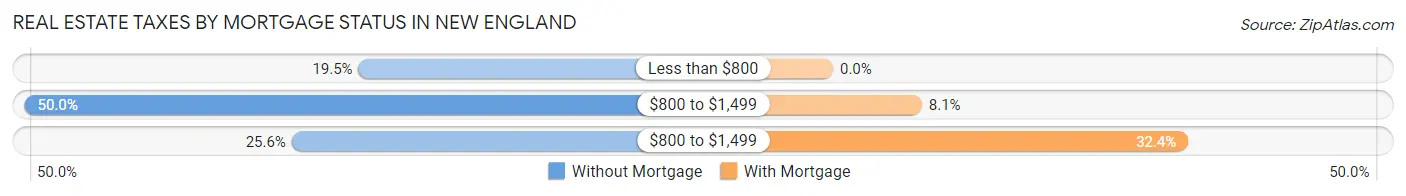
| Property Taxes | Without Mortgage | With Mortgage |
| Less than $800 | 16 (19.5%) | 0 (0.0%) |
| $800 to $1,499 | 41 (50.0%) | 6 (8.1%) |
| $800 to $1,499 | 21 (25.6%) | 24 (32.4%) |
| Total | 82 (100.0%) | 74 (100.0%) |
Health & Disability in New England
Health Insurance Coverage by Age in New England
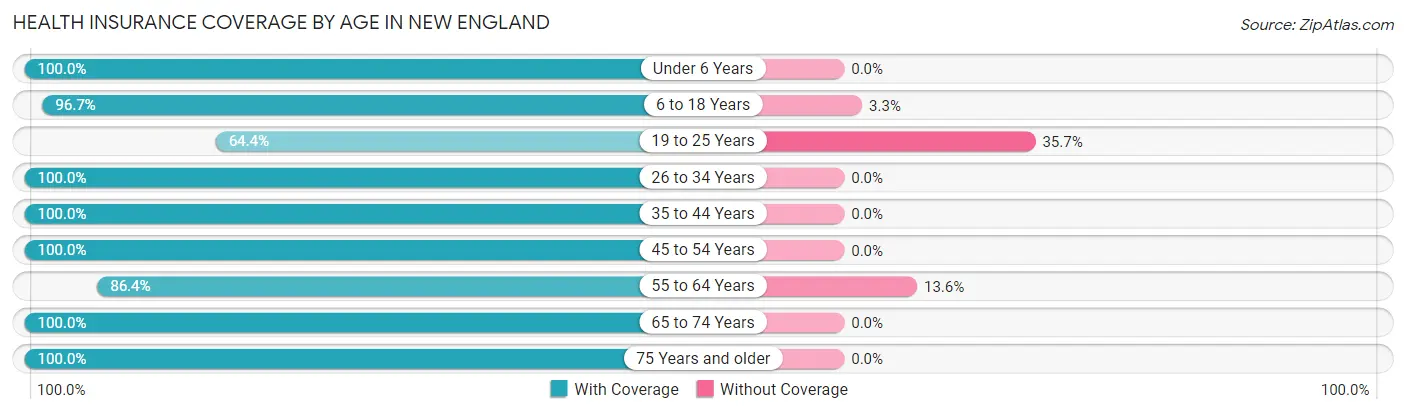
| Age Bracket | With Coverage | Without Coverage |
| Under 6 Years | 70 (100.0%) | 0 (0.0%) |
| 6 to 18 Years | 87 (96.7%) | 3 (3.3%) |
| 19 to 25 Years | 74 (64.3%) | 41 (35.6%) |
| 26 to 34 Years | 122 (100.0%) | 0 (0.0%) |
| 35 to 44 Years | 63 (100.0%) | 0 (0.0%) |
| 45 to 54 Years | 65 (100.0%) | 0 (0.0%) |
| 55 to 64 Years | 51 (86.4%) | 8 (13.6%) |
| 65 to 74 Years | 69 (100.0%) | 0 (0.0%) |
| 75 Years and older | 36 (100.0%) | 0 (0.0%) |
| Total | 637 (92.4%) | 52 (7.5%) |
Health Insurance Coverage by Citizenship Status in New England
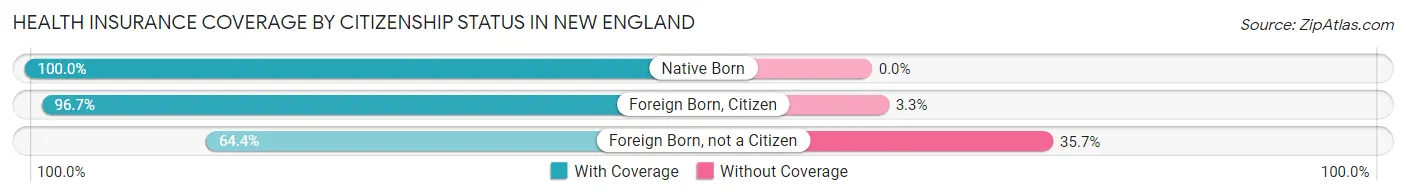
| Citizenship Status | With Coverage | Without Coverage |
| Native Born | 70 (100.0%) | 0 (0.0%) |
| Foreign Born, Citizen | 87 (96.7%) | 3 (3.3%) |
| Foreign Born, not a Citizen | 74 (64.3%) | 41 (35.6%) |
Health Insurance Coverage by Household Income in New England
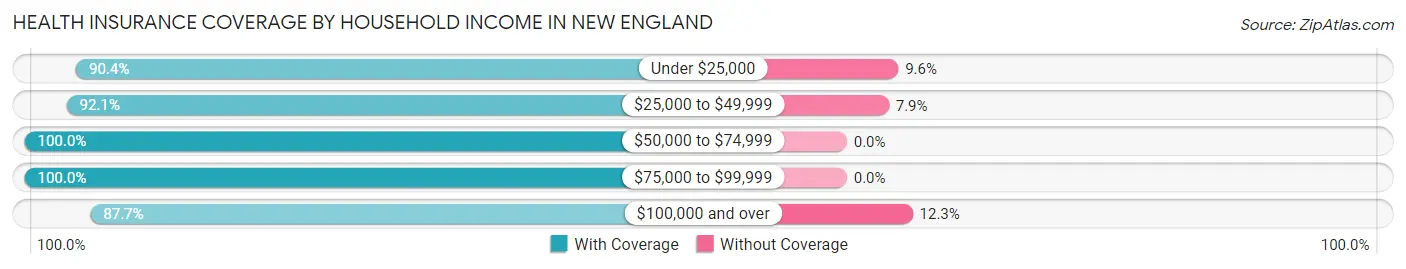
| Household Income | With Coverage | Without Coverage |
| Under $25,000 | 75 (90.4%) | 8 (9.6%) |
| $25,000 to $49,999 | 82 (92.1%) | 7 (7.9%) |
| $50,000 to $74,999 | 117 (100.0%) | 0 (0.0%) |
| $75,000 to $99,999 | 100 (100.0%) | 0 (0.0%) |
| $100,000 and over | 263 (87.7%) | 37 (12.3%) |
Public vs Private Health Insurance Coverage by Age in New England
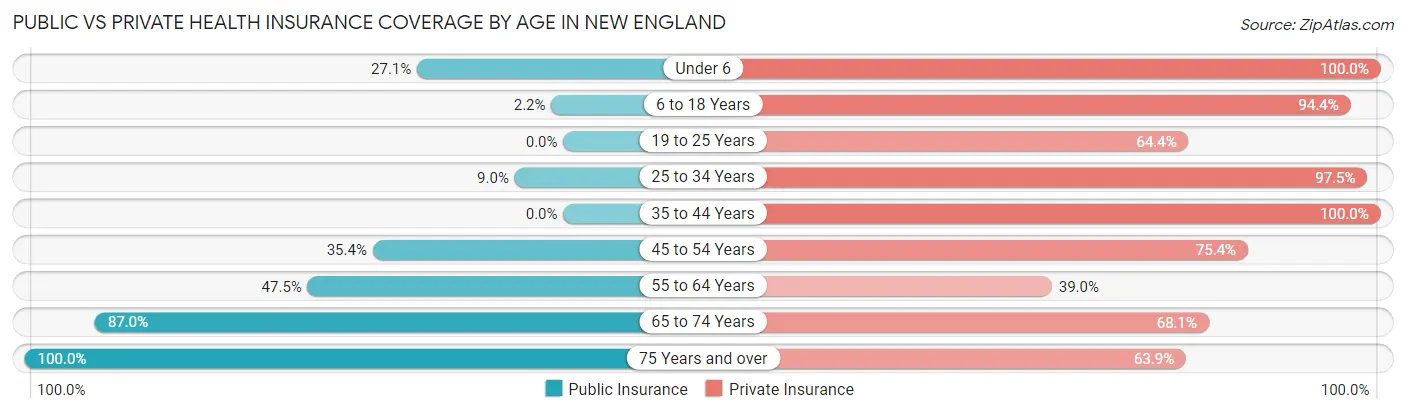
| Age Bracket | Public Insurance | Private Insurance |
| Under 6 | 19 (27.1%) | 70 (100.0%) |
| 6 to 18 Years | 2 (2.2%) | 85 (94.4%) |
| 19 to 25 Years | 0 (0.0%) | 74 (64.3%) |
| 25 to 34 Years | 11 (9.0%) | 119 (97.5%) |
| 35 to 44 Years | 0 (0.0%) | 63 (100.0%) |
| 45 to 54 Years | 23 (35.4%) | 49 (75.4%) |
| 55 to 64 Years | 28 (47.5%) | 23 (39.0%) |
| 65 to 74 Years | 60 (87.0%) | 47 (68.1%) |
| 75 Years and over | 36 (100.0%) | 23 (63.9%) |
| Total | 179 (26.0%) | 553 (80.3%) |
Disability Status by Sex by Age in New England
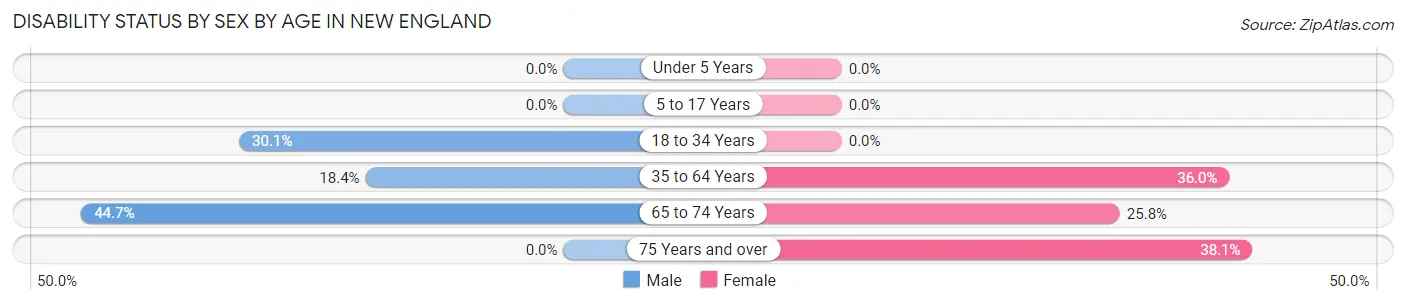
| Age Bracket | Male | Female |
| Under 5 Years | 0 (0.0%) | 0 (0.0%) |
| 5 to 17 Years | 0 (0.0%) | 0 (0.0%) |
| 18 to 34 Years | 34 (30.1%) | 0 (0.0%) |
| 35 to 64 Years | 18 (18.4%) | 32 (36.0%) |
| 65 to 74 Years | 17 (44.7%) | 8 (25.8%) |
| 75 Years and over | 0 (0.0%) | 8 (38.1%) |
Disability Class by Sex by Age in New England
Disability Class: Hearing Difficulty
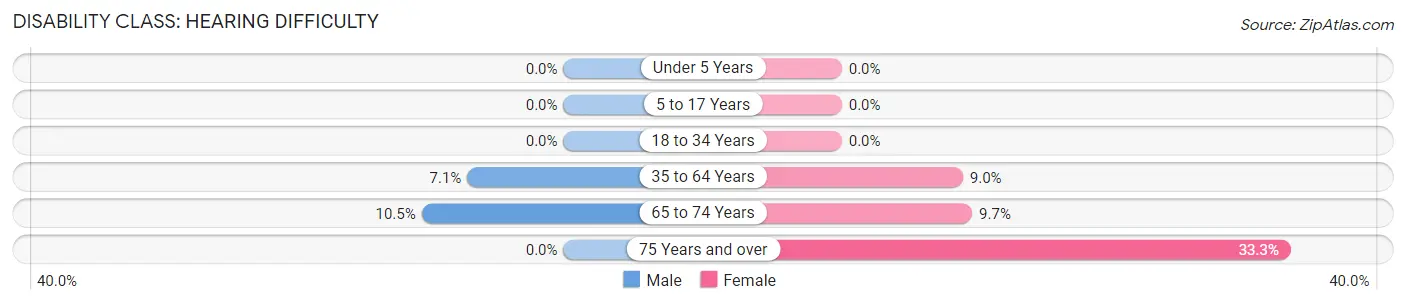
| Age Bracket | Male | Female |
| Under 5 Years | 0 (0.0%) | 0 (0.0%) |
| 5 to 17 Years | 0 (0.0%) | 0 (0.0%) |
| 18 to 34 Years | 0 (0.0%) | 0 (0.0%) |
| 35 to 64 Years | 7 (7.1%) | 8 (9.0%) |
| 65 to 74 Years | 4 (10.5%) | 3 (9.7%) |
| 75 Years and over | 0 (0.0%) | 7 (33.3%) |
Disability Class: Vision Difficulty
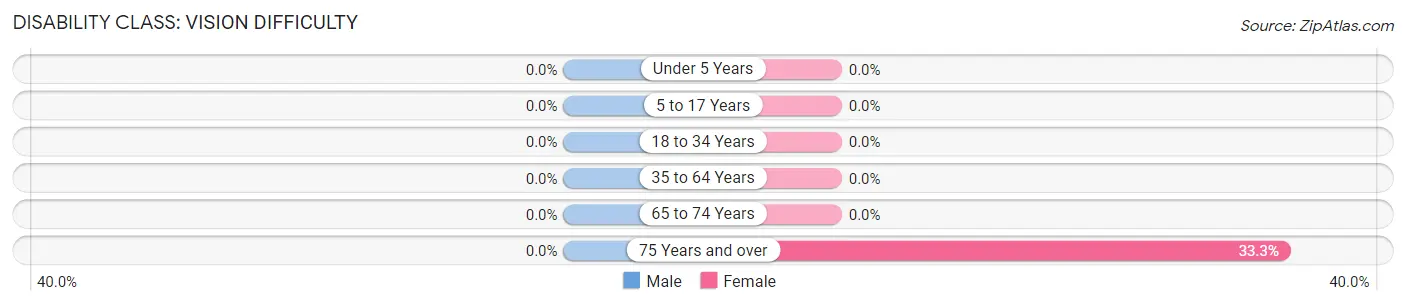
| Age Bracket | Male | Female |
| Under 5 Years | 0 (0.0%) | 0 (0.0%) |
| 5 to 17 Years | 0 (0.0%) | 0 (0.0%) |
| 18 to 34 Years | 0 (0.0%) | 0 (0.0%) |
| 35 to 64 Years | 0 (0.0%) | 0 (0.0%) |
| 65 to 74 Years | 0 (0.0%) | 0 (0.0%) |
| 75 Years and over | 0 (0.0%) | 7 (33.3%) |
Disability Class: Cognitive Difficulty
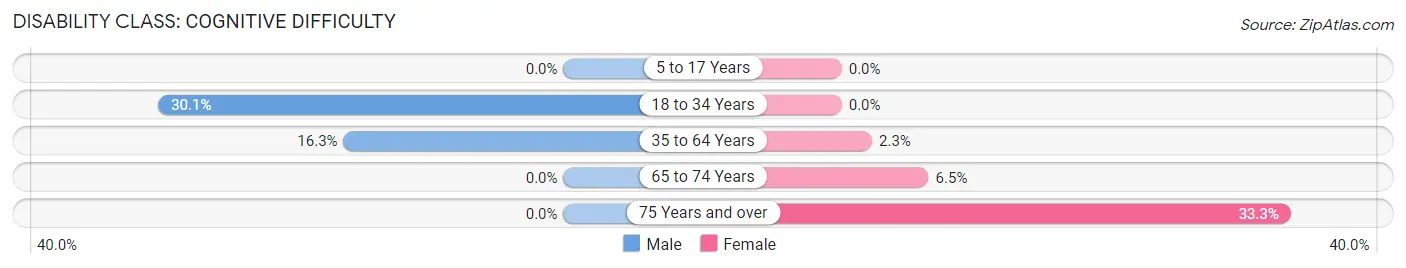
| Age Bracket | Male | Female |
| 5 to 17 Years | 0 (0.0%) | 0 (0.0%) |
| 18 to 34 Years | 34 (30.1%) | 0 (0.0%) |
| 35 to 64 Years | 16 (16.3%) | 2 (2.2%) |
| 65 to 74 Years | 0 (0.0%) | 2 (6.5%) |
| 75 Years and over | 0 (0.0%) | 7 (33.3%) |
Disability Class: Ambulatory Difficulty
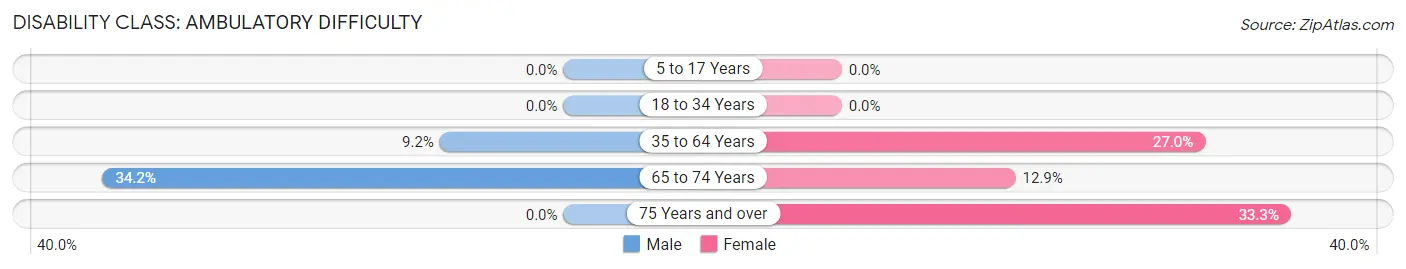
| Age Bracket | Male | Female |
| 5 to 17 Years | 0 (0.0%) | 0 (0.0%) |
| 18 to 34 Years | 0 (0.0%) | 0 (0.0%) |
| 35 to 64 Years | 9 (9.2%) | 24 (27.0%) |
| 65 to 74 Years | 13 (34.2%) | 4 (12.9%) |
| 75 Years and over | 0 (0.0%) | 7 (33.3%) |
Disability Class: Self-Care Difficulty
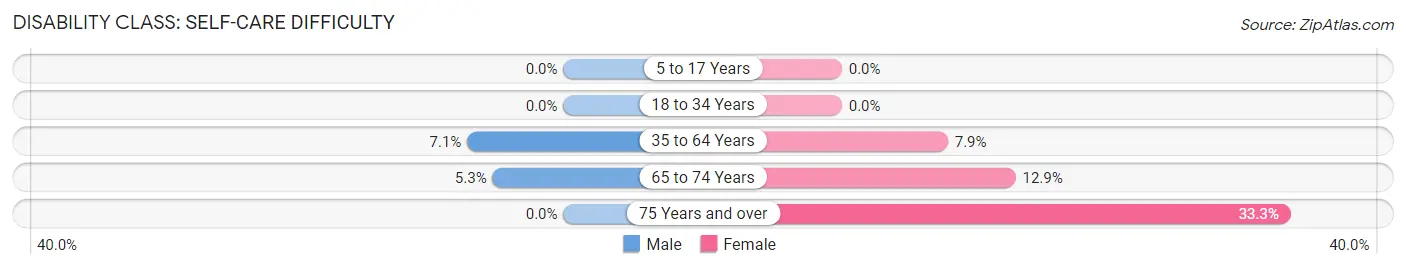
| Age Bracket | Male | Female |
| 5 to 17 Years | 0 (0.0%) | 0 (0.0%) |
| 18 to 34 Years | 0 (0.0%) | 0 (0.0%) |
| 35 to 64 Years | 7 (7.1%) | 7 (7.9%) |
| 65 to 74 Years | 2 (5.3%) | 4 (12.9%) |
| 75 Years and over | 0 (0.0%) | 7 (33.3%) |
Technology Access in New England
Computing Device Access in New England
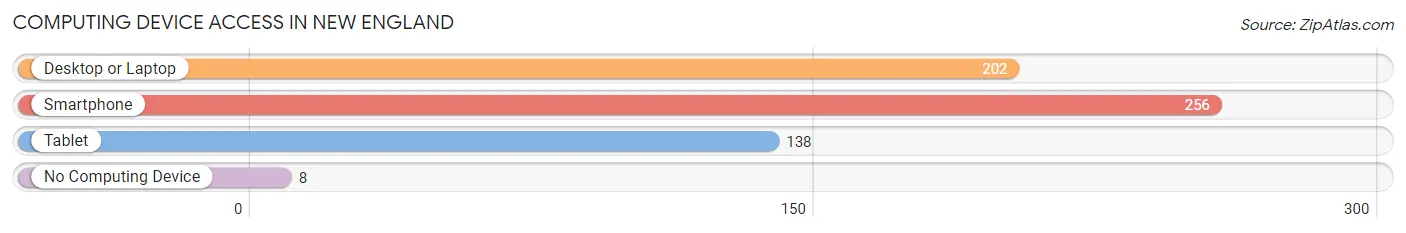
| Device Type | # Households | % Households |
| Desktop or Laptop | 202 | 75.4% |
| Smartphone | 256 | 95.5% |
| Tablet | 138 | 51.5% |
| No Computing Device | 8 | 3.0% |
| Total | 268 | 100.0% |
Internet Access in New England
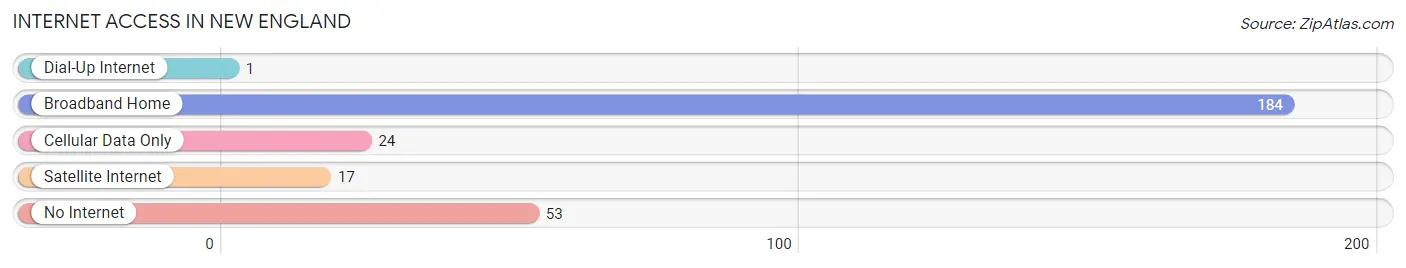
| Internet Type | # Households | % Households |
| Dial-Up Internet | 1 | 0.4% |
| Broadband Home | 184 | 68.7% |
| Cellular Data Only | 24 | 9.0% |
| Satellite Internet | 17 | 6.3% |
| No Internet | 53 | 19.8% |
| Total | 268 | 100.0% |
New England Summary
New England is a region of the United States located in the northeastern corner of the country. It is comprised of six states: Connecticut, Maine, Massachusetts, New Hampshire, Rhode Island, and Vermont. The region is known for its rich history, diverse geography, vibrant economy, and unique demographics.
History
The history of New England dates back to the early 1600s when English settlers first arrived in the region. The first permanent settlement was established in 1620 in Plymouth, Massachusetts. The settlers were seeking religious freedom and economic opportunity, and they quickly established a thriving economy based on fishing, lumber, and shipbuilding. The region was also home to the first public school in the United States, established in 1635 in Boston.
The American Revolution began in New England in 1775, and the region was a major center of the war effort. After the war, the region experienced a period of rapid economic growth and industrialization. This period was marked by the rise of the textile industry, the growth of the shipping industry, and the development of the railroad.
Geography
New England is a region of diverse geography. It is bordered by the Atlantic Ocean to the east and the Appalachian Mountains to the west. The region is home to a variety of landscapes, including rolling hills, rocky coasts, and dense forests. The region is also home to numerous rivers, lakes, and streams.
The climate of New England is generally temperate, with cold winters and mild summers. The region is known for its beautiful fall foliage, which is a major tourist attraction.
Economy
The economy of New England is diverse and vibrant. The region is home to a variety of industries, including manufacturing, technology, finance, and tourism. The region is also home to numerous universities and colleges, which contribute to the economy through research and development.
The region is also home to a thriving agricultural sector, which produces a variety of crops, including apples, cranberries, and potatoes. The region is also home to a thriving fishing industry, which produces a variety of seafood, including lobster, cod, and scallops.
Demographics
New England is home to a diverse population. According to the 2010 census, the region is home to more than 14 million people. The population is predominantly white, with African Americans, Hispanics, and Asians making up a small percentage of the population.
The region is also home to a variety of religious groups, including Protestants, Catholics, and Jews. The region is also home to a large number of immigrants, with the largest groups coming from Latin America, Asia, and Europe.
New England is a region with a rich history, diverse geography, vibrant economy, and unique demographics. The region is home to a variety of cultures and religions, and it is a major center of economic activity. The region is also home to a variety of landscapes, from rolling hills to rocky coasts, and it is known for its beautiful fall foliage. New England is a region with a lot to offer, and it is a great place to live and work.
Common Questions
What is Per Capita Income in New England?
Per Capita income in New England is $38,265.
What is the Median Family Income in New England?
Median Family Income in New England is $88,438.
What is the Median Household income in New England?
Median Household Income in New England is $70,735.
What is Income or Wage Gap in New England?
Income or Wage Gap in New England is 45.3%.
Women in New England earn 54.7 cents for every dollar earned by a man.
What is Inequality or Gini Index in New England?
Inequality or Gini Index in New England is 0.56.
What is the Total Population of New England?
Total Population of New England is 810.
What is the Total Male Population of New England?
Total Male Population of New England is 339.
What is the Total Female Population of New England?
Total Female Population of New England is 471.
What is the Ratio of Males per 100 Females in New England?
There are 71.97 Males per 100 Females in New England.
What is the Ratio of Females per 100 Males in New England?
There are 138.94 Females per 100 Males in New England.
What is the Median Population Age in New England?
Median Population Age in New England is 32.6 Years.
What is the Average Family Size in New England
Average Family Size in New England is 3.5 People.
What is the Average Household Size in New England
Average Household Size in New England is 2.6 People.
How Large is the Labor Force in New England?
There are 404 People in the Labor Forcein in New England.
What is the Percentage of People in the Labor Force in New England?
60.5% of People are in the Labor Force in New England.
What is the Unemployment Rate in New England?
Unemployment Rate in New England is 6.9%.