Zap, ND Map & Demographics
Zap Map
Zap Overview
$31,336
PER CAPITA INCOME
$106,875
AVG FAMILY INCOME
0.46
INEQUALITY / GINI INDEX
161
TOTAL POPULATION
75
MALE POPULATION
86
FEMALE POPULATION
87.21
MALES / 100 FEMALES
114.67
FEMALES / 100 MALES
43.5
MEDIAN AGE
2.9
AVG FAMILY SIZE
2.2
AVG HOUSEHOLD SIZE
61
LABOR FORCE [ PEOPLE ]
52.6%
PERCENT IN LABOR FORCE
Zap Zip Codes
Zap Area Codes
Income in Zap
Income Overview in Zap
| Characteristic | Number | Measure |
| Per Capita Income | 161 | $31,336 |
| Median Family Income | 41 | $106,875 |
| Mean Family Income | 41 | $101,207 |
| Median Household Income | 72 | $0 |
| Mean Household Income | 72 | $72,263 |
| Income Deficit | 41 | $0 |
| Wage / Income Gap (%) | 161 | 0.00% |
| Wage / Income Gap ($) | 161 | 100.00¢ per $1 |
| Gini / Inequality Index | 161 | 0.46 |
Earnings by Sex in Zap
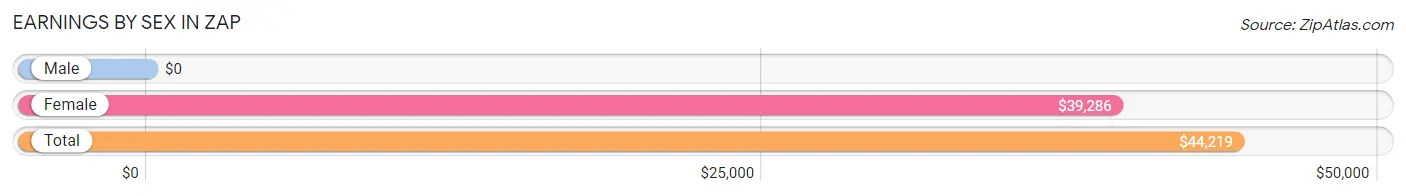
| Sex | Number | Average Earnings |
| Male | 27 (44.3%) | $0 |
| Female | 34 (55.7%) | $39,286 |
| Total | 61 (100.0%) | $44,219 |
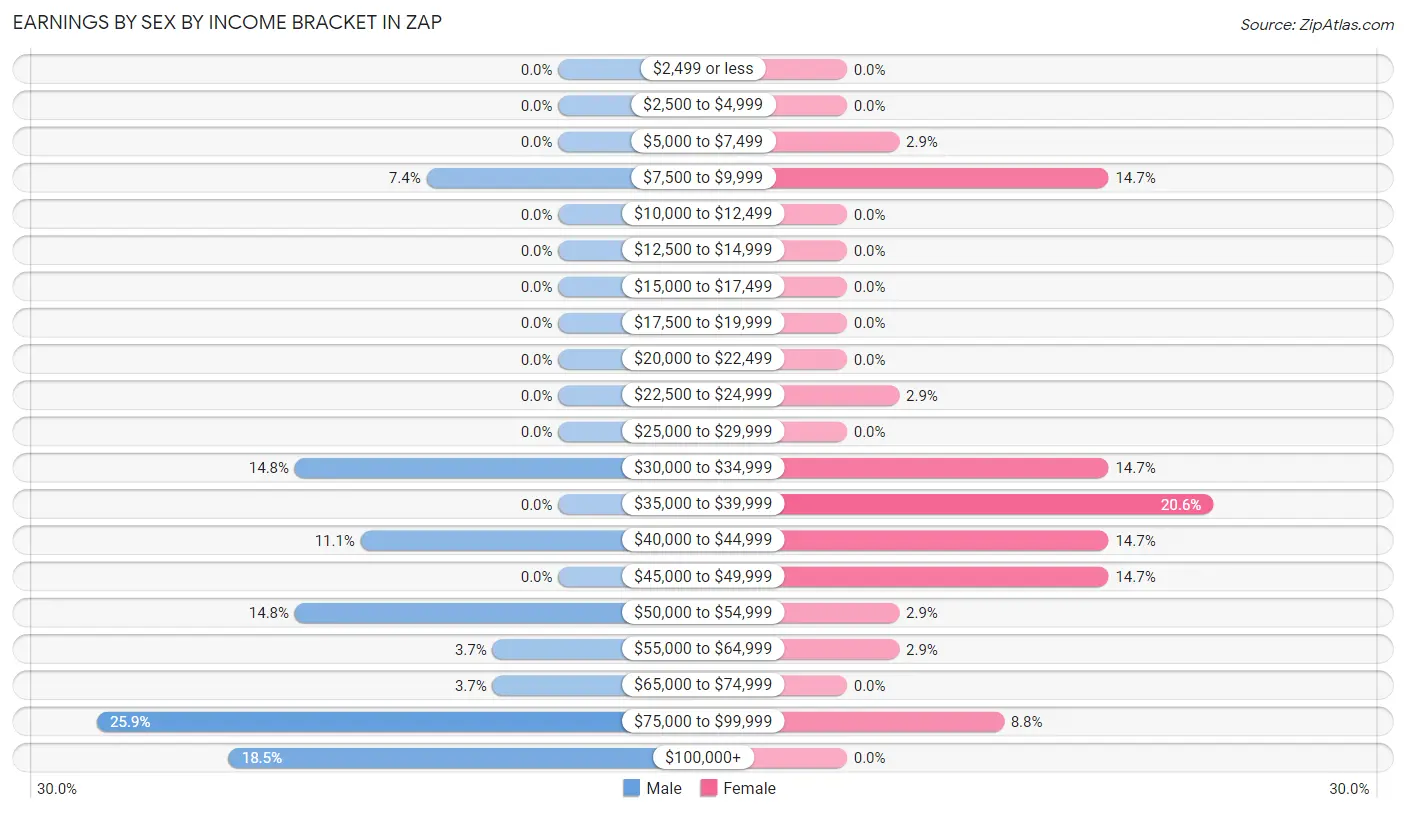
Earnings by Sex by Income Bracket in Zap
The most common earnings brackets in Zap are $75,000 to $99,999 for men (7 | 25.9%) and $35,000 to $39,999 for women (7 | 20.6%).
| Income | Male | Female |
| $2,499 or less | 0 (0.0%) | 0 (0.0%) |
| $2,500 to $4,999 | 0 (0.0%) | 0 (0.0%) |
| $5,000 to $7,499 | 0 (0.0%) | 1 (2.9%) |
| $7,500 to $9,999 | 2 (7.4%) | 5 (14.7%) |
| $10,000 to $12,499 | 0 (0.0%) | 0 (0.0%) |
| $12,500 to $14,999 | 0 (0.0%) | 0 (0.0%) |
| $15,000 to $17,499 | 0 (0.0%) | 0 (0.0%) |
| $17,500 to $19,999 | 0 (0.0%) | 0 (0.0%) |
| $20,000 to $22,499 | 0 (0.0%) | 0 (0.0%) |
| $22,500 to $24,999 | 0 (0.0%) | 1 (2.9%) |
| $25,000 to $29,999 | 0 (0.0%) | 0 (0.0%) |
| $30,000 to $34,999 | 4 (14.8%) | 5 (14.7%) |
| $35,000 to $39,999 | 0 (0.0%) | 7 (20.6%) |
| $40,000 to $44,999 | 3 (11.1%) | 5 (14.7%) |
| $45,000 to $49,999 | 0 (0.0%) | 5 (14.7%) |
| $50,000 to $54,999 | 4 (14.8%) | 1 (2.9%) |
| $55,000 to $64,999 | 1 (3.7%) | 1 (2.9%) |
| $65,000 to $74,999 | 1 (3.7%) | 0 (0.0%) |
| $75,000 to $99,999 | 7 (25.9%) | 3 (8.8%) |
| $100,000+ | 5 (18.5%) | 0 (0.0%) |
| Total | 27 (100.0%) | 34 (100.0%) |
Earnings by Sex by Educational Attainment in Zap
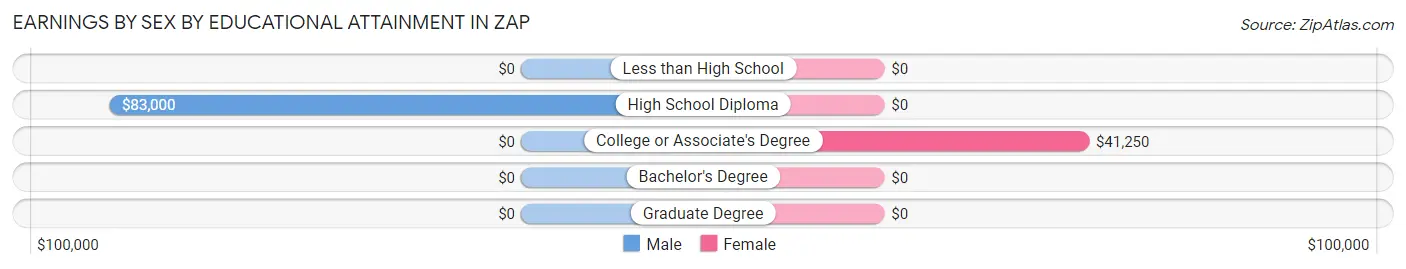
| Educational Attainment | Male Income | Female Income |
| Less than High School | - | - |
| High School Diploma | $83,000 | $0 |
| College or Associate's Degree | - | - |
| Bachelor's Degree | - | - |
| Graduate Degree | - | - |
| Total | - | - |
Family Income in Zap
Family Income Brackets in Zap
According to the Zap family income data, there are 20 families falling into the $100,000 to $149,999 income range, which is the most common income bracket and makes up 48.8% of all families.
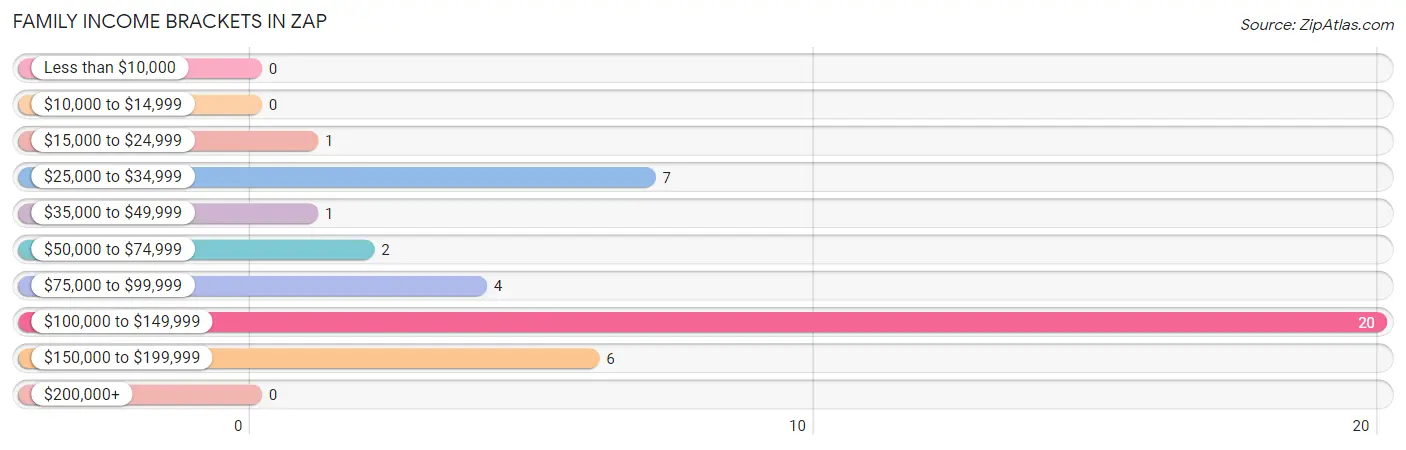
| Income Bracket | # Families | % Families |
| Less than $10,000 | 0 | 0.0% |
| $10,000 to $14,999 | 0 | 0.0% |
| $15,000 to $24,999 | 1 | 2.4% |
| $25,000 to $34,999 | 7 | 17.1% |
| $35,000 to $49,999 | 1 | 2.4% |
| $50,000 to $74,999 | 2 | 4.9% |
| $75,000 to $99,999 | 4 | 9.8% |
| $100,000 to $149,999 | 20 | 48.8% |
| $150,000 to $199,999 | 6 | 14.6% |
| $200,000+ | 0 | 0.0% |
Family Income by Famaliy Size in Zap
2-person families (26 | 63.4%) account for the highest median family income in Zap with $103,750 per family, while 2-person families (26 | 63.4%) have the highest median income of $51,875 per family member.
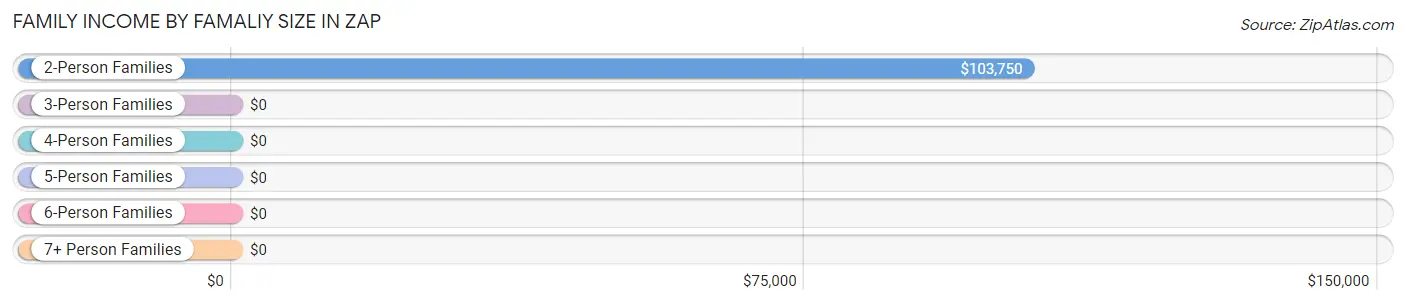
| Income Bracket | # Families | Median Income |
| 2-Person Families | 26 (63.4%) | $103,750 |
| 3-Person Families | 3 (7.3%) | $0 |
| 4-Person Families | 6 (14.6%) | $0 |
| 5-Person Families | 5 (12.2%) | $0 |
| 6-Person Families | 0 (0.0%) | $0 |
| 7+ Person Families | 1 (2.4%) | $0 |
| Total | 41 (100.0%) | $106,875 |
Family Income by Number of Earners in Zap
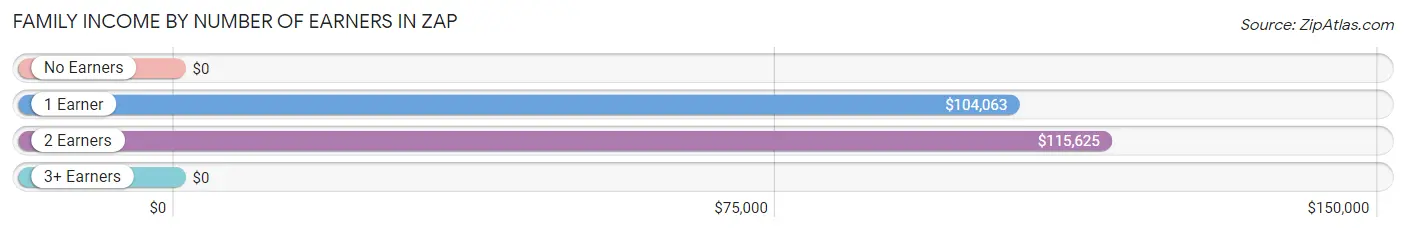
| Number of Earners | # Families | Median Income |
| No Earners | 13 (31.7%) | $0 |
| 1 Earner | 15 (36.6%) | $104,063 |
| 2 Earners | 11 (26.8%) | $115,625 |
| 3+ Earners | 2 (4.9%) | $0 |
| Total | 41 (100.0%) | $106,875 |
Household Income in Zap
Household Income Brackets in Zap
With 20 households falling in the category, the $100,000 to $149,999 income range is the most frequent in Zap, accounting for 27.8% of all households. In contrast, only 1 households (1.4%) fall into the $10,000 to $14,999 income bracket, making it the least populous group.
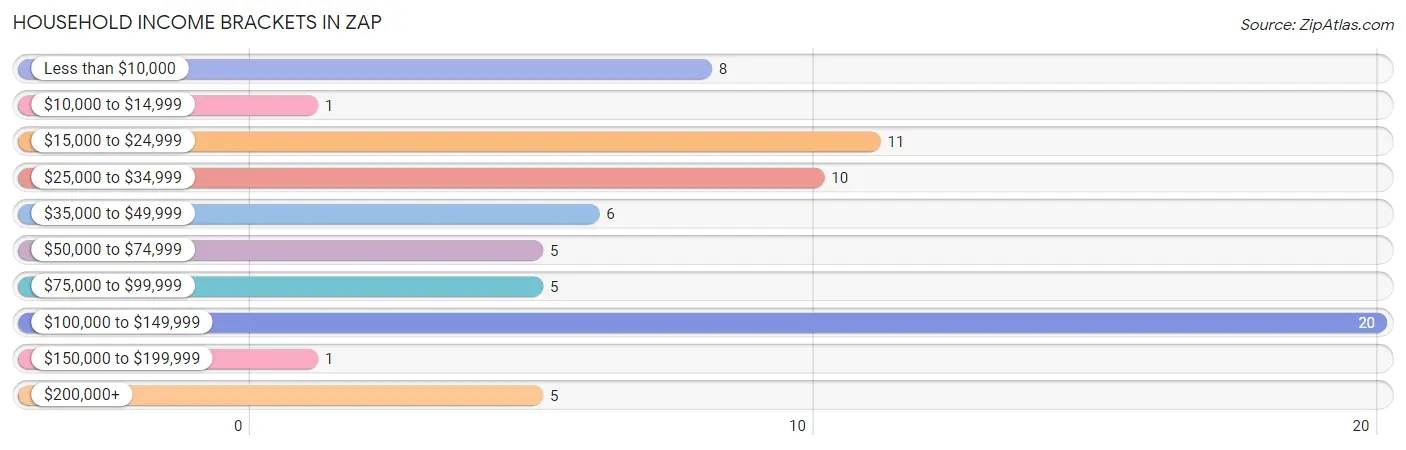
| Income Bracket | # Households | % Households |
| Less than $10,000 | 8 | 11.1% |
| $10,000 to $14,999 | 1 | 1.4% |
| $15,000 to $24,999 | 11 | 15.3% |
| $25,000 to $34,999 | 10 | 13.9% |
| $35,000 to $49,999 | 6 | 8.3% |
| $50,000 to $74,999 | 5 | 6.9% |
| $75,000 to $99,999 | 5 | 6.9% |
| $100,000 to $149,999 | 20 | 27.8% |
| $150,000 to $199,999 | 1 | 1.4% |
| $200,000+ | 5 | 6.9% |
Household Income by Householder Age in Zap
The median household income in Zap is $0, with the highest median household income of $114,792 found in the 25 to 44 years age bracket for the primary householder. A total of 19 households (26.4%) fall into this category.
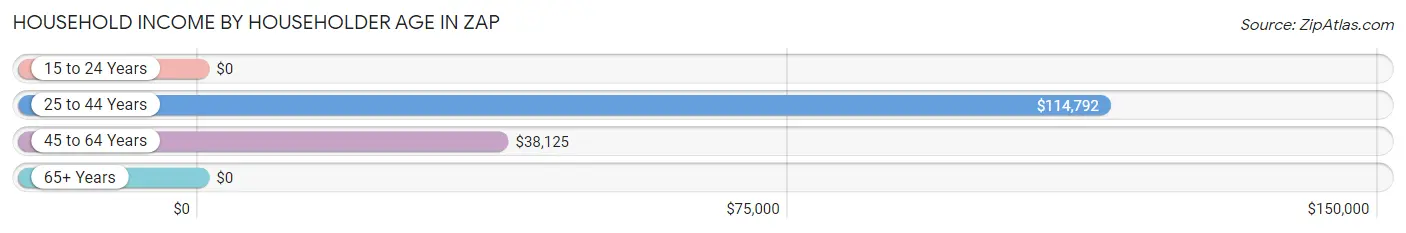
| Income Bracket | # Households | Median Income |
| 15 to 24 Years | 0 (0.0%) | $0 |
| 25 to 44 Years | 19 (26.4%) | $114,792 |
| 45 to 64 Years | 35 (48.6%) | $38,125 |
| 65+ Years | 18 (25.0%) | $0 |
| Total | 72 (100.0%) | $0 |
Poverty in Zap
Income Below Poverty by Sex and Age in Zap
With 9.3% poverty level for males and 7.0% for females among the residents of Zap, 55 to 64 year old males and 55 to 64 year old females are the most vulnerable to poverty, with 6 males (31.6%) and 3 females (20.0%) in their respective age groups living below the poverty level.
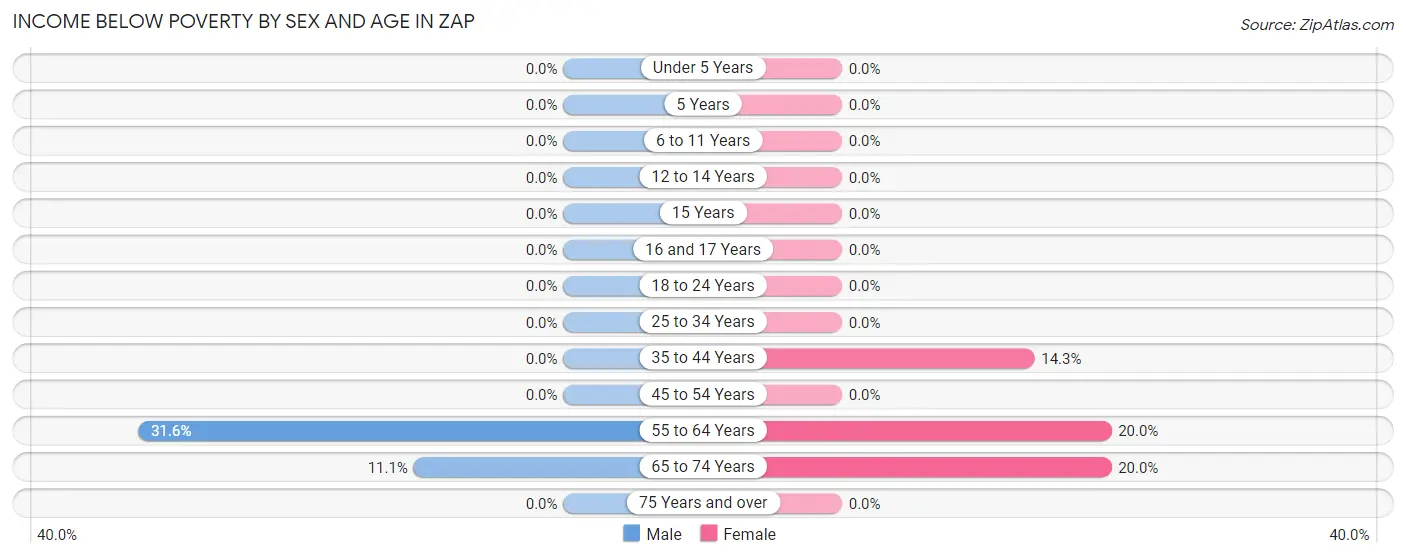
| Age Bracket | Male | Female |
| Under 5 Years | 0 (0.0%) | 0 (0.0%) |
| 5 Years | 0 (0.0%) | 0 (0.0%) |
| 6 to 11 Years | 0 (0.0%) | 0 (0.0%) |
| 12 to 14 Years | 0 (0.0%) | 0 (0.0%) |
| 15 Years | 0 (0.0%) | 0 (0.0%) |
| 16 and 17 Years | 0 (0.0%) | 0 (0.0%) |
| 18 to 24 Years | 0 (0.0%) | 0 (0.0%) |
| 25 to 34 Years | 0 (0.0%) | 0 (0.0%) |
| 35 to 44 Years | 0 (0.0%) | 2 (14.3%) |
| 45 to 54 Years | 0 (0.0%) | 0 (0.0%) |
| 55 to 64 Years | 6 (31.6%) | 3 (20.0%) |
| 65 to 74 Years | 1 (11.1%) | 1 (20.0%) |
| 75 Years and over | 0 (0.0%) | 0 (0.0%) |
| Total | 7 (9.3%) | 6 (7.0%) |
Income Above Poverty by Sex and Age in Zap
According to the poverty statistics in Zap, males aged under 5 years and females aged under 5 years are the age groups that are most secure financially, with 100.0% of males and 100.0% of females in these age groups living above the poverty line.
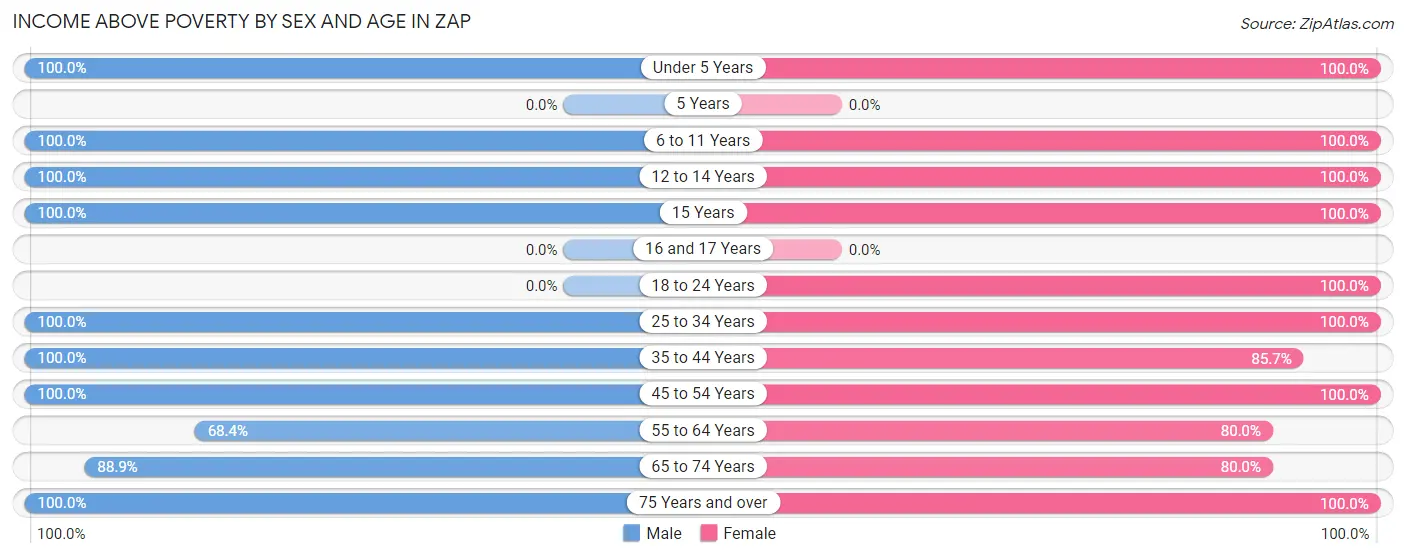
| Age Bracket | Male | Female |
| Under 5 Years | 1 (100.0%) | 5 (100.0%) |
| 5 Years | 0 (0.0%) | 0 (0.0%) |
| 6 to 11 Years | 3 (100.0%) | 20 (100.0%) |
| 12 to 14 Years | 11 (100.0%) | 2 (100.0%) |
| 15 Years | 1 (100.0%) | 2 (100.0%) |
| 16 and 17 Years | 0 (0.0%) | 0 (0.0%) |
| 18 to 24 Years | 0 (0.0%) | 3 (100.0%) |
| 25 to 34 Years | 9 (100.0%) | 6 (100.0%) |
| 35 to 44 Years | 8 (100.0%) | 12 (85.7%) |
| 45 to 54 Years | 6 (100.0%) | 6 (100.0%) |
| 55 to 64 Years | 13 (68.4%) | 12 (80.0%) |
| 65 to 74 Years | 8 (88.9%) | 4 (80.0%) |
| 75 Years and over | 8 (100.0%) | 8 (100.0%) |
| Total | 68 (90.7%) | 80 (93.0%) |
Income Below Poverty Among Married-Couple Families in Zap
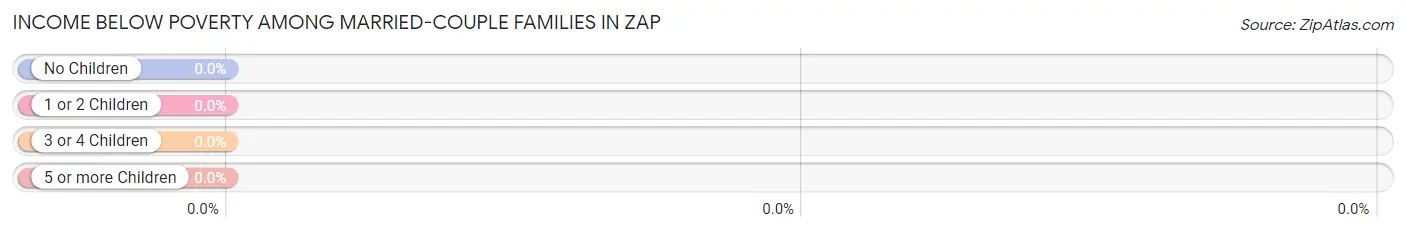
| Children | Above Poverty | Below Poverty |
| No Children | 28 (100.0%) | 0 (0.0%) |
| 1 or 2 Children | 3 (100.0%) | 0 (0.0%) |
| 3 or 4 Children | 0 (0.0%) | 0 (0.0%) |
| 5 or more Children | 1 (100.0%) | 0 (0.0%) |
| Total | 32 (100.0%) | 0 (0.0%) |
Income Below Poverty Among Single-Parent Households in Zap
| Children | Single Father | Single Mother |
| No Children | 0 (0.0%) | 0 (0.0%) |
| 1 or 2 Children | 0 (0.0%) | 0 (0.0%) |
| 3 or 4 Children | 0 (0.0%) | 0 (0.0%) |
| 5 or more Children | 0 (0.0%) | 0 (0.0%) |
| Total | 0 (0.0%) | 0 (0.0%) |
Income Below Poverty Among Married-Couple vs Single-Parent Households in Zap
| Children | Married-Couple Families | Single-Parent Households |
| No Children | 0 (0.0%) | 0 (0.0%) |
| 1 or 2 Children | 0 (0.0%) | 0 (0.0%) |
| 3 or 4 Children | 0 (0.0%) | 0 (0.0%) |
| 5 or more Children | 0 (0.0%) | 0 (0.0%) |
| Total | 0 (0.0%) | 0 (0.0%) |
Race in Zap
The most populous races in Zap are White / Caucasian (129 | 80.1%), Native / Alaskan (29 | 18.0%), and Two or more Races (3 | 1.9%).
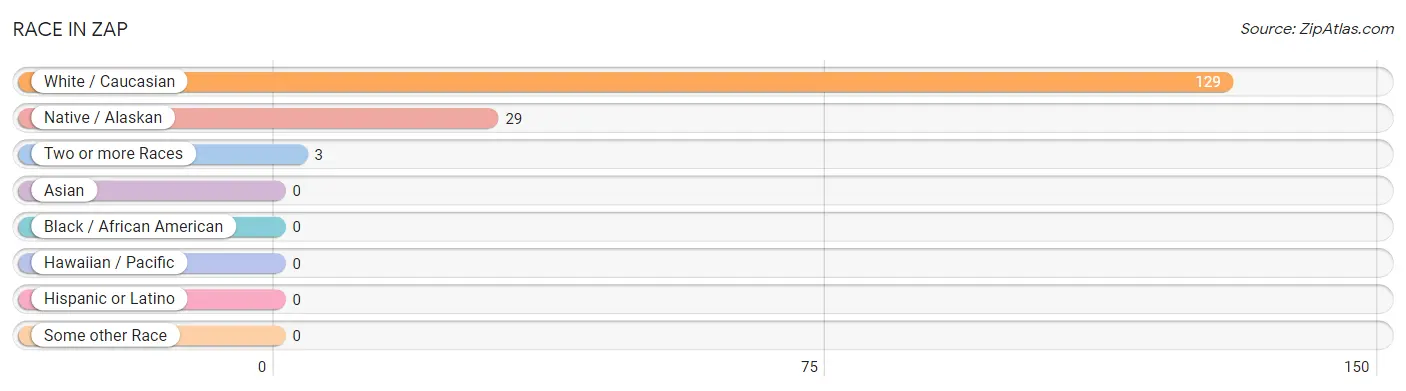
| Race | # Population | % Population |
| Asian | 0 | 0.0% |
| Black / African American | 0 | 0.0% |
| Hawaiian / Pacific | 0 | 0.0% |
| Hispanic or Latino | 0 | 0.0% |
| Native / Alaskan | 29 | 18.0% |
| White / Caucasian | 129 | 80.1% |
| Two or more Races | 3 | 1.9% |
| Some other Race | 0 | 0.0% |
| Total | 161 | 100.0% |
Ancestry in Zap
The most populous ancestries reported in Zap are German (89 | 55.3%), Norwegian (31 | 19.3%), Chippewa (20 | 12.4%), British (8 | 5.0%), and Swedish (8 | 5.0%), together accounting for 96.9% of all Zap residents.
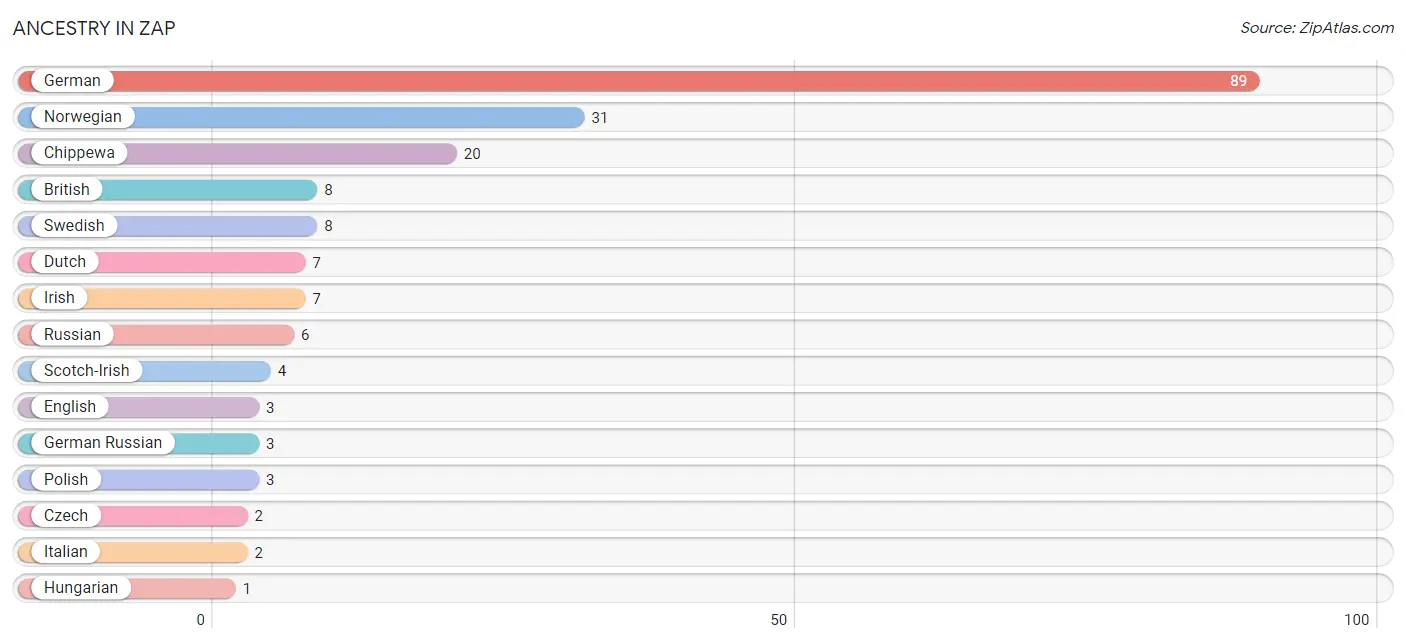
| Ancestry | # Population | % Population |
| British | 8 | 5.0% |
| Chippewa | 20 | 12.4% |
| Czech | 2 | 1.2% |
| Dutch | 7 | 4.3% |
| English | 3 | 1.9% |
| German | 89 | 55.3% |
| German Russian | 3 | 1.9% |
| Hungarian | 1 | 0.6% |
| Irish | 7 | 4.3% |
| Italian | 2 | 1.2% |
| Norwegian | 31 | 19.3% |
| Polish | 3 | 1.9% |
| Russian | 6 | 3.7% |
| Scotch-Irish | 4 | 2.5% |
| Swedish | 8 | 5.0% | View All 15 Rows |
Immigrants in Zap

| Immigration Origin | # Population | % Population | View All 0 Rows |
Sex and Age in Zap
Sex and Age in Zap
The most populous age groups in Zap are 60 to 64 Years (15 | 20.0%) for men and 5 to 9 Years (13 | 15.1%) for women.
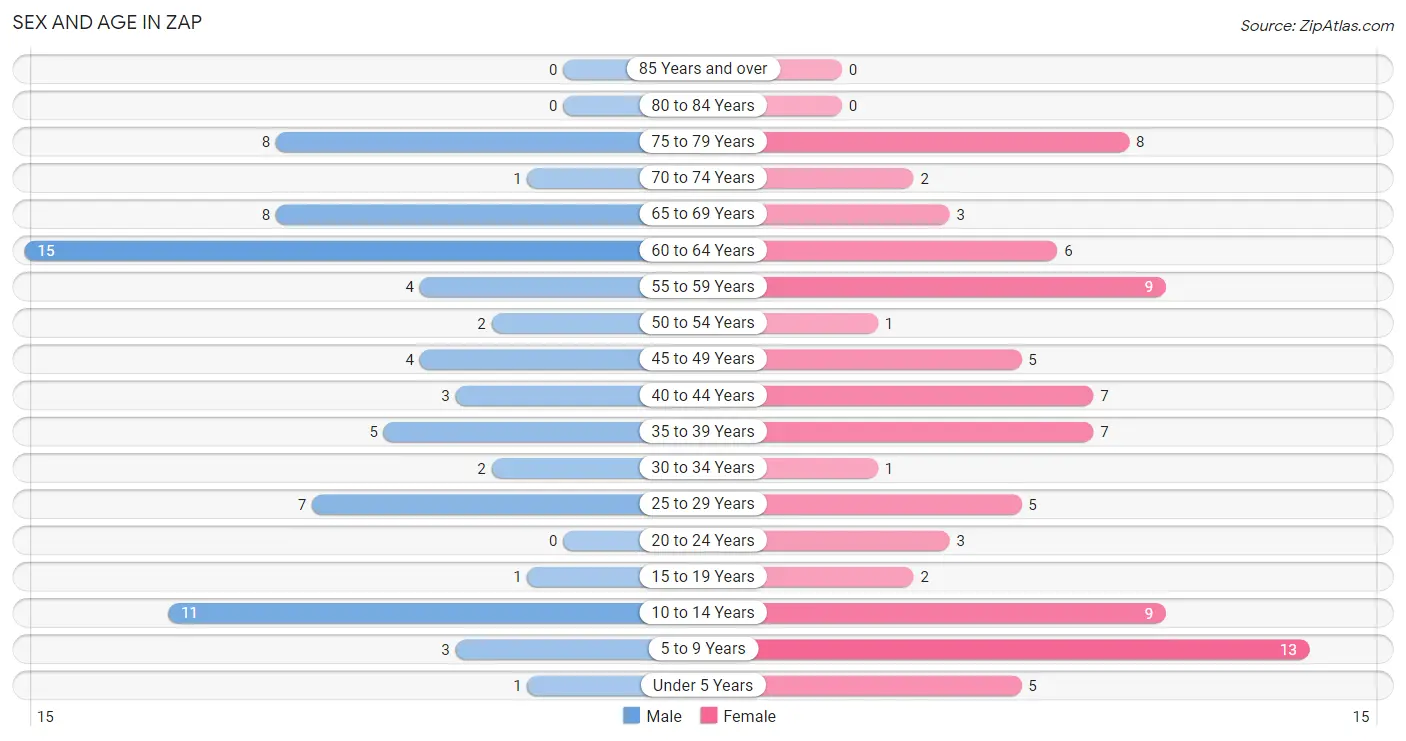
| Age Bracket | Male | Female |
| Under 5 Years | 1 (1.3%) | 5 (5.8%) |
| 5 to 9 Years | 3 (4.0%) | 13 (15.1%) |
| 10 to 14 Years | 11 (14.7%) | 9 (10.5%) |
| 15 to 19 Years | 1 (1.3%) | 2 (2.3%) |
| 20 to 24 Years | 0 (0.0%) | 3 (3.5%) |
| 25 to 29 Years | 7 (9.3%) | 5 (5.8%) |
| 30 to 34 Years | 2 (2.7%) | 1 (1.2%) |
| 35 to 39 Years | 5 (6.7%) | 7 (8.1%) |
| 40 to 44 Years | 3 (4.0%) | 7 (8.1%) |
| 45 to 49 Years | 4 (5.3%) | 5 (5.8%) |
| 50 to 54 Years | 2 (2.7%) | 1 (1.2%) |
| 55 to 59 Years | 4 (5.3%) | 9 (10.5%) |
| 60 to 64 Years | 15 (20.0%) | 6 (7.0%) |
| 65 to 69 Years | 8 (10.7%) | 3 (3.5%) |
| 70 to 74 Years | 1 (1.3%) | 2 (2.3%) |
| 75 to 79 Years | 8 (10.7%) | 8 (9.3%) |
| 80 to 84 Years | 0 (0.0%) | 0 (0.0%) |
| 85 Years and over | 0 (0.0%) | 0 (0.0%) |
| Total | 75 (100.0%) | 86 (100.0%) |
Families and Households in Zap
Median Family Size in Zap
The median family size in Zap is 2.93 persons per family, with single female/mother families (8 | 19.5%) accounting for the largest median family size of 3.13 persons per family. On the other hand, married-couple families (32 | 78.0%) represent the smallest median family size with 2.88 persons per family.
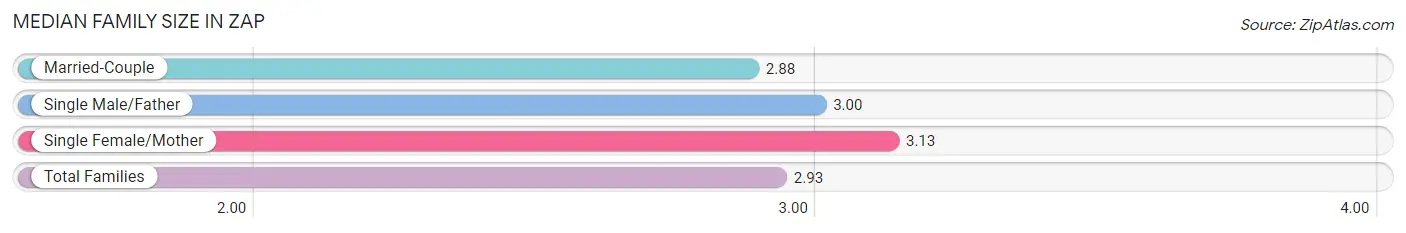
| Family Type | # Families | Family Size |
| Married-Couple | 32 (78.0%) | 2.88 |
| Single Male/Father | 1 (2.4%) | 3.00 |
| Single Female/Mother | 8 (19.5%) | 3.13 |
| Total Families | 41 (100.0%) | 2.93 |
Median Household Size in Zap
The median household size in Zap is 2.24 persons per household, with single female/mother households (8 | 11.1%) accounting for the largest median household size of 3.63 persons per household. non-family households (31 | 43.1%) represent the smallest median household size with 1.19 persons per household.
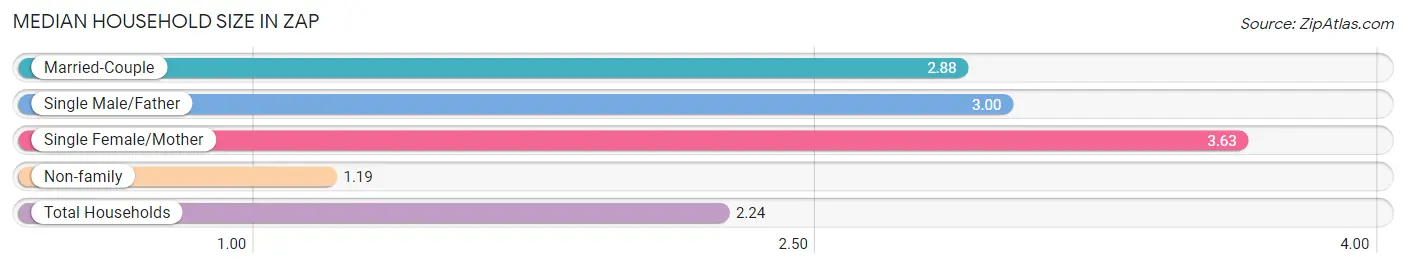
| Household Type | # Households | Household Size |
| Married-Couple | 32 (44.4%) | 2.88 |
| Single Male/Father | 1 (1.4%) | 3.00 |
| Single Female/Mother | 8 (11.1%) | 3.63 |
| Non-family | 31 (43.1%) | 1.19 |
| Total Households | 72 (100.0%) | 2.24 |
Household Size by Marriage Status in Zap
Out of a total of 72 households in Zap, 41 (56.9%) are family households, while 31 (43.1%) are nonfamily households. The most numerous type of family households are 2-person households, comprising 26, and the most common type of nonfamily households are 1-person households, comprising 26.
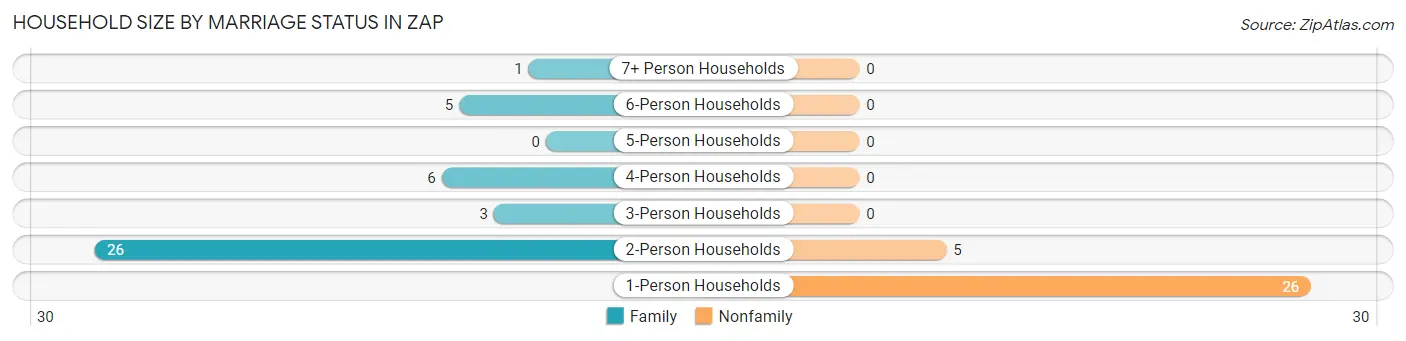
| Household Size | Family Households | Nonfamily Households |
| 1-Person Households | - | 26 (36.1%) |
| 2-Person Households | 26 (36.1%) | 5 (6.9%) |
| 3-Person Households | 3 (4.2%) | 0 (0.0%) |
| 4-Person Households | 6 (8.3%) | 0 (0.0%) |
| 5-Person Households | 0 (0.0%) | 0 (0.0%) |
| 6-Person Households | 5 (6.9%) | 0 (0.0%) |
| 7+ Person Households | 1 (1.4%) | 0 (0.0%) |
| Total | 41 (56.9%) | 31 (43.1%) |
Female Fertility in Zap
Fertility by Age in Zap
| Age Bracket | Women with Births | Births / 1,000 Women |
| 15 to 19 years | 0 (0.0%) | 0.0 |
| 20 to 34 years | 0 (0.0%) | 0.0 |
| 35 to 50 years | 0 (0.0%) | 0.0 |
| Total | 0 (0.0%) | 0.0 |
Fertility by Age by Marriage Status in Zap
| Age Bracket | Married | Unmarried |
| 15 to 19 years | 0 (0.0%) | 0 (0.0%) |
| 20 to 34 years | 0 (0.0%) | 0 (0.0%) |
| 35 to 50 years | 0 (0.0%) | 0 (0.0%) |
| Total | 0 (0.0%) | 0 (0.0%) |
Fertility by Education in Zap
| Educational Attainment | Women with Births | Births / 1,000 Women |
| Less than High School | 0 (0.0%) | 0.0 |
| High School Diploma | 0 (0.0%) | 0.0 |
| College or Associate's Degree | 0 (0.0%) | 0.0 |
| Bachelor's Degree | 0 (0.0%) | 0.0 |
| Graduate Degree | 0 (0.0%) | 0.0 |
| Total | 0 (0.0%) | 0.0 |
Fertility by Education by Marriage Status in Zap
| Educational Attainment | Married | Unmarried |
| Less than High School | 0 (0.0%) | 0 (0.0%) |
| High School Diploma | 0 (0.0%) | 0 (0.0%) |
| College or Associate's Degree | 0 (0.0%) | 0 (0.0%) |
| Bachelor's Degree | 0 (0.0%) | 0 (0.0%) |
| Graduate Degree | 0 (0.0%) | 0 (0.0%) |
| Total | 0 (0.0%) | 0 (0.0%) |
Employment Characteristics in Zap
Employment by Class of Employer in Zap
Among the 61 employed individuals in Zap, private company employees (38 | 62.3%), state government employees (13 | 21.3%), and local government employees (4 | 6.6%) make up the most common classes of employment.
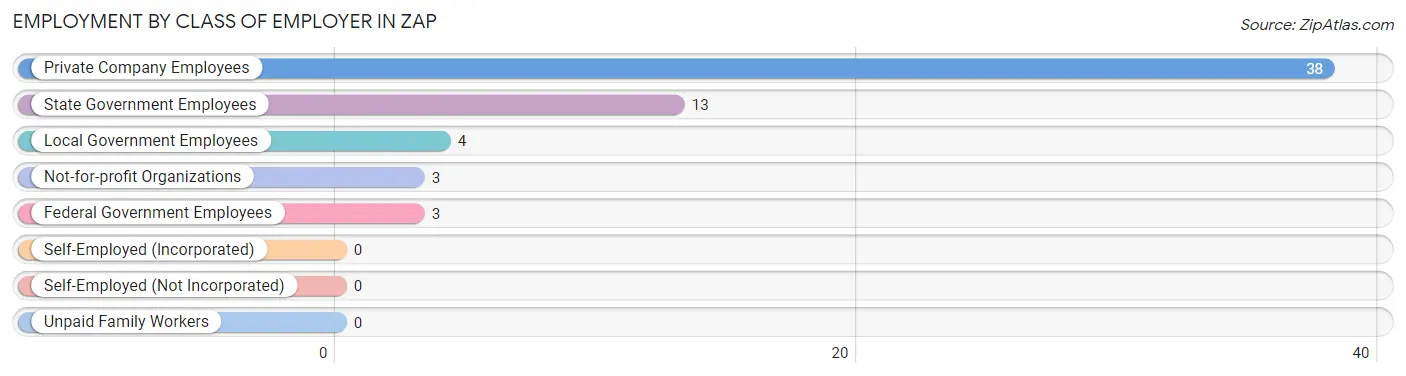
| Employer Class | # Employees | % Employees |
| Private Company Employees | 38 | 62.3% |
| Self-Employed (Incorporated) | 0 | 0.0% |
| Self-Employed (Not Incorporated) | 0 | 0.0% |
| Not-for-profit Organizations | 3 | 4.9% |
| Local Government Employees | 4 | 6.6% |
| State Government Employees | 13 | 21.3% |
| Federal Government Employees | 3 | 4.9% |
| Unpaid Family Workers | 0 | 0.0% |
| Total | 61 | 100.0% |
Employment Status by Age in Zap
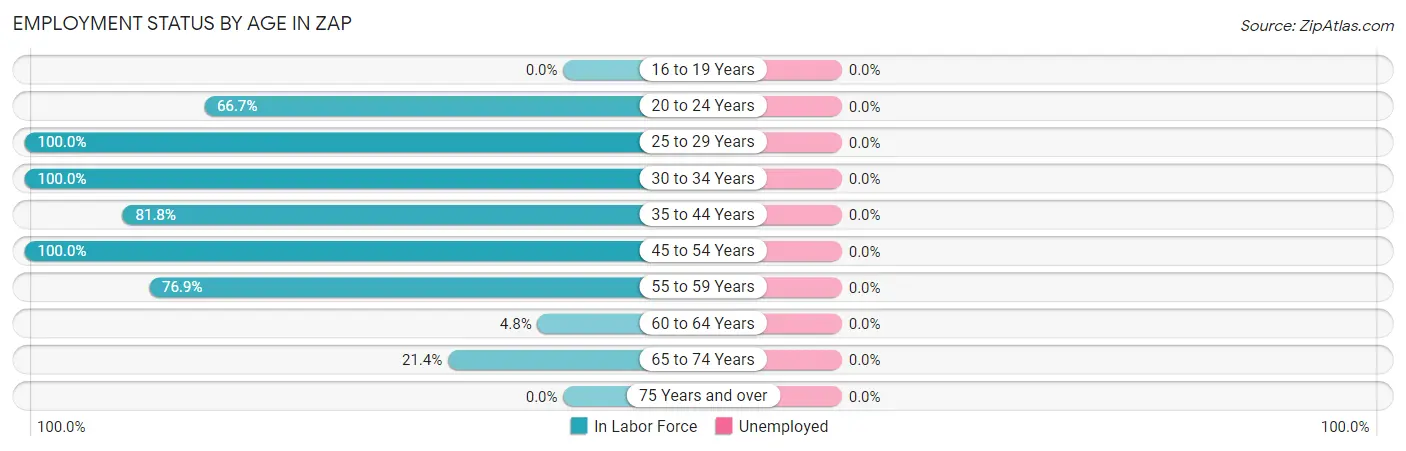
| Age Bracket | In Labor Force | Unemployed |
| 16 to 19 Years | 0 (0.0%) | 0 (0.0%) |
| 20 to 24 Years | 2 (66.7%) | 0 (0.0%) |
| 25 to 29 Years | 12 (100.0%) | 0 (0.0%) |
| 30 to 34 Years | 3 (100.0%) | 0 (0.0%) |
| 35 to 44 Years | 18 (81.8%) | 0 (0.0%) |
| 45 to 54 Years | 12 (100.0%) | 0 (0.0%) |
| 55 to 59 Years | 10 (76.9%) | 0 (0.0%) |
| 60 to 64 Years | 1 (4.8%) | 0 (0.0%) |
| 65 to 74 Years | 3 (21.4%) | 0 (0.0%) |
| 75 Years and over | 0 (0.0%) | 0 (0.0%) |
| Total | 61 (52.6%) | 0 (0.0%) |
Employment Status by Educational Attainment in Zap
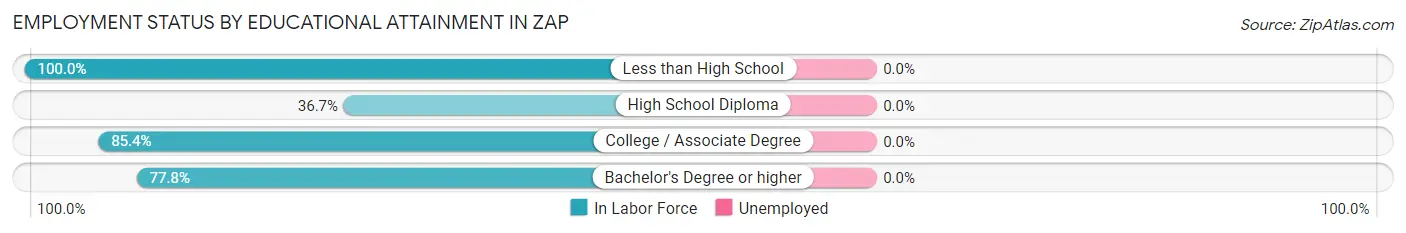
| Educational Attainment | In Labor Force | Unemployed |
| Less than High School | 3 (100.0%) | 0 (0.0%) |
| High School Diploma | 11 (36.7%) | 0 (0.0%) |
| College / Associate Degree | 35 (85.4%) | 0 (0.0%) |
| Bachelor's Degree or higher | 7 (77.8%) | 0 (0.0%) |
| Total | 56 (67.5%) | 0 (0.0%) |
Employment Occupations by Sex in Zap
Management, Business, Science and Arts Occupations
The most common Management, Business, Science and Arts occupations in Zap are Community & Social Service (9 | 14.7%), Education Instruction & Library (9 | 14.7%), Business & Financial (3 | 4.9%), Computers, Engineering & Science (1 | 1.6%), and Architecture & Engineering (1 | 1.6%).
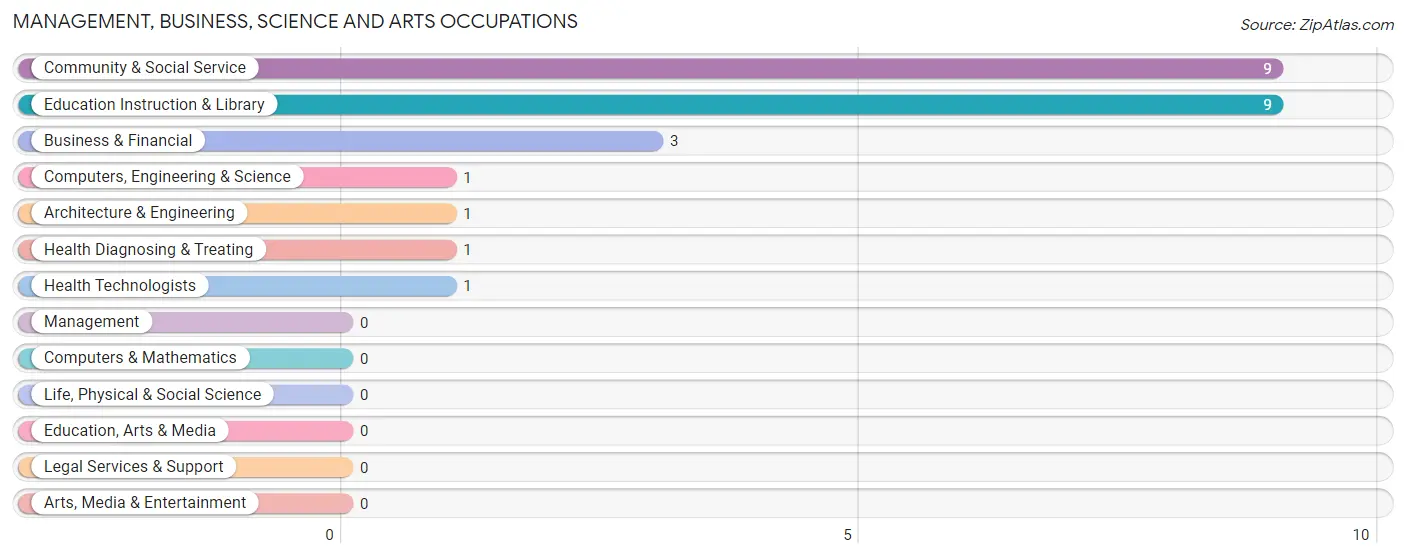
Management, Business, Science and Arts Occupations by Sex
Within the Management, Business, Science and Arts occupations in Zap, the most male-oriented occupations are Computers, Engineering & Science (100.0%), and Architecture & Engineering (100.0%), while the most female-oriented occupations are Business & Financial (100.0%), Community & Social Service (100.0%), and Education Instruction & Library (100.0%).
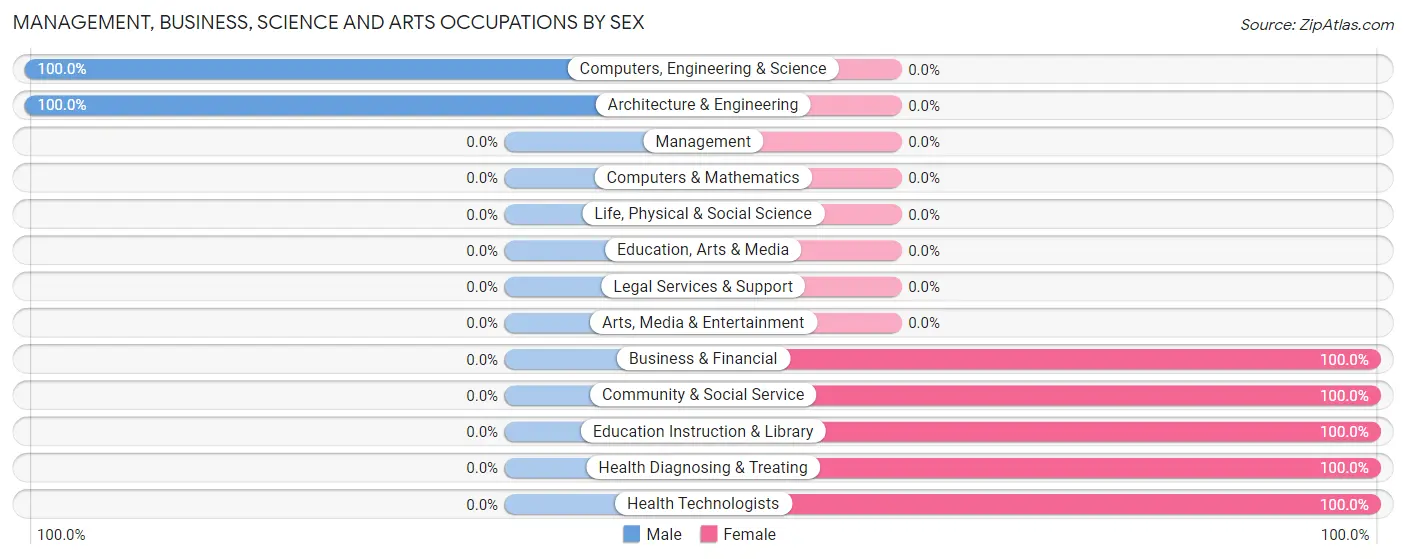
| Occupation | Male | Female |
| Management | 0 (0.0%) | 0 (0.0%) |
| Business & Financial | 0 (0.0%) | 3 (100.0%) |
| Computers, Engineering & Science | 1 (100.0%) | 0 (0.0%) |
| Computers & Mathematics | 0 (0.0%) | 0 (0.0%) |
| Architecture & Engineering | 1 (100.0%) | 0 (0.0%) |
| Life, Physical & Social Science | 0 (0.0%) | 0 (0.0%) |
| Community & Social Service | 0 (0.0%) | 9 (100.0%) |
| Education, Arts & Media | 0 (0.0%) | 0 (0.0%) |
| Legal Services & Support | 0 (0.0%) | 0 (0.0%) |
| Education Instruction & Library | 0 (0.0%) | 9 (100.0%) |
| Arts, Media & Entertainment | 0 (0.0%) | 0 (0.0%) |
| Health Diagnosing & Treating | 0 (0.0%) | 1 (100.0%) |
| Health Technologists | 0 (0.0%) | 1 (100.0%) |
| Total (Category) | 1 (7.1%) | 13 (92.9%) |
| Total (Overall) | 27 (44.3%) | 34 (55.7%) |
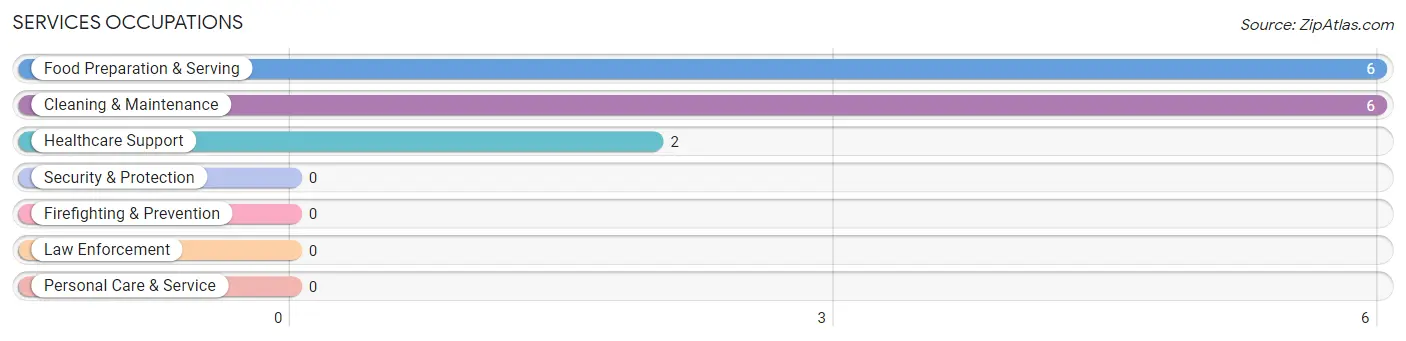
Services Occupations
The most common Services occupations in Zap are Food Preparation & Serving (6 | 9.8%), Cleaning & Maintenance (6 | 9.8%), and Healthcare Support (2 | 3.3%).
Services Occupations by Sex
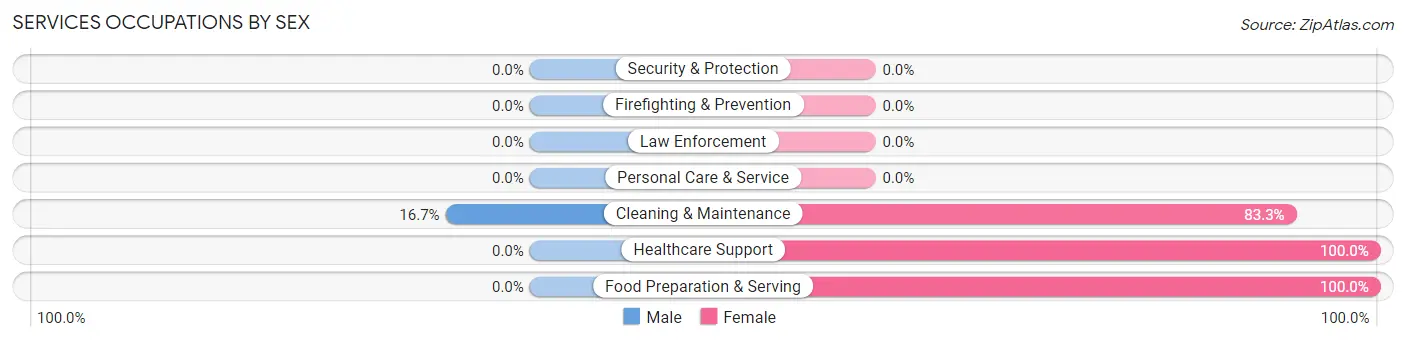
| Occupation | Male | Female |
| Healthcare Support | 0 (0.0%) | 2 (100.0%) |
| Security & Protection | 0 (0.0%) | 0 (0.0%) |
| Firefighting & Prevention | 0 (0.0%) | 0 (0.0%) |
| Law Enforcement | 0 (0.0%) | 0 (0.0%) |
| Food Preparation & Serving | 0 (0.0%) | 6 (100.0%) |
| Cleaning & Maintenance | 1 (16.7%) | 5 (83.3%) |
| Personal Care & Service | 0 (0.0%) | 0 (0.0%) |
| Total (Category) | 1 (7.1%) | 13 (92.9%) |
| Total (Overall) | 27 (44.3%) | 34 (55.7%) |
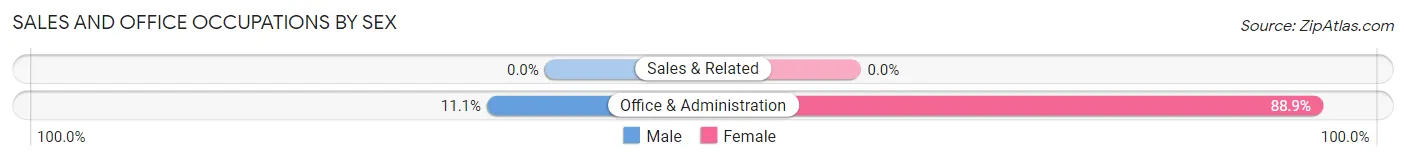
Sales and Office Occupations
The most common Sales and Office occupations in Zap are , and Office & Administration (9 | 14.7%).
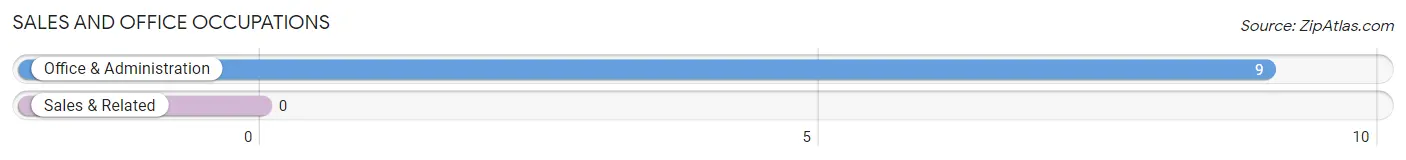
Sales and Office Occupations by Sex
| Occupation | Male | Female |
| Sales & Related | 0 (0.0%) | 0 (0.0%) |
| Office & Administration | 1 (11.1%) | 8 (88.9%) |
| Total (Category) | 1 (11.1%) | 8 (88.9%) |
| Total (Overall) | 27 (44.3%) | 34 (55.7%) |
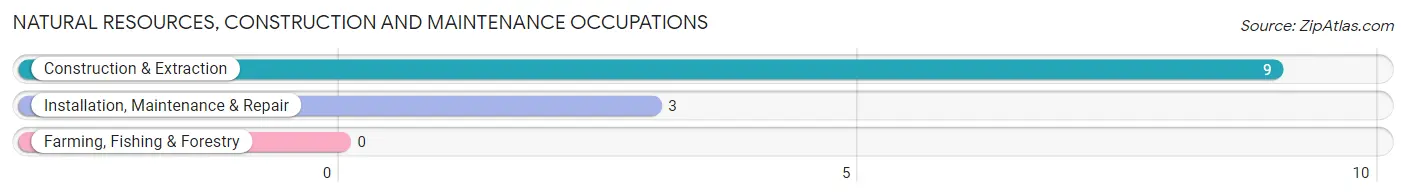
Natural Resources, Construction and Maintenance Occupations
The most common Natural Resources, Construction and Maintenance occupations in Zap are Construction & Extraction (9 | 14.7%), and Installation, Maintenance & Repair (3 | 4.9%).
Natural Resources, Construction and Maintenance Occupations by Sex
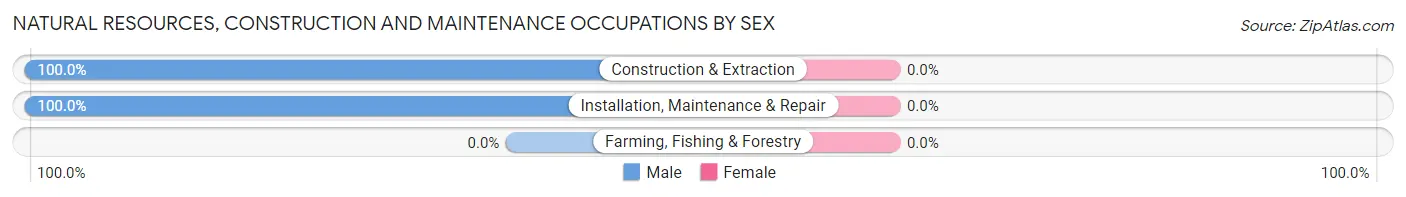
| Occupation | Male | Female |
| Farming, Fishing & Forestry | 0 (0.0%) | 0 (0.0%) |
| Construction & Extraction | 9 (100.0%) | 0 (0.0%) |
| Installation, Maintenance & Repair | 3 (100.0%) | 0 (0.0%) |
| Total (Category) | 12 (100.0%) | 0 (0.0%) |
| Total (Overall) | 27 (44.3%) | 34 (55.7%) |
Production, Transportation and Moving Occupations
The most common Production, Transportation and Moving occupations in Zap are Production (8 | 13.1%), Material Moving (3 | 4.9%), and Transportation (1 | 1.6%).
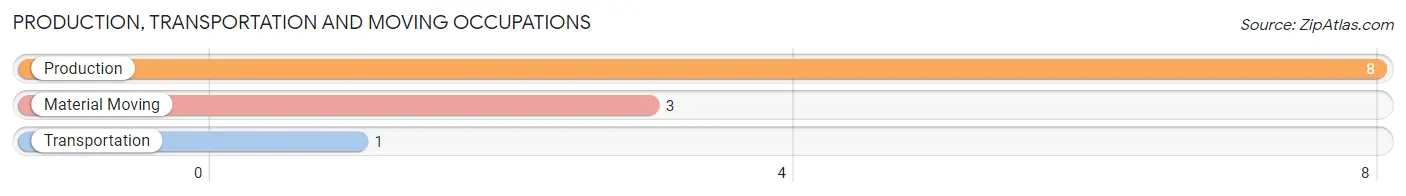
Production, Transportation and Moving Occupations by Sex
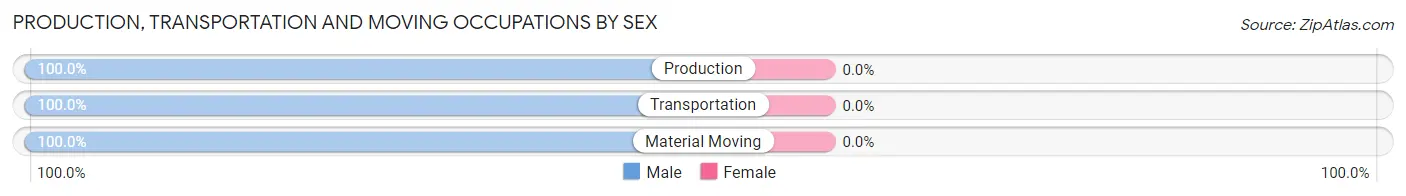
| Occupation | Male | Female |
| Production | 8 (100.0%) | 0 (0.0%) |
| Transportation | 1 (100.0%) | 0 (0.0%) |
| Material Moving | 3 (100.0%) | 0 (0.0%) |
| Total (Category) | 12 (100.0%) | 0 (0.0%) |
| Total (Overall) | 27 (44.3%) | 34 (55.7%) |
Employment Industries by Sex in Zap
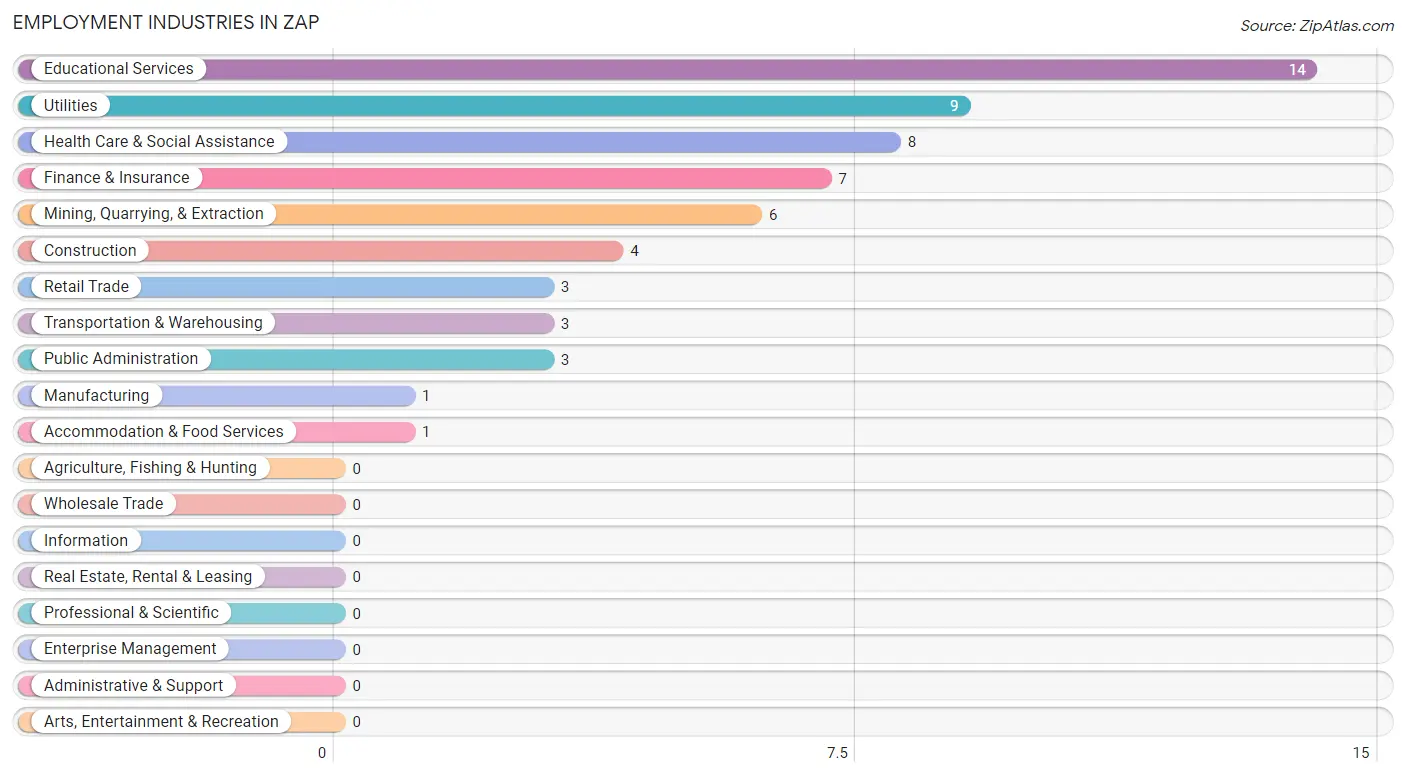
Employment Industries in Zap
The major employment industries in Zap include Educational Services (14 | 23.0%), Utilities (9 | 14.7%), Health Care & Social Assistance (8 | 13.1%), Finance & Insurance (7 | 11.5%), and Mining, Quarrying, & Extraction (6 | 9.8%).
Employment Industries by Sex in Zap
The Zap industries that see more men than women are Mining, Quarrying, & Extraction (100.0%), Construction (100.0%), and Manufacturing (100.0%), whereas the industries that tend to have a higher number of women are Finance & Insurance (100.0%), Educational Services (100.0%), and Health Care & Social Assistance (100.0%).
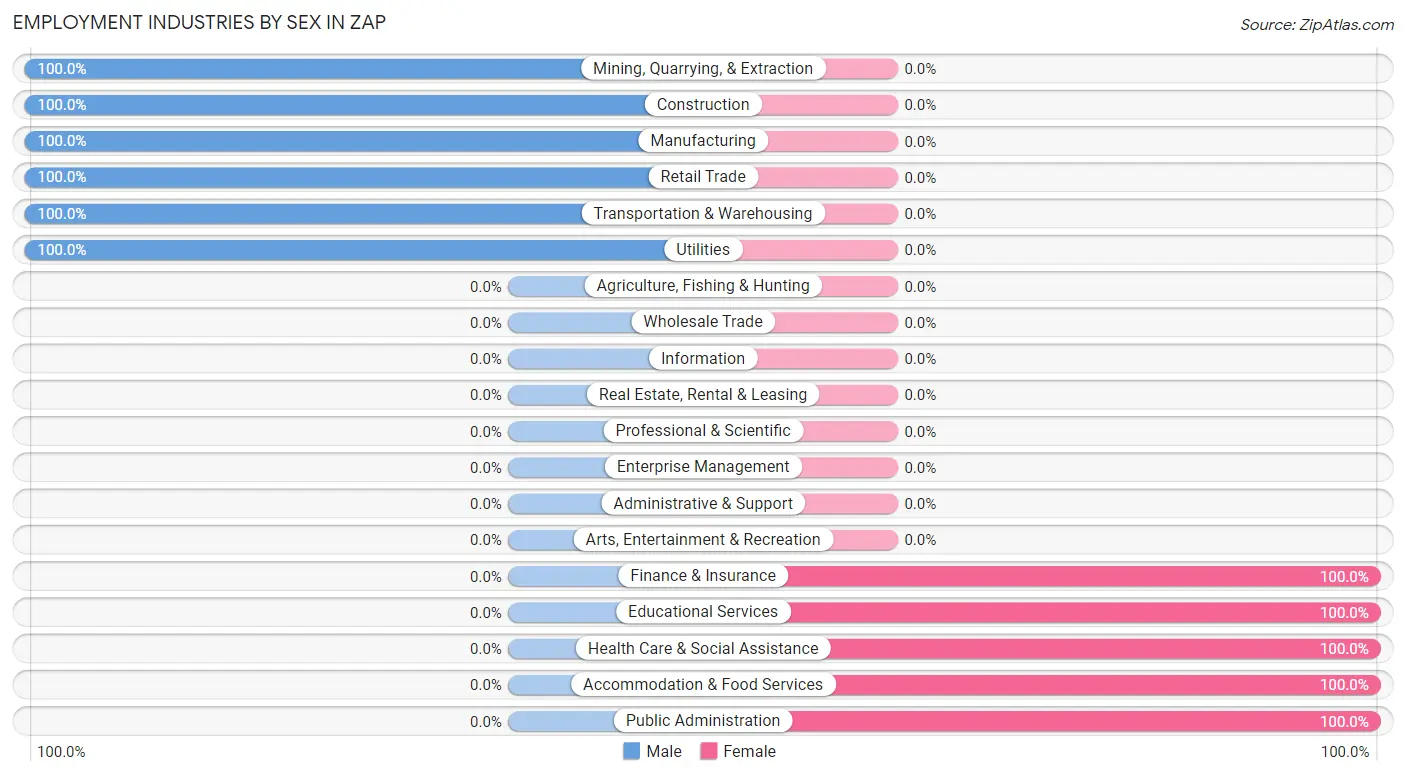
| Industry | Male | Female |
| Agriculture, Fishing & Hunting | 0 (0.0%) | 0 (0.0%) |
| Mining, Quarrying, & Extraction | 6 (100.0%) | 0 (0.0%) |
| Construction | 4 (100.0%) | 0 (0.0%) |
| Manufacturing | 1 (100.0%) | 0 (0.0%) |
| Wholesale Trade | 0 (0.0%) | 0 (0.0%) |
| Retail Trade | 3 (100.0%) | 0 (0.0%) |
| Transportation & Warehousing | 3 (100.0%) | 0 (0.0%) |
| Utilities | 9 (100.0%) | 0 (0.0%) |
| Information | 0 (0.0%) | 0 (0.0%) |
| Finance & Insurance | 0 (0.0%) | 7 (100.0%) |
| Real Estate, Rental & Leasing | 0 (0.0%) | 0 (0.0%) |
| Professional & Scientific | 0 (0.0%) | 0 (0.0%) |
| Enterprise Management | 0 (0.0%) | 0 (0.0%) |
| Administrative & Support | 0 (0.0%) | 0 (0.0%) |
| Educational Services | 0 (0.0%) | 14 (100.0%) |
| Health Care & Social Assistance | 0 (0.0%) | 8 (100.0%) |
| Arts, Entertainment & Recreation | 0 (0.0%) | 0 (0.0%) |
| Accommodation & Food Services | 0 (0.0%) | 1 (100.0%) |
| Public Administration | 0 (0.0%) | 3 (100.0%) |
| Total | 27 (44.3%) | 34 (55.7%) |
Education in Zap
School Enrollment in Zap
The most common levels of schooling among the 42 students in Zap are middle school (18 | 42.9%), elementary school (11 | 26.2%), and nursery / preschool (5 | 11.9%).
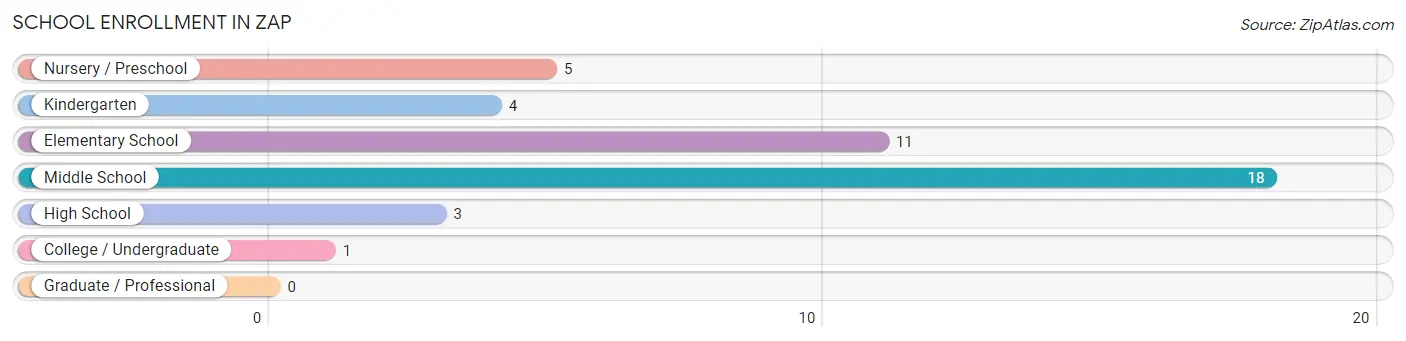
| School Level | # Students | % Students |
| Nursery / Preschool | 5 | 11.9% |
| Kindergarten | 4 | 9.5% |
| Elementary School | 11 | 26.2% |
| Middle School | 18 | 42.9% |
| High School | 3 | 7.1% |
| College / Undergraduate | 1 | 2.4% |
| Graduate / Professional | 0 | 0.0% |
| Total | 42 | 100.0% |
School Enrollment by Age by Funding Source in Zap
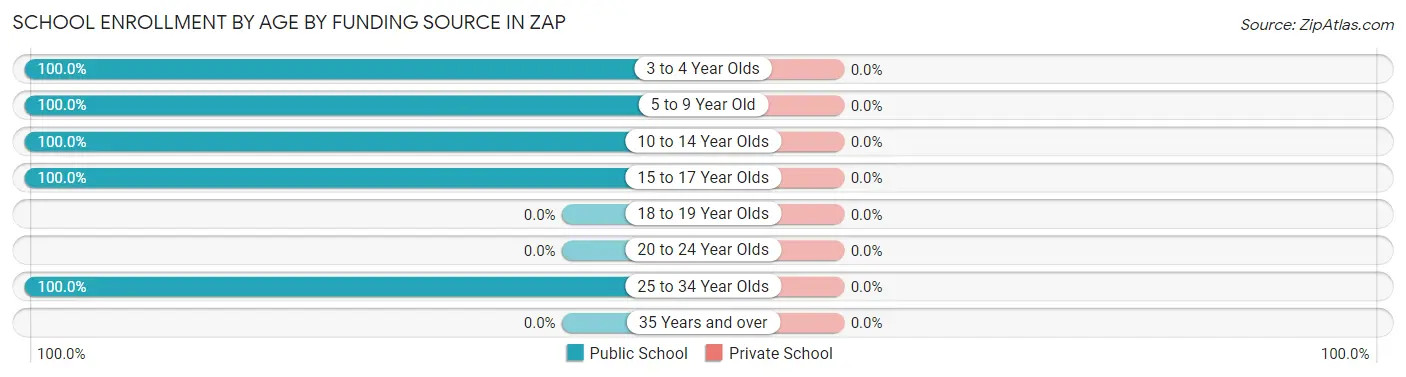
| Age Bracket | Public School | Private School |
| 3 to 4 Year Olds | 5 (100.0%) | 0 (0.0%) |
| 5 to 9 Year Old | 13 (100.0%) | 0 (0.0%) |
| 10 to 14 Year Olds | 20 (100.0%) | 0 (0.0%) |
| 15 to 17 Year Olds | 3 (100.0%) | 0 (0.0%) |
| 18 to 19 Year Olds | 0 (0.0%) | 0 (0.0%) |
| 20 to 24 Year Olds | 0 (0.0%) | 0 (0.0%) |
| 25 to 34 Year Olds | 1 (100.0%) | 0 (0.0%) |
| 35 Years and over | 0 (0.0%) | 0 (0.0%) |
| Total | 42 (100.0%) | 0 (0.0%) |
Educational Attainment by Field of Study in Zap
Bio, nature & agricultural (5 | 35.7%), education (3 | 21.4%), business (2 | 14.3%), engineering (1 | 7.1%), and literature & languages (1 | 7.1%) are the most common fields of study among 14 individuals in Zap who have obtained a bachelor's degree or higher.
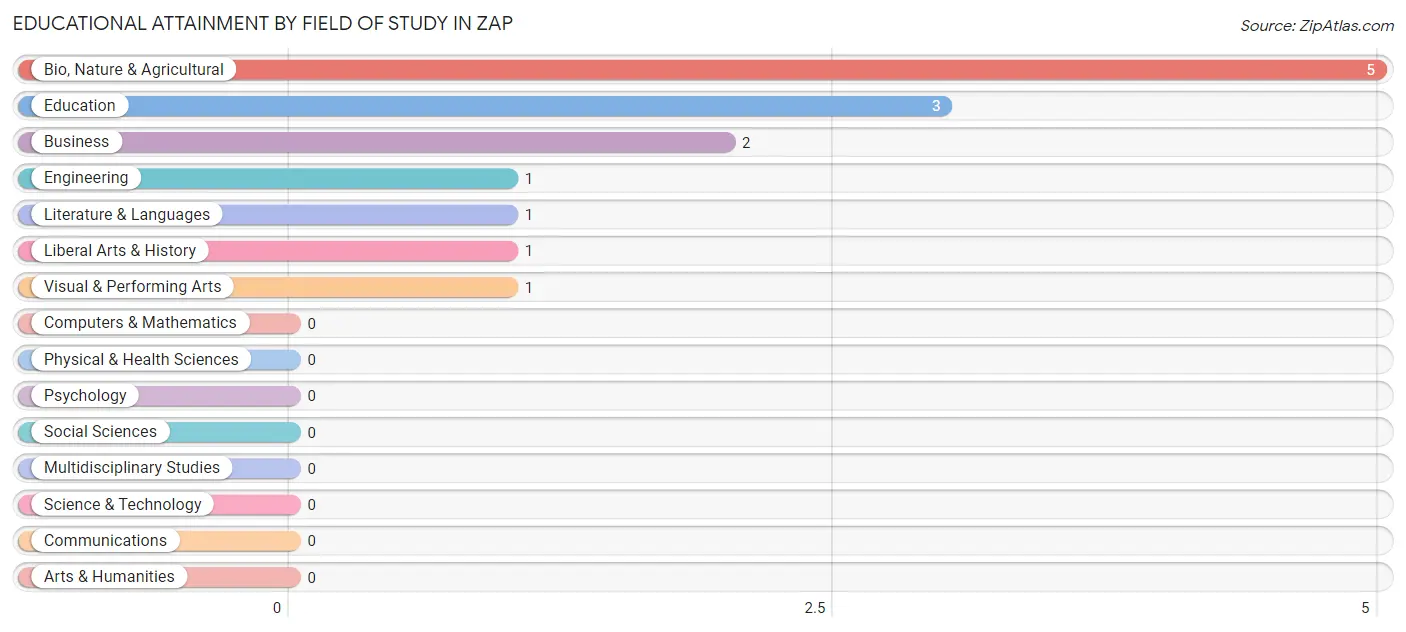
| Field of Study | # Graduates | % Graduates |
| Computers & Mathematics | 0 | 0.0% |
| Bio, Nature & Agricultural | 5 | 35.7% |
| Physical & Health Sciences | 0 | 0.0% |
| Psychology | 0 | 0.0% |
| Social Sciences | 0 | 0.0% |
| Engineering | 1 | 7.1% |
| Multidisciplinary Studies | 0 | 0.0% |
| Science & Technology | 0 | 0.0% |
| Business | 2 | 14.3% |
| Education | 3 | 21.4% |
| Literature & Languages | 1 | 7.1% |
| Liberal Arts & History | 1 | 7.1% |
| Visual & Performing Arts | 1 | 7.1% |
| Communications | 0 | 0.0% |
| Arts & Humanities | 0 | 0.0% |
| Total | 14 | 100.0% |
Transportation & Commute in Zap
Vehicle Availability by Sex in Zap
The most prevalent vehicle ownership categories in Zap are males with 3 vehicles (9, accounting for 33.3%) and females with 3 vehicles (10, making up 26.5%).
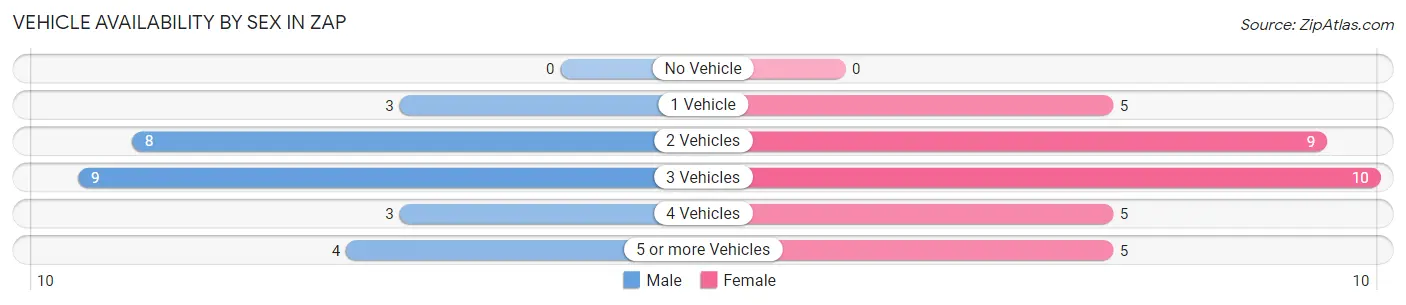
| Vehicles Available | Male | Female |
| No Vehicle | 0 (0.0%) | 0 (0.0%) |
| 1 Vehicle | 3 (11.1%) | 5 (14.7%) |
| 2 Vehicles | 8 (29.6%) | 9 (26.5%) |
| 3 Vehicles | 9 (33.3%) | 10 (29.4%) |
| 4 Vehicles | 3 (11.1%) | 5 (14.7%) |
| 5 or more Vehicles | 4 (14.8%) | 5 (14.7%) |
| Total | 27 (100.0%) | 34 (100.0%) |
Commute Time in Zap
The most frequently occuring commute durations in Zap are 15 to 19 minutes (24 commuters, 39.3%), 30 to 34 minutes (11 commuters, 18.0%), and 20 to 24 minutes (10 commuters, 16.4%).
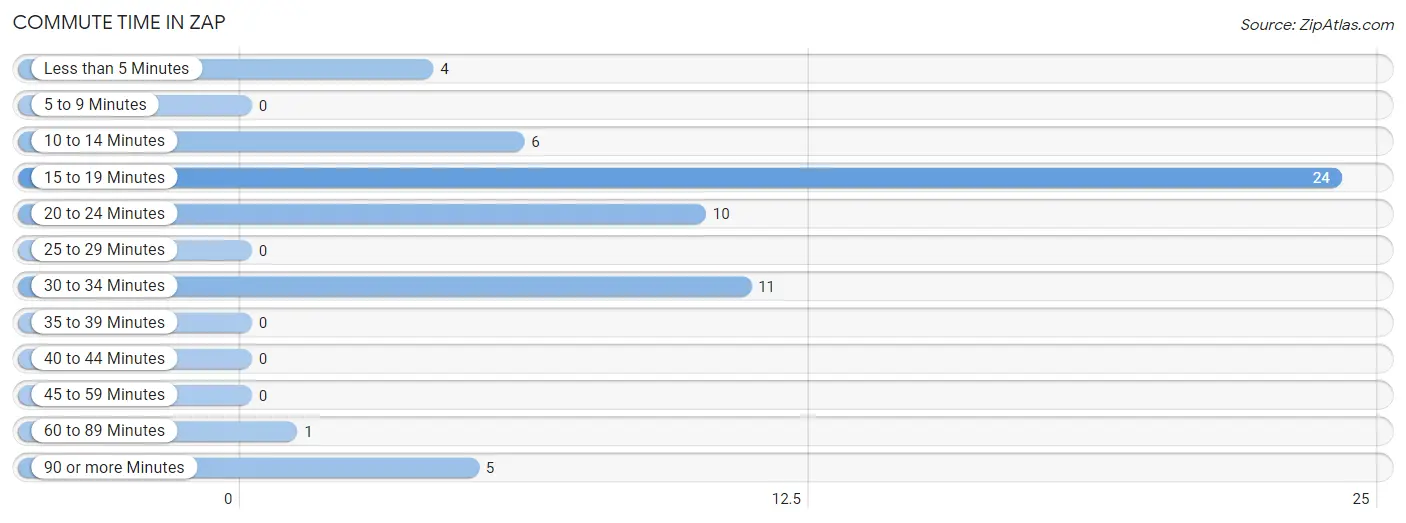
| Commute Time | # Commuters | % Commuters |
| Less than 5 Minutes | 4 | 6.6% |
| 5 to 9 Minutes | 0 | 0.0% |
| 10 to 14 Minutes | 6 | 9.8% |
| 15 to 19 Minutes | 24 | 39.3% |
| 20 to 24 Minutes | 10 | 16.4% |
| 25 to 29 Minutes | 0 | 0.0% |
| 30 to 34 Minutes | 11 | 18.0% |
| 35 to 39 Minutes | 0 | 0.0% |
| 40 to 44 Minutes | 0 | 0.0% |
| 45 to 59 Minutes | 0 | 0.0% |
| 60 to 89 Minutes | 1 | 1.6% |
| 90 or more Minutes | 5 | 8.2% |
Commute Time by Sex in Zap
The most common commute times in Zap are 20 to 24 minutes (8 commuters, 29.6%) for males and 15 to 19 minutes (17 commuters, 50.0%) for females.
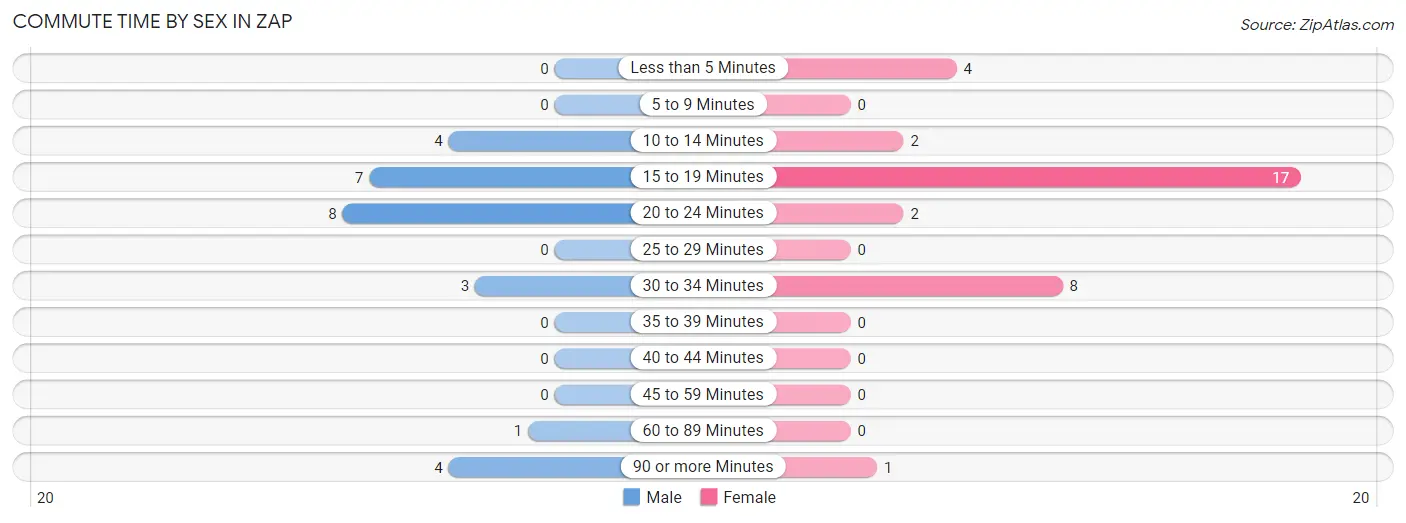
| Commute Time | Male | Female |
| Less than 5 Minutes | 0 (0.0%) | 4 (11.8%) |
| 5 to 9 Minutes | 0 (0.0%) | 0 (0.0%) |
| 10 to 14 Minutes | 4 (14.8%) | 2 (5.9%) |
| 15 to 19 Minutes | 7 (25.9%) | 17 (50.0%) |
| 20 to 24 Minutes | 8 (29.6%) | 2 (5.9%) |
| 25 to 29 Minutes | 0 (0.0%) | 0 (0.0%) |
| 30 to 34 Minutes | 3 (11.1%) | 8 (23.5%) |
| 35 to 39 Minutes | 0 (0.0%) | 0 (0.0%) |
| 40 to 44 Minutes | 0 (0.0%) | 0 (0.0%) |
| 45 to 59 Minutes | 0 (0.0%) | 0 (0.0%) |
| 60 to 89 Minutes | 1 (3.7%) | 0 (0.0%) |
| 90 or more Minutes | 4 (14.8%) | 1 (2.9%) |
Time of Departure to Work by Sex in Zap
The most frequent times of departure to work in Zap are 5:00 AM to 5:29 AM (6, 22.2%) for males and 7:30 AM to 7:59 AM (18, 52.9%) for females.
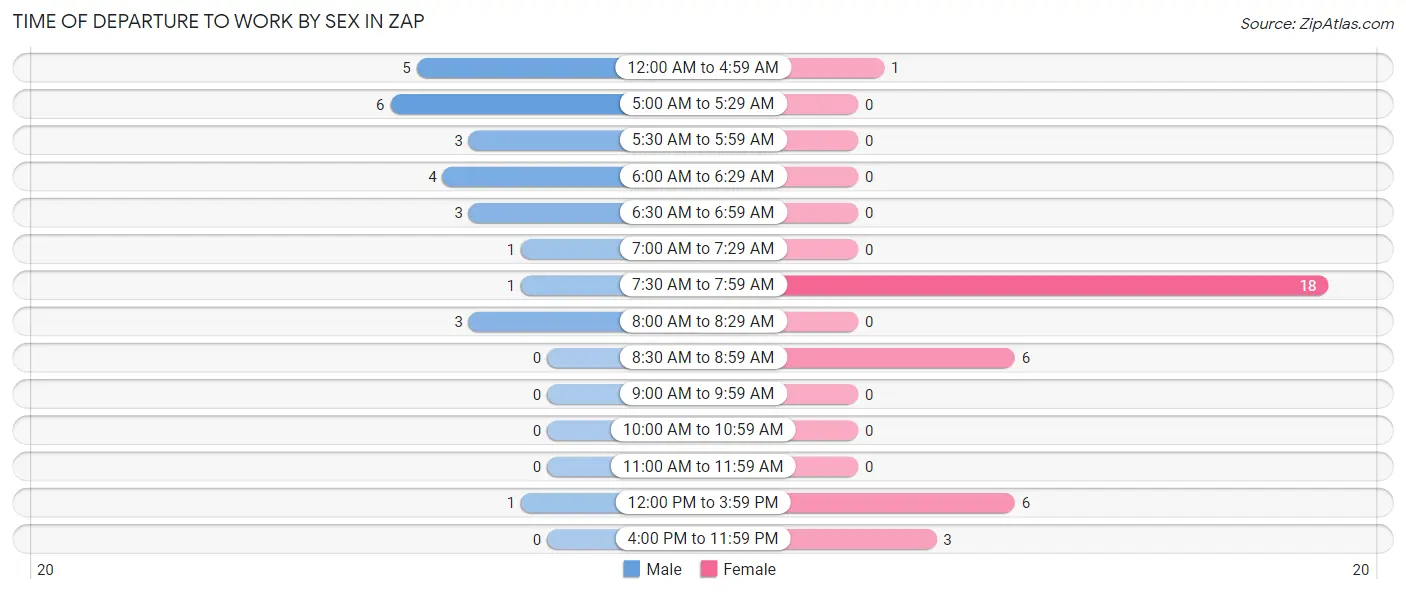
| Time of Departure | Male | Female |
| 12:00 AM to 4:59 AM | 5 (18.5%) | 1 (2.9%) |
| 5:00 AM to 5:29 AM | 6 (22.2%) | 0 (0.0%) |
| 5:30 AM to 5:59 AM | 3 (11.1%) | 0 (0.0%) |
| 6:00 AM to 6:29 AM | 4 (14.8%) | 0 (0.0%) |
| 6:30 AM to 6:59 AM | 3 (11.1%) | 0 (0.0%) |
| 7:00 AM to 7:29 AM | 1 (3.7%) | 0 (0.0%) |
| 7:30 AM to 7:59 AM | 1 (3.7%) | 18 (52.9%) |
| 8:00 AM to 8:29 AM | 3 (11.1%) | 0 (0.0%) |
| 8:30 AM to 8:59 AM | 0 (0.0%) | 6 (17.6%) |
| 9:00 AM to 9:59 AM | 0 (0.0%) | 0 (0.0%) |
| 10:00 AM to 10:59 AM | 0 (0.0%) | 0 (0.0%) |
| 11:00 AM to 11:59 AM | 0 (0.0%) | 0 (0.0%) |
| 12:00 PM to 3:59 PM | 1 (3.7%) | 6 (17.6%) |
| 4:00 PM to 11:59 PM | 0 (0.0%) | 3 (8.8%) |
| Total | 27 (100.0%) | 34 (100.0%) |
Housing Occupancy in Zap
Occupancy by Ownership in Zap
Of the total 72 dwellings in Zap, owner-occupied units account for 54 (75.0%), while renter-occupied units make up 18 (25.0%).
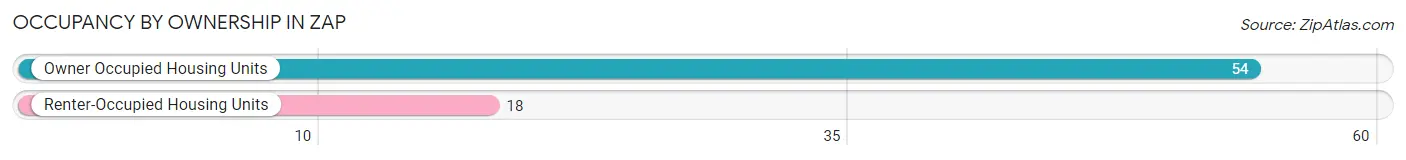
| Occupancy | # Housing Units | % Housing Units |
| Owner Occupied Housing Units | 54 | 75.0% |
| Renter-Occupied Housing Units | 18 | 25.0% |
| Total Occupied Housing Units | 72 | 100.0% |
Occupancy by Household Size in Zap
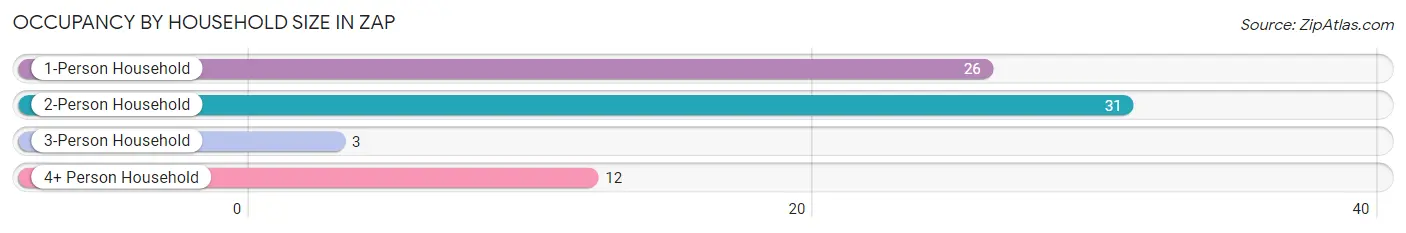
| Household Size | # Housing Units | % Housing Units |
| 1-Person Household | 26 | 36.1% |
| 2-Person Household | 31 | 43.1% |
| 3-Person Household | 3 | 4.2% |
| 4+ Person Household | 12 | 16.7% |
| Total Housing Units | 72 | 100.0% |
Occupancy by Ownership by Household Size in Zap
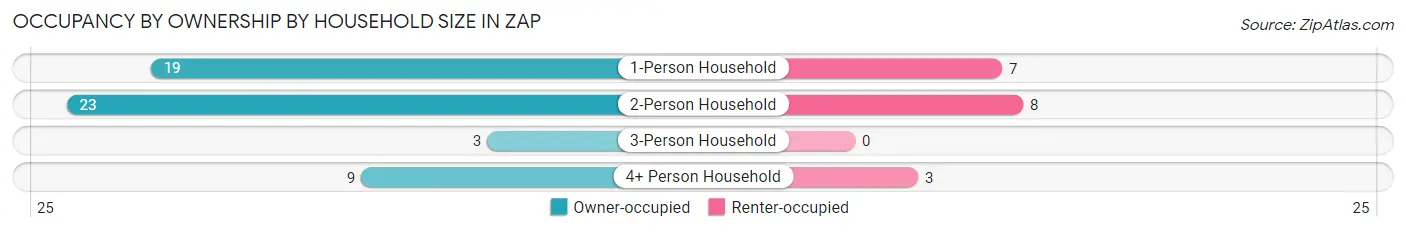
| Household Size | Owner-occupied | Renter-occupied |
| 1-Person Household | 19 (73.1%) | 7 (26.9%) |
| 2-Person Household | 23 (74.2%) | 8 (25.8%) |
| 3-Person Household | 3 (100.0%) | 0 (0.0%) |
| 4+ Person Household | 9 (75.0%) | 3 (25.0%) |
| Total Housing Units | 54 (75.0%) | 18 (25.0%) |
Occupancy by Educational Attainment in Zap
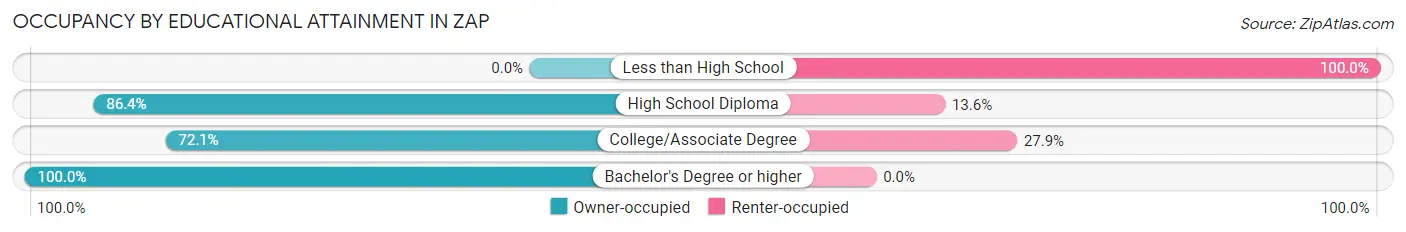
| Household Size | Owner-occupied | Renter-occupied |
| Less than High School | 0 (0.0%) | 3 (100.0%) |
| High School Diploma | 19 (86.4%) | 3 (13.6%) |
| College/Associate Degree | 31 (72.1%) | 12 (27.9%) |
| Bachelor's Degree or higher | 4 (100.0%) | 0 (0.0%) |
Occupancy by Age of Householder in Zap
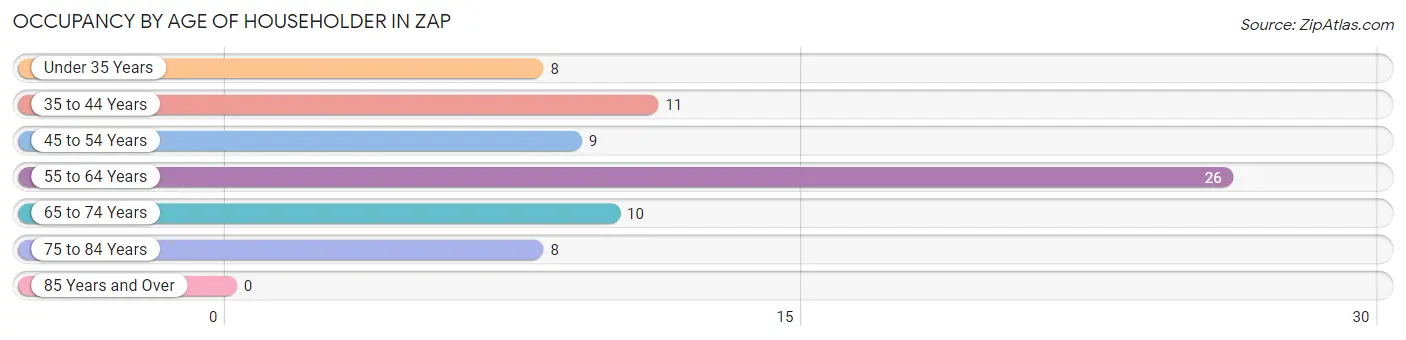
| Age Bracket | # Households | % Households |
| Under 35 Years | 8 | 11.1% |
| 35 to 44 Years | 11 | 15.3% |
| 45 to 54 Years | 9 | 12.5% |
| 55 to 64 Years | 26 | 36.1% |
| 65 to 74 Years | 10 | 13.9% |
| 75 to 84 Years | 8 | 11.1% |
| 85 Years and Over | 0 | 0.0% |
| Total | 72 | 100.0% |
Housing Finances in Zap
Median Income by Occupancy in Zap
| Occupancy Type | # Households | Median Income |
| Owner-Occupied | 54 (75.0%) | $0 |
| Renter-Occupied | 18 (25.0%) | $0 |
| Average | 72 (100.0%) | $0 |
Occupancy by Householder Income Bracket in Zap
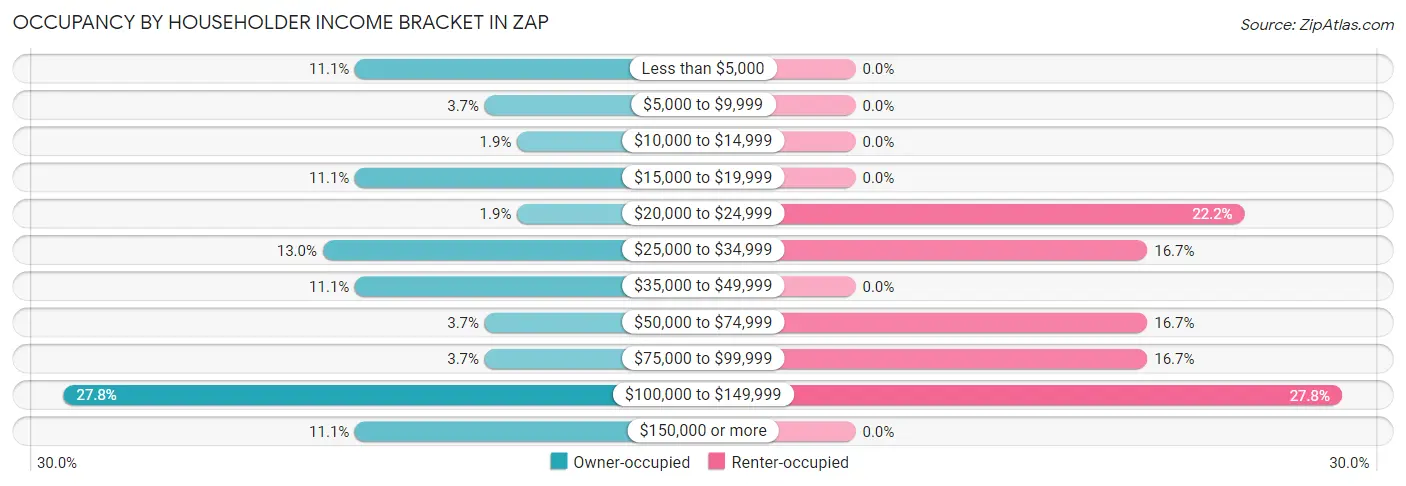
| Income Bracket | Owner-occupied | Renter-occupied |
| Less than $5,000 | 6 (11.1%) | 0 (0.0%) |
| $5,000 to $9,999 | 2 (3.7%) | 0 (0.0%) |
| $10,000 to $14,999 | 1 (1.8%) | 0 (0.0%) |
| $15,000 to $19,999 | 6 (11.1%) | 0 (0.0%) |
| $20,000 to $24,999 | 1 (1.8%) | 4 (22.2%) |
| $25,000 to $34,999 | 7 (13.0%) | 3 (16.7%) |
| $35,000 to $49,999 | 6 (11.1%) | 0 (0.0%) |
| $50,000 to $74,999 | 2 (3.7%) | 3 (16.7%) |
| $75,000 to $99,999 | 2 (3.7%) | 3 (16.7%) |
| $100,000 to $149,999 | 15 (27.8%) | 5 (27.8%) |
| $150,000 or more | 6 (11.1%) | 0 (0.0%) |
| Total | 54 (100.0%) | 18 (100.0%) |
Monthly Housing Cost Tiers in Zap
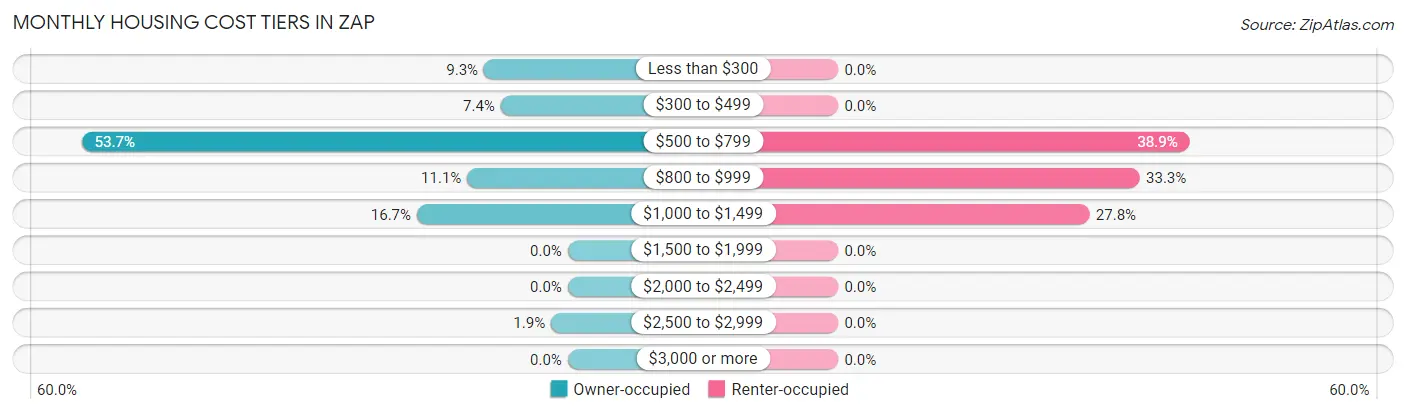
| Monthly Cost | Owner-occupied | Renter-occupied |
| Less than $300 | 5 (9.3%) | 0 (0.0%) |
| $300 to $499 | 4 (7.4%) | 0 (0.0%) |
| $500 to $799 | 29 (53.7%) | 7 (38.9%) |
| $800 to $999 | 6 (11.1%) | 6 (33.3%) |
| $1,000 to $1,499 | 9 (16.7%) | 5 (27.8%) |
| $1,500 to $1,999 | 0 (0.0%) | 0 (0.0%) |
| $2,000 to $2,499 | 0 (0.0%) | 0 (0.0%) |
| $2,500 to $2,999 | 1 (1.8%) | 0 (0.0%) |
| $3,000 or more | 0 (0.0%) | 0 (0.0%) |
| Total | 54 (100.0%) | 18 (100.0%) |
Physical Housing Characteristics in Zap
Housing Structures in Zap
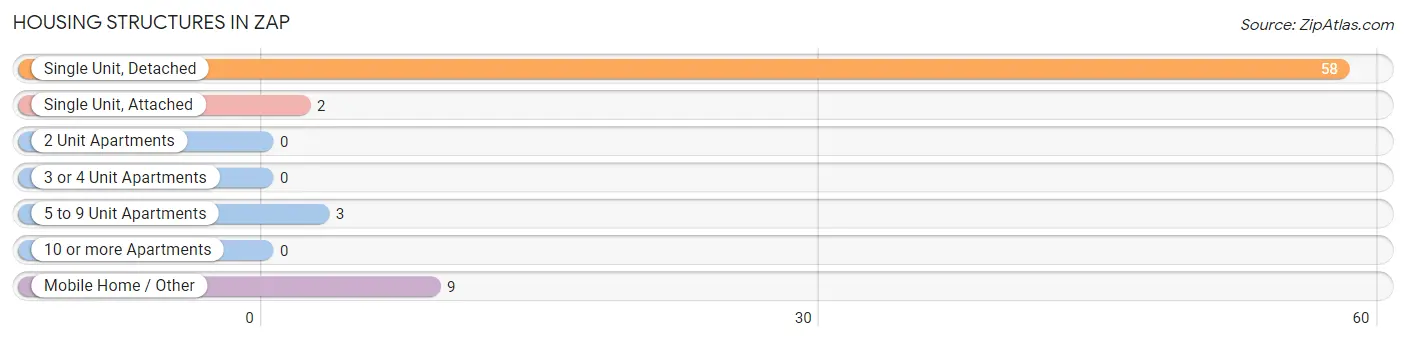
| Structure Type | # Housing Units | % Housing Units |
| Single Unit, Detached | 58 | 80.6% |
| Single Unit, Attached | 2 | 2.8% |
| 2 Unit Apartments | 0 | 0.0% |
| 3 or 4 Unit Apartments | 0 | 0.0% |
| 5 to 9 Unit Apartments | 3 | 4.2% |
| 10 or more Apartments | 0 | 0.0% |
| Mobile Home / Other | 9 | 12.5% |
| Total | 72 | 100.0% |
Housing Structures by Occupancy in Zap
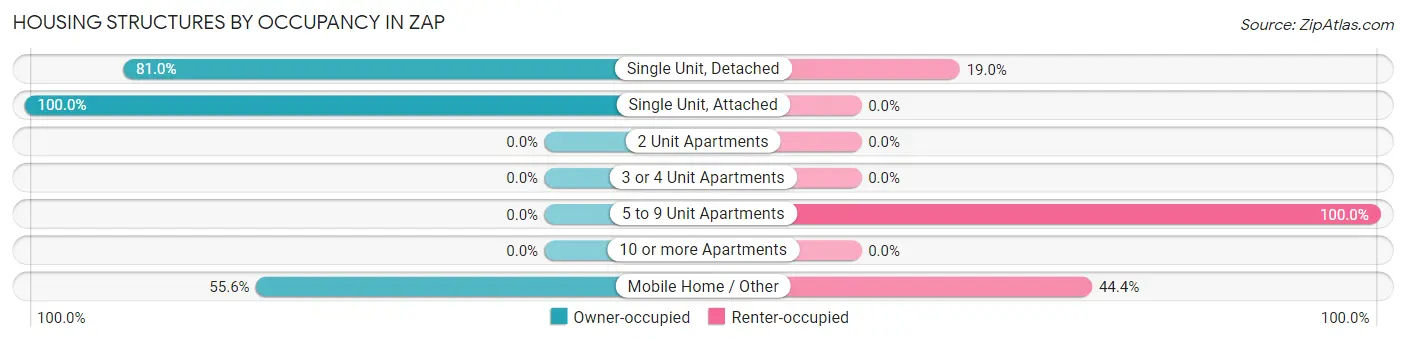
| Structure Type | Owner-occupied | Renter-occupied |
| Single Unit, Detached | 47 (81.0%) | 11 (19.0%) |
| Single Unit, Attached | 2 (100.0%) | 0 (0.0%) |
| 2 Unit Apartments | 0 (0.0%) | 0 (0.0%) |
| 3 or 4 Unit Apartments | 0 (0.0%) | 0 (0.0%) |
| 5 to 9 Unit Apartments | 0 (0.0%) | 3 (100.0%) |
| 10 or more Apartments | 0 (0.0%) | 0 (0.0%) |
| Mobile Home / Other | 5 (55.6%) | 4 (44.4%) |
| Total | 54 (75.0%) | 18 (25.0%) |
Housing Structures by Number of Rooms in Zap
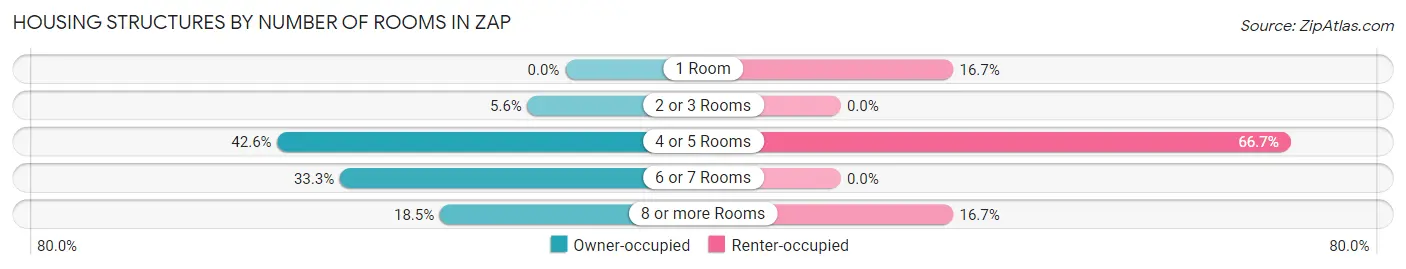
| Number of Rooms | Owner-occupied | Renter-occupied |
| 1 Room | 0 (0.0%) | 3 (16.7%) |
| 2 or 3 Rooms | 3 (5.6%) | 0 (0.0%) |
| 4 or 5 Rooms | 23 (42.6%) | 12 (66.7%) |
| 6 or 7 Rooms | 18 (33.3%) | 0 (0.0%) |
| 8 or more Rooms | 10 (18.5%) | 3 (16.7%) |
| Total | 54 (100.0%) | 18 (100.0%) |
Housing Structure by Heating Type in Zap
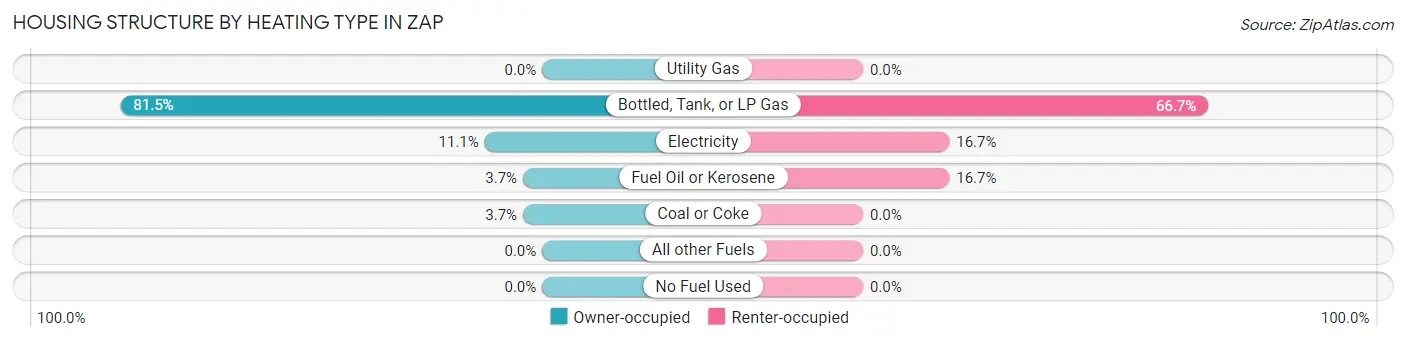
| Heating Type | Owner-occupied | Renter-occupied |
| Utility Gas | 0 (0.0%) | 0 (0.0%) |
| Bottled, Tank, or LP Gas | 44 (81.5%) | 12 (66.7%) |
| Electricity | 6 (11.1%) | 3 (16.7%) |
| Fuel Oil or Kerosene | 2 (3.7%) | 3 (16.7%) |
| Coal or Coke | 2 (3.7%) | 0 (0.0%) |
| All other Fuels | 0 (0.0%) | 0 (0.0%) |
| No Fuel Used | 0 (0.0%) | 0 (0.0%) |
| Total | 54 (100.0%) | 18 (100.0%) |
Household Vehicle Usage in Zap
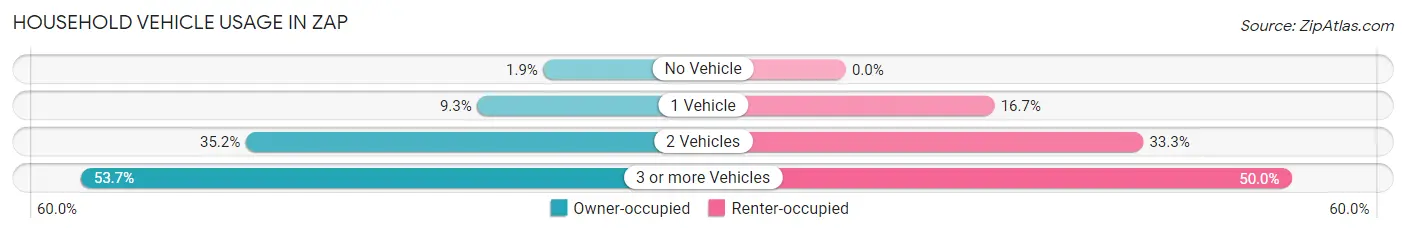
| Vehicles per Household | Owner-occupied | Renter-occupied |
| No Vehicle | 1 (1.8%) | 0 (0.0%) |
| 1 Vehicle | 5 (9.3%) | 3 (16.7%) |
| 2 Vehicles | 19 (35.2%) | 6 (33.3%) |
| 3 or more Vehicles | 29 (53.7%) | 9 (50.0%) |
| Total | 54 (100.0%) | 18 (100.0%) |
Real Estate & Mortgages in Zap
Real Estate and Mortgage Overview in Zap
| Characteristic | Without Mortgage | With Mortgage |
| Housing Units | 27 | 27 |
| Median Property Value | $85,000 | $99,000 |
| Median Household Income | $38,542 | $6 |
| Monthly Housing Costs | $532 | $0 |
| Real Estate Taxes | $1,125 | $1 |
Property Value by Mortgage Status in Zap
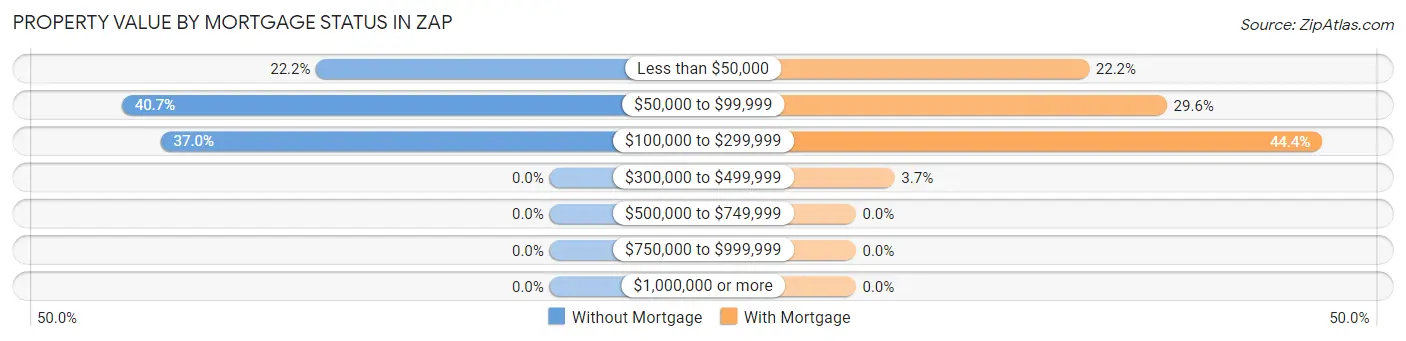
| Property Value | Without Mortgage | With Mortgage |
| Less than $50,000 | 6 (22.2%) | 6 (22.2%) |
| $50,000 to $99,999 | 11 (40.7%) | 8 (29.6%) |
| $100,000 to $299,999 | 10 (37.0%) | 12 (44.4%) |
| $300,000 to $499,999 | 0 (0.0%) | 1 (3.7%) |
| $500,000 to $749,999 | 0 (0.0%) | 0 (0.0%) |
| $750,000 to $999,999 | 0 (0.0%) | 0 (0.0%) |
| $1,000,000 or more | 0 (0.0%) | 0 (0.0%) |
| Total | 27 (100.0%) | 27 (100.0%) |
Household Income by Mortgage Status in Zap
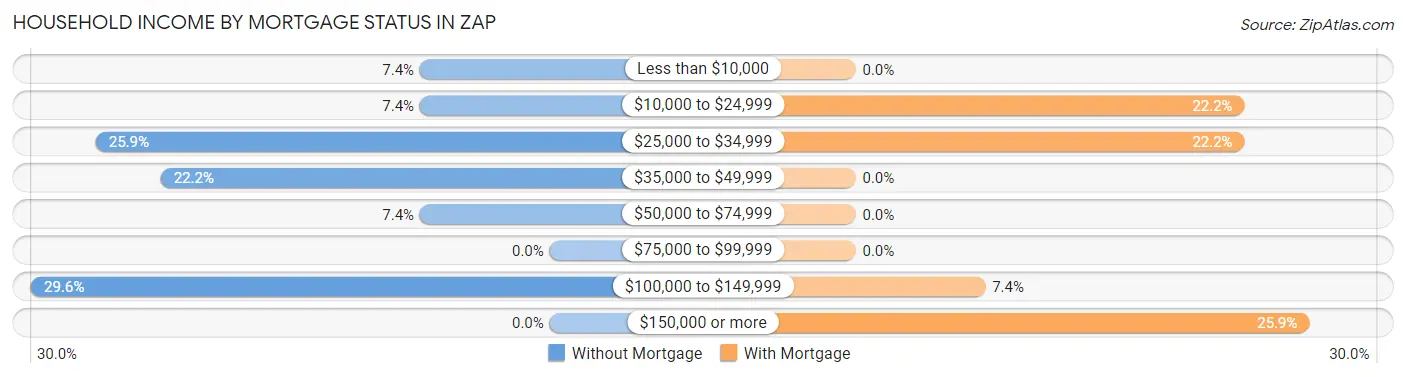
| Household Income | Without Mortgage | With Mortgage |
| Less than $10,000 | 2 (7.4%) | 0 (0.0%) |
| $10,000 to $24,999 | 2 (7.4%) | 6 (22.2%) |
| $25,000 to $34,999 | 7 (25.9%) | 6 (22.2%) |
| $35,000 to $49,999 | 6 (22.2%) | 0 (0.0%) |
| $50,000 to $74,999 | 2 (7.4%) | 0 (0.0%) |
| $75,000 to $99,999 | 0 (0.0%) | 0 (0.0%) |
| $100,000 to $149,999 | 8 (29.6%) | 2 (7.4%) |
| $150,000 or more | 0 (0.0%) | 7 (25.9%) |
| Total | 27 (100.0%) | 27 (100.0%) |
Property Value to Household Income Ratio in Zap
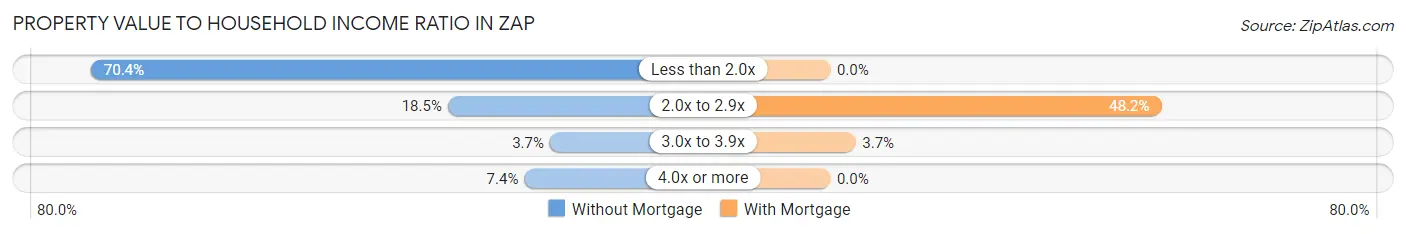
| Value-to-Income Ratio | Without Mortgage | With Mortgage |
| Less than 2.0x | 19 (70.4%) | 0 (0.0%) |
| 2.0x to 2.9x | 5 (18.5%) | 13 (48.1%) |
| 3.0x to 3.9x | 1 (3.7%) | 1 (3.7%) |
| 4.0x or more | 2 (7.4%) | 0 (0.0%) |
| Total | 27 (100.0%) | 27 (100.0%) |
Real Estate Taxes by Mortgage Status in Zap
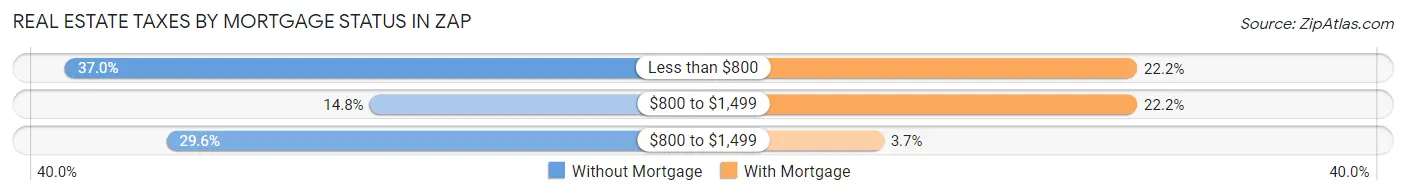
| Property Taxes | Without Mortgage | With Mortgage |
| Less than $800 | 10 (37.0%) | 6 (22.2%) |
| $800 to $1,499 | 4 (14.8%) | 6 (22.2%) |
| $800 to $1,499 | 8 (29.6%) | 1 (3.7%) |
| Total | 27 (100.0%) | 27 (100.0%) |
Health & Disability in Zap
Health Insurance Coverage by Age in Zap
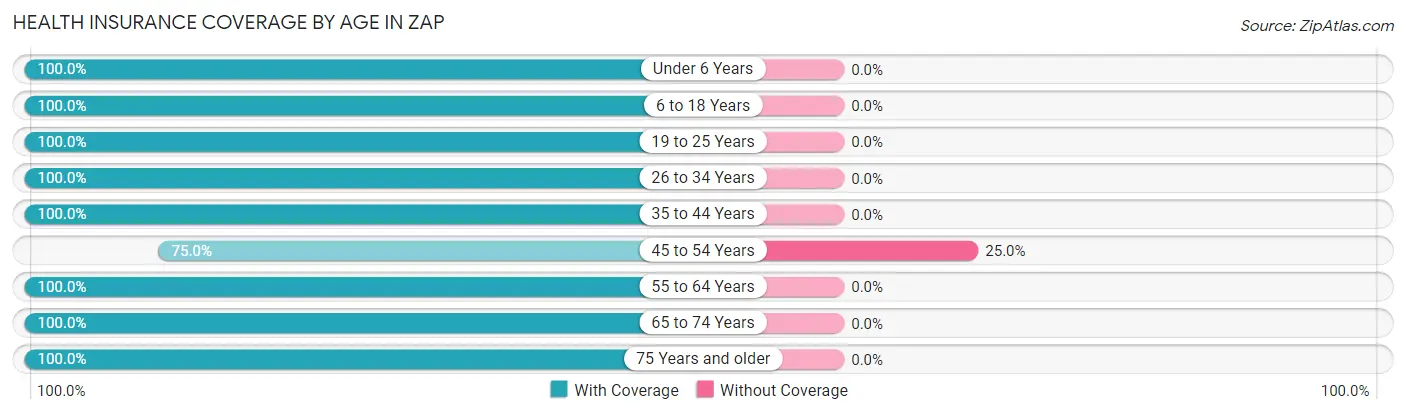
| Age Bracket | With Coverage | Without Coverage |
| Under 6 Years | 6 (100.0%) | 0 (0.0%) |
| 6 to 18 Years | 39 (100.0%) | 0 (0.0%) |
| 19 to 25 Years | 8 (100.0%) | 0 (0.0%) |
| 26 to 34 Years | 10 (100.0%) | 0 (0.0%) |
| 35 to 44 Years | 22 (100.0%) | 0 (0.0%) |
| 45 to 54 Years | 9 (75.0%) | 3 (25.0%) |
| 55 to 64 Years | 34 (100.0%) | 0 (0.0%) |
| 65 to 74 Years | 14 (100.0%) | 0 (0.0%) |
| 75 Years and older | 16 (100.0%) | 0 (0.0%) |
| Total | 158 (98.1%) | 3 (1.9%) |
Health Insurance Coverage by Citizenship Status in Zap

| Citizenship Status | With Coverage | Without Coverage |
| Native Born | 6 (100.0%) | 0 (0.0%) |
| Foreign Born, Citizen | 39 (100.0%) | 0 (0.0%) |
| Foreign Born, not a Citizen | 8 (100.0%) | 0 (0.0%) |
Health Insurance Coverage by Household Income in Zap
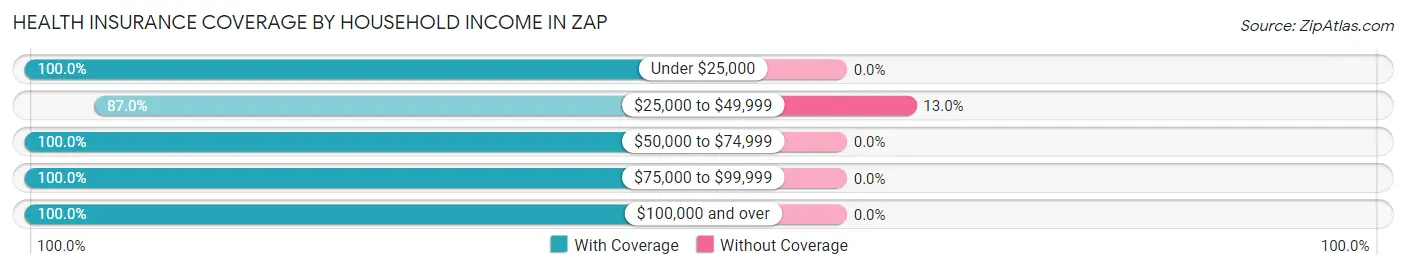
| Household Income | With Coverage | Without Coverage |
| Under $25,000 | 22 (100.0%) | 0 (0.0%) |
| $25,000 to $49,999 | 20 (87.0%) | 3 (13.0%) |
| $50,000 to $74,999 | 10 (100.0%) | 0 (0.0%) |
| $75,000 to $99,999 | 12 (100.0%) | 0 (0.0%) |
| $100,000 and over | 94 (100.0%) | 0 (0.0%) |
Public vs Private Health Insurance Coverage by Age in Zap
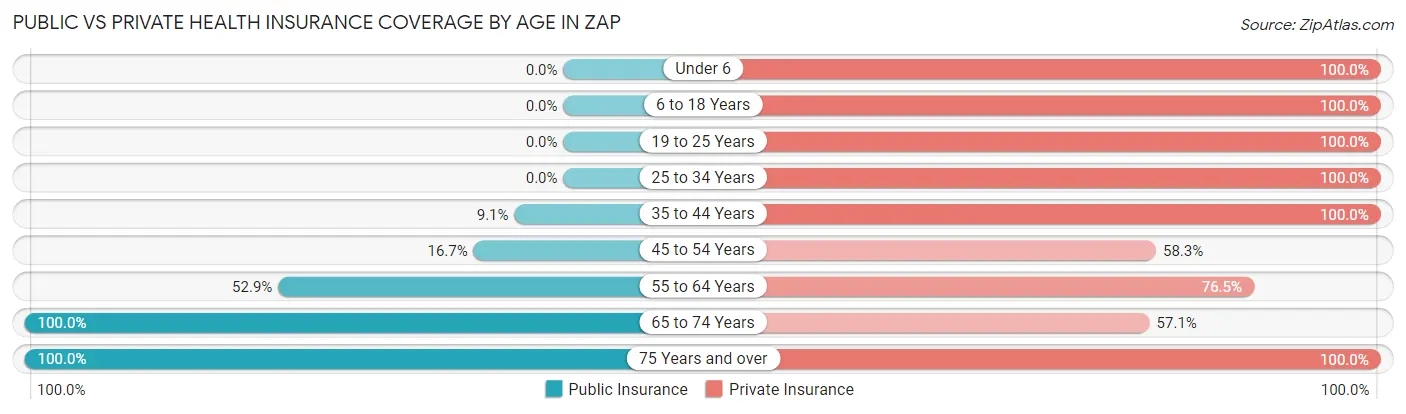
| Age Bracket | Public Insurance | Private Insurance |
| Under 6 | 0 (0.0%) | 6 (100.0%) |
| 6 to 18 Years | 0 (0.0%) | 39 (100.0%) |
| 19 to 25 Years | 0 (0.0%) | 8 (100.0%) |
| 25 to 34 Years | 0 (0.0%) | 10 (100.0%) |
| 35 to 44 Years | 2 (9.1%) | 22 (100.0%) |
| 45 to 54 Years | 2 (16.7%) | 7 (58.3%) |
| 55 to 64 Years | 18 (52.9%) | 26 (76.5%) |
| 65 to 74 Years | 14 (100.0%) | 8 (57.1%) |
| 75 Years and over | 16 (100.0%) | 16 (100.0%) |
| Total | 52 (32.3%) | 142 (88.2%) |
Disability Status by Sex by Age in Zap
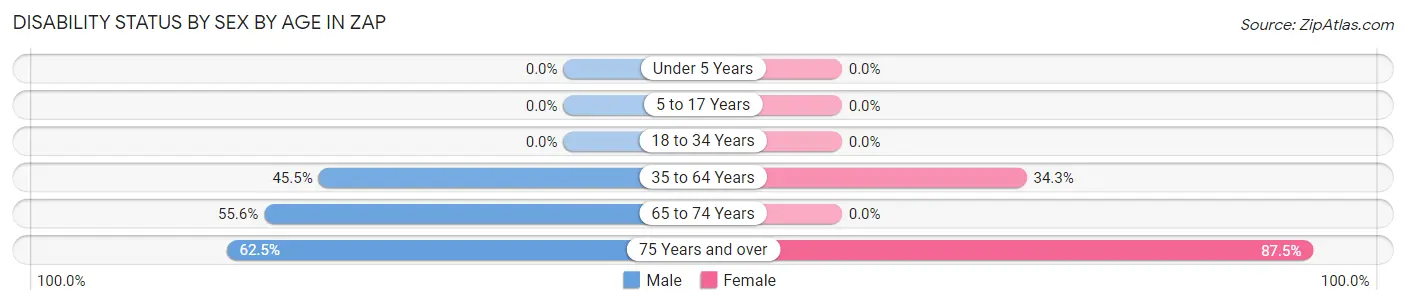
| Age Bracket | Male | Female |
| Under 5 Years | 0 (0.0%) | 0 (0.0%) |
| 5 to 17 Years | 0 (0.0%) | 0 (0.0%) |
| 18 to 34 Years | 0 (0.0%) | 0 (0.0%) |
| 35 to 64 Years | 15 (45.5%) | 12 (34.3%) |
| 65 to 74 Years | 5 (55.6%) | 0 (0.0%) |
| 75 Years and over | 5 (62.5%) | 7 (87.5%) |
Disability Class by Sex by Age in Zap
Disability Class: Hearing Difficulty
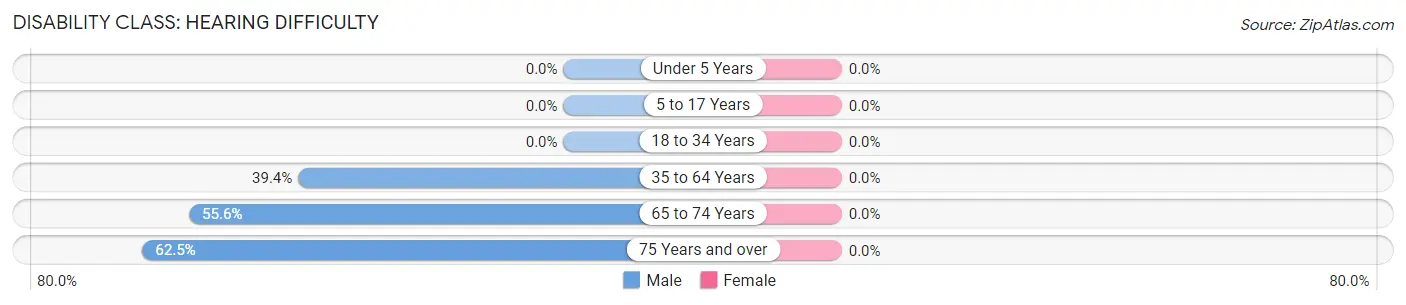
| Age Bracket | Male | Female |
| Under 5 Years | 0 (0.0%) | 0 (0.0%) |
| 5 to 17 Years | 0 (0.0%) | 0 (0.0%) |
| 18 to 34 Years | 0 (0.0%) | 0 (0.0%) |
| 35 to 64 Years | 13 (39.4%) | 0 (0.0%) |
| 65 to 74 Years | 5 (55.6%) | 0 (0.0%) |
| 75 Years and over | 5 (62.5%) | 0 (0.0%) |
Disability Class: Vision Difficulty
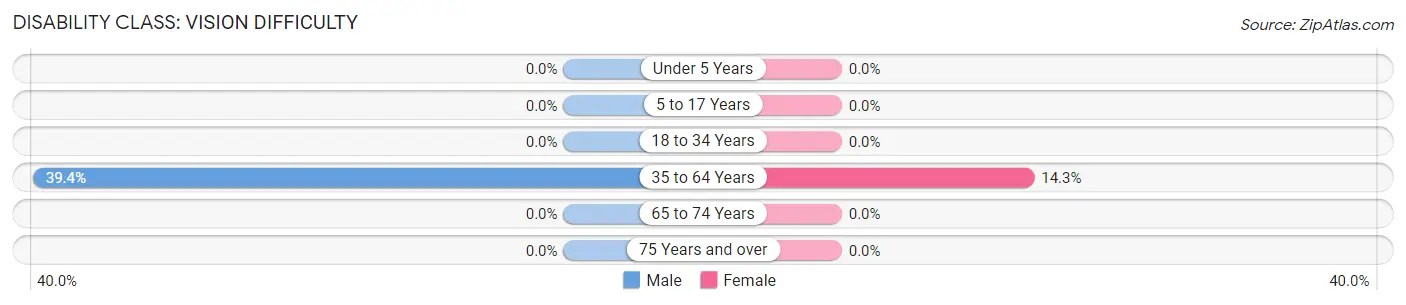
| Age Bracket | Male | Female |
| Under 5 Years | 0 (0.0%) | 0 (0.0%) |
| 5 to 17 Years | 0 (0.0%) | 0 (0.0%) |
| 18 to 34 Years | 0 (0.0%) | 0 (0.0%) |
| 35 to 64 Years | 13 (39.4%) | 5 (14.3%) |
| 65 to 74 Years | 0 (0.0%) | 0 (0.0%) |
| 75 Years and over | 0 (0.0%) | 0 (0.0%) |
Disability Class: Cognitive Difficulty
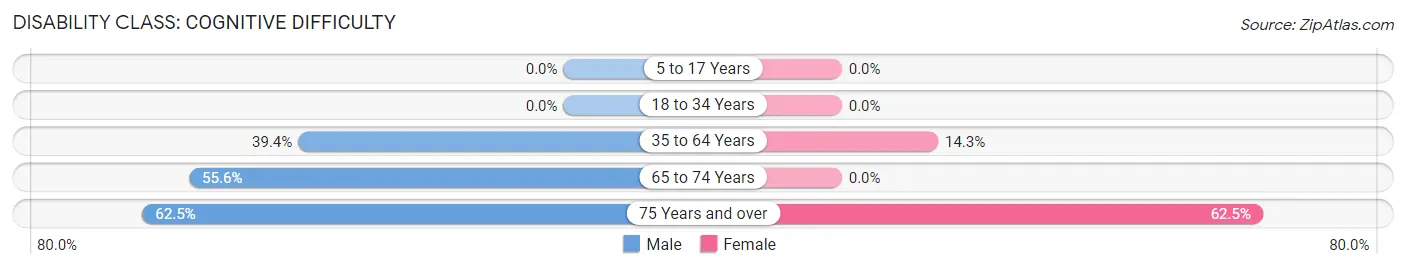
| Age Bracket | Male | Female |
| 5 to 17 Years | 0 (0.0%) | 0 (0.0%) |
| 18 to 34 Years | 0 (0.0%) | 0 (0.0%) |
| 35 to 64 Years | 13 (39.4%) | 5 (14.3%) |
| 65 to 74 Years | 5 (55.6%) | 0 (0.0%) |
| 75 Years and over | 5 (62.5%) | 5 (62.5%) |
Disability Class: Ambulatory Difficulty
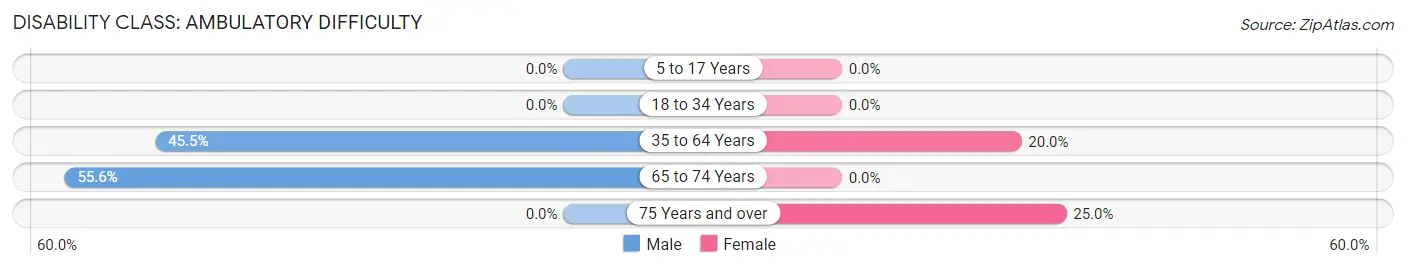
| Age Bracket | Male | Female |
| 5 to 17 Years | 0 (0.0%) | 0 (0.0%) |
| 18 to 34 Years | 0 (0.0%) | 0 (0.0%) |
| 35 to 64 Years | 15 (45.5%) | 7 (20.0%) |
| 65 to 74 Years | 5 (55.6%) | 0 (0.0%) |
| 75 Years and over | 0 (0.0%) | 2 (25.0%) |
Disability Class: Self-Care Difficulty
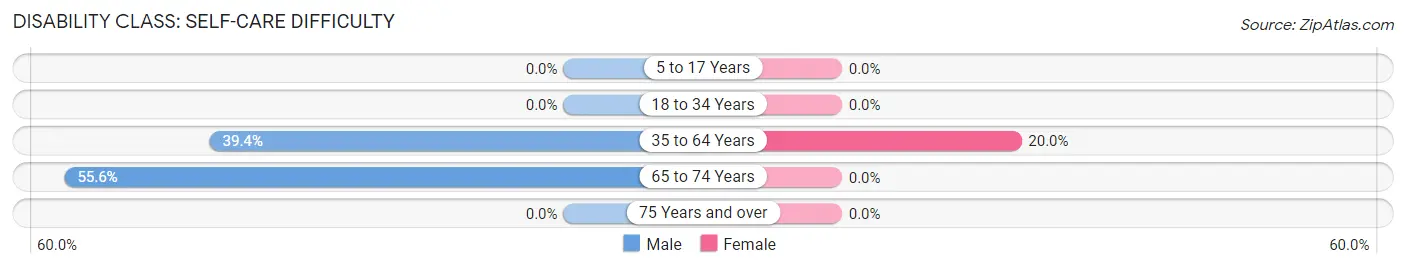
| Age Bracket | Male | Female |
| 5 to 17 Years | 0 (0.0%) | 0 (0.0%) |
| 18 to 34 Years | 0 (0.0%) | 0 (0.0%) |
| 35 to 64 Years | 13 (39.4%) | 7 (20.0%) |
| 65 to 74 Years | 5 (55.6%) | 0 (0.0%) |
| 75 Years and over | 0 (0.0%) | 0 (0.0%) |
Technology Access in Zap
Computing Device Access in Zap
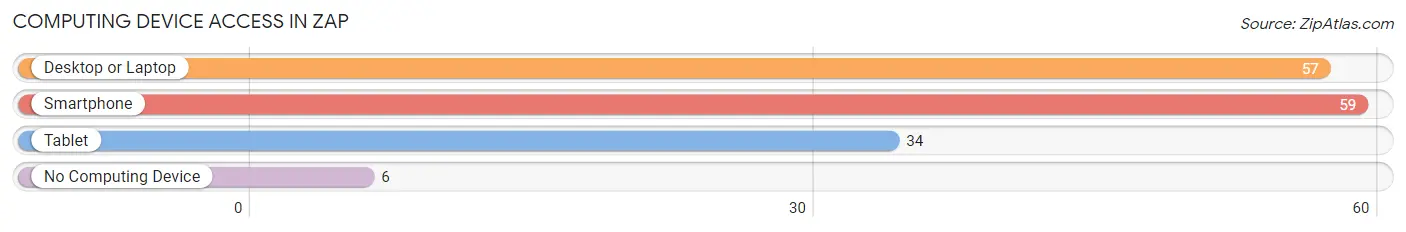
| Device Type | # Households | % Households |
| Desktop or Laptop | 57 | 79.2% |
| Smartphone | 59 | 81.9% |
| Tablet | 34 | 47.2% |
| No Computing Device | 6 | 8.3% |
| Total | 72 | 100.0% |
Internet Access in Zap
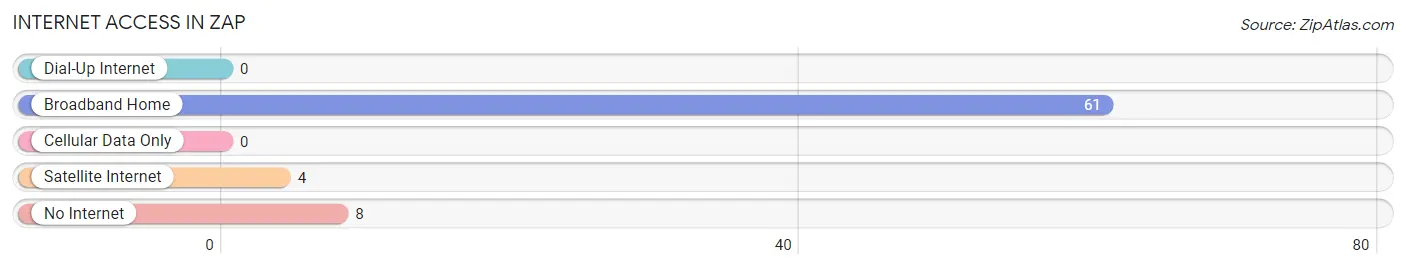
| Internet Type | # Households | % Households |
| Dial-Up Internet | 0 | 0.0% |
| Broadband Home | 61 | 84.7% |
| Cellular Data Only | 0 | 0.0% |
| Satellite Internet | 4 | 5.6% |
| No Internet | 8 | 11.1% |
| Total | 72 | 100.0% |
Zap Summary
History
North Dakota is a state located in the Midwestern and Great Plains regions of the United States. It is the 19th largest state by area, and the 4th least populous state. North Dakota was admitted to the Union on November 2, 1889, becoming the 39th state. The state was named after the Dakota Sioux Native American tribe, which inhabited the area at the time of statehood.
The first inhabitants of North Dakota were Paleo-Indians, who arrived in the area around 10,000 BC. The first permanent settlers were the Mandan, Hidatsa, and Arikara tribes, who established villages along the Missouri River. The first Europeans to explore the area were French fur traders, who arrived in the late 17th century. The area was part of the Louisiana Purchase in 1803, and was part of the Dakota Territory from 1861 to 1889.
Geography
North Dakota is located in the northern Great Plains region of the United States. It is bordered by the Canadian provinces of Saskatchewan and Manitoba to the north, Minnesota to the east, South Dakota to the south, and Montana to the west. The state has an area of 70,700 square miles, making it the 19th largest state in the country.
The geography of North Dakota is dominated by the Great Plains, which cover most of the state. The eastern part of the state is characterized by rolling hills and wooded areas, while the western part is more arid and flat. The highest point in the state is White Butte, which has an elevation of 3,506 feet. The Missouri River is the longest river in the state, and is a major source of irrigation and hydroelectric power.
Economy
North Dakota’s economy is largely based on agriculture, energy production, and tourism. Agriculture is the state’s largest industry, and is responsible for over one-third of the state’s total economic output. The state is a major producer of wheat, barley, oats, corn, and soybeans. Other important agricultural products include sunflowers, canola, flaxseed, and dry beans.
Energy production is also an important part of the state’s economy. North Dakota is the second-largest producer of crude oil in the United States, and is home to the Bakken Formation, one of the largest oil fields in the world. The state is also a major producer of natural gas, coal, and wind energy.
Tourism is also an important part of the state’s economy. North Dakota is home to several national parks, including Theodore Roosevelt National Park, Badlands National Park, and Fort Union Trading Post National Historic Site. The state also has a number of historic sites, museums, and other attractions.
Demographics
As of 2019, North Dakota had an estimated population of 762,062, making it the 4th least populous state in the country. The state has a population density of 10.9 people per square mile, making it the 48th most densely populated state. The largest city in the state is Fargo, with an estimated population of 122,359.
The racial makeup of North Dakota is 87.2% White, 5.2% Native American, 2.9% Hispanic or Latino, 1.7% Asian, 0.7% Black or African American, and 2.3% from other races. The state has a median household income of $58,906, and a poverty rate of 11.2%. The largest religious group in the state is Christianity, with 66.2% of the population identifying as Christian.
Common Questions
What is Per Capita Income in Zap?
Per Capita income in Zap is $31,336.
What is the Median Family Income in Zap?
Median Family Income in Zap is $106,875.
What is Inequality or Gini Index in Zap?
Inequality or Gini Index in Zap is 0.46.
What is the Total Population of Zap?
Total Population of Zap is 161.
What is the Total Male Population of Zap?
Total Male Population of Zap is 75.
What is the Total Female Population of Zap?
Total Female Population of Zap is 86.
What is the Ratio of Males per 100 Females in Zap?
There are 87.21 Males per 100 Females in Zap.
What is the Ratio of Females per 100 Males in Zap?
There are 114.67 Females per 100 Males in Zap.
What is the Median Population Age in Zap?
Median Population Age in Zap is 43.5 Years.
What is the Average Family Size in Zap
Average Family Size in Zap is 2.9 People.
What is the Average Household Size in Zap
Average Household Size in Zap is 2.2 People.
How Large is the Labor Force in Zap?
There are 61 People in the Labor Forcein in Zap.
What is the Percentage of People in the Labor Force in Zap?
52.6% of People are in the Labor Force in Zap.