Regent, ND Map & Demographics
Regent Map
Regent Overview
$49,760
PER CAPITA INCOME
$77,321
AVG FAMILY INCOME
$65,625
AVG HOUSEHOLD INCOME
2.1%
WAGE / INCOME GAP [ % ]
97.9¢/ $1
WAGE / INCOME GAP [ $ ]
0.39
INEQUALITY / GINI INDEX
149
TOTAL POPULATION
90
MALE POPULATION
59
FEMALE POPULATION
152.54
MALES / 100 FEMALES
65.56
FEMALES / 100 MALES
41.8
MEDIAN AGE
2.4
AVG FAMILY SIZE
1.6
AVG HOUSEHOLD SIZE
91
LABOR FORCE [ PEOPLE ]
74.6%
PERCENT IN LABOR FORCE
Regent Zip Codes
Regent Area Codes
Income in Regent
Income Overview in Regent
Per Capita Income in Regent is $49,760, while median incomes of families and households are $77,321 and $65,625 respectively.
| Characteristic | Number | Measure |
| Per Capita Income | 149 | $49,760 |
| Median Family Income | 39 | $77,321 |
| Mean Family Income | 39 | $99,297 |
| Median Household Income | 91 | $65,625 |
| Mean Household Income | 91 | $82,410 |
| Income Deficit | 39 | $0 |
| Wage / Income Gap (%) | 149 | 2.10% |
| Wage / Income Gap ($) | 149 | 97.90¢ per $1 |
| Gini / Inequality Index | 149 | 0.39 |
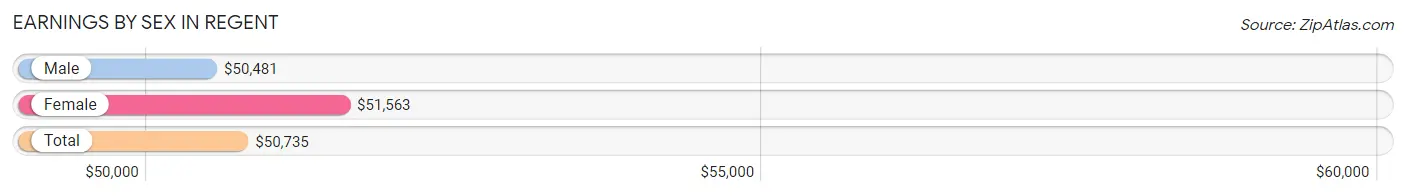
Earnings by Sex in Regent
Average Earnings in Regent are $50,735, $50,481 for men and $51,563 for women, a difference of 2.1%.
| Sex | Number | Average Earnings |
| Male | 55 (57.3%) | $50,481 |
| Female | 41 (42.7%) | $51,563 |
| Total | 96 (100.0%) | $50,735 |
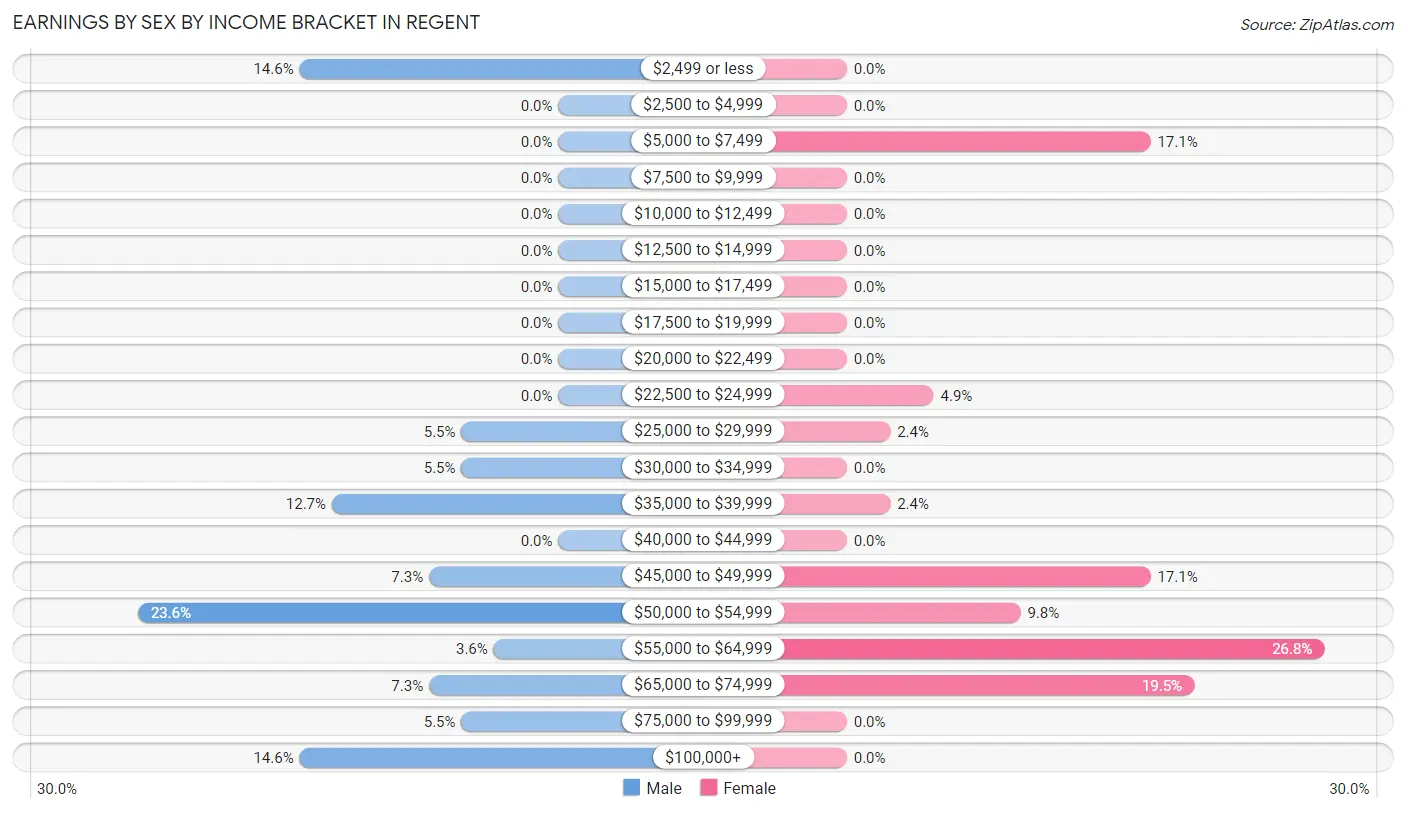
Earnings by Sex by Income Bracket in Regent
The most common earnings brackets in Regent are $50,000 to $54,999 for men (13 | 23.6%) and $55,000 to $64,999 for women (11 | 26.8%).
| Income | Male | Female |
| $2,499 or less | 8 (14.5%) | 0 (0.0%) |
| $2,500 to $4,999 | 0 (0.0%) | 0 (0.0%) |
| $5,000 to $7,499 | 0 (0.0%) | 7 (17.1%) |
| $7,500 to $9,999 | 0 (0.0%) | 0 (0.0%) |
| $10,000 to $12,499 | 0 (0.0%) | 0 (0.0%) |
| $12,500 to $14,999 | 0 (0.0%) | 0 (0.0%) |
| $15,000 to $17,499 | 0 (0.0%) | 0 (0.0%) |
| $17,500 to $19,999 | 0 (0.0%) | 0 (0.0%) |
| $20,000 to $22,499 | 0 (0.0%) | 0 (0.0%) |
| $22,500 to $24,999 | 0 (0.0%) | 2 (4.9%) |
| $25,000 to $29,999 | 3 (5.4%) | 1 (2.4%) |
| $30,000 to $34,999 | 3 (5.4%) | 0 (0.0%) |
| $35,000 to $39,999 | 7 (12.7%) | 1 (2.4%) |
| $40,000 to $44,999 | 0 (0.0%) | 0 (0.0%) |
| $45,000 to $49,999 | 4 (7.3%) | 7 (17.1%) |
| $50,000 to $54,999 | 13 (23.6%) | 4 (9.8%) |
| $55,000 to $64,999 | 2 (3.6%) | 11 (26.8%) |
| $65,000 to $74,999 | 4 (7.3%) | 8 (19.5%) |
| $75,000 to $99,999 | 3 (5.4%) | 0 (0.0%) |
| $100,000+ | 8 (14.5%) | 0 (0.0%) |
| Total | 55 (100.0%) | 41 (100.0%) |
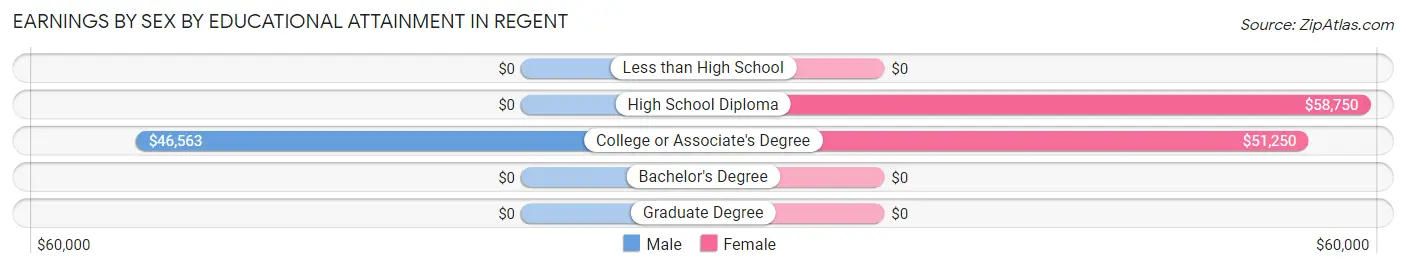
Earnings by Sex by Educational Attainment in Regent
Average earnings in Regent are $50,865 for men and $55,417 for women, a difference of 8.2%. Men with an educational attainment of college or associate's degree enjoy the highest average annual earnings of $46,563, while those with college or associate's degree education earn the least with $46,563. Women with an educational attainment of high school diploma earn the most with the average annual earnings of $58,750, while those with college or associate's degree education have the smallest earnings of $51,250.
| Educational Attainment | Male Income | Female Income |
| Less than High School | - | - |
| High School Diploma | - | - |
| College or Associate's Degree | $46,563 | $51,250 |
| Bachelor's Degree | - | - |
| Graduate Degree | - | - |
| Total | $50,865 | $55,417 |
Family Income in Regent
Family Income Brackets in Regent
According to the Regent family income data, there are 10 families falling into the $75,000 to $99,999 income range, which is the most common income bracket and makes up 25.6% of all families.
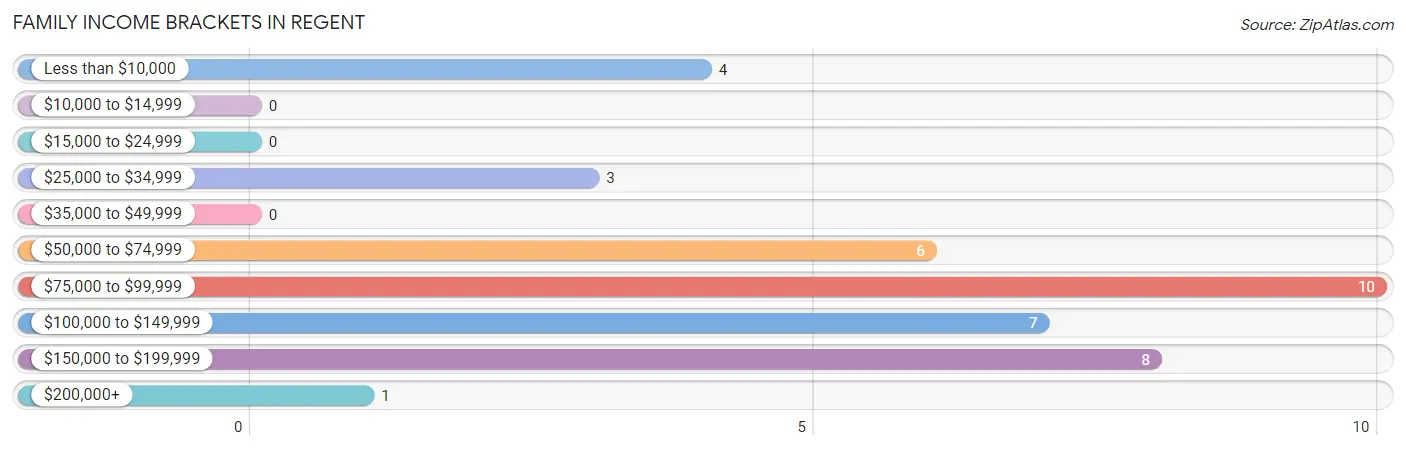
| Income Bracket | # Families | % Families |
| Less than $10,000 | 4 | 10.3% |
| $10,000 to $14,999 | 0 | 0.0% |
| $15,000 to $24,999 | 0 | 0.0% |
| $25,000 to $34,999 | 3 | 7.7% |
| $35,000 to $49,999 | 0 | 0.0% |
| $50,000 to $74,999 | 6 | 15.4% |
| $75,000 to $99,999 | 10 | 25.6% |
| $100,000 to $149,999 | 7 | 17.9% |
| $150,000 to $199,999 | 8 | 20.5% |
| $200,000+ | 1 | 2.6% |
Family Income by Famaliy Size in Regent
2-person families (24 | 61.5%) account for the highest median family income in Regent with $89,167 per family, while 2-person families (24 | 61.5%) have the highest median income of $44,584 per family member.
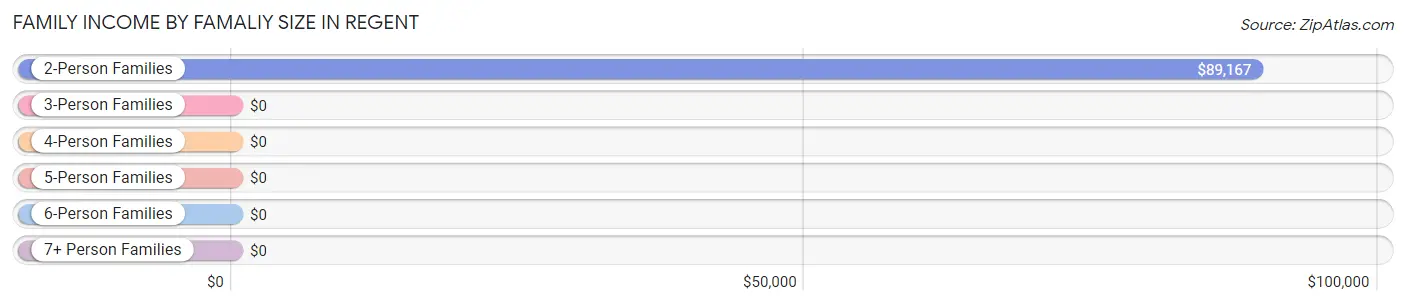
| Income Bracket | # Families | Median Income |
| 2-Person Families | 24 (61.5%) | $89,167 |
| 3-Person Families | 8 (20.5%) | $0 |
| 4-Person Families | 7 (17.9%) | $0 |
| 5-Person Families | 0 (0.0%) | $0 |
| 6-Person Families | 0 (0.0%) | $0 |
| 7+ Person Families | 0 (0.0%) | $0 |
| Total | 39 (100.0%) | $77,321 |
Family Income by Number of Earners in Regent
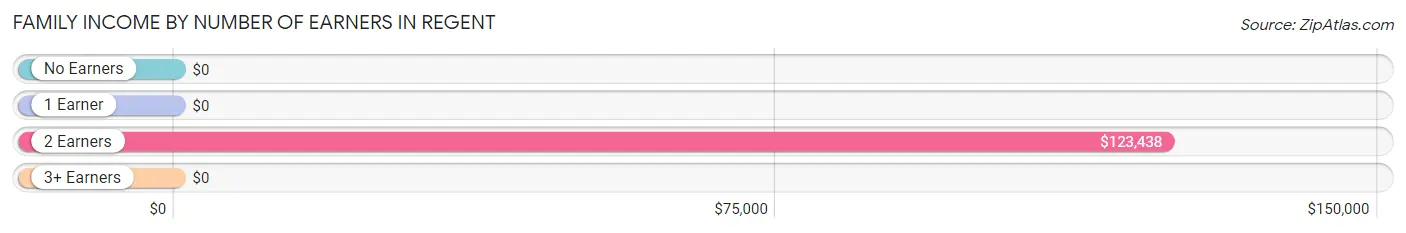
| Number of Earners | # Families | Median Income |
| No Earners | 7 (17.9%) | $0 |
| 1 Earner | 7 (17.9%) | $0 |
| 2 Earners | 25 (64.1%) | $123,438 |
| 3+ Earners | 0 (0.0%) | $0 |
| Total | 39 (100.0%) | $77,321 |
Household Income in Regent
Household Income Brackets in Regent
With 39 households falling in the category, the $50,000 to $74,999 income range is the most frequent in Regent, accounting for 42.9% of all households.
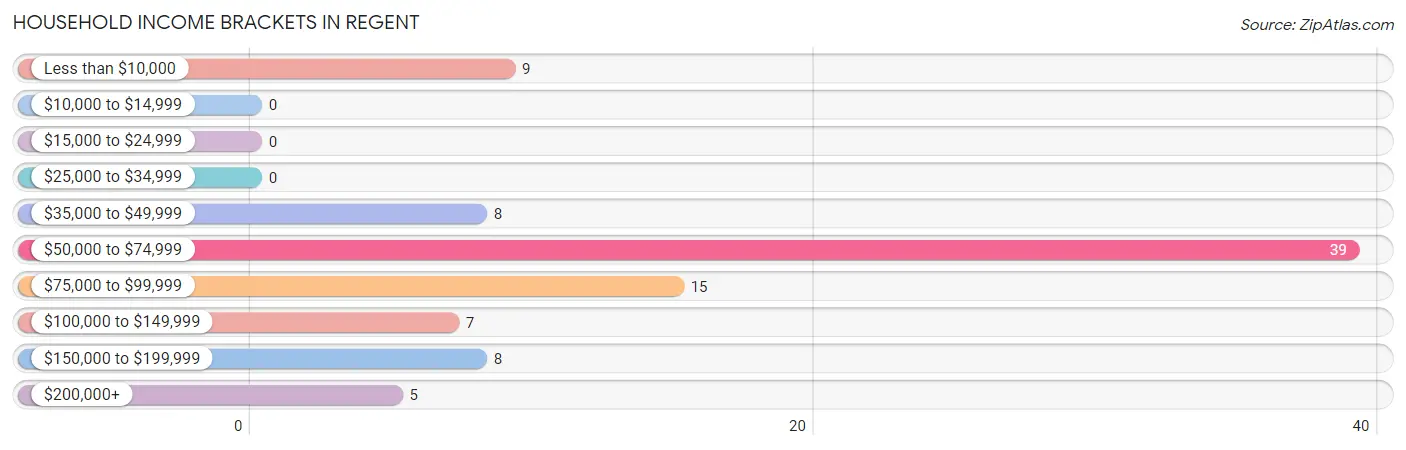
| Income Bracket | # Households | % Households |
| Less than $10,000 | 9 | 9.9% |
| $10,000 to $14,999 | 0 | 0.0% |
| $15,000 to $24,999 | 0 | 0.0% |
| $25,000 to $34,999 | 0 | 0.0% |
| $35,000 to $49,999 | 8 | 8.8% |
| $50,000 to $74,999 | 39 | 42.9% |
| $75,000 to $99,999 | 15 | 16.5% |
| $100,000 to $149,999 | 7 | 7.7% |
| $150,000 to $199,999 | 8 | 8.8% |
| $200,000+ | 5 | 5.5% |
Household Income by Householder Age in Regent
The median household income in Regent is $65,625, with the highest median household income of $88,750 found in the 45 to 64 years age bracket for the primary householder. A total of 33 households (36.3%) fall into this category.
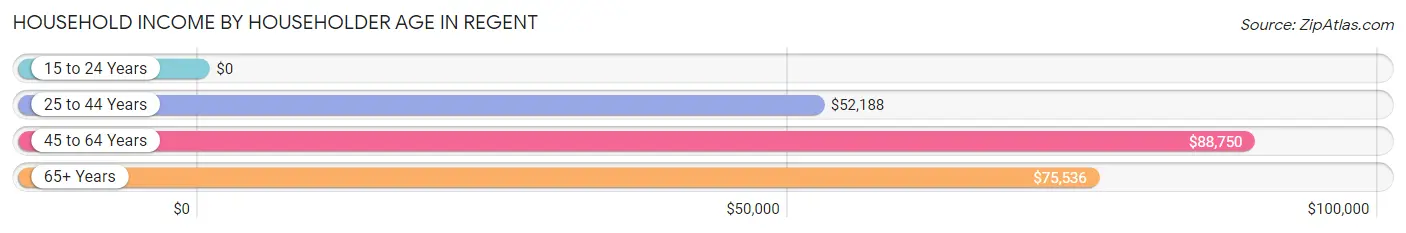
| Income Bracket | # Households | Median Income |
| 15 to 24 Years | 0 (0.0%) | $0 |
| 25 to 44 Years | 37 (40.7%) | $52,188 |
| 45 to 64 Years | 33 (36.3%) | $88,750 |
| 65+ Years | 21 (23.1%) | $75,536 |
| Total | 91 (100.0%) | $65,625 |
Poverty in Regent
Income Below Poverty by Sex and Age in Regent
With 22.2% poverty level for males and 10.2% for females among the residents of Regent, 6 to 11 year old males and 18 to 24 year old females are the most vulnerable to poverty, with 8 males (80.0%) and 4 females (100.0%) in their respective age groups living below the poverty level.
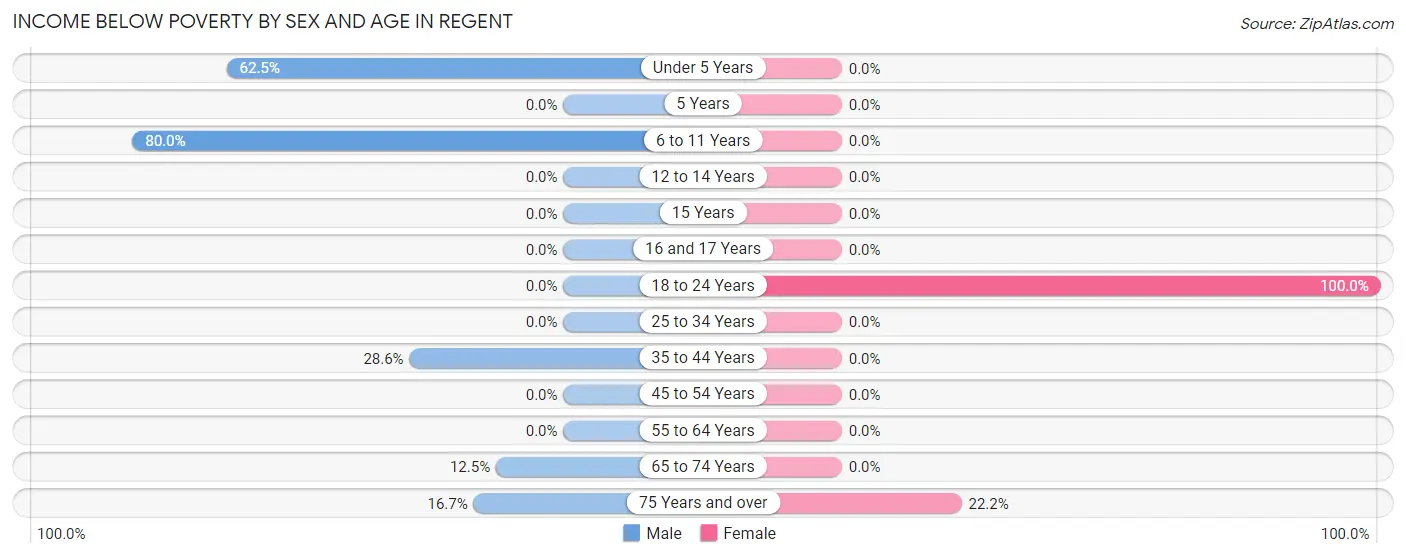
| Age Bracket | Male | Female |
| Under 5 Years | 5 (62.5%) | 0 (0.0%) |
| 5 Years | 0 (0.0%) | 0 (0.0%) |
| 6 to 11 Years | 8 (80.0%) | 0 (0.0%) |
| 12 to 14 Years | 0 (0.0%) | 0 (0.0%) |
| 15 Years | 0 (0.0%) | 0 (0.0%) |
| 16 and 17 Years | 0 (0.0%) | 0 (0.0%) |
| 18 to 24 Years | 0 (0.0%) | 4 (100.0%) |
| 25 to 34 Years | 0 (0.0%) | 0 (0.0%) |
| 35 to 44 Years | 4 (28.6%) | 0 (0.0%) |
| 45 to 54 Years | 0 (0.0%) | 0 (0.0%) |
| 55 to 64 Years | 0 (0.0%) | 0 (0.0%) |
| 65 to 74 Years | 2 (12.5%) | 0 (0.0%) |
| 75 Years and over | 1 (16.7%) | 2 (22.2%) |
| Total | 20 (22.2%) | 6 (10.2%) |
Income Above Poverty by Sex and Age in Regent
According to the poverty statistics in Regent, males aged 18 to 24 years and females aged under 5 years are the age groups that are most secure financially, with 100.0% of males and 100.0% of females in these age groups living above the poverty line.
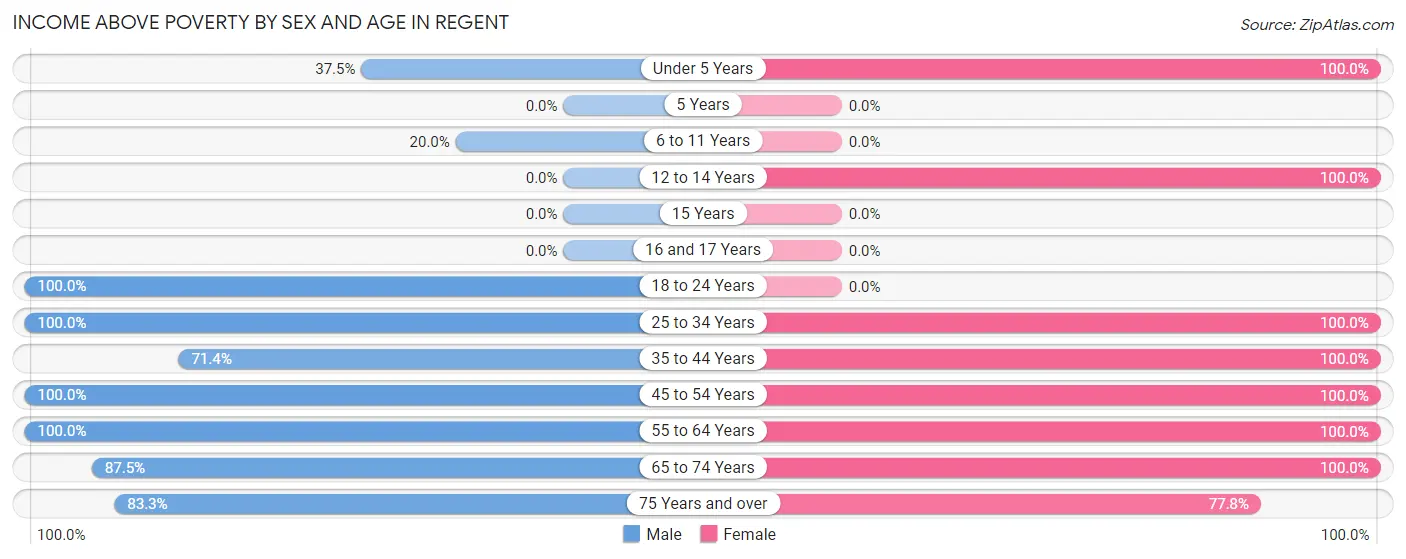
| Age Bracket | Male | Female |
| Under 5 Years | 3 (37.5%) | 4 (100.0%) |
| 5 Years | 0 (0.0%) | 0 (0.0%) |
| 6 to 11 Years | 2 (20.0%) | 0 (0.0%) |
| 12 to 14 Years | 0 (0.0%) | 5 (100.0%) |
| 15 Years | 0 (0.0%) | 0 (0.0%) |
| 16 and 17 Years | 0 (0.0%) | 0 (0.0%) |
| 18 to 24 Years | 4 (100.0%) | 0 (0.0%) |
| 25 to 34 Years | 18 (100.0%) | 3 (100.0%) |
| 35 to 44 Years | 10 (71.4%) | 6 (100.0%) |
| 45 to 54 Years | 4 (100.0%) | 1 (100.0%) |
| 55 to 64 Years | 10 (100.0%) | 24 (100.0%) |
| 65 to 74 Years | 14 (87.5%) | 3 (100.0%) |
| 75 Years and over | 5 (83.3%) | 7 (77.8%) |
| Total | 70 (77.8%) | 53 (89.8%) |
Income Below Poverty Among Married-Couple Families in Regent
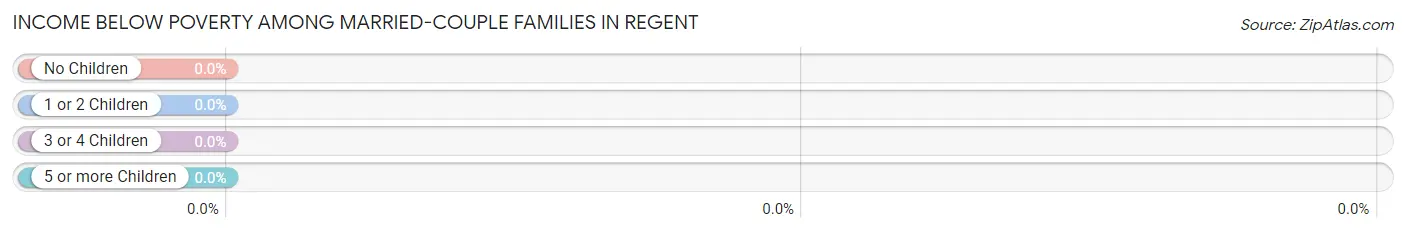
| Children | Above Poverty | Below Poverty |
| No Children | 21 (100.0%) | 0 (0.0%) |
| 1 or 2 Children | 5 (100.0%) | 0 (0.0%) |
| 3 or 4 Children | 0 (0.0%) | 0 (0.0%) |
| 5 or more Children | 0 (0.0%) | 0 (0.0%) |
| Total | 26 (100.0%) | 0 (0.0%) |
Income Below Poverty Among Single-Parent Households in Regent
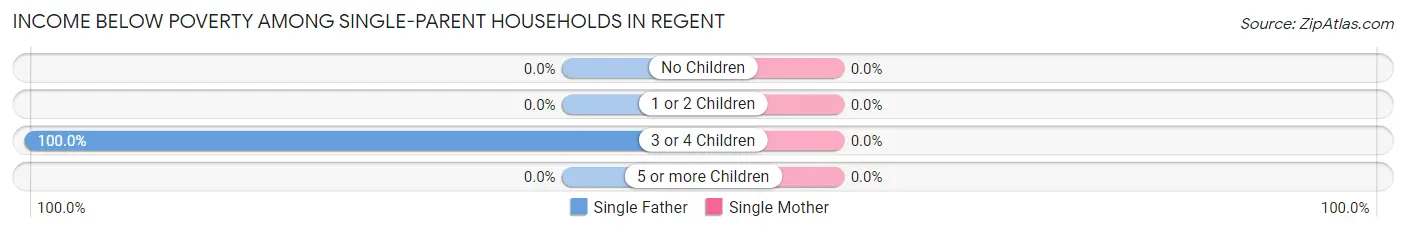
| Children | Single Father | Single Mother |
| No Children | 0 (0.0%) | 0 (0.0%) |
| 1 or 2 Children | 0 (0.0%) | 0 (0.0%) |
| 3 or 4 Children | 4 (100.0%) | 0 (0.0%) |
| 5 or more Children | 0 (0.0%) | 0 (0.0%) |
| Total | 4 (57.1%) | 0 (0.0%) |
Income Below Poverty Among Married-Couple vs Single-Parent Households in Regent
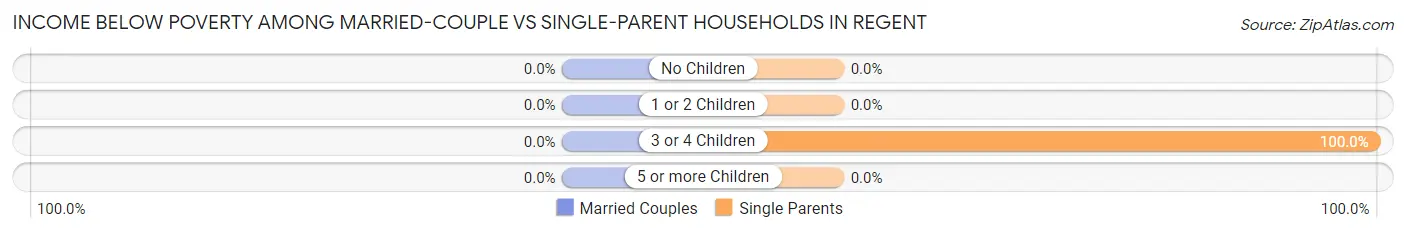
| Children | Married-Couple Families | Single-Parent Households |
| No Children | 0 (0.0%) | 0 (0.0%) |
| 1 or 2 Children | 0 (0.0%) | 0 (0.0%) |
| 3 or 4 Children | 0 (0.0%) | 4 (100.0%) |
| 5 or more Children | 0 (0.0%) | 0 (0.0%) |
| Total | 0 (0.0%) | 4 (30.8%) |
Race in Regent
The most populous races in Regent are White / Caucasian (140 | 94.0%), Asian (6 | 4.0%), and Two or more Races (3 | 2.0%).
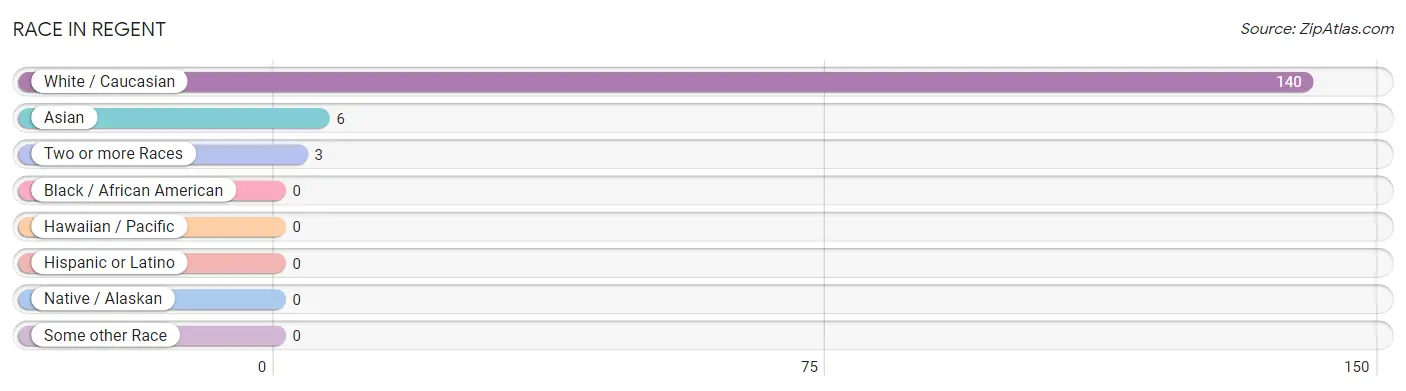
| Race | # Population | % Population |
| Asian | 6 | 4.0% |
| Black / African American | 0 | 0.0% |
| Hawaiian / Pacific | 0 | 0.0% |
| Hispanic or Latino | 0 | 0.0% |
| Native / Alaskan | 0 | 0.0% |
| White / Caucasian | 140 | 94.0% |
| Two or more Races | 3 | 2.0% |
| Some other Race | 0 | 0.0% |
| Total | 149 | 100.0% |
Ancestry in Regent
The most populous ancestries reported in Regent are German (84 | 56.4%), Norwegian (49 | 32.9%), Irish (13 | 8.7%), Swedish (13 | 8.7%), and Czech (10 | 6.7%), together accounting for 113.4% of all Regent residents.
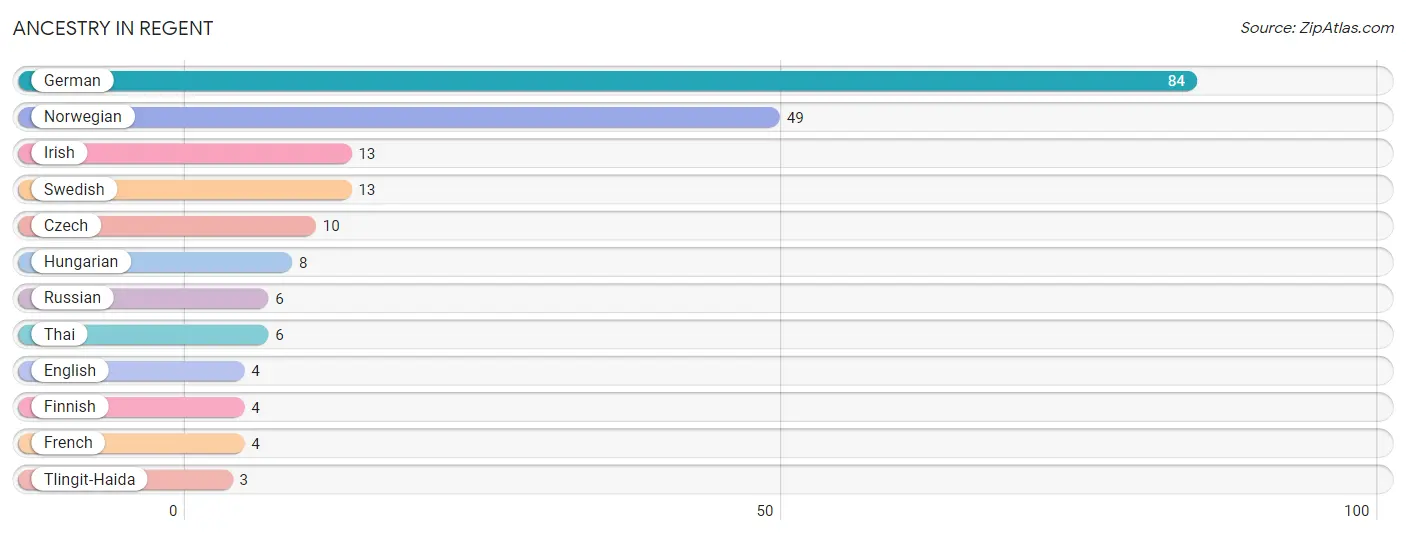
| Ancestry | # Population | % Population |
| Czech | 10 | 6.7% |
| English | 4 | 2.7% |
| Finnish | 4 | 2.7% |
| French | 4 | 2.7% |
| German | 84 | 56.4% |
| Hungarian | 8 | 5.4% |
| Irish | 13 | 8.7% |
| Norwegian | 49 | 32.9% |
| Russian | 6 | 4.0% |
| Swedish | 13 | 8.7% |
| Thai | 6 | 4.0% |
| Tlingit-Haida | 3 | 2.0% | View All 12 Rows |
Immigrants in Regent
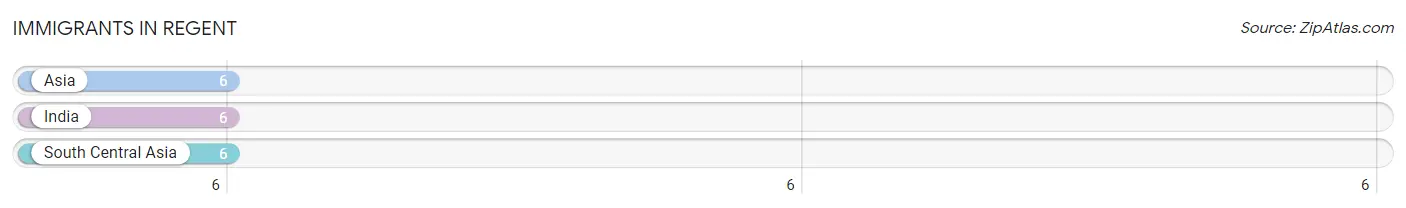
The most numerous immigrant groups reported in Regent came from Asia (6 | 4.0%), India (6 | 4.0%), and South Central Asia (6 | 4.0%), together accounting for 12.1% of all Regent residents.
| Immigration Origin | # Population | % Population |
| Asia | 6 | 4.0% |
| India | 6 | 4.0% |
| South Central Asia | 6 | 4.0% | View All 3 Rows |
Sex and Age in Regent
Sex and Age in Regent
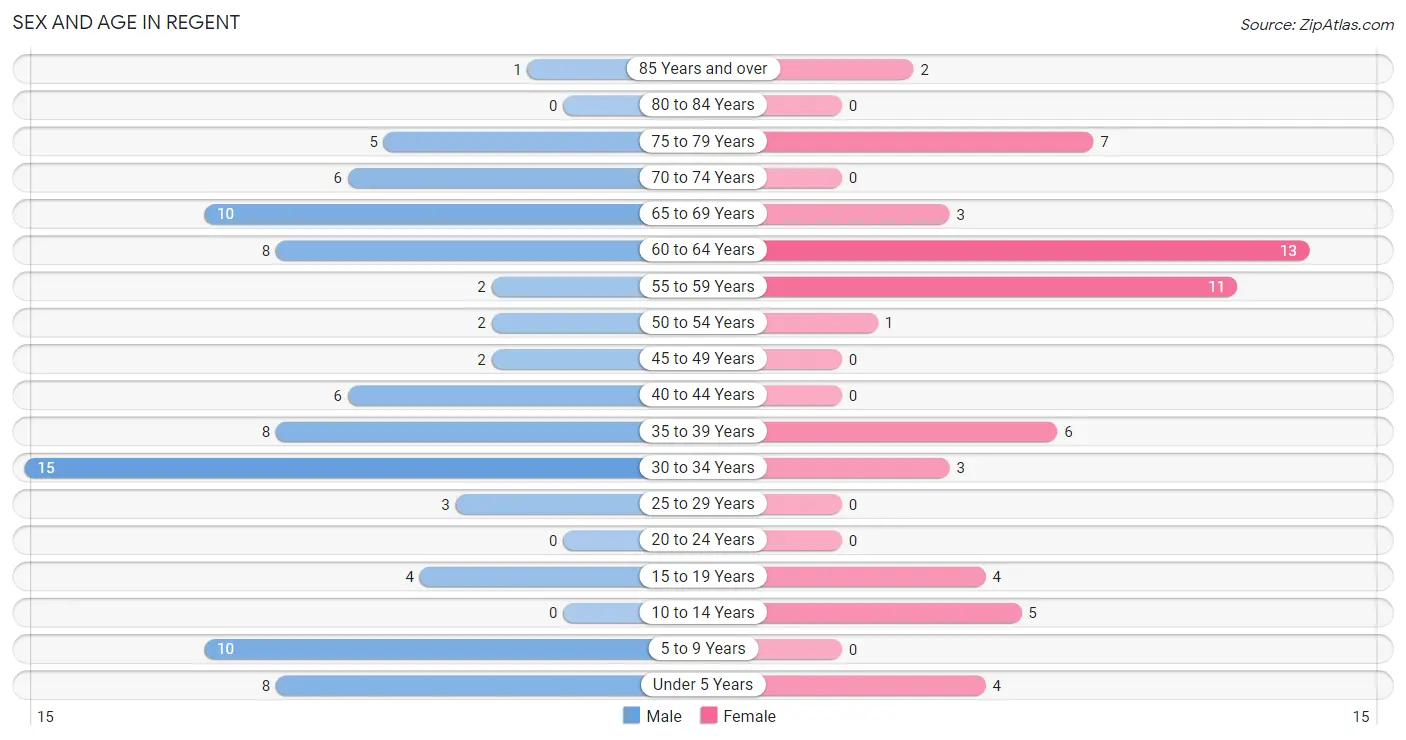
The most populous age groups in Regent are 30 to 34 Years (15 | 16.7%) for men and 60 to 64 Years (13 | 22.0%) for women.
| Age Bracket | Male | Female |
| Under 5 Years | 8 (8.9%) | 4 (6.8%) |
| 5 to 9 Years | 10 (11.1%) | 0 (0.0%) |
| 10 to 14 Years | 0 (0.0%) | 5 (8.5%) |
| 15 to 19 Years | 4 (4.4%) | 4 (6.8%) |
| 20 to 24 Years | 0 (0.0%) | 0 (0.0%) |
| 25 to 29 Years | 3 (3.3%) | 0 (0.0%) |
| 30 to 34 Years | 15 (16.7%) | 3 (5.1%) |
| 35 to 39 Years | 8 (8.9%) | 6 (10.2%) |
| 40 to 44 Years | 6 (6.7%) | 0 (0.0%) |
| 45 to 49 Years | 2 (2.2%) | 0 (0.0%) |
| 50 to 54 Years | 2 (2.2%) | 1 (1.7%) |
| 55 to 59 Years | 2 (2.2%) | 11 (18.6%) |
| 60 to 64 Years | 8 (8.9%) | 13 (22.0%) |
| 65 to 69 Years | 10 (11.1%) | 3 (5.1%) |
| 70 to 74 Years | 6 (6.7%) | 0 (0.0%) |
| 75 to 79 Years | 5 (5.6%) | 7 (11.9%) |
| 80 to 84 Years | 0 (0.0%) | 0 (0.0%) |
| 85 Years and over | 1 (1.1%) | 2 (3.4%) |
| Total | 90 (100.0%) | 59 (100.0%) |
Families and Households in Regent
Median Family Size in Regent
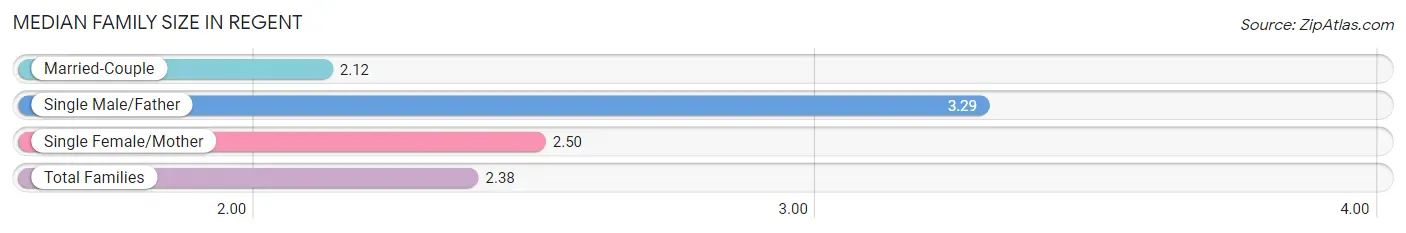
The median family size in Regent is 2.38 persons per family, with single male/father families (7 | 17.9%) accounting for the largest median family size of 3.29 persons per family. On the other hand, married-couple families (26 | 66.7%) represent the smallest median family size with 2.12 persons per family.
| Family Type | # Families | Family Size |
| Married-Couple | 26 (66.7%) | 2.12 |
| Single Male/Father | 7 (17.9%) | 3.29 |
| Single Female/Mother | 6 (15.4%) | 2.50 |
| Total Families | 39 (100.0%) | 2.38 |
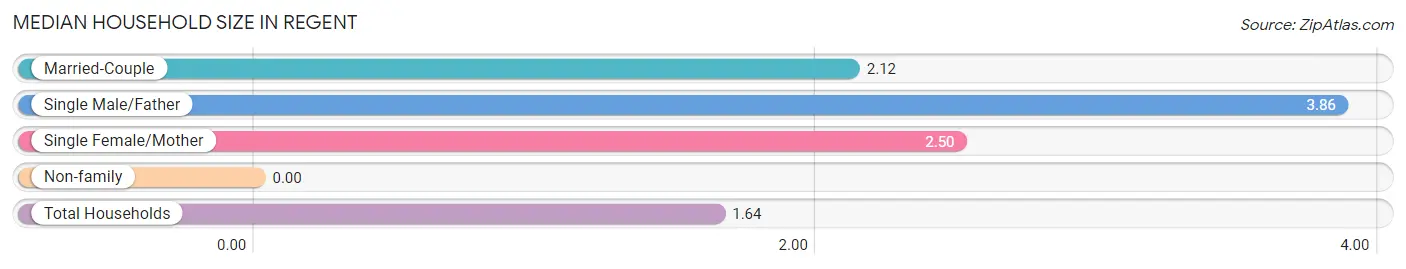
Median Household Size in Regent
| Household Type | # Households | Household Size |
| Married-Couple | 26 (28.6%) | 2.12 |
| Single Male/Father | 7 (7.7%) | 3.86 |
| Single Female/Mother | 6 (6.6%) | 2.50 |
| Non-family | 52 (57.1%) | - |
| Total Households | 91 (100.0%) | 1.64 |
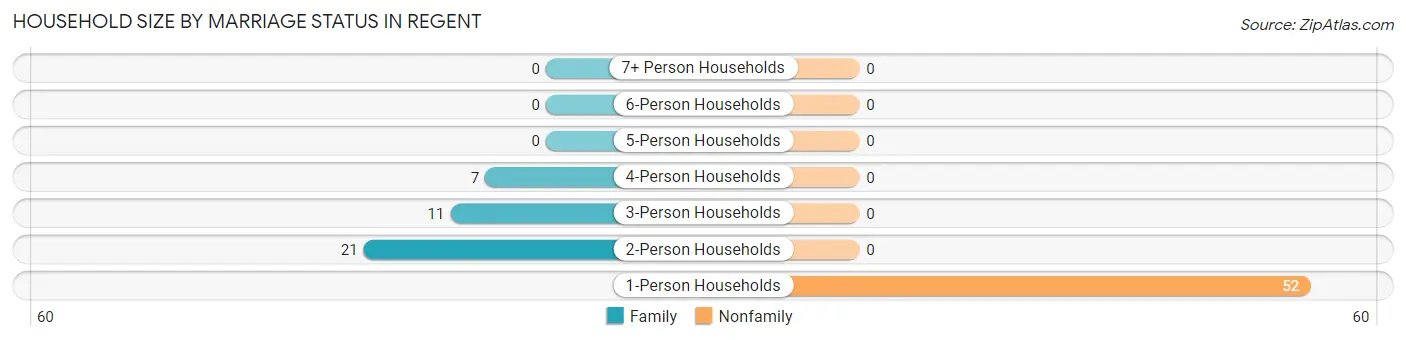
Household Size by Marriage Status in Regent
Out of a total of 91 households in Regent, 39 (42.9%) are family households, while 52 (57.1%) are nonfamily households. The most numerous type of family households are 2-person households, comprising 21, and the most common type of nonfamily households are 1-person households, comprising 52.
| Household Size | Family Households | Nonfamily Households |
| 1-Person Households | - | 52 (57.1%) |
| 2-Person Households | 21 (23.1%) | 0 (0.0%) |
| 3-Person Households | 11 (12.1%) | 0 (0.0%) |
| 4-Person Households | 7 (7.7%) | 0 (0.0%) |
| 5-Person Households | 0 (0.0%) | 0 (0.0%) |
| 6-Person Households | 0 (0.0%) | 0 (0.0%) |
| 7+ Person Households | 0 (0.0%) | 0 (0.0%) |
| Total | 39 (42.9%) | 52 (57.1%) |
Female Fertility in Regent
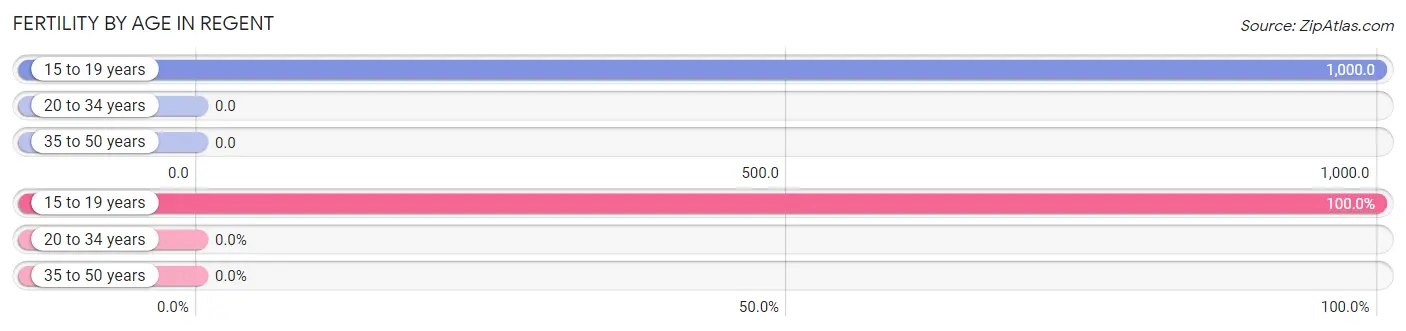
Fertility by Age in Regent
Average fertility rate in Regent is 308.0 births per 1,000 women. Women in the age bracket of 15 to 19 years have the highest fertility rate with 1,000.0 births per 1,000 women. Women in the age bracket of 15 to 19 years acount for 100.0% of all women with births.
| Age Bracket | Women with Births | Births / 1,000 Women |
| 15 to 19 years | 4 (100.0%) | 1,000.0 |
| 20 to 34 years | 0 (0.0%) | 0.0 |
| 35 to 50 years | 0 (0.0%) | 0.0 |
| Total | 4 (100.0%) | 308.0 |
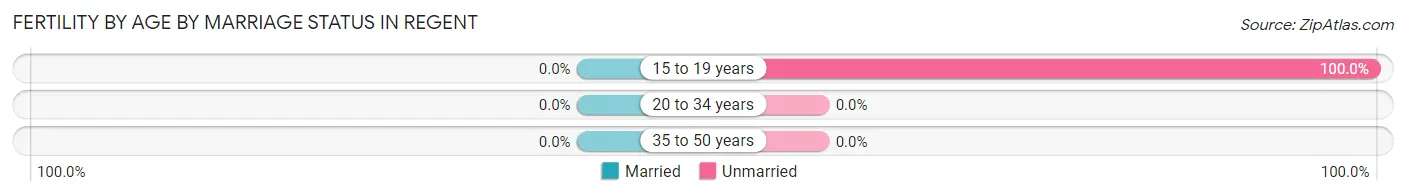
Fertility by Age by Marriage Status in Regent
| Age Bracket | Married | Unmarried |
| 15 to 19 years | 0 (0.0%) | 4 (100.0%) |
| 20 to 34 years | 0 (0.0%) | 0 (0.0%) |
| 35 to 50 years | 0 (0.0%) | 0 (0.0%) |
| Total | 0 (0.0%) | 4 (100.0%) |
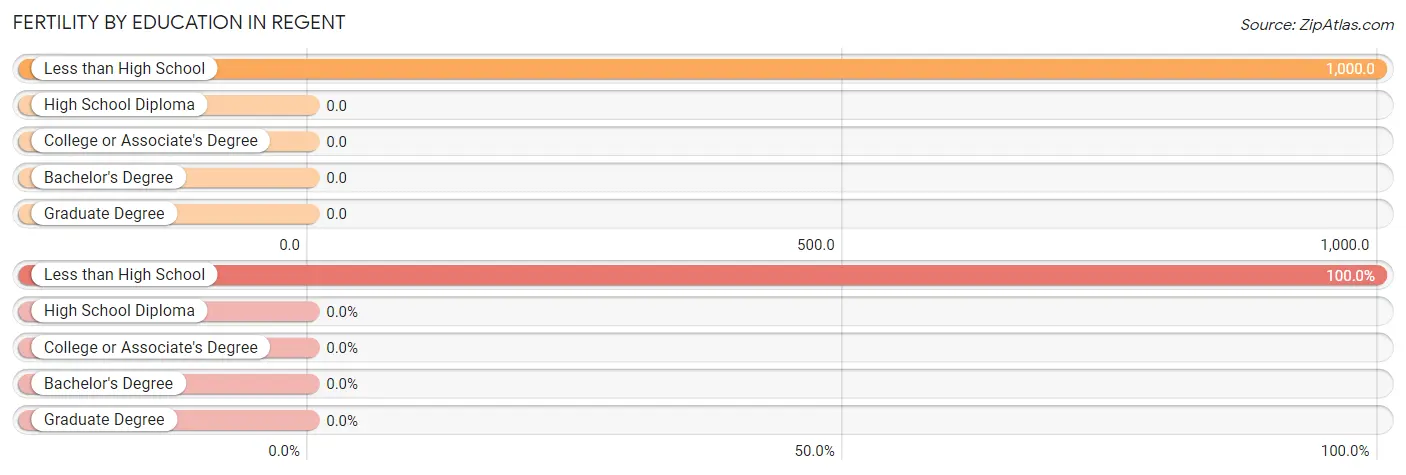
Fertility by Education in Regent
| Educational Attainment | Women with Births | Births / 1,000 Women |
| Less than High School | 4 (100.0%) | 1,000.0 |
| High School Diploma | 0 (0.0%) | 0.0 |
| College or Associate's Degree | 0 (0.0%) | 0.0 |
| Bachelor's Degree | 0 (0.0%) | 0.0 |
| Graduate Degree | 0 (0.0%) | 0.0 |
| Total | 4 (100.0%) | 308.0 |
Fertility by Education by Marriage Status in Regent
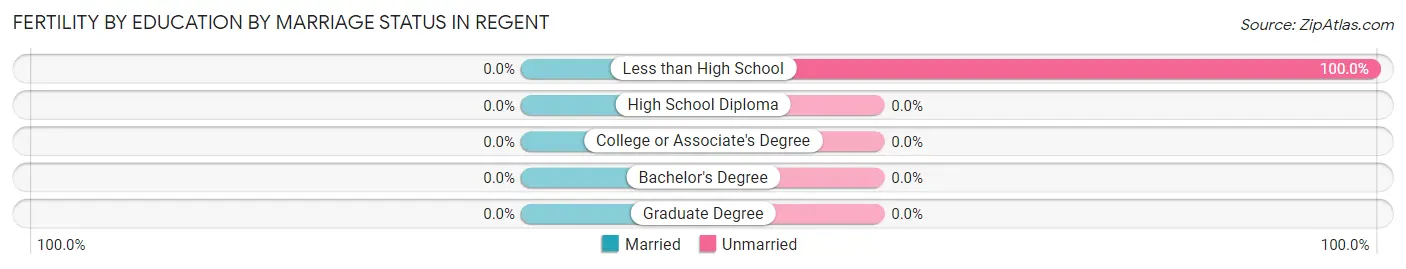
| Educational Attainment | Married | Unmarried |
| Less than High School | 0 (0.0%) | 4 (100.0%) |
| High School Diploma | 0 (0.0%) | 0 (0.0%) |
| College or Associate's Degree | 0 (0.0%) | 0 (0.0%) |
| Bachelor's Degree | 0 (0.0%) | 0 (0.0%) |
| Graduate Degree | 0 (0.0%) | 0 (0.0%) |
| Total | 0 (0.0%) | 4 (100.0%) |
Employment Characteristics in Regent
Employment by Class of Employer in Regent
Among the 87 employed individuals in Regent, private company employees (29 | 33.3%), not-for-profit organizations (23 | 26.4%), and local government employees (16 | 18.4%) make up the most common classes of employment.
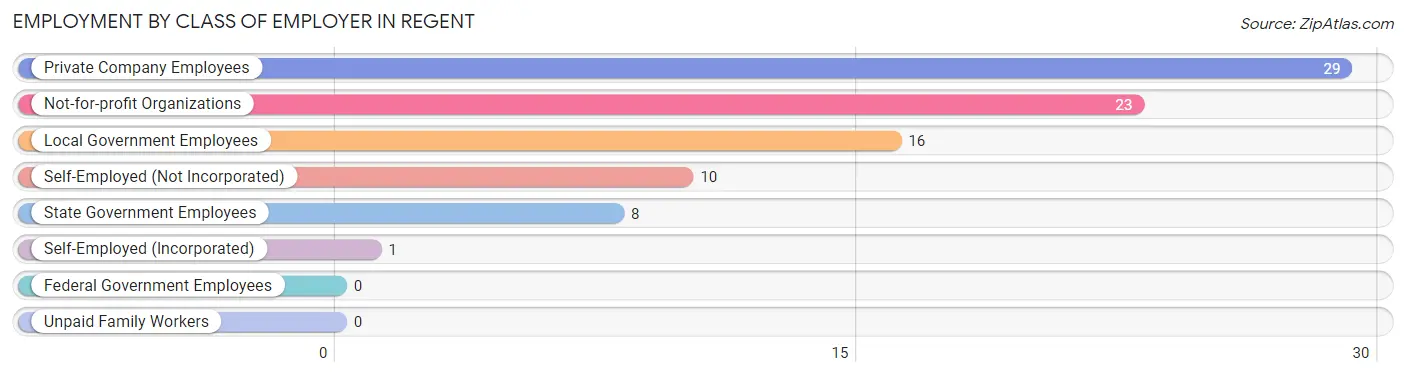
| Employer Class | # Employees | % Employees |
| Private Company Employees | 29 | 33.3% |
| Self-Employed (Incorporated) | 1 | 1.1% |
| Self-Employed (Not Incorporated) | 10 | 11.5% |
| Not-for-profit Organizations | 23 | 26.4% |
| Local Government Employees | 16 | 18.4% |
| State Government Employees | 8 | 9.2% |
| Federal Government Employees | 0 | 0.0% |
| Unpaid Family Workers | 0 | 0.0% |
| Total | 87 | 100.0% |
Employment Status by Age in Regent
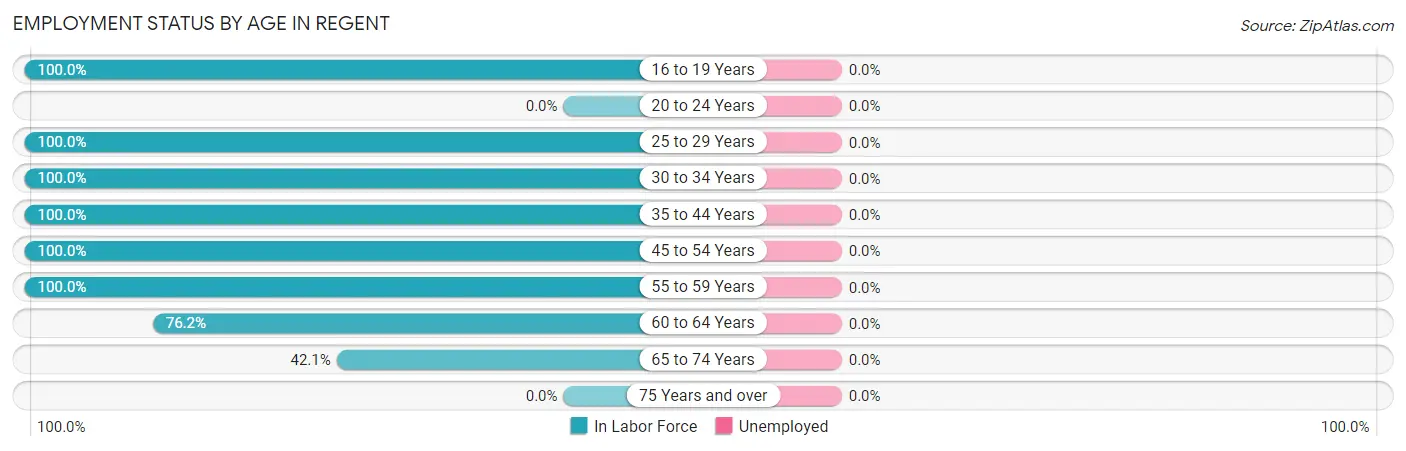
| Age Bracket | In Labor Force | Unemployed |
| 16 to 19 Years | 8 (100.0%) | 0 (0.0%) |
| 20 to 24 Years | 0 (0.0%) | 0 (0.0%) |
| 25 to 29 Years | 3 (100.0%) | 0 (0.0%) |
| 30 to 34 Years | 18 (100.0%) | 0 (0.0%) |
| 35 to 44 Years | 20 (100.0%) | 0 (0.0%) |
| 45 to 54 Years | 5 (100.0%) | 0 (0.0%) |
| 55 to 59 Years | 13 (100.0%) | 0 (0.0%) |
| 60 to 64 Years | 16 (76.2%) | 0 (0.0%) |
| 65 to 74 Years | 8 (42.1%) | 0 (0.0%) |
| 75 Years and over | 0 (0.0%) | 0 (0.0%) |
| Total | 91 (74.6%) | 0 (0.0%) |
Employment Status by Educational Attainment in Regent
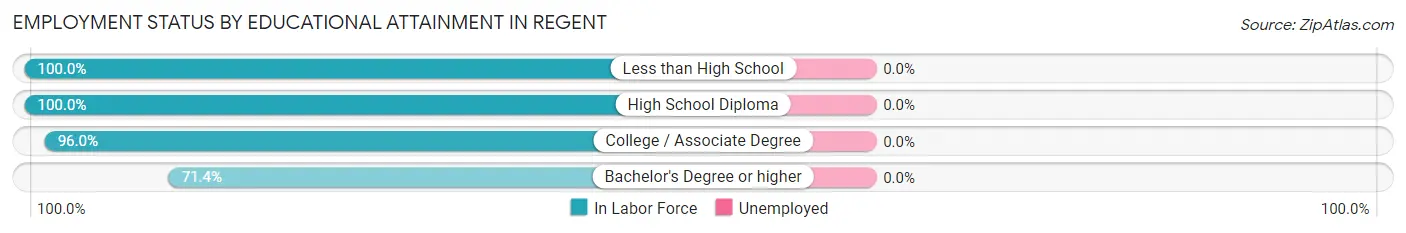
| Educational Attainment | In Labor Force | Unemployed |
| Less than High School | 12 (100.0%) | 0 (0.0%) |
| High School Diploma | 29 (100.0%) | 0 (0.0%) |
| College / Associate Degree | 24 (96.0%) | 0 (0.0%) |
| Bachelor's Degree or higher | 10 (71.4%) | 0 (0.0%) |
| Total | 75 (93.8%) | 0 (0.0%) |
Employment Occupations by Sex in Regent
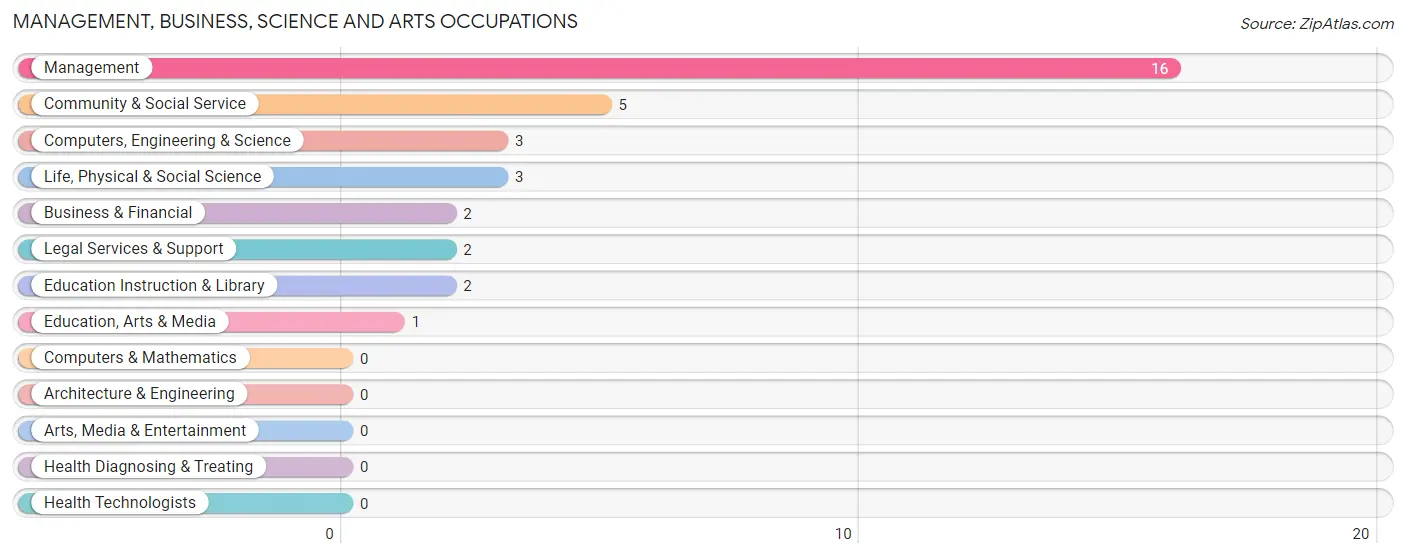
Management, Business, Science and Arts Occupations
The most common Management, Business, Science and Arts occupations in Regent are Management (16 | 17.6%), Community & Social Service (5 | 5.5%), Computers, Engineering & Science (3 | 3.3%), Life, Physical & Social Science (3 | 3.3%), and Business & Financial (2 | 2.2%).
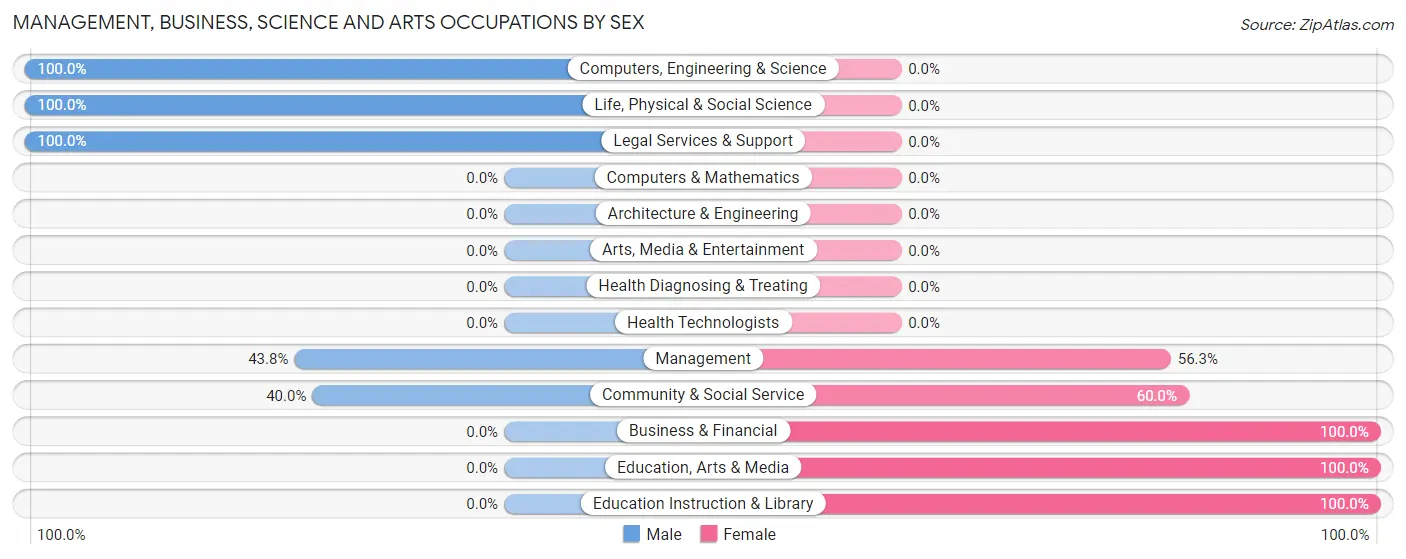
Management, Business, Science and Arts Occupations by Sex
Within the Management, Business, Science and Arts occupations in Regent, the most male-oriented occupations are Computers, Engineering & Science (100.0%), Life, Physical & Social Science (100.0%), and Legal Services & Support (100.0%), while the most female-oriented occupations are Business & Financial (100.0%), Education, Arts & Media (100.0%), and Education Instruction & Library (100.0%).
| Occupation | Male | Female |
| Management | 7 (43.8%) | 9 (56.2%) |
| Business & Financial | 0 (0.0%) | 2 (100.0%) |
| Computers, Engineering & Science | 3 (100.0%) | 0 (0.0%) |
| Computers & Mathematics | 0 (0.0%) | 0 (0.0%) |
| Architecture & Engineering | 0 (0.0%) | 0 (0.0%) |
| Life, Physical & Social Science | 3 (100.0%) | 0 (0.0%) |
| Community & Social Service | 2 (40.0%) | 3 (60.0%) |
| Education, Arts & Media | 0 (0.0%) | 1 (100.0%) |
| Legal Services & Support | 2 (100.0%) | 0 (0.0%) |
| Education Instruction & Library | 0 (0.0%) | 2 (100.0%) |
| Arts, Media & Entertainment | 0 (0.0%) | 0 (0.0%) |
| Health Diagnosing & Treating | 0 (0.0%) | 0 (0.0%) |
| Health Technologists | 0 (0.0%) | 0 (0.0%) |
| Total (Category) | 12 (46.2%) | 14 (53.8%) |
| Total (Overall) | 50 (54.9%) | 41 (45.1%) |
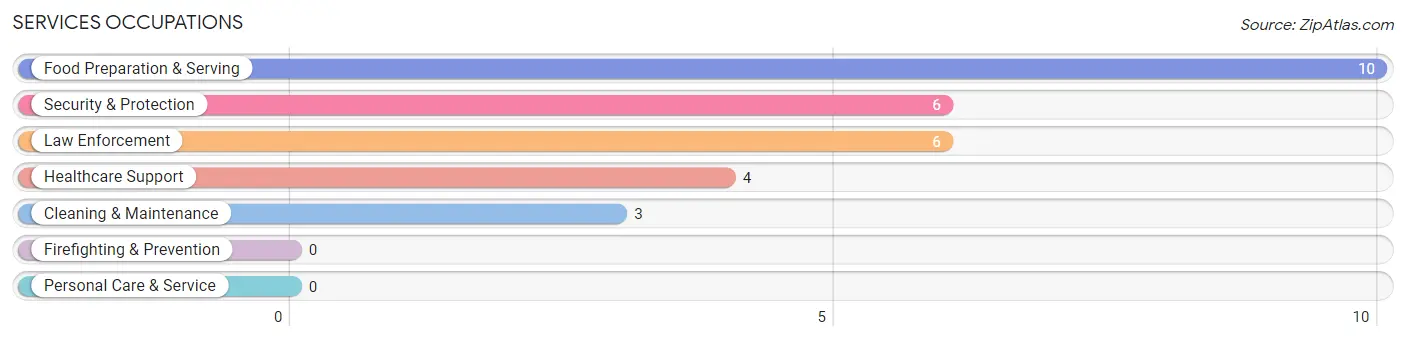
Services Occupations
The most common Services occupations in Regent are Food Preparation & Serving (10 | 11.0%), Security & Protection (6 | 6.6%), Law Enforcement (6 | 6.6%), Healthcare Support (4 | 4.4%), and Cleaning & Maintenance (3 | 3.3%).
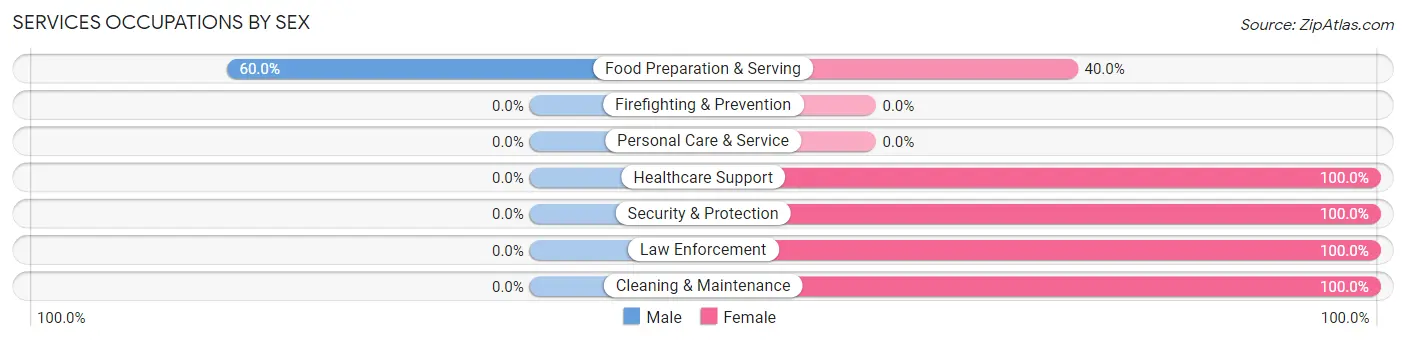
Services Occupations by Sex
| Occupation | Male | Female |
| Healthcare Support | 0 (0.0%) | 4 (100.0%) |
| Security & Protection | 0 (0.0%) | 6 (100.0%) |
| Firefighting & Prevention | 0 (0.0%) | 0 (0.0%) |
| Law Enforcement | 0 (0.0%) | 6 (100.0%) |
| Food Preparation & Serving | 6 (60.0%) | 4 (40.0%) |
| Cleaning & Maintenance | 0 (0.0%) | 3 (100.0%) |
| Personal Care & Service | 0 (0.0%) | 0 (0.0%) |
| Total (Category) | 6 (26.1%) | 17 (73.9%) |
| Total (Overall) | 50 (54.9%) | 41 (45.1%) |
Sales and Office Occupations
The most common Sales and Office occupations in Regent are Office & Administration (6 | 6.6%), and Sales & Related (3 | 3.3%).
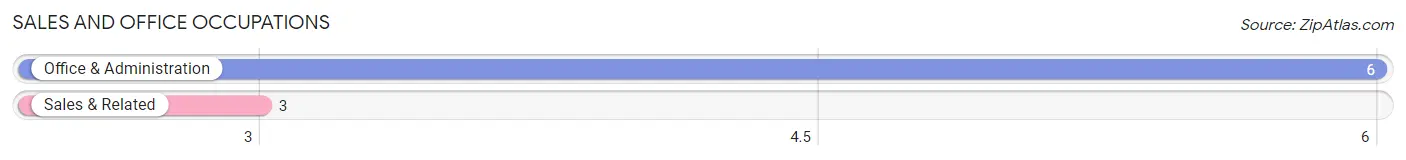
Sales and Office Occupations by Sex
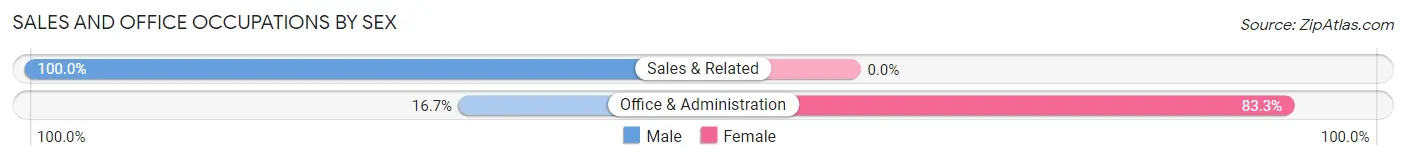
| Occupation | Male | Female |
| Sales & Related | 3 (100.0%) | 0 (0.0%) |
| Office & Administration | 1 (16.7%) | 5 (83.3%) |
| Total (Category) | 4 (44.4%) | 5 (55.6%) |
| Total (Overall) | 50 (54.9%) | 41 (45.1%) |
Natural Resources, Construction and Maintenance Occupations
The most common Natural Resources, Construction and Maintenance occupations in Regent are Construction & Extraction (14 | 15.4%), and Farming, Fishing & Forestry (2 | 2.2%).
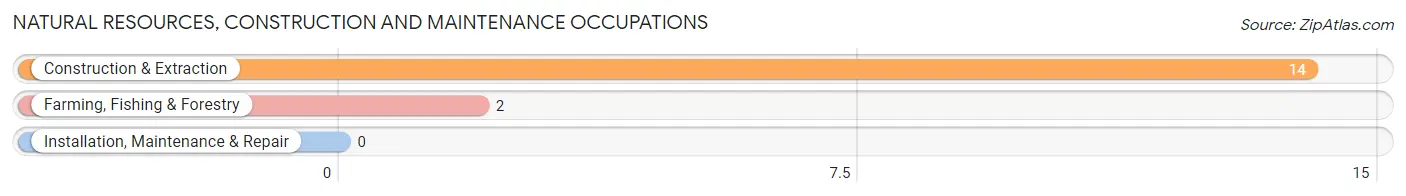
Natural Resources, Construction and Maintenance Occupations by Sex
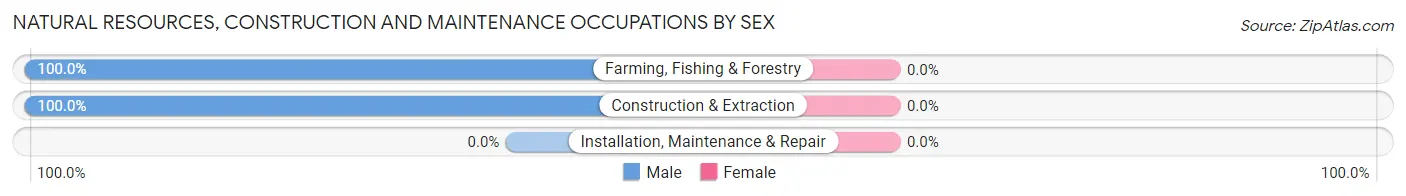
| Occupation | Male | Female |
| Farming, Fishing & Forestry | 2 (100.0%) | 0 (0.0%) |
| Construction & Extraction | 14 (100.0%) | 0 (0.0%) |
| Installation, Maintenance & Repair | 0 (0.0%) | 0 (0.0%) |
| Total (Category) | 16 (100.0%) | 0 (0.0%) |
| Total (Overall) | 50 (54.9%) | 41 (45.1%) |
Production, Transportation and Moving Occupations
The most common Production, Transportation and Moving occupations in Regent are Production (9 | 9.9%), Transportation (4 | 4.4%), and Material Moving (4 | 4.4%).
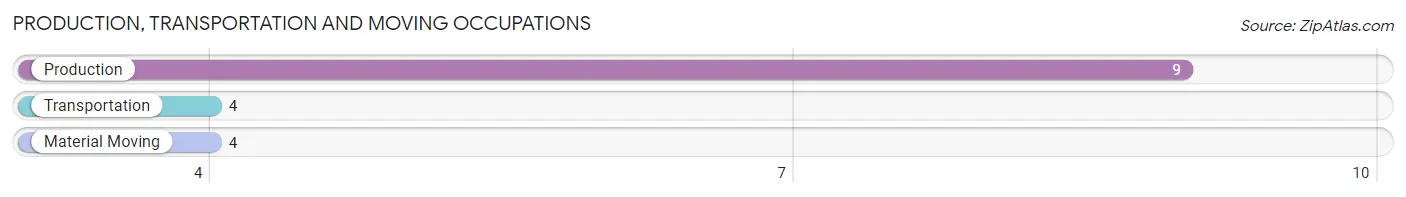
Production, Transportation and Moving Occupations by Sex
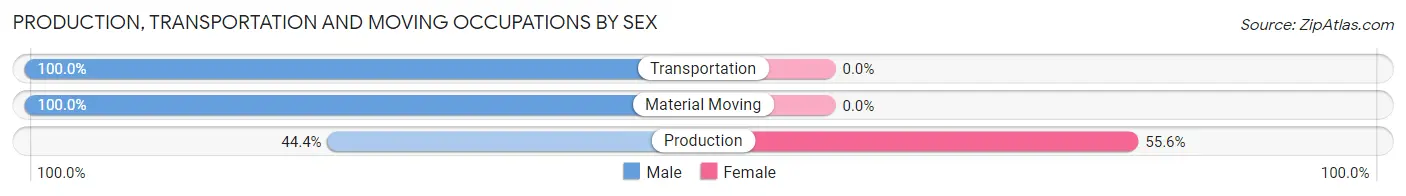
| Occupation | Male | Female |
| Production | 4 (44.4%) | 5 (55.6%) |
| Transportation | 4 (100.0%) | 0 (0.0%) |
| Material Moving | 4 (100.0%) | 0 (0.0%) |
| Total (Category) | 12 (70.6%) | 5 (29.4%) |
| Total (Overall) | 50 (54.9%) | 41 (45.1%) |
Employment Industries by Sex in Regent
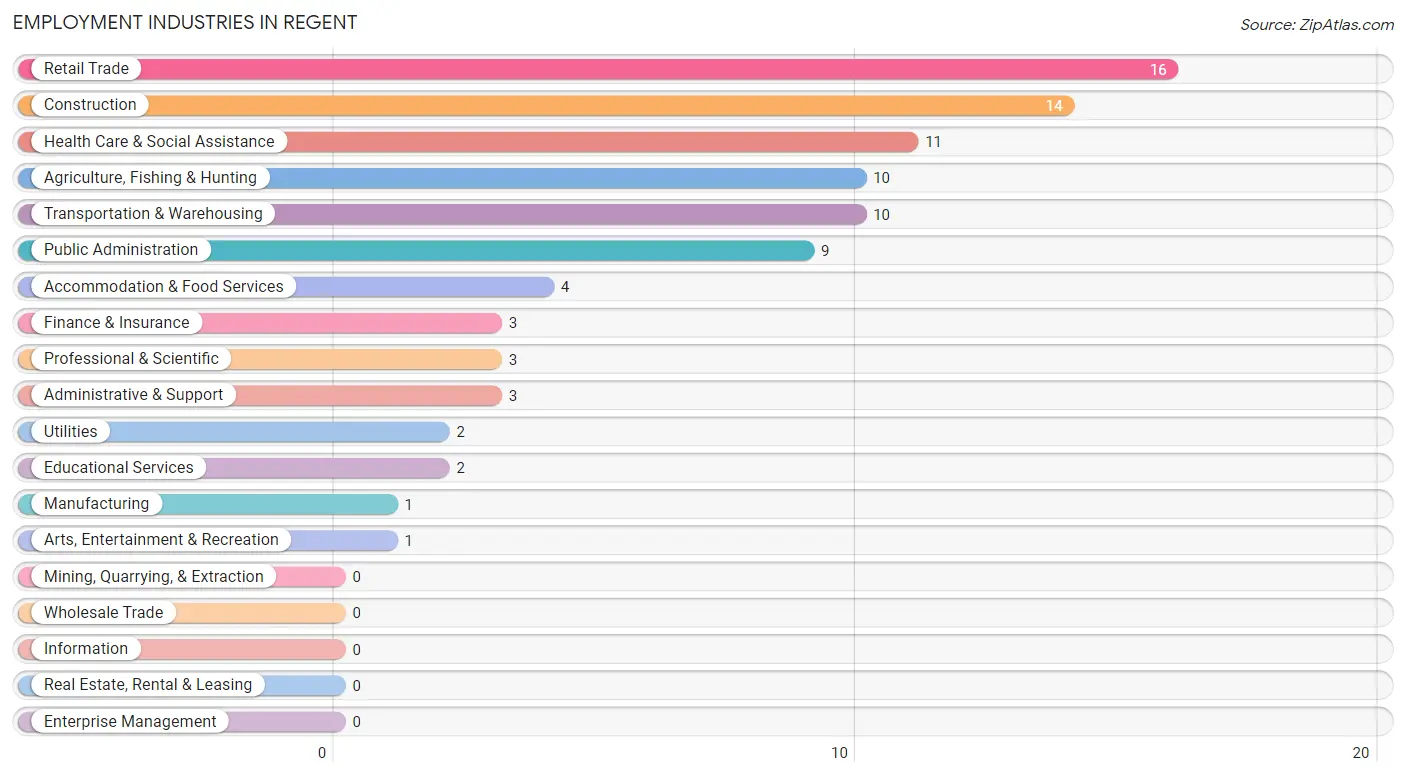
Employment Industries in Regent
The major employment industries in Regent include Retail Trade (16 | 17.6%), Construction (14 | 15.4%), Health Care & Social Assistance (11 | 12.1%), Agriculture, Fishing & Hunting (10 | 11.0%), and Transportation & Warehousing (10 | 11.0%).
Employment Industries by Sex in Regent
The Regent industries that see more men than women are Construction (100.0%), Utilities (100.0%), and Professional & Scientific (100.0%), whereas the industries that tend to have a higher number of women are Manufacturing (100.0%), Administrative & Support (100.0%), and Educational Services (100.0%).
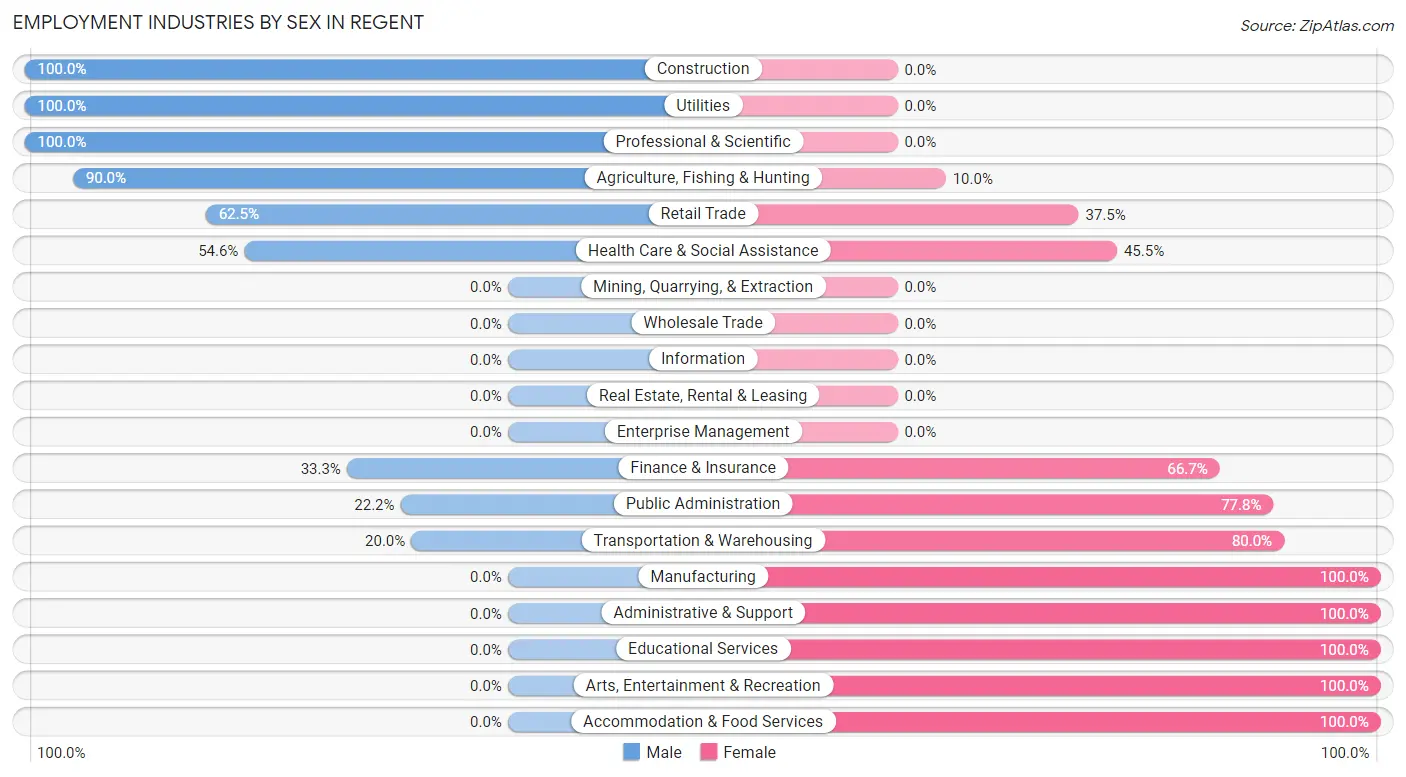
| Industry | Male | Female |
| Agriculture, Fishing & Hunting | 9 (90.0%) | 1 (10.0%) |
| Mining, Quarrying, & Extraction | 0 (0.0%) | 0 (0.0%) |
| Construction | 14 (100.0%) | 0 (0.0%) |
| Manufacturing | 0 (0.0%) | 1 (100.0%) |
| Wholesale Trade | 0 (0.0%) | 0 (0.0%) |
| Retail Trade | 10 (62.5%) | 6 (37.5%) |
| Transportation & Warehousing | 2 (20.0%) | 8 (80.0%) |
| Utilities | 2 (100.0%) | 0 (0.0%) |
| Information | 0 (0.0%) | 0 (0.0%) |
| Finance & Insurance | 1 (33.3%) | 2 (66.7%) |
| Real Estate, Rental & Leasing | 0 (0.0%) | 0 (0.0%) |
| Professional & Scientific | 3 (100.0%) | 0 (0.0%) |
| Enterprise Management | 0 (0.0%) | 0 (0.0%) |
| Administrative & Support | 0 (0.0%) | 3 (100.0%) |
| Educational Services | 0 (0.0%) | 2 (100.0%) |
| Health Care & Social Assistance | 6 (54.5%) | 5 (45.5%) |
| Arts, Entertainment & Recreation | 0 (0.0%) | 1 (100.0%) |
| Accommodation & Food Services | 0 (0.0%) | 4 (100.0%) |
| Public Administration | 2 (22.2%) | 7 (77.8%) |
| Total | 50 (54.9%) | 41 (45.1%) |
Education in Regent
School Enrollment in Regent
The most common levels of schooling among the 19 students in Regent are high school (9 | 47.4%), elementary school (6 | 31.6%), and kindergarten (4 | 21.0%).
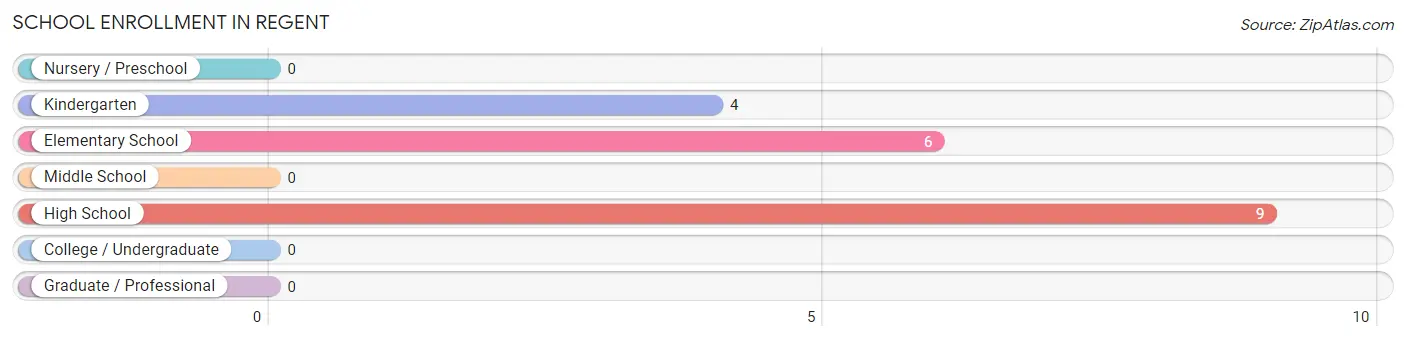
| School Level | # Students | % Students |
| Nursery / Preschool | 0 | 0.0% |
| Kindergarten | 4 | 21.0% |
| Elementary School | 6 | 31.6% |
| Middle School | 0 | 0.0% |
| High School | 9 | 47.4% |
| College / Undergraduate | 0 | 0.0% |
| Graduate / Professional | 0 | 0.0% |
| Total | 19 | 100.0% |
School Enrollment by Age by Funding Source in Regent
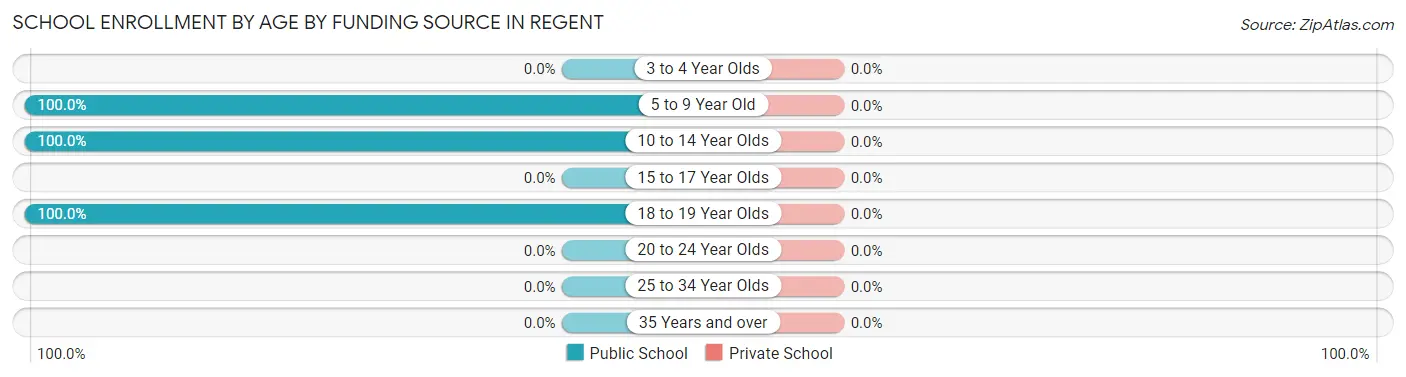
| Age Bracket | Public School | Private School |
| 3 to 4 Year Olds | 0 (0.0%) | 0 (0.0%) |
| 5 to 9 Year Old | 10 (100.0%) | 0 (0.0%) |
| 10 to 14 Year Olds | 5 (100.0%) | 0 (0.0%) |
| 15 to 17 Year Olds | 0 (0.0%) | 0 (0.0%) |
| 18 to 19 Year Olds | 4 (100.0%) | 0 (0.0%) |
| 20 to 24 Year Olds | 0 (0.0%) | 0 (0.0%) |
| 25 to 34 Year Olds | 0 (0.0%) | 0 (0.0%) |
| 35 Years and over | 0 (0.0%) | 0 (0.0%) |
| Total | 19 (100.0%) | 0 (0.0%) |
Educational Attainment by Field of Study in Regent
Computers & mathematics (8 | 27.6%), bio, nature & agricultural (5 | 17.2%), business (4 | 13.8%), arts & humanities (4 | 13.8%), and education (3 | 10.3%) are the most common fields of study among 29 individuals in Regent who have obtained a bachelor's degree or higher.
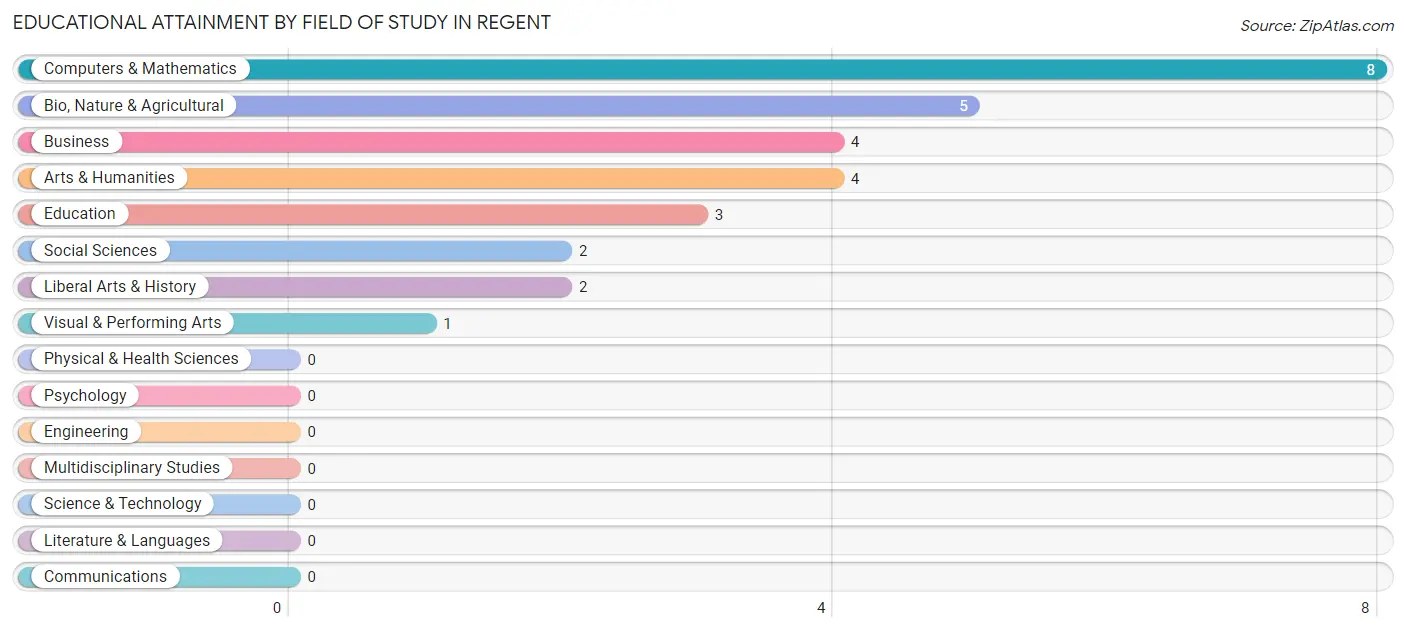
| Field of Study | # Graduates | % Graduates |
| Computers & Mathematics | 8 | 27.6% |
| Bio, Nature & Agricultural | 5 | 17.2% |
| Physical & Health Sciences | 0 | 0.0% |
| Psychology | 0 | 0.0% |
| Social Sciences | 2 | 6.9% |
| Engineering | 0 | 0.0% |
| Multidisciplinary Studies | 0 | 0.0% |
| Science & Technology | 0 | 0.0% |
| Business | 4 | 13.8% |
| Education | 3 | 10.3% |
| Literature & Languages | 0 | 0.0% |
| Liberal Arts & History | 2 | 6.9% |
| Visual & Performing Arts | 1 | 3.5% |
| Communications | 0 | 0.0% |
| Arts & Humanities | 4 | 13.8% |
| Total | 29 | 100.0% |
Transportation & Commute in Regent
Vehicle Availability by Sex in Regent
The most prevalent vehicle ownership categories in Regent are males with 2 vehicles (20, accounting for 40.0%) and females with 2 vehicles (9, making up 54.0%).
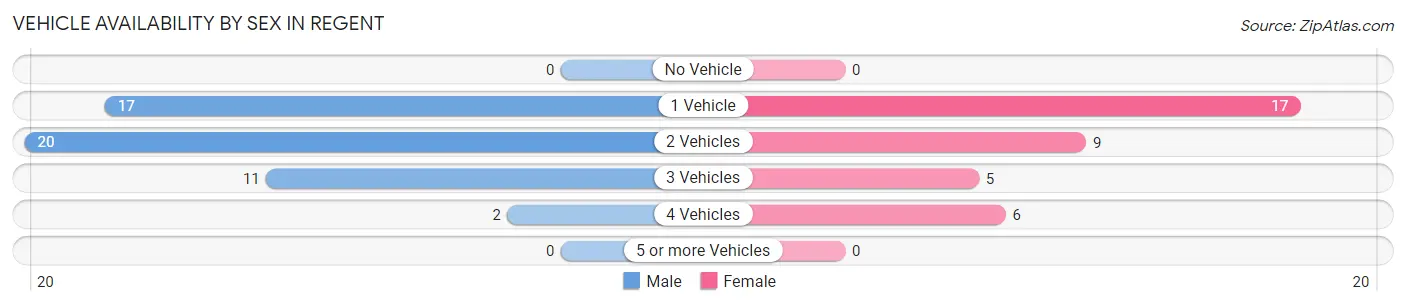
| Vehicles Available | Male | Female |
| No Vehicle | 0 (0.0%) | 0 (0.0%) |
| 1 Vehicle | 17 (34.0%) | 17 (46.0%) |
| 2 Vehicles | 20 (40.0%) | 9 (24.3%) |
| 3 Vehicles | 11 (22.0%) | 5 (13.5%) |
| 4 Vehicles | 2 (4.0%) | 6 (16.2%) |
| 5 or more Vehicles | 0 (0.0%) | 0 (0.0%) |
| Total | 50 (100.0%) | 37 (100.0%) |
Commute Time in Regent
The most frequently occuring commute durations in Regent are less than 5 minutes (30 commuters, 34.5%), 15 to 19 minutes (16 commuters, 18.4%), and 60 to 89 minutes (10 commuters, 11.5%).
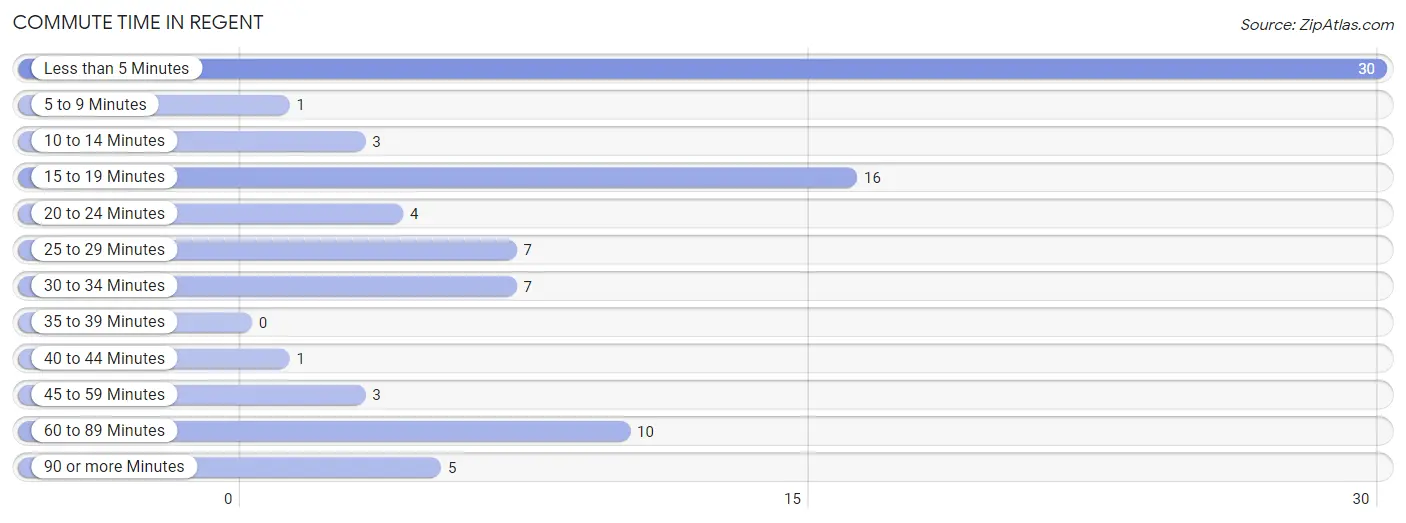
| Commute Time | # Commuters | % Commuters |
| Less than 5 Minutes | 30 | 34.5% |
| 5 to 9 Minutes | 1 | 1.1% |
| 10 to 14 Minutes | 3 | 3.5% |
| 15 to 19 Minutes | 16 | 18.4% |
| 20 to 24 Minutes | 4 | 4.6% |
| 25 to 29 Minutes | 7 | 8.1% |
| 30 to 34 Minutes | 7 | 8.1% |
| 35 to 39 Minutes | 0 | 0.0% |
| 40 to 44 Minutes | 1 | 1.1% |
| 45 to 59 Minutes | 3 | 3.5% |
| 60 to 89 Minutes | 10 | 11.5% |
| 90 or more Minutes | 5 | 5.8% |
Commute Time by Sex in Regent
The most common commute times in Regent are less than 5 minutes (15 commuters, 30.0%) for males and less than 5 minutes (15 commuters, 40.5%) for females.
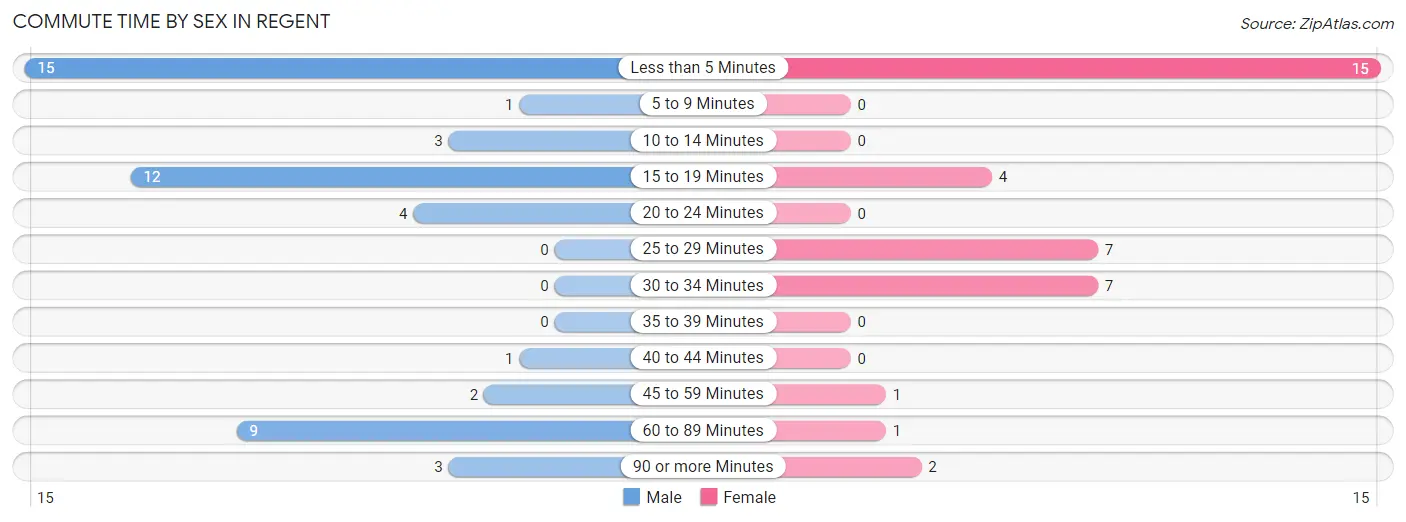
| Commute Time | Male | Female |
| Less than 5 Minutes | 15 (30.0%) | 15 (40.5%) |
| 5 to 9 Minutes | 1 (2.0%) | 0 (0.0%) |
| 10 to 14 Minutes | 3 (6.0%) | 0 (0.0%) |
| 15 to 19 Minutes | 12 (24.0%) | 4 (10.8%) |
| 20 to 24 Minutes | 4 (8.0%) | 0 (0.0%) |
| 25 to 29 Minutes | 0 (0.0%) | 7 (18.9%) |
| 30 to 34 Minutes | 0 (0.0%) | 7 (18.9%) |
| 35 to 39 Minutes | 0 (0.0%) | 0 (0.0%) |
| 40 to 44 Minutes | 1 (2.0%) | 0 (0.0%) |
| 45 to 59 Minutes | 2 (4.0%) | 1 (2.7%) |
| 60 to 89 Minutes | 9 (18.0%) | 1 (2.7%) |
| 90 or more Minutes | 3 (6.0%) | 2 (5.4%) |
Time of Departure to Work by Sex in Regent
The most frequent times of departure to work in Regent are 6:00 AM to 6:29 AM (15, 30.0%) for males and 6:30 AM to 6:59 AM (10, 27.0%) for females.
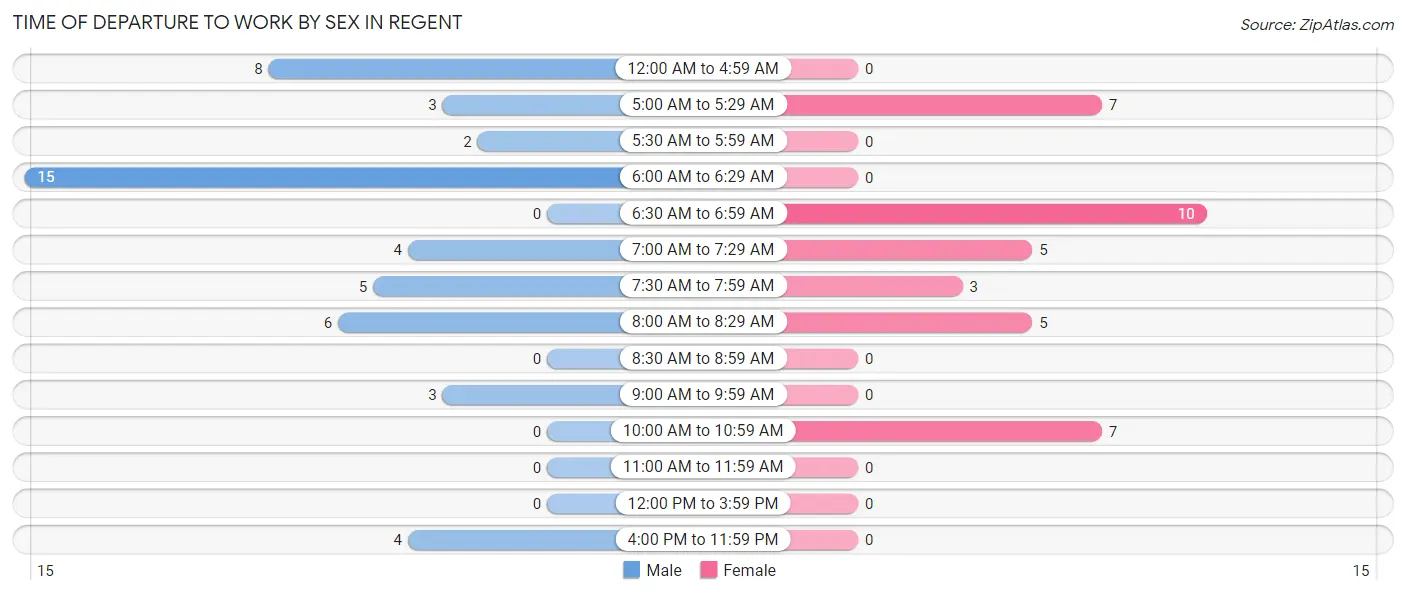
| Time of Departure | Male | Female |
| 12:00 AM to 4:59 AM | 8 (16.0%) | 0 (0.0%) |
| 5:00 AM to 5:29 AM | 3 (6.0%) | 7 (18.9%) |
| 5:30 AM to 5:59 AM | 2 (4.0%) | 0 (0.0%) |
| 6:00 AM to 6:29 AM | 15 (30.0%) | 0 (0.0%) |
| 6:30 AM to 6:59 AM | 0 (0.0%) | 10 (27.0%) |
| 7:00 AM to 7:29 AM | 4 (8.0%) | 5 (13.5%) |
| 7:30 AM to 7:59 AM | 5 (10.0%) | 3 (8.1%) |
| 8:00 AM to 8:29 AM | 6 (12.0%) | 5 (13.5%) |
| 8:30 AM to 8:59 AM | 0 (0.0%) | 0 (0.0%) |
| 9:00 AM to 9:59 AM | 3 (6.0%) | 0 (0.0%) |
| 10:00 AM to 10:59 AM | 0 (0.0%) | 7 (18.9%) |
| 11:00 AM to 11:59 AM | 0 (0.0%) | 0 (0.0%) |
| 12:00 PM to 3:59 PM | 0 (0.0%) | 0 (0.0%) |
| 4:00 PM to 11:59 PM | 4 (8.0%) | 0 (0.0%) |
| Total | 50 (100.0%) | 37 (100.0%) |
Housing Occupancy in Regent
Occupancy by Ownership in Regent
Of the total 91 dwellings in Regent, owner-occupied units account for 69 (75.8%), while renter-occupied units make up 22 (24.2%).
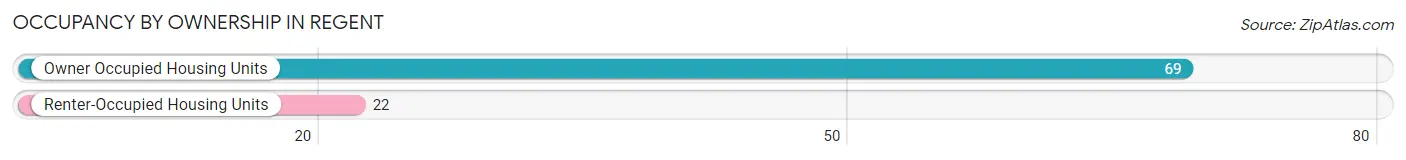
| Occupancy | # Housing Units | % Housing Units |
| Owner Occupied Housing Units | 69 | 75.8% |
| Renter-Occupied Housing Units | 22 | 24.2% |
| Total Occupied Housing Units | 91 | 100.0% |
Occupancy by Household Size in Regent
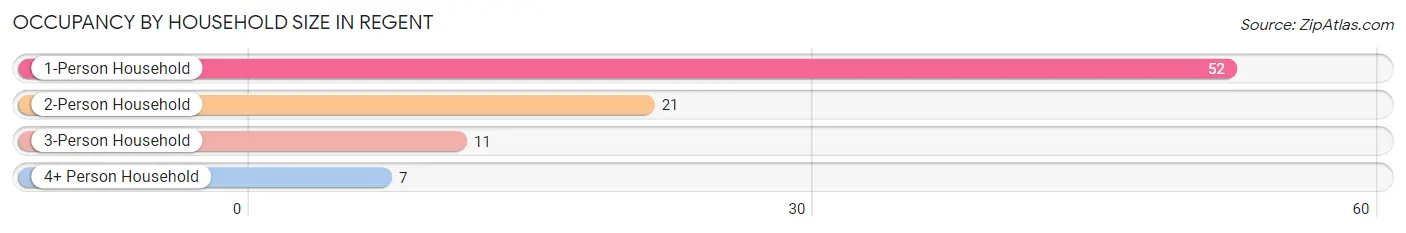
| Household Size | # Housing Units | % Housing Units |
| 1-Person Household | 52 | 57.1% |
| 2-Person Household | 21 | 23.1% |
| 3-Person Household | 11 | 12.1% |
| 4+ Person Household | 7 | 7.7% |
| Total Housing Units | 91 | 100.0% |
Occupancy by Ownership by Household Size in Regent
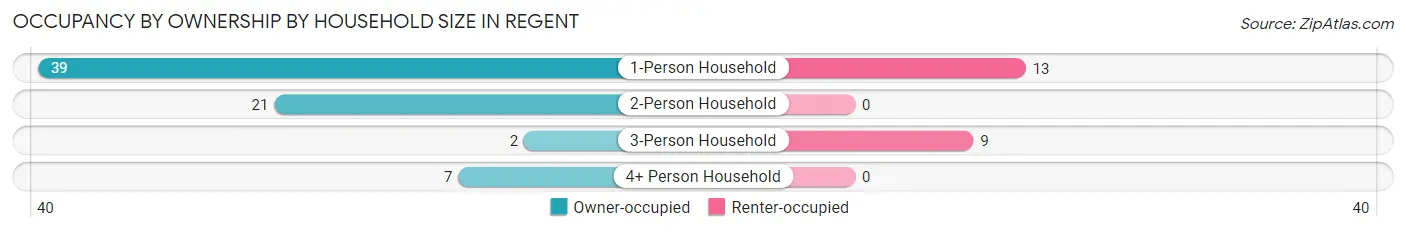
| Household Size | Owner-occupied | Renter-occupied |
| 1-Person Household | 39 (75.0%) | 13 (25.0%) |
| 2-Person Household | 21 (100.0%) | 0 (0.0%) |
| 3-Person Household | 2 (18.2%) | 9 (81.8%) |
| 4+ Person Household | 7 (100.0%) | 0 (0.0%) |
| Total Housing Units | 69 (75.8%) | 22 (24.2%) |
Occupancy by Educational Attainment in Regent
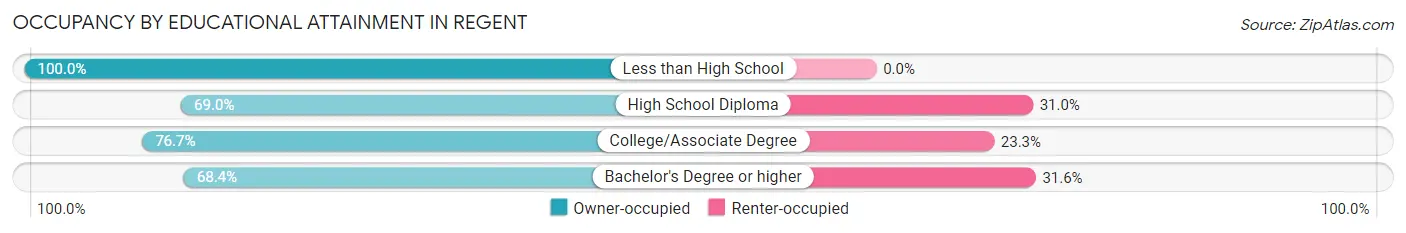
| Household Size | Owner-occupied | Renter-occupied |
| Less than High School | 13 (100.0%) | 0 (0.0%) |
| High School Diploma | 20 (69.0%) | 9 (31.0%) |
| College/Associate Degree | 23 (76.7%) | 7 (23.3%) |
| Bachelor's Degree or higher | 13 (68.4%) | 6 (31.6%) |
Occupancy by Age of Householder in Regent
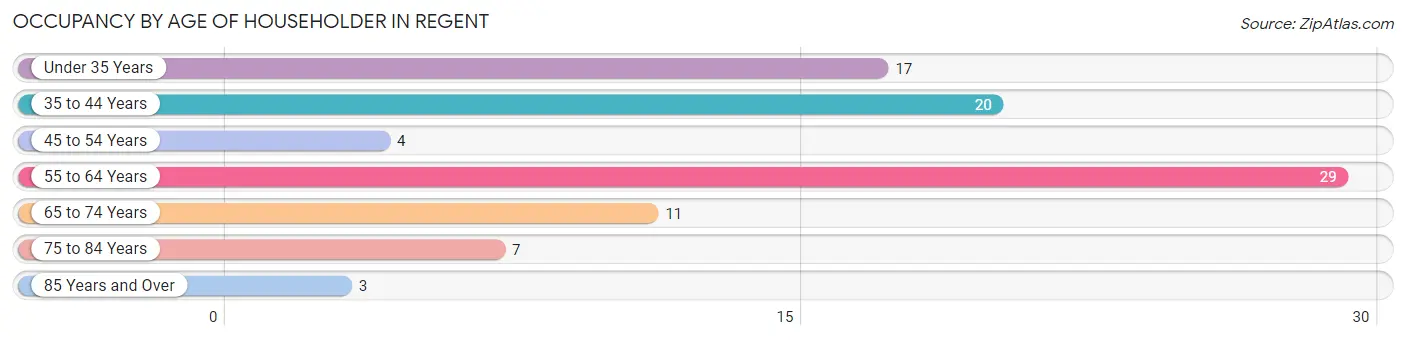
| Age Bracket | # Households | % Households |
| Under 35 Years | 17 | 18.7% |
| 35 to 44 Years | 20 | 22.0% |
| 45 to 54 Years | 4 | 4.4% |
| 55 to 64 Years | 29 | 31.9% |
| 65 to 74 Years | 11 | 12.1% |
| 75 to 84 Years | 7 | 7.7% |
| 85 Years and Over | 3 | 3.3% |
| Total | 91 | 100.0% |
Housing Finances in Regent
Median Income by Occupancy in Regent
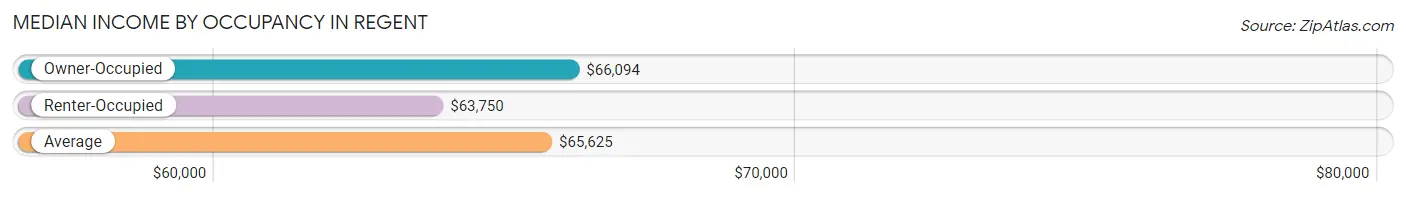
| Occupancy Type | # Households | Median Income |
| Owner-Occupied | 69 (75.8%) | $66,094 |
| Renter-Occupied | 22 (24.2%) | $63,750 |
| Average | 91 (100.0%) | $65,625 |
Occupancy by Householder Income Bracket in Regent
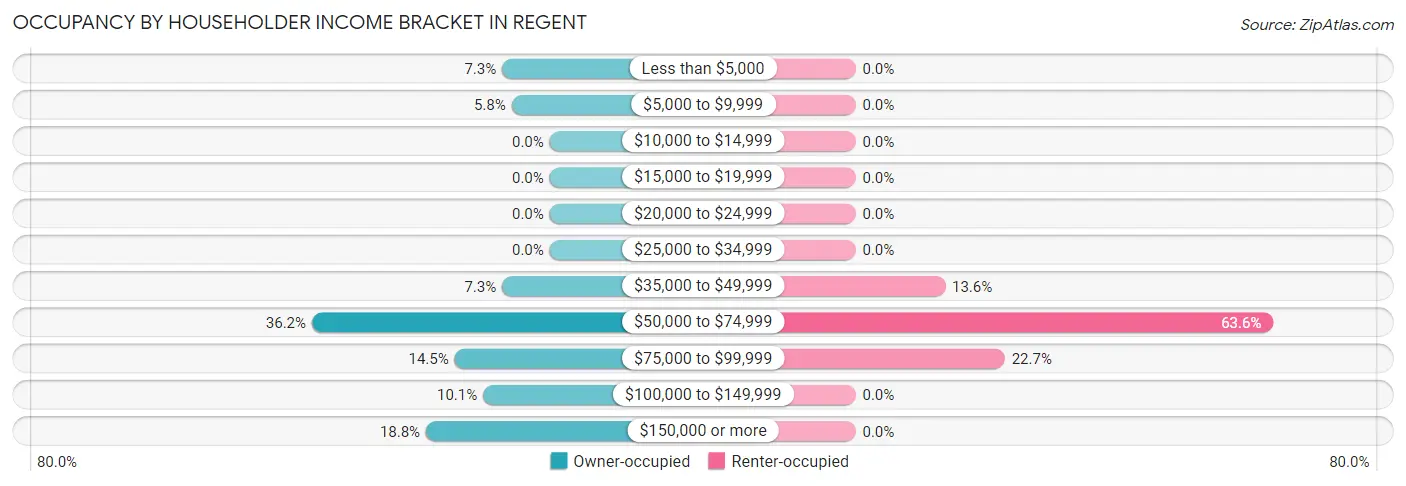
| Income Bracket | Owner-occupied | Renter-occupied |
| Less than $5,000 | 5 (7.2%) | 0 (0.0%) |
| $5,000 to $9,999 | 4 (5.8%) | 0 (0.0%) |
| $10,000 to $14,999 | 0 (0.0%) | 0 (0.0%) |
| $15,000 to $19,999 | 0 (0.0%) | 0 (0.0%) |
| $20,000 to $24,999 | 0 (0.0%) | 0 (0.0%) |
| $25,000 to $34,999 | 0 (0.0%) | 0 (0.0%) |
| $35,000 to $49,999 | 5 (7.2%) | 3 (13.6%) |
| $50,000 to $74,999 | 25 (36.2%) | 14 (63.6%) |
| $75,000 to $99,999 | 10 (14.5%) | 5 (22.7%) |
| $100,000 to $149,999 | 7 (10.1%) | 0 (0.0%) |
| $150,000 or more | 13 (18.8%) | 0 (0.0%) |
| Total | 69 (100.0%) | 22 (100.0%) |
Monthly Housing Cost Tiers in Regent
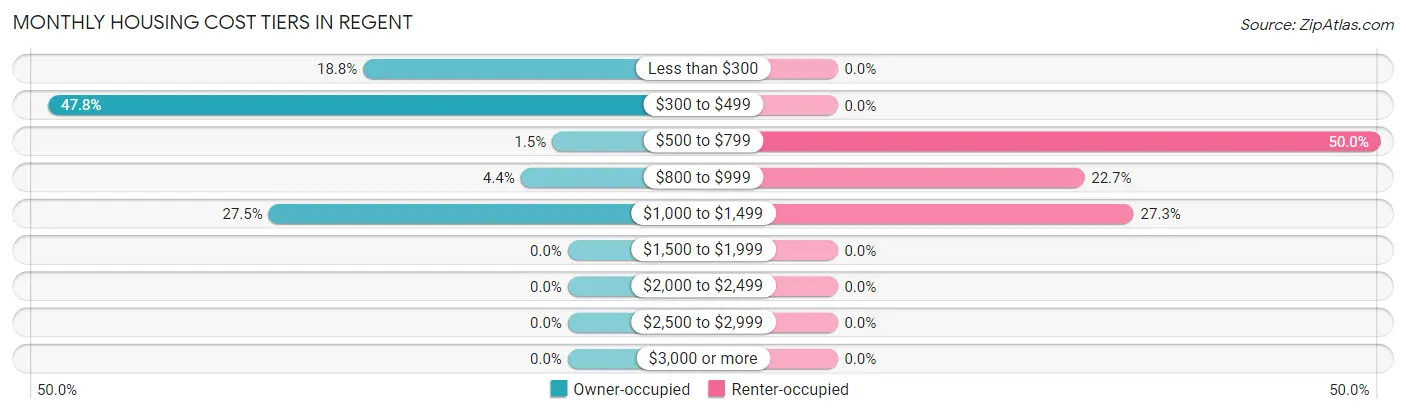
| Monthly Cost | Owner-occupied | Renter-occupied |
| Less than $300 | 13 (18.8%) | 0 (0.0%) |
| $300 to $499 | 33 (47.8%) | 0 (0.0%) |
| $500 to $799 | 1 (1.5%) | 11 (50.0%) |
| $800 to $999 | 3 (4.3%) | 5 (22.7%) |
| $1,000 to $1,499 | 19 (27.5%) | 6 (27.3%) |
| $1,500 to $1,999 | 0 (0.0%) | 0 (0.0%) |
| $2,000 to $2,499 | 0 (0.0%) | 0 (0.0%) |
| $2,500 to $2,999 | 0 (0.0%) | 0 (0.0%) |
| $3,000 or more | 0 (0.0%) | 0 (0.0%) |
| Total | 69 (100.0%) | 22 (100.0%) |
Physical Housing Characteristics in Regent
Housing Structures in Regent
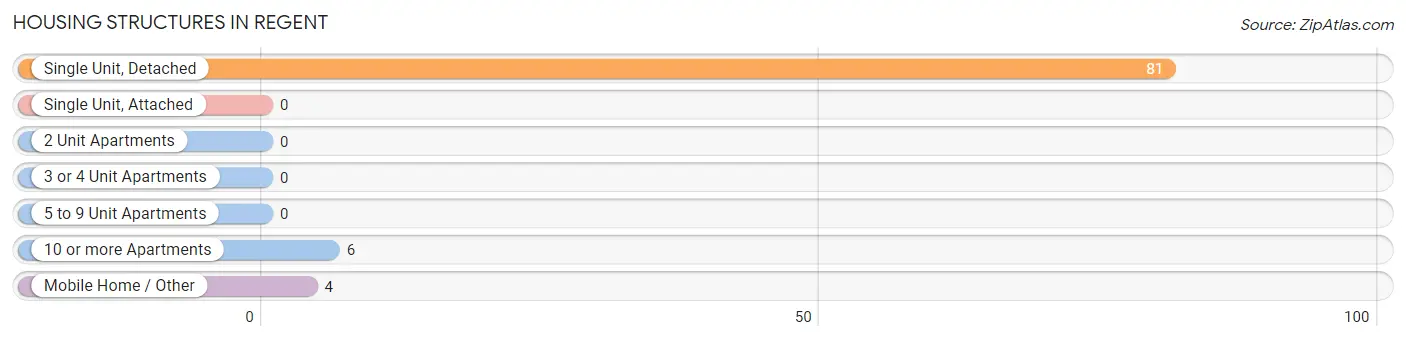
| Structure Type | # Housing Units | % Housing Units |
| Single Unit, Detached | 81 | 89.0% |
| Single Unit, Attached | 0 | 0.0% |
| 2 Unit Apartments | 0 | 0.0% |
| 3 or 4 Unit Apartments | 0 | 0.0% |
| 5 to 9 Unit Apartments | 0 | 0.0% |
| 10 or more Apartments | 6 | 6.6% |
| Mobile Home / Other | 4 | 4.4% |
| Total | 91 | 100.0% |
Housing Structures by Occupancy in Regent
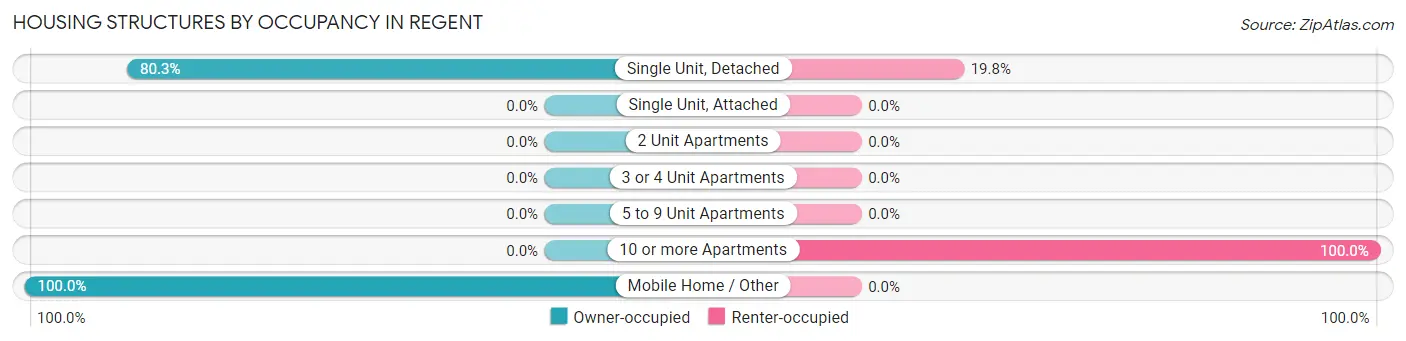
| Structure Type | Owner-occupied | Renter-occupied |
| Single Unit, Detached | 65 (80.2%) | 16 (19.8%) |
| Single Unit, Attached | 0 (0.0%) | 0 (0.0%) |
| 2 Unit Apartments | 0 (0.0%) | 0 (0.0%) |
| 3 or 4 Unit Apartments | 0 (0.0%) | 0 (0.0%) |
| 5 to 9 Unit Apartments | 0 (0.0%) | 0 (0.0%) |
| 10 or more Apartments | 0 (0.0%) | 6 (100.0%) |
| Mobile Home / Other | 4 (100.0%) | 0 (0.0%) |
| Total | 69 (75.8%) | 22 (24.2%) |
Housing Structures by Number of Rooms in Regent
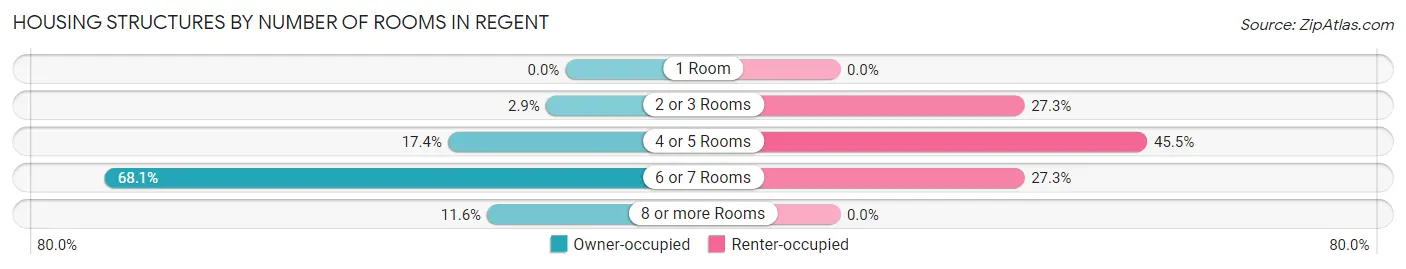
| Number of Rooms | Owner-occupied | Renter-occupied |
| 1 Room | 0 (0.0%) | 0 (0.0%) |
| 2 or 3 Rooms | 2 (2.9%) | 6 (27.3%) |
| 4 or 5 Rooms | 12 (17.4%) | 10 (45.5%) |
| 6 or 7 Rooms | 47 (68.1%) | 6 (27.3%) |
| 8 or more Rooms | 8 (11.6%) | 0 (0.0%) |
| Total | 69 (100.0%) | 22 (100.0%) |
Housing Structure by Heating Type in Regent
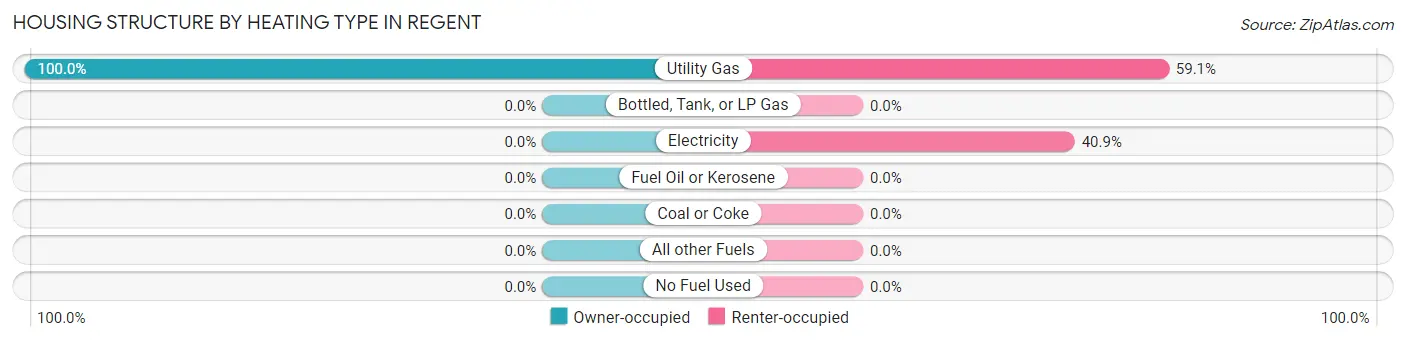
| Heating Type | Owner-occupied | Renter-occupied |
| Utility Gas | 69 (100.0%) | 13 (59.1%) |
| Bottled, Tank, or LP Gas | 0 (0.0%) | 0 (0.0%) |
| Electricity | 0 (0.0%) | 9 (40.9%) |
| Fuel Oil or Kerosene | 0 (0.0%) | 0 (0.0%) |
| Coal or Coke | 0 (0.0%) | 0 (0.0%) |
| All other Fuels | 0 (0.0%) | 0 (0.0%) |
| No Fuel Used | 0 (0.0%) | 0 (0.0%) |
| Total | 69 (100.0%) | 22 (100.0%) |
Household Vehicle Usage in Regent
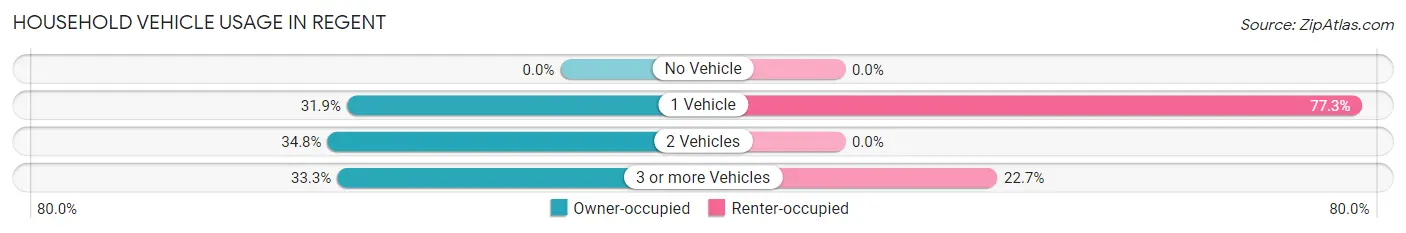
| Vehicles per Household | Owner-occupied | Renter-occupied |
| No Vehicle | 0 (0.0%) | 0 (0.0%) |
| 1 Vehicle | 22 (31.9%) | 17 (77.3%) |
| 2 Vehicles | 24 (34.8%) | 0 (0.0%) |
| 3 or more Vehicles | 23 (33.3%) | 5 (22.7%) |
| Total | 69 (100.0%) | 22 (100.0%) |
Real Estate & Mortgages in Regent
Real Estate and Mortgage Overview in Regent
| Characteristic | Without Mortgage | With Mortgage |
| Housing Units | 48 | 21 |
| Median Property Value | $54,300 | $0 |
| Median Household Income | $67,188 | $5 |
| Monthly Housing Costs | $326 | $0 |
| Real Estate Taxes | $1,068 | $0 |
Property Value by Mortgage Status in Regent
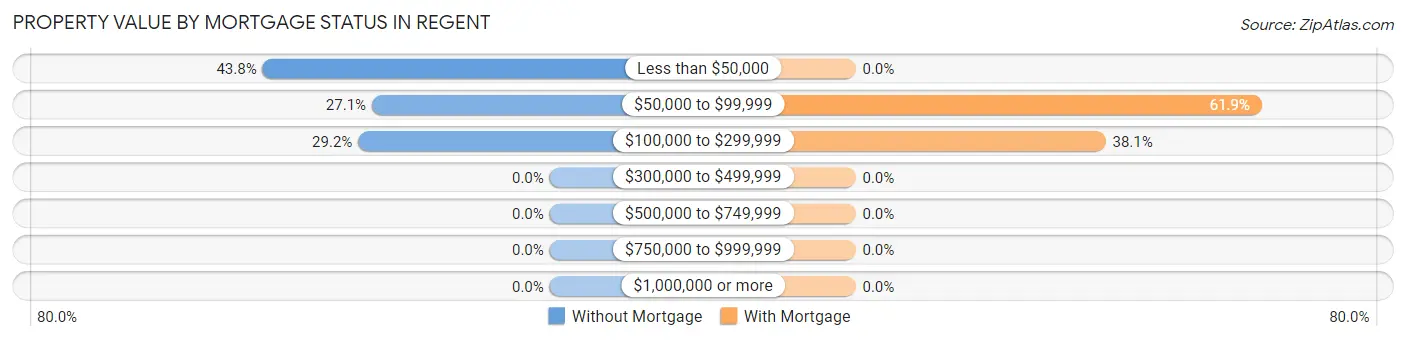
| Property Value | Without Mortgage | With Mortgage |
| Less than $50,000 | 21 (43.8%) | 0 (0.0%) |
| $50,000 to $99,999 | 13 (27.1%) | 13 (61.9%) |
| $100,000 to $299,999 | 14 (29.2%) | 8 (38.1%) |
| $300,000 to $499,999 | 0 (0.0%) | 0 (0.0%) |
| $500,000 to $749,999 | 0 (0.0%) | 0 (0.0%) |
| $750,000 to $999,999 | 0 (0.0%) | 0 (0.0%) |
| $1,000,000 or more | 0 (0.0%) | 0 (0.0%) |
| Total | 48 (100.0%) | 21 (100.0%) |
Household Income by Mortgage Status in Regent
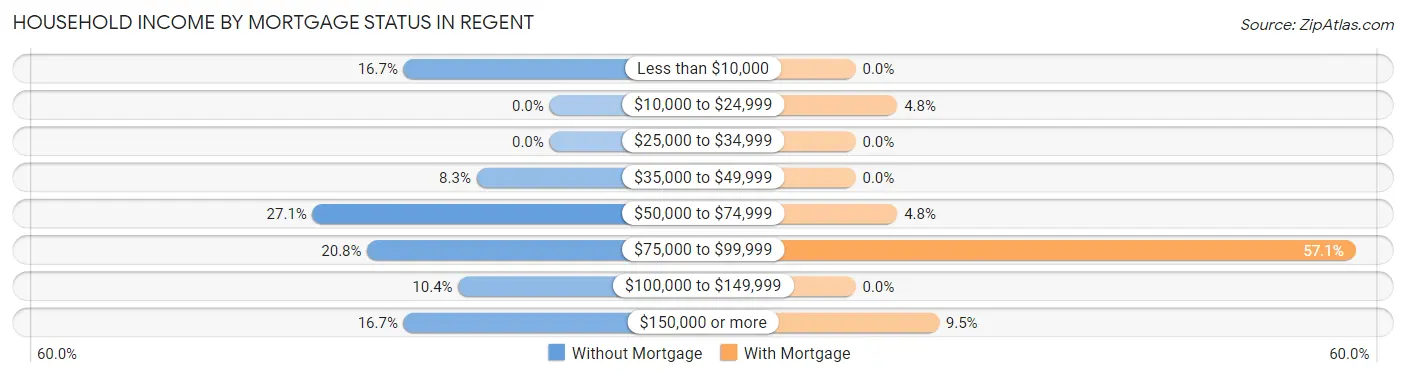
| Household Income | Without Mortgage | With Mortgage |
| Less than $10,000 | 8 (16.7%) | 0 (0.0%) |
| $10,000 to $24,999 | 0 (0.0%) | 1 (4.8%) |
| $25,000 to $34,999 | 0 (0.0%) | 0 (0.0%) |
| $35,000 to $49,999 | 4 (8.3%) | 0 (0.0%) |
| $50,000 to $74,999 | 13 (27.1%) | 1 (4.8%) |
| $75,000 to $99,999 | 10 (20.8%) | 12 (57.1%) |
| $100,000 to $149,999 | 5 (10.4%) | 0 (0.0%) |
| $150,000 or more | 8 (16.7%) | 2 (9.5%) |
| Total | 48 (100.0%) | 21 (100.0%) |
Property Value to Household Income Ratio in Regent
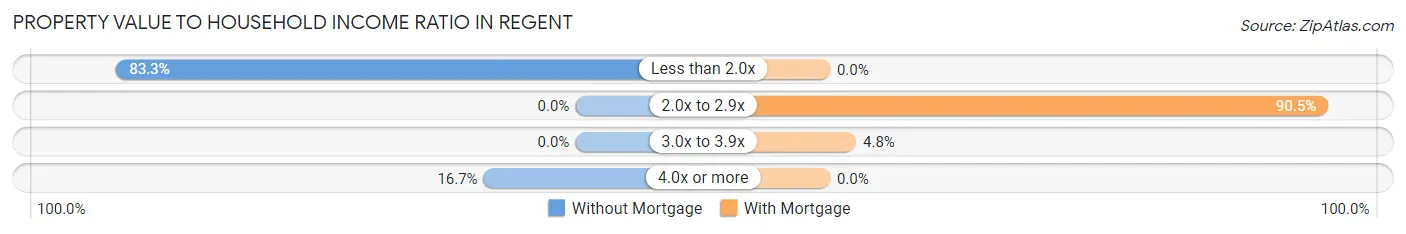
| Value-to-Income Ratio | Without Mortgage | With Mortgage |
| Less than 2.0x | 40 (83.3%) | 0 (0.0%) |
| 2.0x to 2.9x | 0 (0.0%) | 19 (90.5%) |
| 3.0x to 3.9x | 0 (0.0%) | 1 (4.8%) |
| 4.0x or more | 8 (16.7%) | 0 (0.0%) |
| Total | 48 (100.0%) | 21 (100.0%) |
Real Estate Taxes by Mortgage Status in Regent
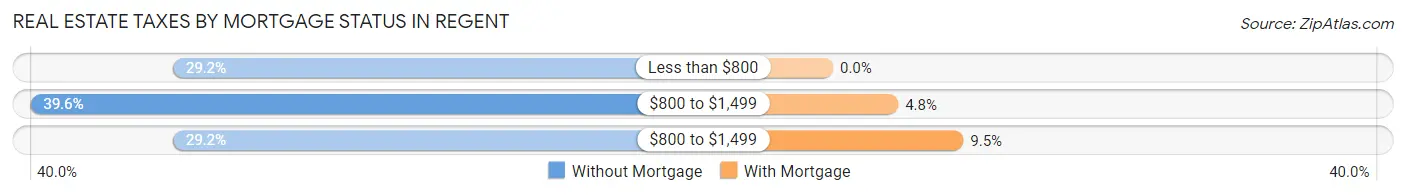
| Property Taxes | Without Mortgage | With Mortgage |
| Less than $800 | 14 (29.2%) | 0 (0.0%) |
| $800 to $1,499 | 19 (39.6%) | 1 (4.8%) |
| $800 to $1,499 | 14 (29.2%) | 2 (9.5%) |
| Total | 48 (100.0%) | 21 (100.0%) |
Health & Disability in Regent
Health Insurance Coverage by Age in Regent
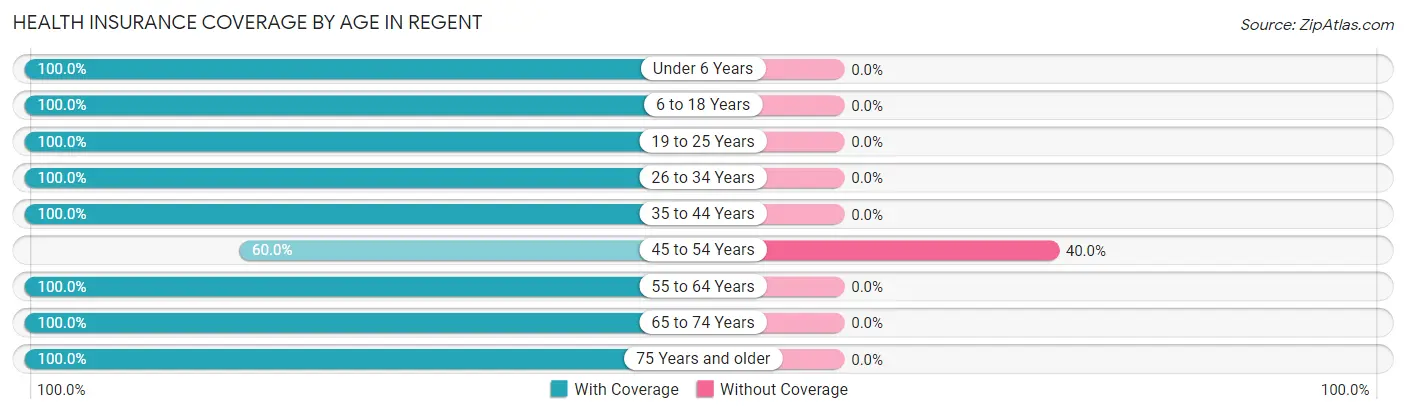
| Age Bracket | With Coverage | Without Coverage |
| Under 6 Years | 12 (100.0%) | 0 (0.0%) |
| 6 to 18 Years | 19 (100.0%) | 0 (0.0%) |
| 19 to 25 Years | 4 (100.0%) | 0 (0.0%) |
| 26 to 34 Years | 21 (100.0%) | 0 (0.0%) |
| 35 to 44 Years | 20 (100.0%) | 0 (0.0%) |
| 45 to 54 Years | 3 (60.0%) | 2 (40.0%) |
| 55 to 64 Years | 34 (100.0%) | 0 (0.0%) |
| 65 to 74 Years | 19 (100.0%) | 0 (0.0%) |
| 75 Years and older | 15 (100.0%) | 0 (0.0%) |
| Total | 147 (98.7%) | 2 (1.3%) |
Health Insurance Coverage by Citizenship Status in Regent
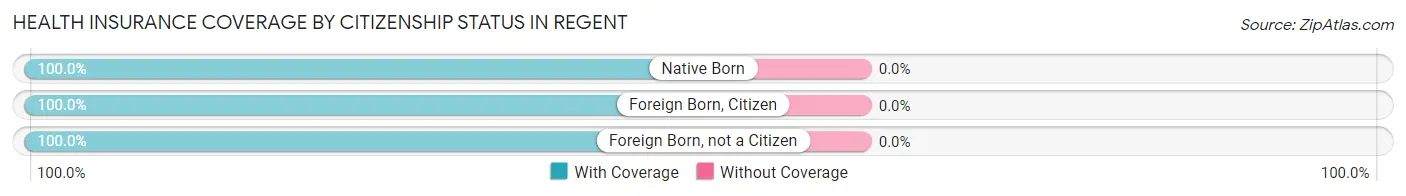
| Citizenship Status | With Coverage | Without Coverage |
| Native Born | 12 (100.0%) | 0 (0.0%) |
| Foreign Born, Citizen | 19 (100.0%) | 0 (0.0%) |
| Foreign Born, not a Citizen | 4 (100.0%) | 0 (0.0%) |
Health Insurance Coverage by Household Income in Regent
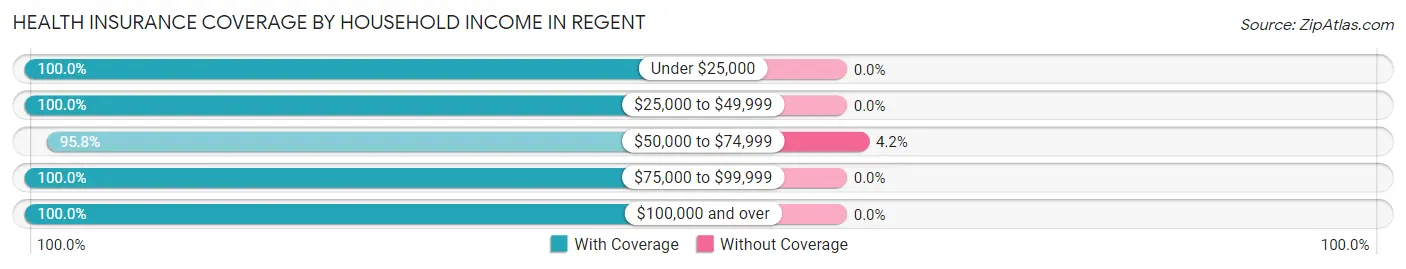
| Household Income | With Coverage | Without Coverage |
| Under $25,000 | 22 (100.0%) | 0 (0.0%) |
| $25,000 to $49,999 | 15 (100.0%) | 0 (0.0%) |
| $50,000 to $74,999 | 46 (95.8%) | 2 (4.2%) |
| $75,000 to $99,999 | 22 (100.0%) | 0 (0.0%) |
| $100,000 and over | 42 (100.0%) | 0 (0.0%) |
Public vs Private Health Insurance Coverage by Age in Regent
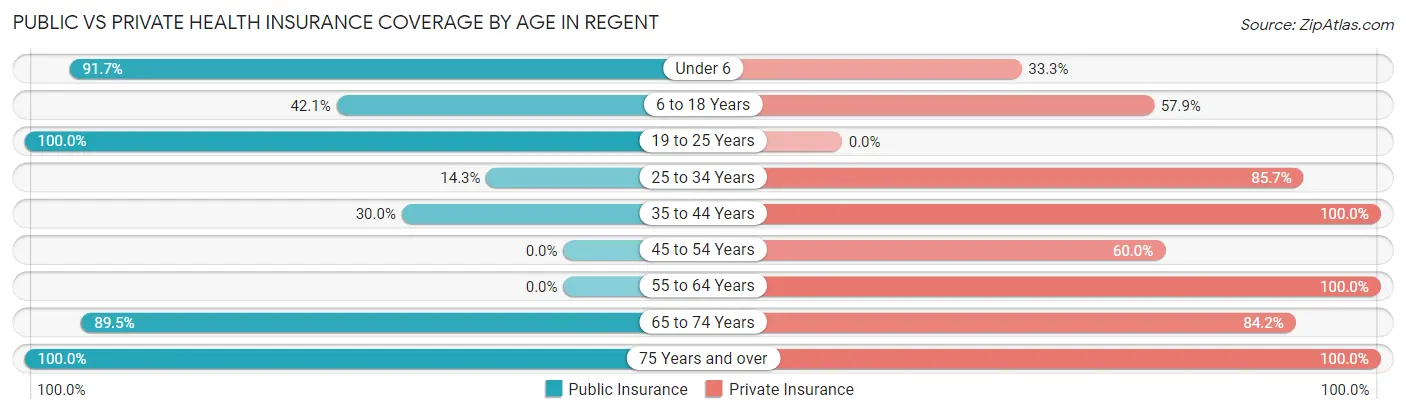
| Age Bracket | Public Insurance | Private Insurance |
| Under 6 | 11 (91.7%) | 4 (33.3%) |
| 6 to 18 Years | 8 (42.1%) | 11 (57.9%) |
| 19 to 25 Years | 4 (100.0%) | 0 (0.0%) |
| 25 to 34 Years | 3 (14.3%) | 18 (85.7%) |
| 35 to 44 Years | 6 (30.0%) | 20 (100.0%) |
| 45 to 54 Years | 0 (0.0%) | 3 (60.0%) |
| 55 to 64 Years | 0 (0.0%) | 34 (100.0%) |
| 65 to 74 Years | 17 (89.5%) | 16 (84.2%) |
| 75 Years and over | 15 (100.0%) | 15 (100.0%) |
| Total | 64 (42.9%) | 121 (81.2%) |
Disability Status by Sex by Age in Regent
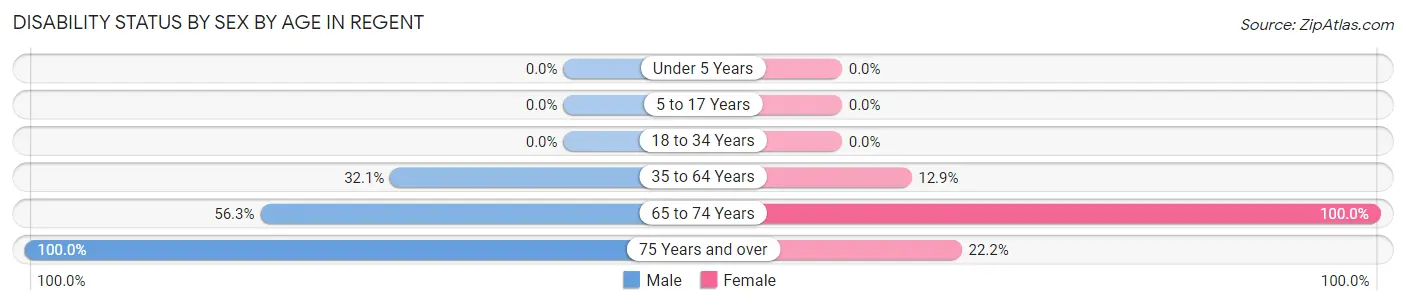
| Age Bracket | Male | Female |
| Under 5 Years | 0 (0.0%) | 0 (0.0%) |
| 5 to 17 Years | 0 (0.0%) | 0 (0.0%) |
| 18 to 34 Years | 0 (0.0%) | 0 (0.0%) |
| 35 to 64 Years | 9 (32.1%) | 4 (12.9%) |
| 65 to 74 Years | 9 (56.2%) | 3 (100.0%) |
| 75 Years and over | 6 (100.0%) | 2 (22.2%) |
Disability Class by Sex by Age in Regent
Disability Class: Hearing Difficulty
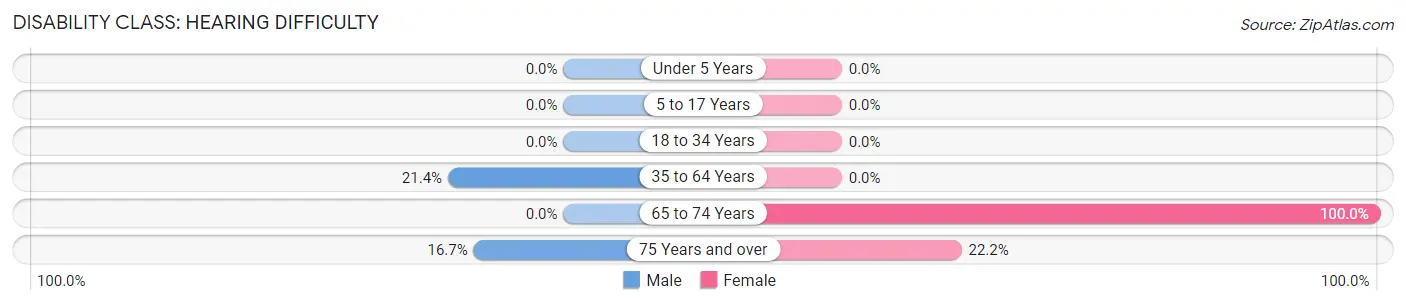
| Age Bracket | Male | Female |
| Under 5 Years | 0 (0.0%) | 0 (0.0%) |
| 5 to 17 Years | 0 (0.0%) | 0 (0.0%) |
| 18 to 34 Years | 0 (0.0%) | 0 (0.0%) |
| 35 to 64 Years | 6 (21.4%) | 0 (0.0%) |
| 65 to 74 Years | 0 (0.0%) | 3 (100.0%) |
| 75 Years and over | 1 (16.7%) | 2 (22.2%) |
Disability Class: Vision Difficulty
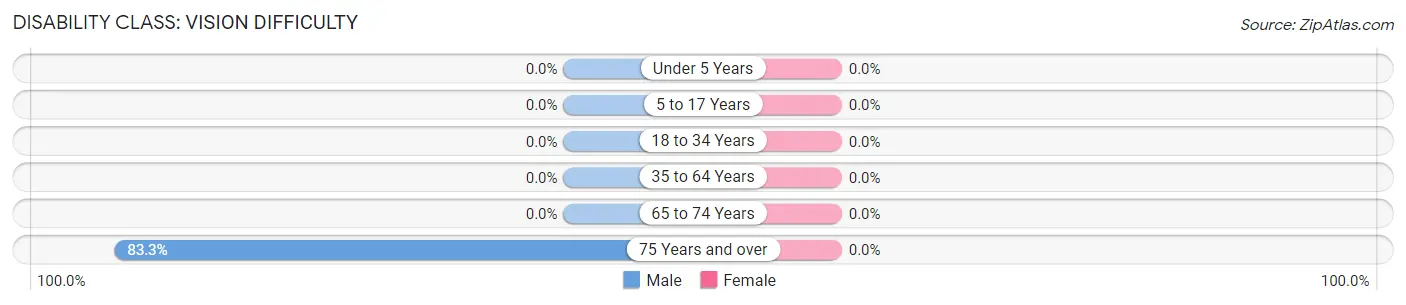
| Age Bracket | Male | Female |
| Under 5 Years | 0 (0.0%) | 0 (0.0%) |
| 5 to 17 Years | 0 (0.0%) | 0 (0.0%) |
| 18 to 34 Years | 0 (0.0%) | 0 (0.0%) |
| 35 to 64 Years | 0 (0.0%) | 0 (0.0%) |
| 65 to 74 Years | 0 (0.0%) | 0 (0.0%) |
| 75 Years and over | 5 (83.3%) | 0 (0.0%) |
Disability Class: Cognitive Difficulty
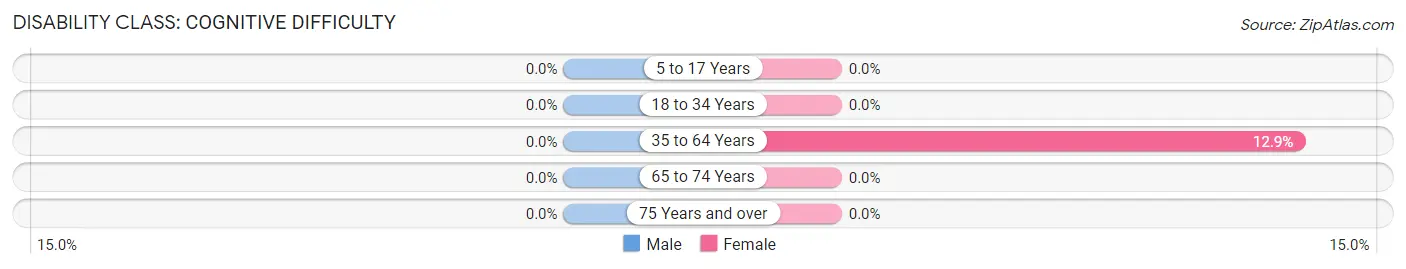
| Age Bracket | Male | Female |
| 5 to 17 Years | 0 (0.0%) | 0 (0.0%) |
| 18 to 34 Years | 0 (0.0%) | 0 (0.0%) |
| 35 to 64 Years | 0 (0.0%) | 4 (12.9%) |
| 65 to 74 Years | 0 (0.0%) | 0 (0.0%) |
| 75 Years and over | 0 (0.0%) | 0 (0.0%) |
Disability Class: Ambulatory Difficulty
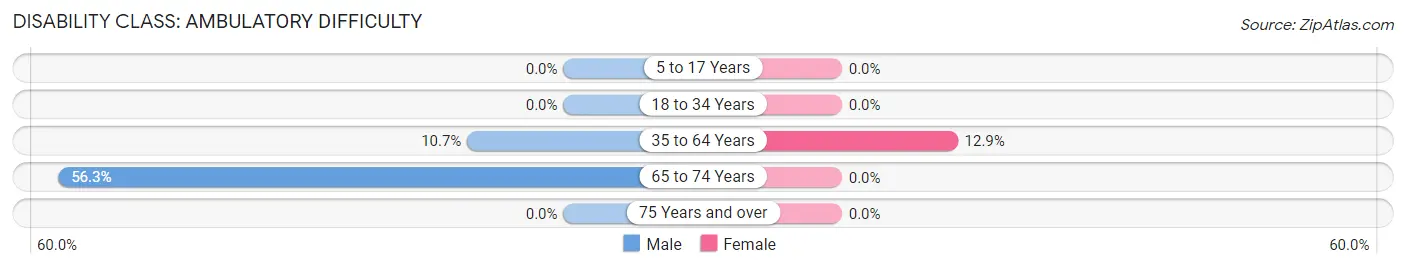
| Age Bracket | Male | Female |
| 5 to 17 Years | 0 (0.0%) | 0 (0.0%) |
| 18 to 34 Years | 0 (0.0%) | 0 (0.0%) |
| 35 to 64 Years | 3 (10.7%) | 4 (12.9%) |
| 65 to 74 Years | 9 (56.2%) | 0 (0.0%) |
| 75 Years and over | 0 (0.0%) | 0 (0.0%) |
Disability Class: Self-Care Difficulty
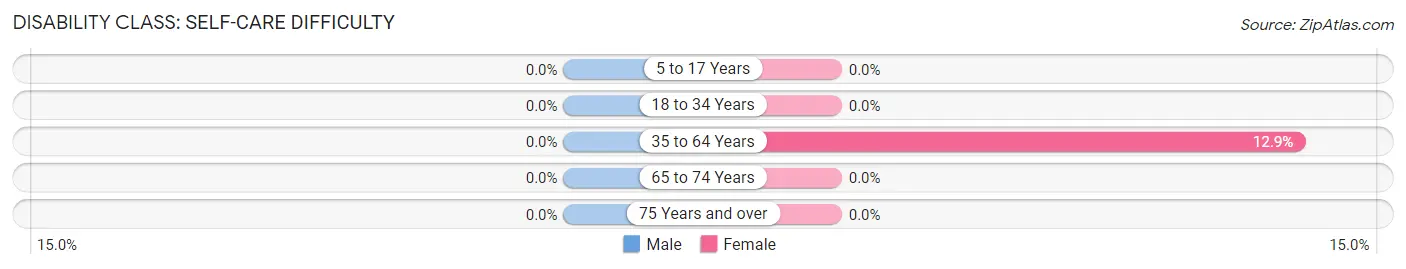
| Age Bracket | Male | Female |
| 5 to 17 Years | 0 (0.0%) | 0 (0.0%) |
| 18 to 34 Years | 0 (0.0%) | 0 (0.0%) |
| 35 to 64 Years | 0 (0.0%) | 4 (12.9%) |
| 65 to 74 Years | 0 (0.0%) | 0 (0.0%) |
| 75 Years and over | 0 (0.0%) | 0 (0.0%) |
Technology Access in Regent
Computing Device Access in Regent
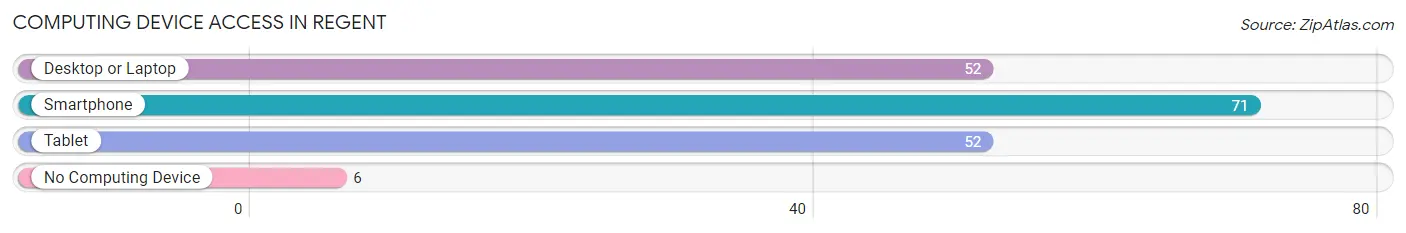
| Device Type | # Households | % Households |
| Desktop or Laptop | 52 | 57.1% |
| Smartphone | 71 | 78.0% |
| Tablet | 52 | 57.1% |
| No Computing Device | 6 | 6.6% |
| Total | 91 | 100.0% |
Internet Access in Regent
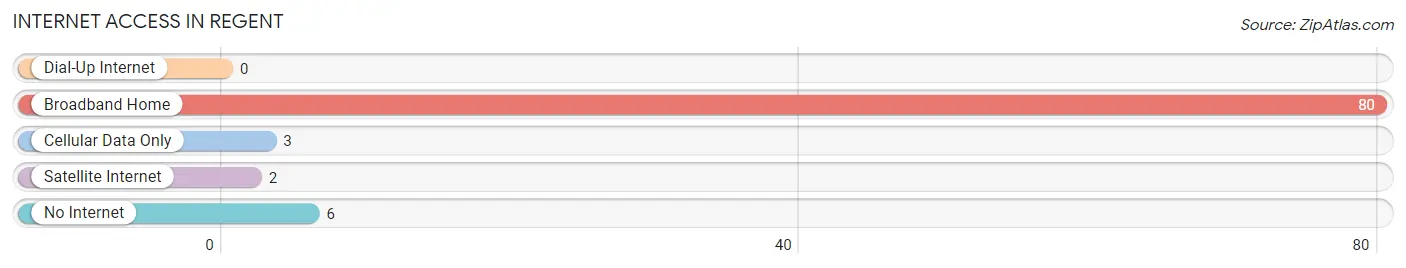
| Internet Type | # Households | % Households |
| Dial-Up Internet | 0 | 0.0% |
| Broadband Home | 80 | 87.9% |
| Cellular Data Only | 3 | 3.3% |
| Satellite Internet | 2 | 2.2% |
| No Internet | 6 | 6.6% |
| Total | 91 | 100.0% |
Regent Summary
Regent, North Dakota is a small town located in the southwestern corner of the state. It is situated in the heart of the Missouri Coteau, a region of rolling hills and prairie grasslands. The town is located in the county of Bottineau, and is home to a population of just over 500 people.
Geographically, Regent is located in the Missouri Coteau, a region of rolling hills and prairie grasslands. The town is situated on the banks of the Little Missouri River, which flows through the area. The town is surrounded by a variety of natural features, including the Little Missouri National Grassland, the Turtle Mountains, and the Souris River. The area is also home to a variety of wildlife, including deer, elk, and bison.
The economy of Regent is largely based on agriculture. The town is home to a variety of farms, which produce a variety of crops, including wheat, corn, and soybeans. The town is also home to a number of small businesses, including a grocery store, a hardware store, and a restaurant.
Regent is served by the Bottineau County School District, which includes two elementary schools, a middle school, and a high school. The town is also home to a variety of churches, including the United Methodist Church, the Lutheran Church, and the Catholic Church.
Demographically, Regent is a predominantly white town, with a population that is 97.3% white. The town is also home to a small population of Native Americans, with a population of 0.3%. The median household income in Regent is $41,250, and the median home value is $90,000.
Regent is a small town with a rich history and a strong sense of community. The town is home to a variety of attractions, including the Little Missouri National Grassland, the Turtle Mountains, and the Souris River. The town is also home to a variety of businesses, churches, and schools, making it a great place to live and work.
Common Questions
What is Per Capita Income in Regent?
Per Capita income in Regent is $49,760.
What is the Median Family Income in Regent?
Median Family Income in Regent is $77,321.
What is the Median Household income in Regent?
Median Household Income in Regent is $65,625.
What is Income or Wage Gap in Regent?
Income or Wage Gap in Regent is 2.1%.
Women in Regent earn 97.9 cents for every dollar earned by a man.
What is Inequality or Gini Index in Regent?
Inequality or Gini Index in Regent is 0.39.
What is the Total Population of Regent?
Total Population of Regent is 149.
What is the Total Male Population of Regent?
Total Male Population of Regent is 90.
What is the Total Female Population of Regent?
Total Female Population of Regent is 59.
What is the Ratio of Males per 100 Females in Regent?
There are 152.54 Males per 100 Females in Regent.
What is the Ratio of Females per 100 Males in Regent?
There are 65.56 Females per 100 Males in Regent.
What is the Median Population Age in Regent?
Median Population Age in Regent is 41.8 Years.
What is the Average Family Size in Regent
Average Family Size in Regent is 2.4 People.
What is the Average Household Size in Regent
Average Household Size in Regent is 1.6 People.
How Large is the Labor Force in Regent?
There are 91 People in the Labor Forcein in Regent.
What is the Percentage of People in the Labor Force in Regent?
74.6% of People are in the Labor Force in Regent.