Solen, ND Map & Demographics
Solen Map
Solen Overview
$17,989
PER CAPITA INCOME
0.50
INEQUALITY / GINI INDEX
74
TOTAL POPULATION
38
MALE POPULATION
36
FEMALE POPULATION
105.56
MALES / 100 FEMALES
94.74
FEMALES / 100 MALES
41.0
MEDIAN AGE
4.2
AVG FAMILY SIZE
2.9
AVG HOUSEHOLD SIZE
19
LABOR FORCE [ PEOPLE ]
32.8%
PERCENT IN LABOR FORCE
15.8%
UNEMPLOYMENT RATE
Solen Zip Codes
Solen Area Codes
Income in Solen
Income Overview in Solen
| Characteristic | Number | Measure |
| Per Capita Income | 74 | $17,989 |
| Median Family Income | 14 | $0 |
| Mean Family Income | 14 | $54,857 |
| Median Household Income | 26 | $0 |
| Mean Household Income | 26 | $54,662 |
| Income Deficit | 14 | $0 |
| Wage / Income Gap (%) | 74 | 0.00% |
| Wage / Income Gap ($) | 74 | 100.00¢ per $1 |
| Gini / Inequality Index | 74 | 0.50 |
Earnings by Sex in Solen
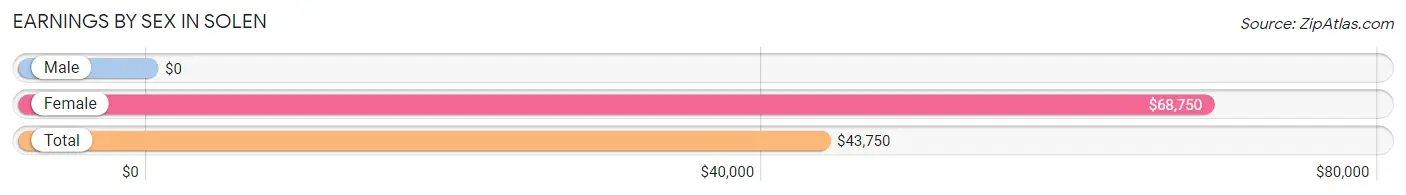
| Sex | Number | Average Earnings |
| Male | 10 (45.5%) | $0 |
| Female | 12 (54.5%) | $68,750 |
| Total | 22 (100.0%) | $43,750 |
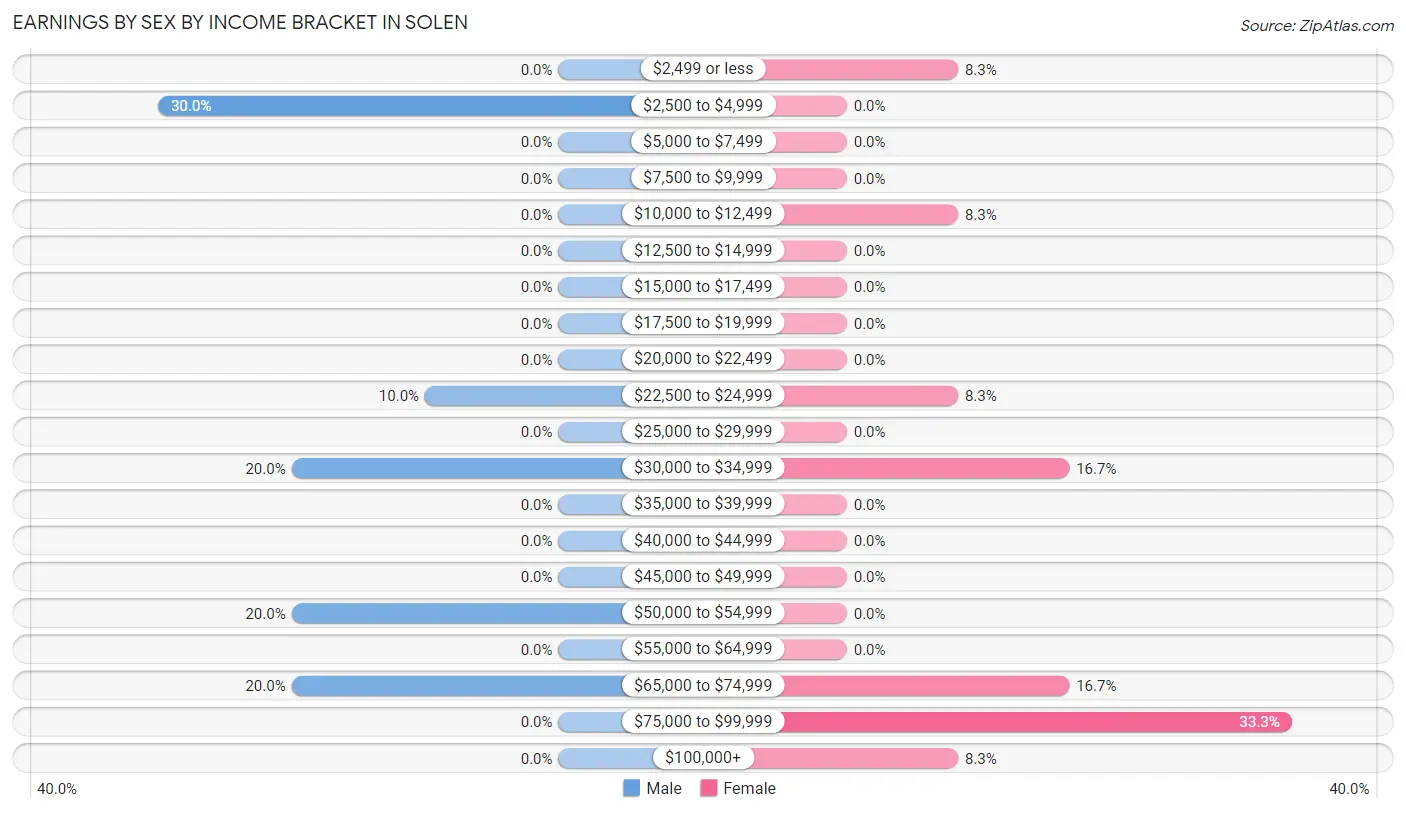
Earnings by Sex by Income Bracket in Solen
The most common earnings brackets in Solen are $2,500 to $4,999 for men (3 | 30.0%) and $75,000 to $99,999 for women (4 | 33.3%).
| Income | Male | Female |
| $2,499 or less | 0 (0.0%) | 1 (8.3%) |
| $2,500 to $4,999 | 3 (30.0%) | 0 (0.0%) |
| $5,000 to $7,499 | 0 (0.0%) | 0 (0.0%) |
| $7,500 to $9,999 | 0 (0.0%) | 0 (0.0%) |
| $10,000 to $12,499 | 0 (0.0%) | 1 (8.3%) |
| $12,500 to $14,999 | 0 (0.0%) | 0 (0.0%) |
| $15,000 to $17,499 | 0 (0.0%) | 0 (0.0%) |
| $17,500 to $19,999 | 0 (0.0%) | 0 (0.0%) |
| $20,000 to $22,499 | 0 (0.0%) | 0 (0.0%) |
| $22,500 to $24,999 | 1 (10.0%) | 1 (8.3%) |
| $25,000 to $29,999 | 0 (0.0%) | 0 (0.0%) |
| $30,000 to $34,999 | 2 (20.0%) | 2 (16.7%) |
| $35,000 to $39,999 | 0 (0.0%) | 0 (0.0%) |
| $40,000 to $44,999 | 0 (0.0%) | 0 (0.0%) |
| $45,000 to $49,999 | 0 (0.0%) | 0 (0.0%) |
| $50,000 to $54,999 | 2 (20.0%) | 0 (0.0%) |
| $55,000 to $64,999 | 0 (0.0%) | 0 (0.0%) |
| $65,000 to $74,999 | 2 (20.0%) | 2 (16.7%) |
| $75,000 to $99,999 | 0 (0.0%) | 4 (33.3%) |
| $100,000+ | 0 (0.0%) | 1 (8.3%) |
| Total | 10 (100.0%) | 12 (100.0%) |
Earnings by Sex by Educational Attainment in Solen
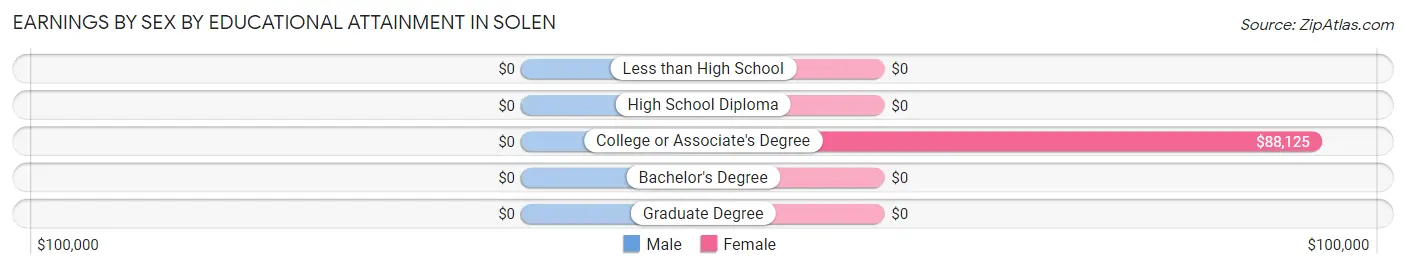
| Educational Attainment | Male Income | Female Income |
| Less than High School | - | - |
| High School Diploma | - | - |
| College or Associate's Degree | - | - |
| Bachelor's Degree | - | - |
| Graduate Degree | - | - |
| Total | $53,125 | $68,750 |
Family Income in Solen
Family Income Brackets in Solen
According to the Solen family income data, there are 6 families falling into the $75,000 to $99,999 income range, which is the most common income bracket and makes up 42.9% of all families.
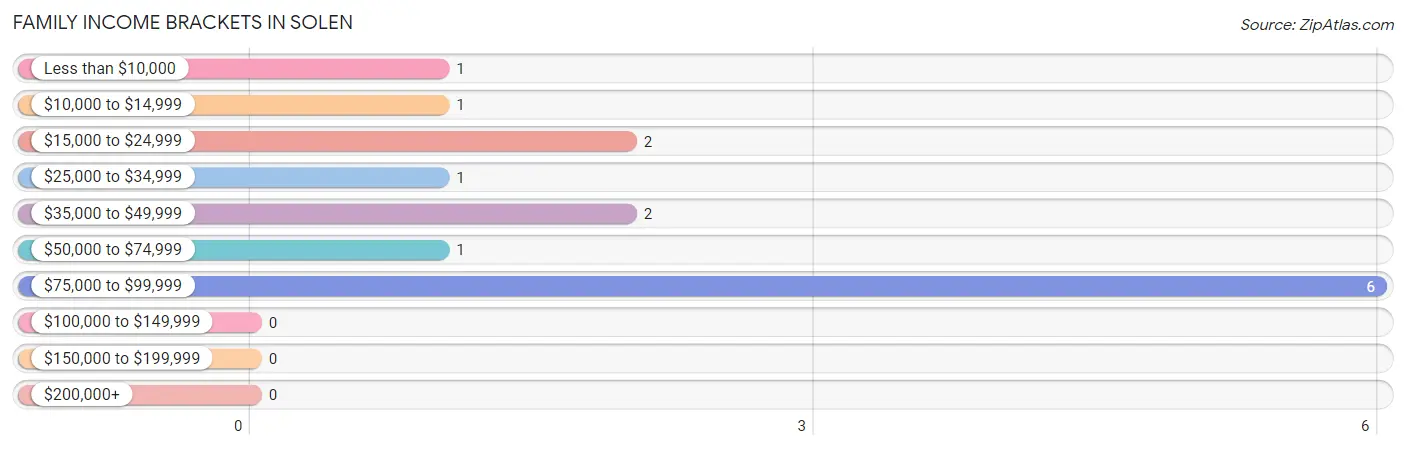
| Income Bracket | # Families | % Families |
| Less than $10,000 | 1 | 7.1% |
| $10,000 to $14,999 | 1 | 7.1% |
| $15,000 to $24,999 | 2 | 14.3% |
| $25,000 to $34,999 | 1 | 7.1% |
| $35,000 to $49,999 | 2 | 14.3% |
| $50,000 to $74,999 | 1 | 7.1% |
| $75,000 to $99,999 | 6 | 42.9% |
| $100,000 to $149,999 | 0 | 0.0% |
| $150,000 to $199,999 | 0 | 0.0% |
| $200,000+ | 0 | 0.0% |
Family Income by Famaliy Size in Solen
3-person families (9 | 64.3%) account for the highest median family income in Solen with $86,875 per family, while 3-person families (9 | 64.3%) have the highest median income of $28,958 per family member.
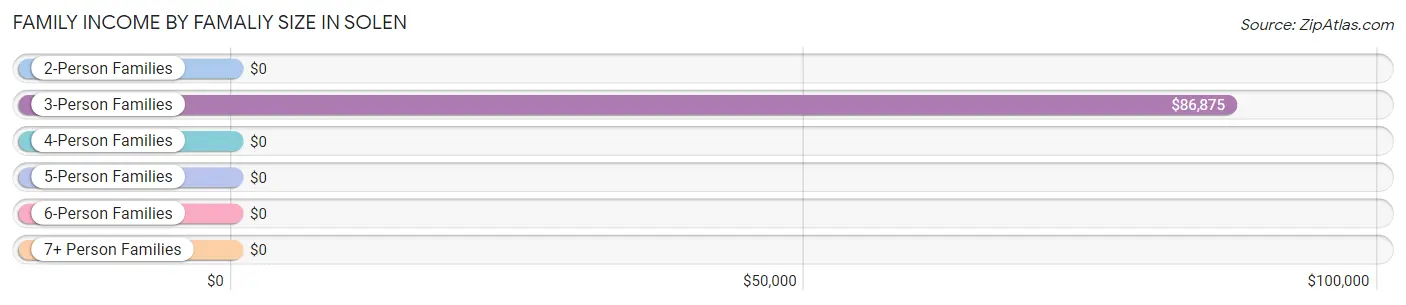
| Income Bracket | # Families | Median Income |
| 2-Person Families | 1 (7.1%) | $0 |
| 3-Person Families | 9 (64.3%) | $86,875 |
| 4-Person Families | 1 (7.1%) | $0 |
| 5-Person Families | 2 (14.3%) | $0 |
| 6-Person Families | 0 (0.0%) | $0 |
| 7+ Person Families | 1 (7.1%) | $0 |
| Total | 14 (100.0%) | $0 |
Family Income by Number of Earners in Solen
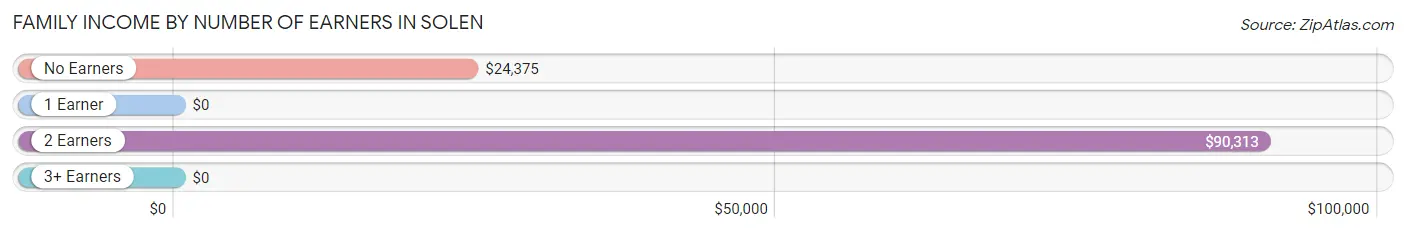
| Number of Earners | # Families | Median Income |
| No Earners | 5 (35.7%) | $24,375 |
| 1 Earner | 2 (14.3%) | $0 |
| 2 Earners | 7 (50.0%) | $90,313 |
| 3+ Earners | 0 (0.0%) | $0 |
| Total | 14 (100.0%) | $0 |
Household Income in Solen
Household Income Brackets in Solen
With 6 households falling in the category, the less than $10,000 income range is the most frequent in Solen, accounting for 23.1% of all households.
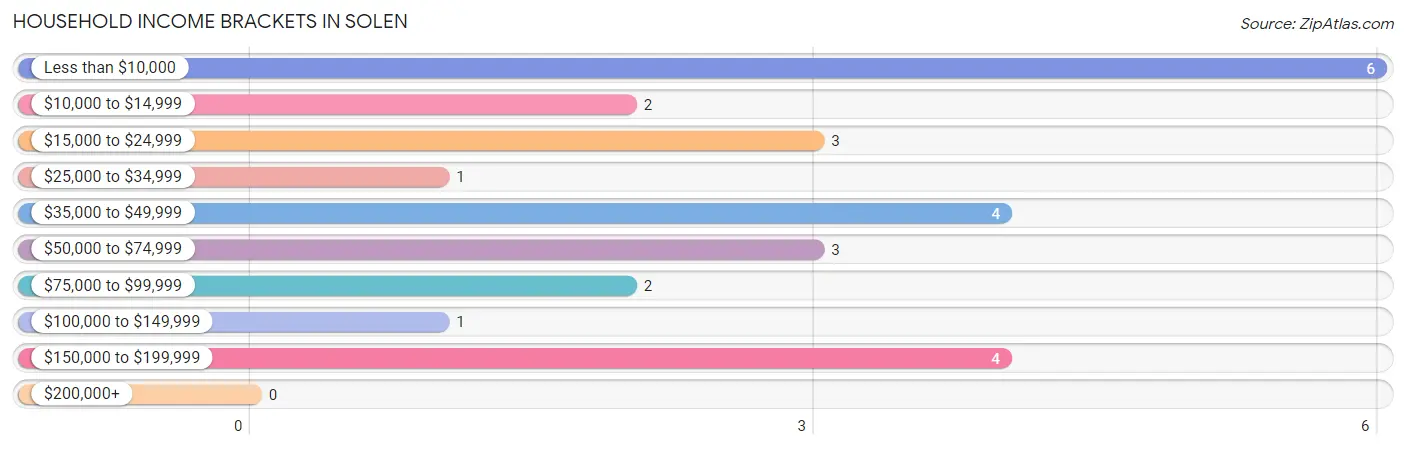
| Income Bracket | # Households | % Households |
| Less than $10,000 | 6 | 23.1% |
| $10,000 to $14,999 | 2 | 7.7% |
| $15,000 to $24,999 | 3 | 11.5% |
| $25,000 to $34,999 | 1 | 3.8% |
| $35,000 to $49,999 | 4 | 15.4% |
| $50,000 to $74,999 | 3 | 11.5% |
| $75,000 to $99,999 | 2 | 7.7% |
| $100,000 to $149,999 | 1 | 3.8% |
| $150,000 to $199,999 | 4 | 15.4% |
| $200,000+ | 0 | 0.0% |
Household Income by Householder Age in Solen
The median household income in Solen is $0, with the highest median household income of $23,750 found in the 25 to 44 years age bracket for the primary householder. A total of 3 households (11.5%) fall into this category.
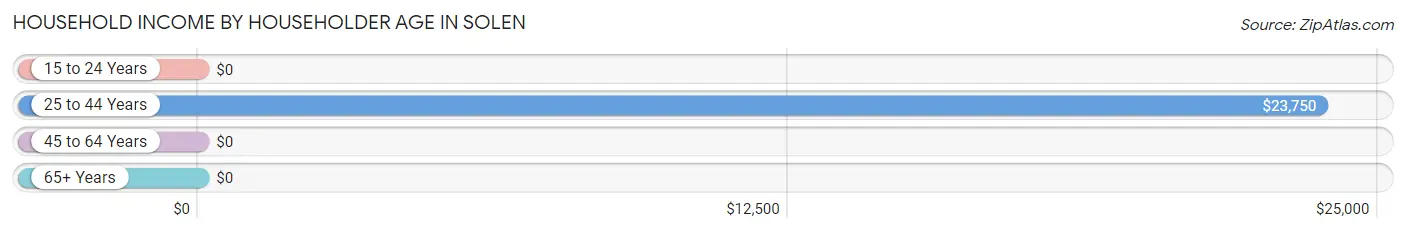
| Income Bracket | # Households | Median Income |
| 15 to 24 Years | 0 (0.0%) | $0 |
| 25 to 44 Years | 3 (11.5%) | $23,750 |
| 45 to 64 Years | 15 (57.7%) | $0 |
| 65+ Years | 8 (30.8%) | $0 |
| Total | 26 (100.0%) | $0 |
Poverty in Solen
Income Below Poverty by Sex and Age in Solen
With 28.9% poverty level for males and 58.3% for females among the residents of Solen, 16 and 17 year old males and 6 to 11 year old females are the most vulnerable to poverty, with 4 males (100.0%) and 3 females (100.0%) in their respective age groups living below the poverty level.
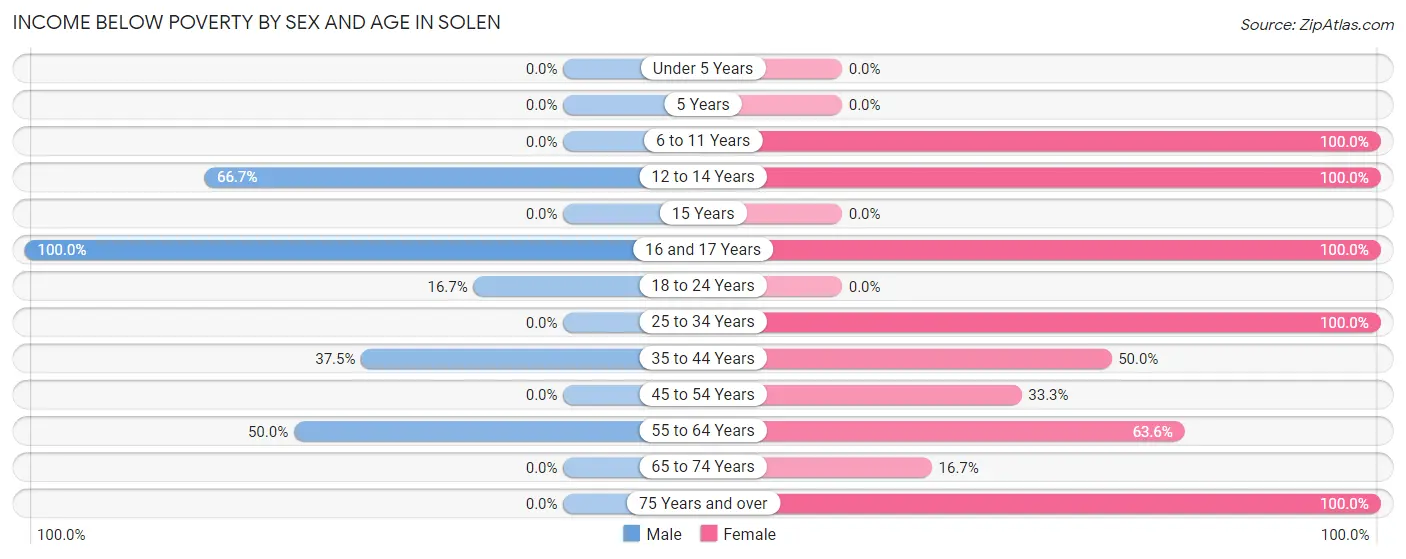
| Age Bracket | Male | Female |
| Under 5 Years | 0 (0.0%) | 0 (0.0%) |
| 5 Years | 0 (0.0%) | 0 (0.0%) |
| 6 to 11 Years | 0 (0.0%) | 3 (100.0%) |
| 12 to 14 Years | 2 (66.7%) | 2 (100.0%) |
| 15 Years | 0 (0.0%) | 0 (0.0%) |
| 16 and 17 Years | 4 (100.0%) | 2 (100.0%) |
| 18 to 24 Years | 1 (16.7%) | 0 (0.0%) |
| 25 to 34 Years | 0 (0.0%) | 1 (100.0%) |
| 35 to 44 Years | 3 (37.5%) | 2 (50.0%) |
| 45 to 54 Years | 0 (0.0%) | 2 (33.3%) |
| 55 to 64 Years | 1 (50.0%) | 7 (63.6%) |
| 65 to 74 Years | 0 (0.0%) | 1 (16.7%) |
| 75 Years and over | 0 (0.0%) | 1 (100.0%) |
| Total | 11 (28.9%) | 21 (58.3%) |
Income Above Poverty by Sex and Age in Solen
According to the poverty statistics in Solen, males aged 6 to 11 years and females aged 65 to 74 years are the age groups that are most secure financially, with 100.0% of males and 83.3% of females in these age groups living above the poverty line.
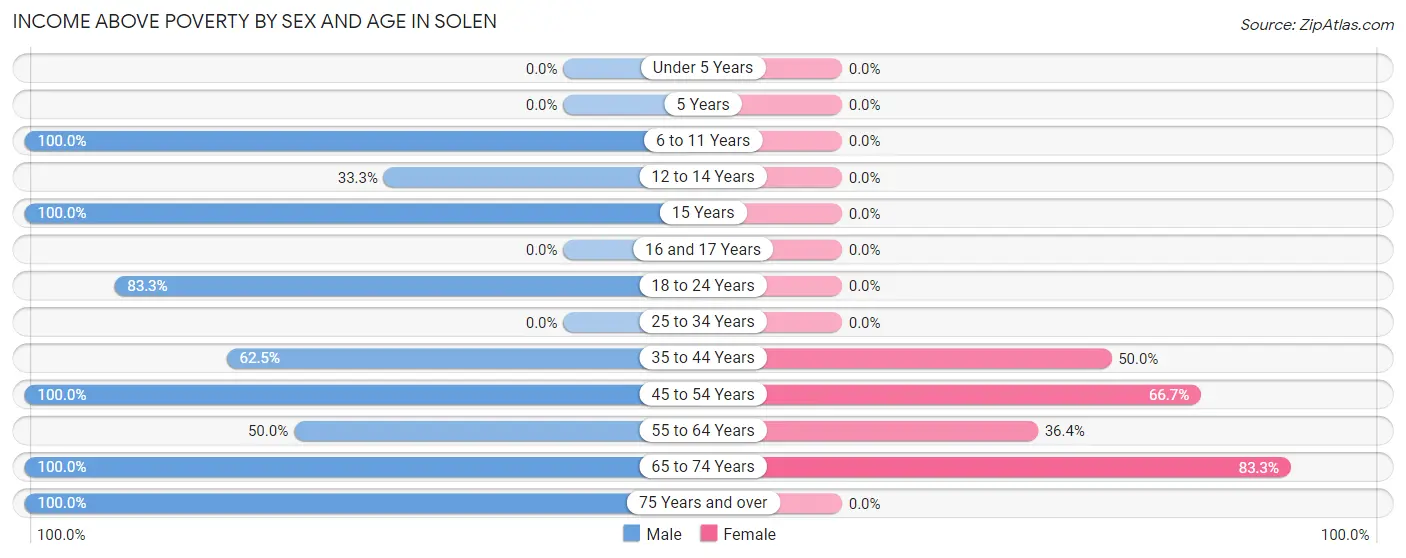
| Age Bracket | Male | Female |
| Under 5 Years | 0 (0.0%) | 0 (0.0%) |
| 5 Years | 0 (0.0%) | 0 (0.0%) |
| 6 to 11 Years | 4 (100.0%) | 0 (0.0%) |
| 12 to 14 Years | 1 (33.3%) | 0 (0.0%) |
| 15 Years | 4 (100.0%) | 0 (0.0%) |
| 16 and 17 Years | 0 (0.0%) | 0 (0.0%) |
| 18 to 24 Years | 5 (83.3%) | 0 (0.0%) |
| 25 to 34 Years | 0 (0.0%) | 0 (0.0%) |
| 35 to 44 Years | 5 (62.5%) | 2 (50.0%) |
| 45 to 54 Years | 4 (100.0%) | 4 (66.7%) |
| 55 to 64 Years | 1 (50.0%) | 4 (36.4%) |
| 65 to 74 Years | 1 (100.0%) | 5 (83.3%) |
| 75 Years and over | 2 (100.0%) | 0 (0.0%) |
| Total | 27 (71.1%) | 15 (41.7%) |
Income Below Poverty Among Married-Couple Families in Solen
The poverty statistics for married-couple families in Solen show that 16.7% or 1 of the total 6 families live below the poverty line. Families with 1 or 2 children have the highest poverty rate of 33.3%, comprising of 1 families. On the other hand, families with no children have the lowest poverty rate of 0.0%, which includes 0 families.
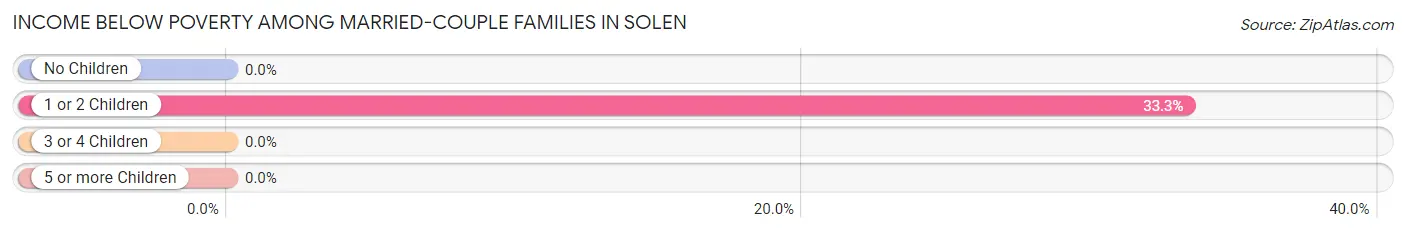
| Children | Above Poverty | Below Poverty |
| No Children | 2 (100.0%) | 0 (0.0%) |
| 1 or 2 Children | 2 (66.7%) | 1 (33.3%) |
| 3 or 4 Children | 1 (100.0%) | 0 (0.0%) |
| 5 or more Children | 0 (0.0%) | 0 (0.0%) |
| Total | 5 (83.3%) | 1 (16.7%) |
Income Below Poverty Among Single-Parent Households in Solen
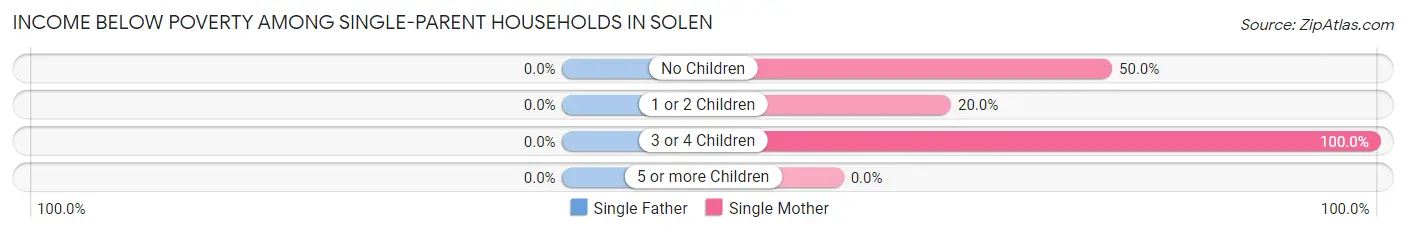
| Children | Single Father | Single Mother |
| No Children | 0 (0.0%) | 1 (50.0%) |
| 1 or 2 Children | 0 (0.0%) | 1 (20.0%) |
| 3 or 4 Children | 0 (0.0%) | 1 (100.0%) |
| 5 or more Children | 0 (0.0%) | 0 (0.0%) |
| Total | 0 (0.0%) | 3 (37.5%) |
Income Below Poverty Among Married-Couple vs Single-Parent Households in Solen
The poverty data for Solen shows that 1 of the married-couple family households (16.7%) and 3 of the single-parent households (37.5%) are living below the poverty level. Within the married-couple family households, those with 1 or 2 children have the highest poverty rate, with 1 households (33.3%) falling below the poverty line. Among the single-parent households, those with 3 or 4 children have the highest poverty rate, with 1 household (100.0%) living below poverty.
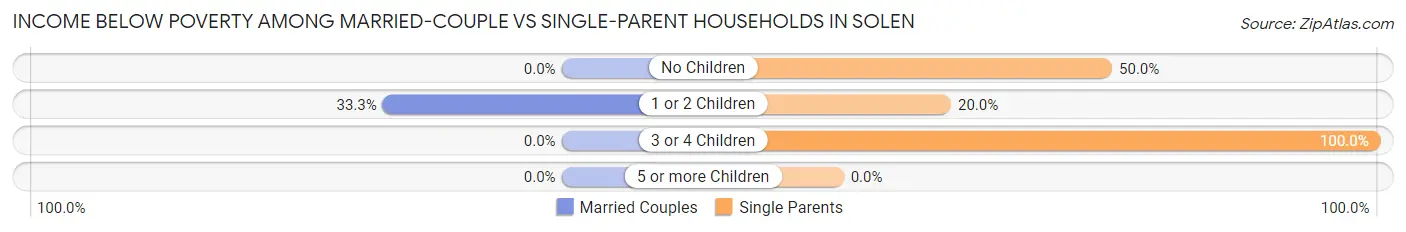
| Children | Married-Couple Families | Single-Parent Households |
| No Children | 0 (0.0%) | 1 (50.0%) |
| 1 or 2 Children | 1 (33.3%) | 1 (20.0%) |
| 3 or 4 Children | 0 (0.0%) | 1 (100.0%) |
| 5 or more Children | 0 (0.0%) | 0 (0.0%) |
| Total | 1 (16.7%) | 3 (37.5%) |
Race in Solen
The most populous races in Solen are Native / Alaskan (59 | 79.7%), and White / Caucasian (15 | 20.3%).
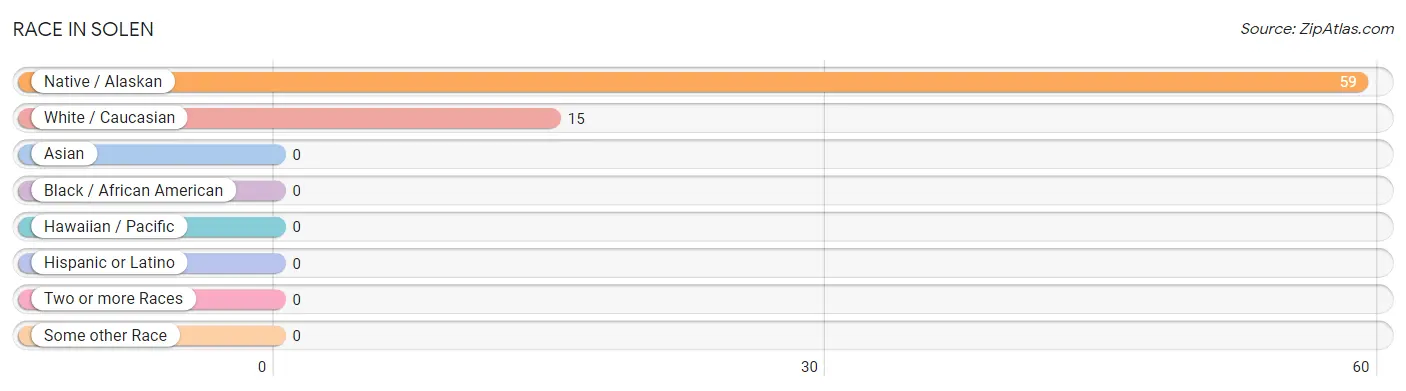
| Race | # Population | % Population |
| Asian | 0 | 0.0% |
| Black / African American | 0 | 0.0% |
| Hawaiian / Pacific | 0 | 0.0% |
| Hispanic or Latino | 0 | 0.0% |
| Native / Alaskan | 59 | 79.7% |
| White / Caucasian | 15 | 20.3% |
| Two or more Races | 0 | 0.0% |
| Some other Race | 0 | 0.0% |
| Total | 74 | 100.0% |
Ancestry in Solen
The most populous ancestries reported in Solen are Sioux (53 | 71.6%), French (7 | 9.5%), German (3 | 4.1%), Norwegian (2 | 2.7%), and Chippewa (1 | 1.3%), together accounting for 89.2% of all Solen residents.
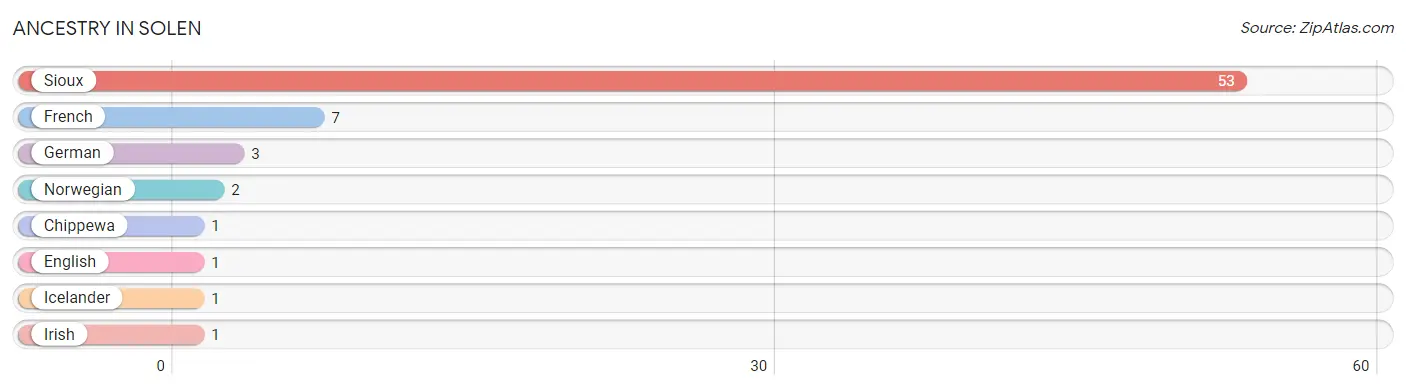
| Ancestry | # Population | % Population |
| Chippewa | 1 | 1.3% |
| English | 1 | 1.3% |
| French | 7 | 9.5% |
| German | 3 | 4.1% |
| Icelander | 1 | 1.3% |
| Irish | 1 | 1.3% |
| Norwegian | 2 | 2.7% |
| Sioux | 53 | 71.6% | View All 8 Rows |
Immigrants in Solen

| Immigration Origin | # Population | % Population | View All 0 Rows |
Sex and Age in Solen
Sex and Age in Solen
The most populous age groups in Solen are 15 to 19 Years (14 | 36.8%) for men and 60 to 64 Years (7 | 19.4%) for women.
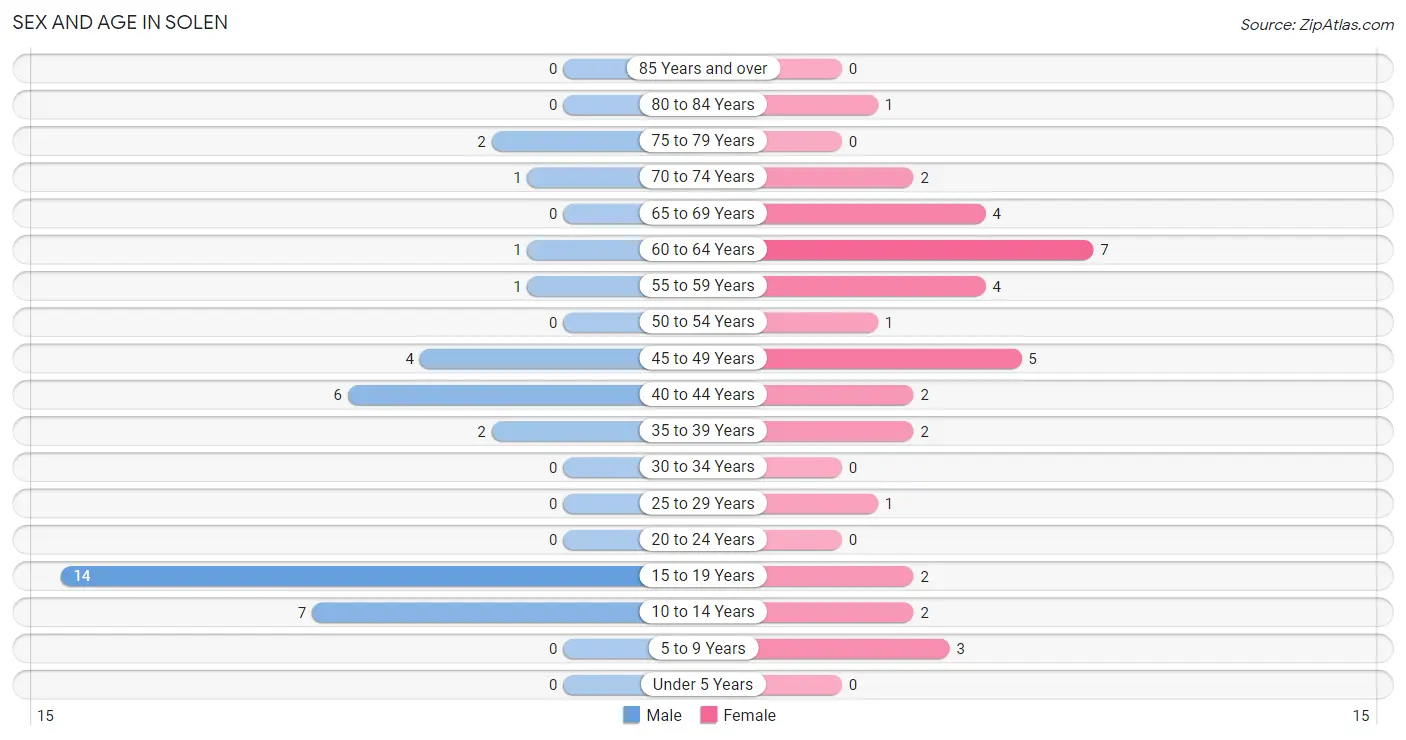
| Age Bracket | Male | Female |
| Under 5 Years | 0 (0.0%) | 0 (0.0%) |
| 5 to 9 Years | 0 (0.0%) | 3 (8.3%) |
| 10 to 14 Years | 7 (18.4%) | 2 (5.6%) |
| 15 to 19 Years | 14 (36.8%) | 2 (5.6%) |
| 20 to 24 Years | 0 (0.0%) | 0 (0.0%) |
| 25 to 29 Years | 0 (0.0%) | 1 (2.8%) |
| 30 to 34 Years | 0 (0.0%) | 0 (0.0%) |
| 35 to 39 Years | 2 (5.3%) | 2 (5.6%) |
| 40 to 44 Years | 6 (15.8%) | 2 (5.6%) |
| 45 to 49 Years | 4 (10.5%) | 5 (13.9%) |
| 50 to 54 Years | 0 (0.0%) | 1 (2.8%) |
| 55 to 59 Years | 1 (2.6%) | 4 (11.1%) |
| 60 to 64 Years | 1 (2.6%) | 7 (19.4%) |
| 65 to 69 Years | 0 (0.0%) | 4 (11.1%) |
| 70 to 74 Years | 1 (2.6%) | 2 (5.6%) |
| 75 to 79 Years | 2 (5.3%) | 0 (0.0%) |
| 80 to 84 Years | 0 (0.0%) | 1 (2.8%) |
| 85 Years and over | 0 (0.0%) | 0 (0.0%) |
| Total | 38 (100.0%) | 36 (100.0%) |
Families and Households in Solen
Median Family Size in Solen
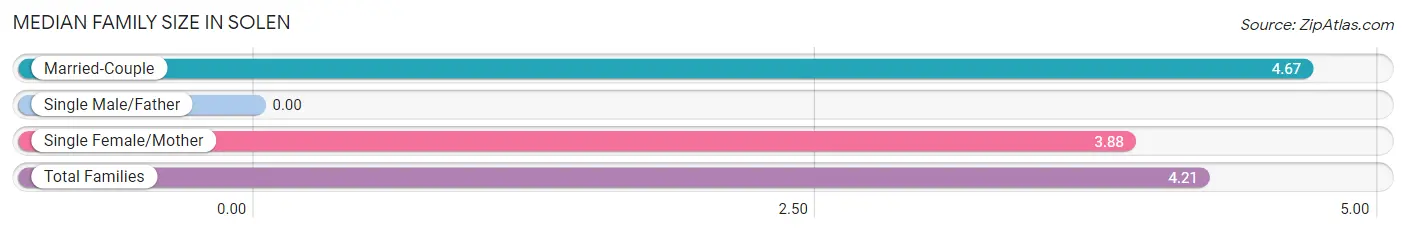
| Family Type | # Families | Family Size |
| Married-Couple | 6 (42.9%) | 4.67 |
| Single Male/Father | 0 (0.0%) | - |
| Single Female/Mother | 8 (57.1%) | 3.88 |
| Total Families | 14 (100.0%) | 4.21 |
Median Household Size in Solen
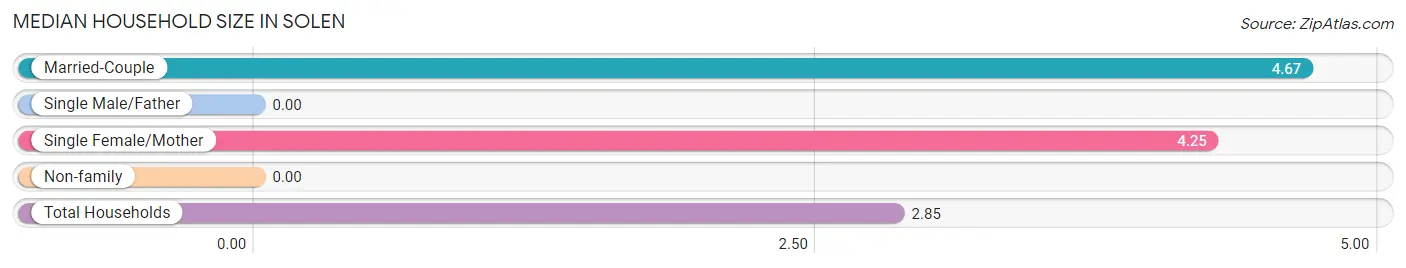
| Household Type | # Households | Household Size |
| Married-Couple | 6 (23.1%) | 4.67 |
| Single Male/Father | 0 (0.0%) | - |
| Single Female/Mother | 8 (30.8%) | 4.25 |
| Non-family | 12 (46.2%) | - |
| Total Households | 26 (100.0%) | 2.85 |
Household Size by Marriage Status in Solen
Out of a total of 26 households in Solen, 14 (53.8%) are family households, while 12 (46.2%) are nonfamily households. The most numerous type of family households are 3-person households, comprising 5, and the most common type of nonfamily households are 1-person households, comprising 12.
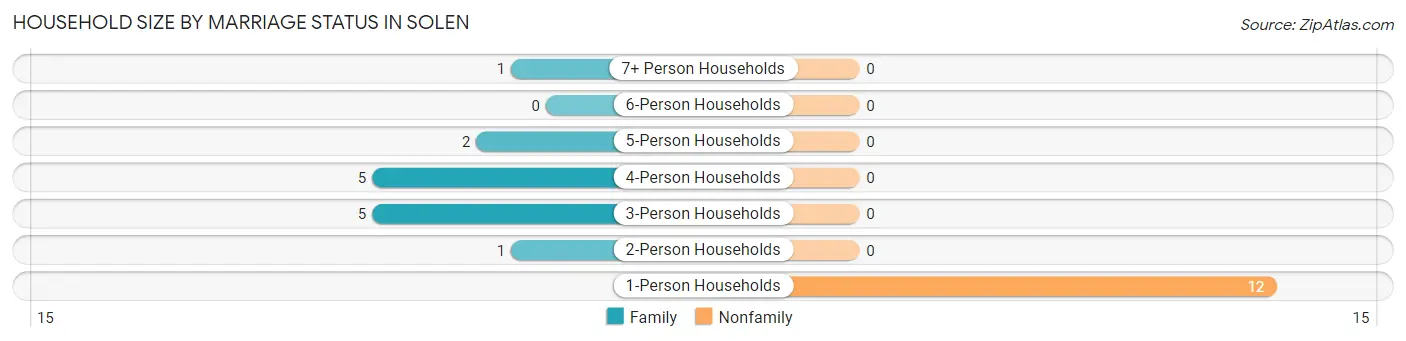
| Household Size | Family Households | Nonfamily Households |
| 1-Person Households | - | 12 (46.2%) |
| 2-Person Households | 1 (3.8%) | 0 (0.0%) |
| 3-Person Households | 5 (19.2%) | 0 (0.0%) |
| 4-Person Households | 5 (19.2%) | 0 (0.0%) |
| 5-Person Households | 2 (7.7%) | 0 (0.0%) |
| 6-Person Households | 0 (0.0%) | 0 (0.0%) |
| 7+ Person Households | 1 (3.8%) | 0 (0.0%) |
| Total | 14 (53.8%) | 12 (46.2%) |
Female Fertility in Solen
Fertility by Age in Solen
| Age Bracket | Women with Births | Births / 1,000 Women |
| 15 to 19 years | 0 (0.0%) | 0.0 |
| 20 to 34 years | 0 (0.0%) | 0.0 |
| 35 to 50 years | 0 (0.0%) | 0.0 |
| Total | 0 (0.0%) | 0.0 |
Fertility by Age by Marriage Status in Solen
| Age Bracket | Married | Unmarried |
| 15 to 19 years | 0 (0.0%) | 0 (0.0%) |
| 20 to 34 years | 0 (0.0%) | 0 (0.0%) |
| 35 to 50 years | 0 (0.0%) | 0 (0.0%) |
| Total | 0 (0.0%) | 0 (0.0%) |
Fertility by Education in Solen
| Educational Attainment | Women with Births | Births / 1,000 Women |
| Less than High School | 0 (0.0%) | 0.0 |
| High School Diploma | 0 (0.0%) | 0.0 |
| College or Associate's Degree | 0 (0.0%) | 0.0 |
| Bachelor's Degree | 0 (0.0%) | 0.0 |
| Graduate Degree | 0 (0.0%) | 0.0 |
| Total | 0 (0.0%) | 0.0 |
Fertility by Education by Marriage Status in Solen
| Educational Attainment | Married | Unmarried |
| Less than High School | 0 (0.0%) | 0 (0.0%) |
| High School Diploma | 0 (0.0%) | 0 (0.0%) |
| College or Associate's Degree | 0 (0.0%) | 0 (0.0%) |
| Bachelor's Degree | 0 (0.0%) | 0 (0.0%) |
| Graduate Degree | 0 (0.0%) | 0 (0.0%) |
| Total | 0 (0.0%) | 0 (0.0%) |
Employment Characteristics in Solen
Employment by Class of Employer in Solen
Among the 16 employed individuals in Solen, local government employees (13 | 81.2%), and private company employees (3 | 18.8%) make up the most common classes of employment.
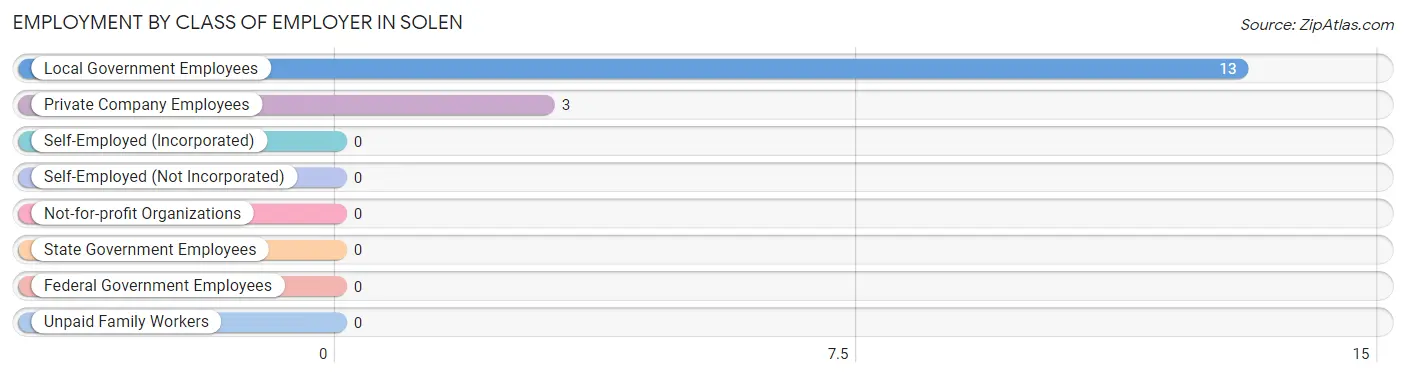
| Employer Class | # Employees | % Employees |
| Private Company Employees | 3 | 18.8% |
| Self-Employed (Incorporated) | 0 | 0.0% |
| Self-Employed (Not Incorporated) | 0 | 0.0% |
| Not-for-profit Organizations | 0 | 0.0% |
| Local Government Employees | 13 | 81.2% |
| State Government Employees | 0 | 0.0% |
| Federal Government Employees | 0 | 0.0% |
| Unpaid Family Workers | 0 | 0.0% |
| Total | 16 | 100.0% |
Employment Status by Age in Solen
According to the labor force statistics for Solen, out of the total population over 16 years of age (58), 32.8% or 19 individuals are in the labor force, with 15.8% or 3 of them unemployed. The age group with the highest labor force participation rate is 45 to 54 years, with 70.0% or 7 individuals in the labor force. Within the labor force, the 16 to 19 years age range has the highest percentage of unemployed individuals, with 100.0% or 3 of them being unemployed.
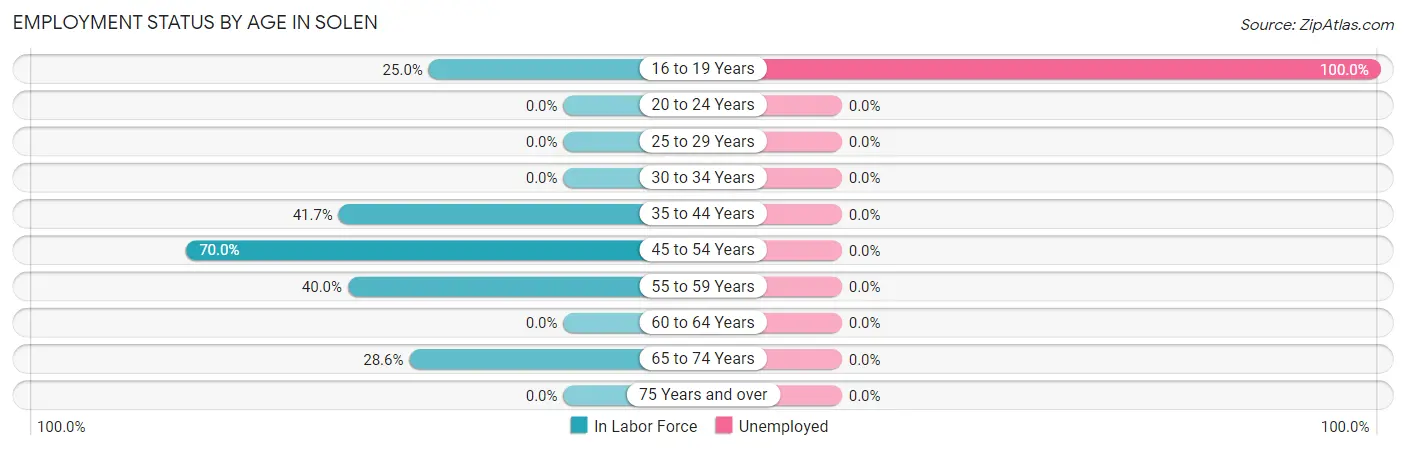
| Age Bracket | In Labor Force | Unemployed |
| 16 to 19 Years | 3 (25.0%) | 3 (100.0%) |
| 20 to 24 Years | 0 (0.0%) | 0 (0.0%) |
| 25 to 29 Years | 0 (0.0%) | 0 (0.0%) |
| 30 to 34 Years | 0 (0.0%) | 0 (0.0%) |
| 35 to 44 Years | 5 (41.7%) | 0 (0.0%) |
| 45 to 54 Years | 7 (70.0%) | 0 (0.0%) |
| 55 to 59 Years | 2 (40.0%) | 0 (0.0%) |
| 60 to 64 Years | 0 (0.0%) | 0 (0.0%) |
| 65 to 74 Years | 2 (28.6%) | 0 (0.0%) |
| 75 Years and over | 0 (0.0%) | 0 (0.0%) |
| Total | 19 (32.8%) | 3 (15.8%) |
Employment Status by Educational Attainment in Solen
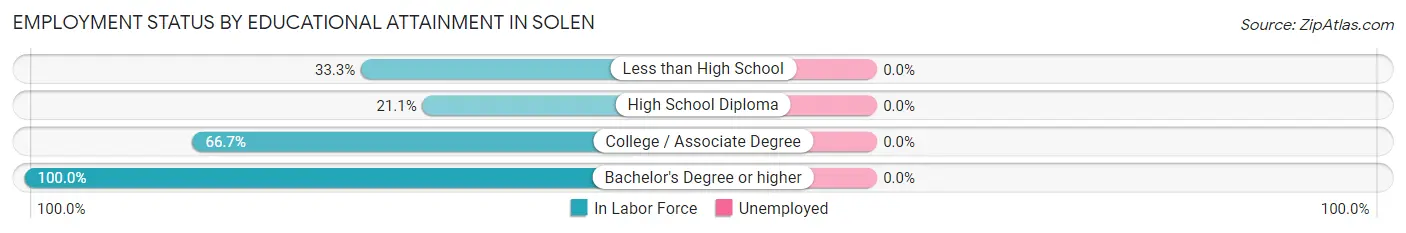
| Educational Attainment | In Labor Force | Unemployed |
| Less than High School | 2 (33.3%) | 0 (0.0%) |
| High School Diploma | 4 (21.1%) | 0 (0.0%) |
| College / Associate Degree | 6 (66.7%) | 0 (0.0%) |
| Bachelor's Degree or higher | 2 (100.0%) | 0 (0.0%) |
| Total | 14 (38.9%) | 0 (0.0%) |
Employment Occupations by Sex in Solen
Management, Business, Science and Arts Occupations
The most common Management, Business, Science and Arts occupations in Solen are Management (4 | 25.0%), Community & Social Service (4 | 25.0%), Education Instruction & Library (3 | 18.8%), and Arts, Media & Entertainment (1 | 6.2%).
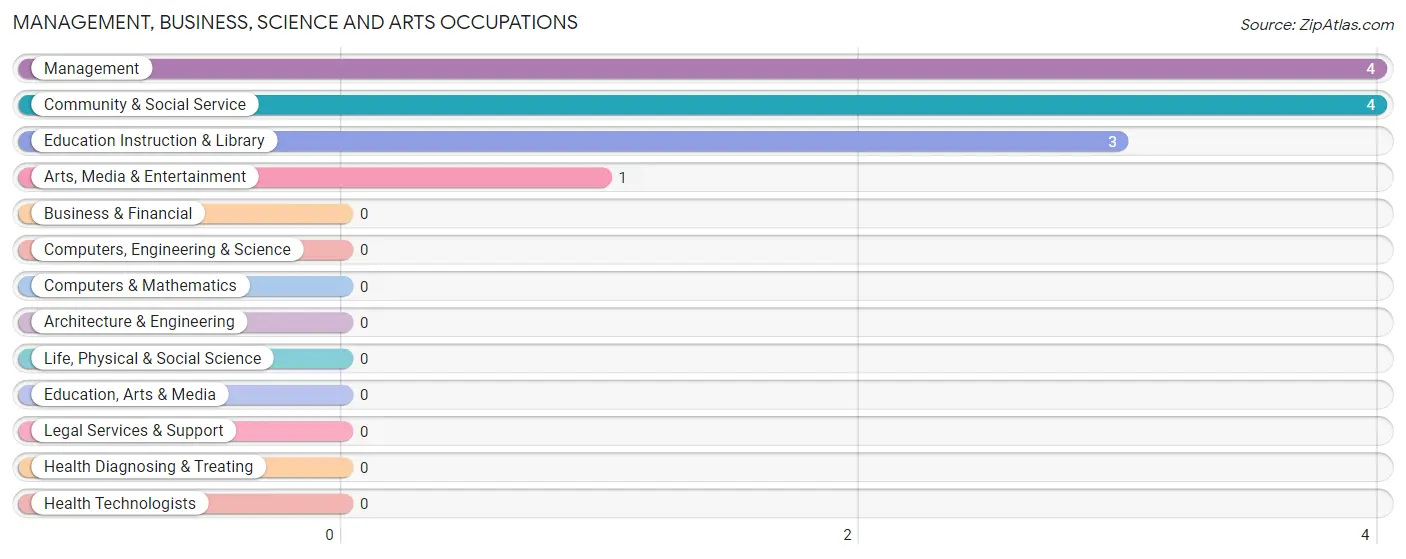
Management, Business, Science and Arts Occupations by Sex
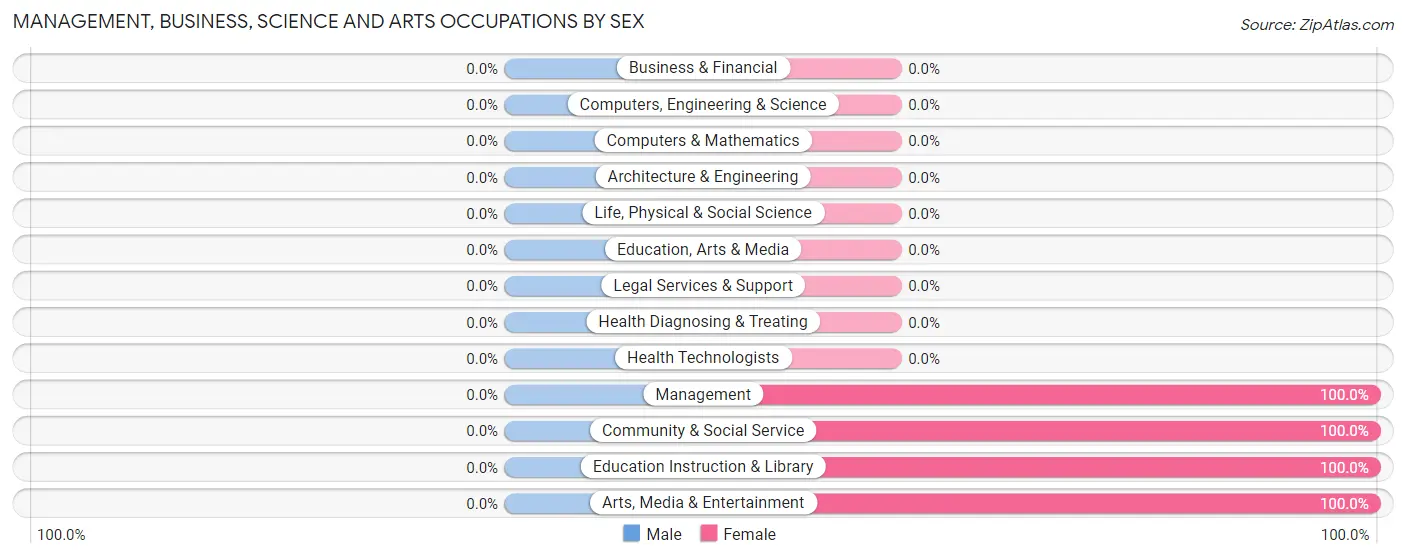
| Occupation | Male | Female |
| Management | 0 (0.0%) | 4 (100.0%) |
| Business & Financial | 0 (0.0%) | 0 (0.0%) |
| Computers, Engineering & Science | 0 (0.0%) | 0 (0.0%) |
| Computers & Mathematics | 0 (0.0%) | 0 (0.0%) |
| Architecture & Engineering | 0 (0.0%) | 0 (0.0%) |
| Life, Physical & Social Science | 0 (0.0%) | 0 (0.0%) |
| Community & Social Service | 0 (0.0%) | 4 (100.0%) |
| Education, Arts & Media | 0 (0.0%) | 0 (0.0%) |
| Legal Services & Support | 0 (0.0%) | 0 (0.0%) |
| Education Instruction & Library | 0 (0.0%) | 3 (100.0%) |
| Arts, Media & Entertainment | 0 (0.0%) | 1 (100.0%) |
| Health Diagnosing & Treating | 0 (0.0%) | 0 (0.0%) |
| Health Technologists | 0 (0.0%) | 0 (0.0%) |
| Total (Category) | 0 (0.0%) | 8 (100.0%) |
| Total (Overall) | 6 (37.5%) | 10 (62.5%) |
Services Occupations
The most common Services occupations in Solen are Security & Protection (2 | 12.5%), Firefighting & Prevention (2 | 12.5%), and Food Preparation & Serving (1 | 6.2%).
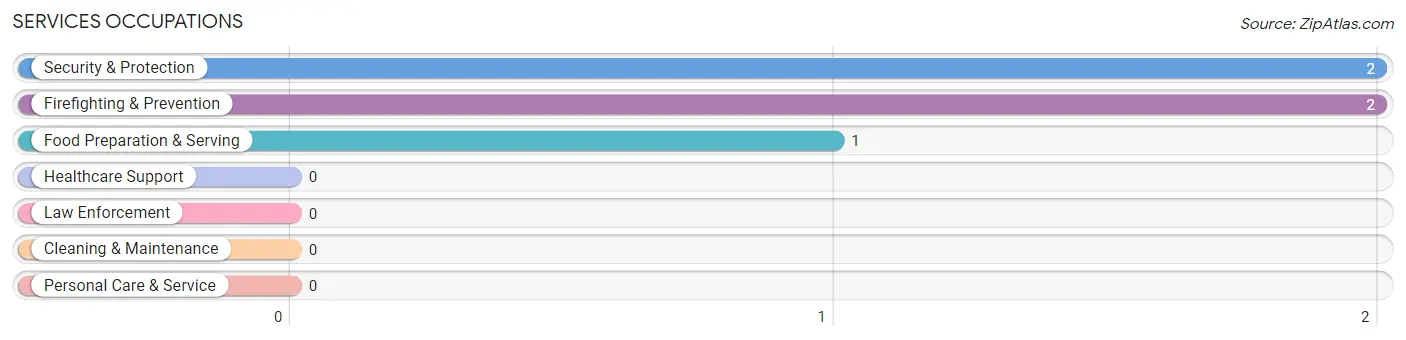
Services Occupations by Sex
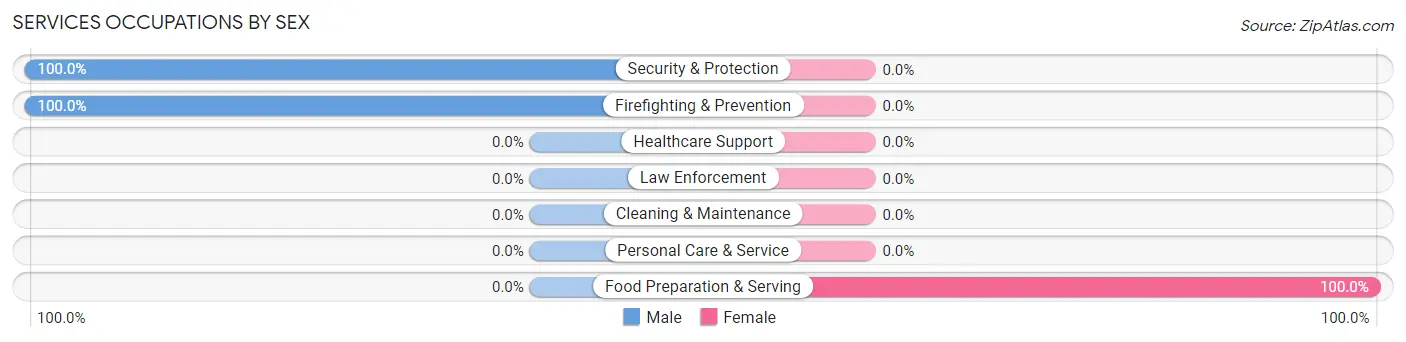
| Occupation | Male | Female |
| Healthcare Support | 0 (0.0%) | 0 (0.0%) |
| Security & Protection | 2 (100.0%) | 0 (0.0%) |
| Firefighting & Prevention | 2 (100.0%) | 0 (0.0%) |
| Law Enforcement | 0 (0.0%) | 0 (0.0%) |
| Food Preparation & Serving | 0 (0.0%) | 1 (100.0%) |
| Cleaning & Maintenance | 0 (0.0%) | 0 (0.0%) |
| Personal Care & Service | 0 (0.0%) | 0 (0.0%) |
| Total (Category) | 2 (66.7%) | 1 (33.3%) |
| Total (Overall) | 6 (37.5%) | 10 (62.5%) |
Sales and Office Occupations
The most common Sales and Office occupations in Solen are Sales & Related (2 | 12.5%), and Office & Administration (2 | 12.5%).
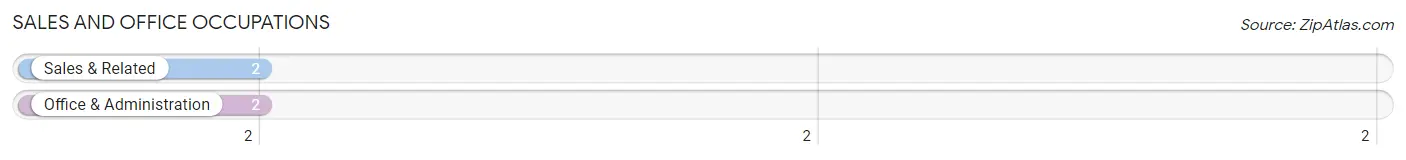
Sales and Office Occupations by Sex
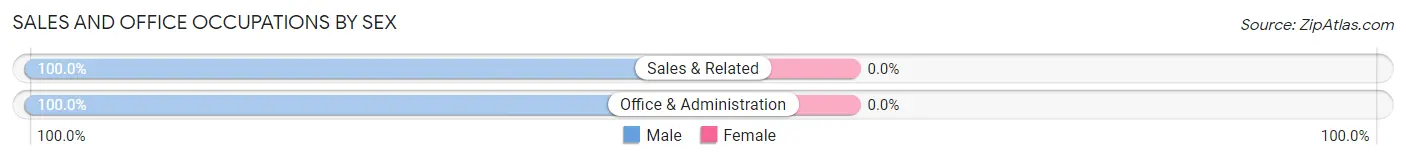
| Occupation | Male | Female |
| Sales & Related | 2 (100.0%) | 0 (0.0%) |
| Office & Administration | 2 (100.0%) | 0 (0.0%) |
| Total (Category) | 4 (100.0%) | 0 (0.0%) |
| Total (Overall) | 6 (37.5%) | 10 (62.5%) |
Natural Resources, Construction and Maintenance Occupations
Natural Resources, Construction and Maintenance Occupations by Sex
| Occupation | Male | Female |
| Farming, Fishing & Forestry | 0 (0.0%) | 0 (0.0%) |
| Construction & Extraction | 0 (0.0%) | 0 (0.0%) |
| Installation, Maintenance & Repair | 0 (0.0%) | 0 (0.0%) |
| Total (Category) | 0 (0.0%) | 0 (0.0%) |
| Total (Overall) | 6 (37.5%) | 10 (62.5%) |
Production, Transportation and Moving Occupations
The most common Production, Transportation and Moving occupations in Solen are , and Transportation (1 | 6.2%).
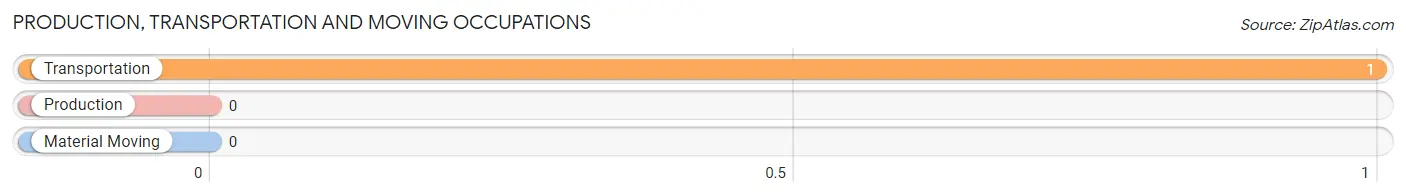
Production, Transportation and Moving Occupations by Sex
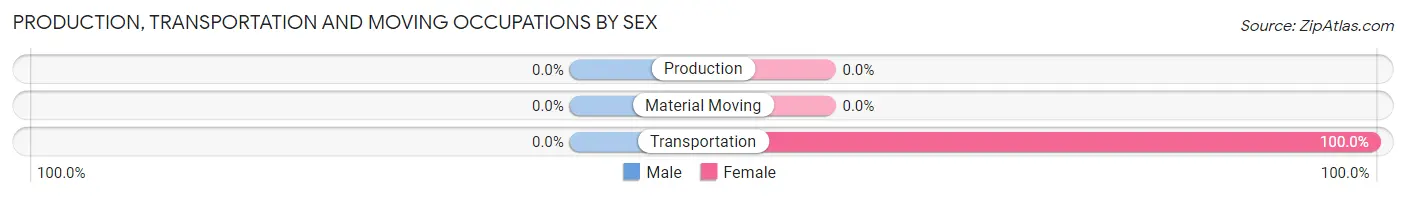
| Occupation | Male | Female |
| Production | 0 (0.0%) | 0 (0.0%) |
| Transportation | 0 (0.0%) | 1 (100.0%) |
| Material Moving | 0 (0.0%) | 0 (0.0%) |
| Total (Category) | 0 (0.0%) | 1 (100.0%) |
| Total (Overall) | 6 (37.5%) | 10 (62.5%) |
Employment Industries by Sex in Solen
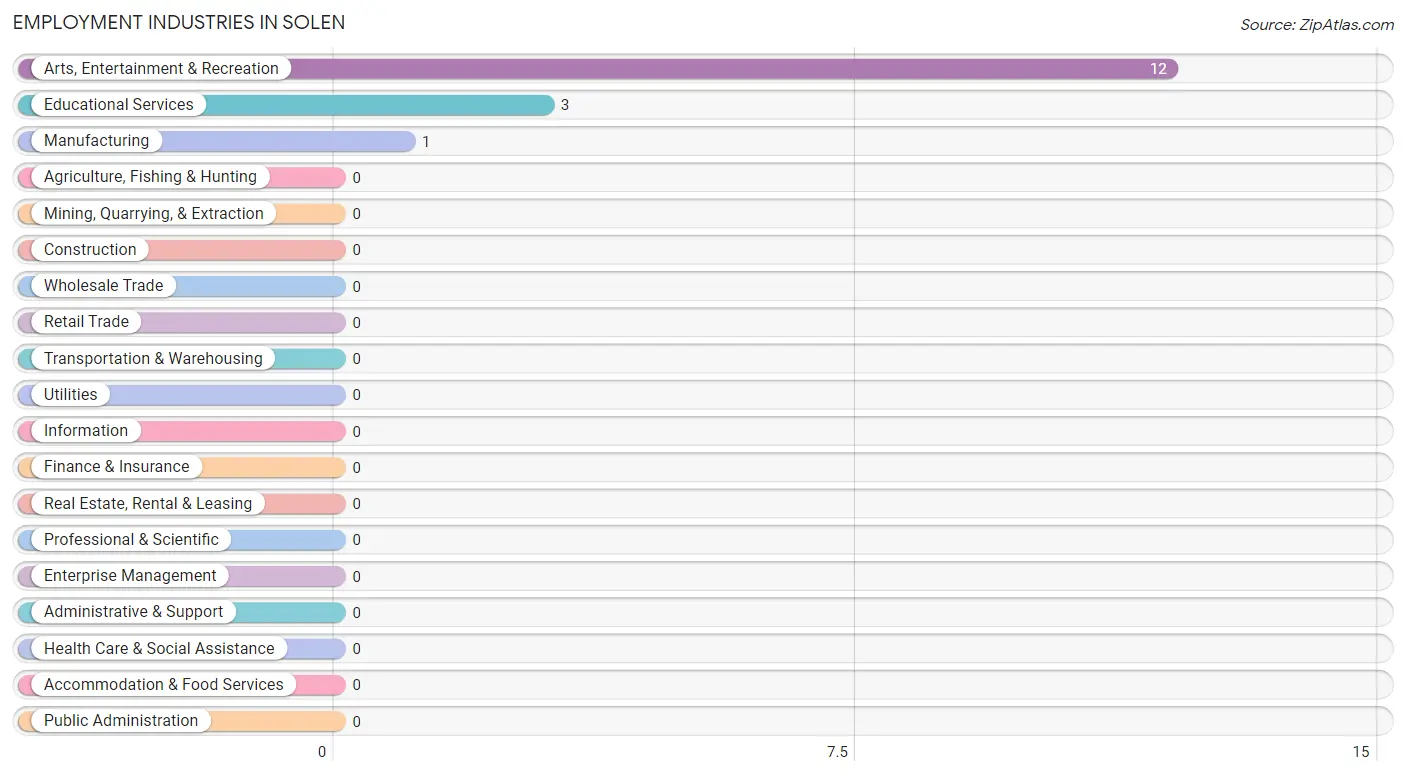
Employment Industries in Solen
The major employment industries in Solen include Arts, Entertainment & Recreation (12 | 75.0%), Educational Services (3 | 18.8%), and Manufacturing (1 | 6.2%).
Employment Industries by Sex in Solen
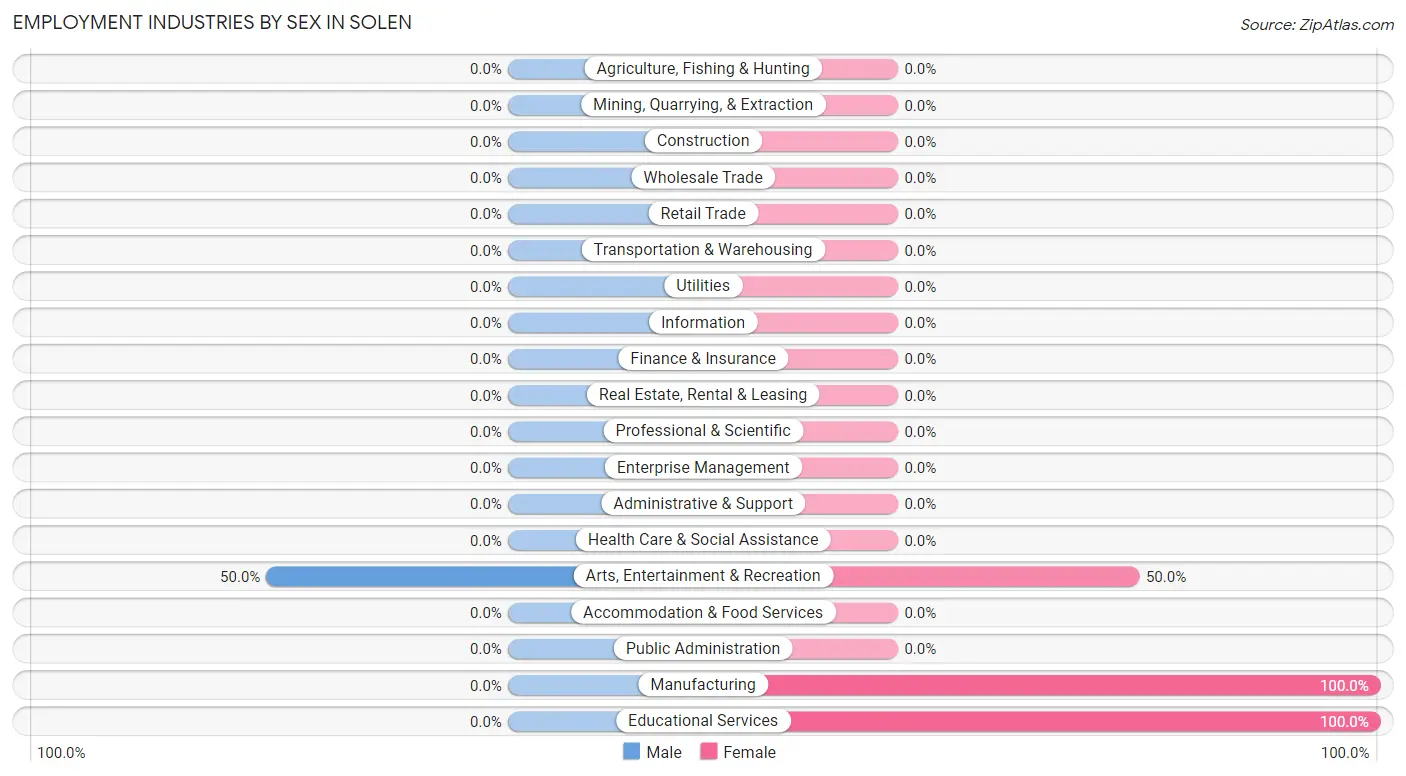
| Industry | Male | Female |
| Agriculture, Fishing & Hunting | 0 (0.0%) | 0 (0.0%) |
| Mining, Quarrying, & Extraction | 0 (0.0%) | 0 (0.0%) |
| Construction | 0 (0.0%) | 0 (0.0%) |
| Manufacturing | 0 (0.0%) | 1 (100.0%) |
| Wholesale Trade | 0 (0.0%) | 0 (0.0%) |
| Retail Trade | 0 (0.0%) | 0 (0.0%) |
| Transportation & Warehousing | 0 (0.0%) | 0 (0.0%) |
| Utilities | 0 (0.0%) | 0 (0.0%) |
| Information | 0 (0.0%) | 0 (0.0%) |
| Finance & Insurance | 0 (0.0%) | 0 (0.0%) |
| Real Estate, Rental & Leasing | 0 (0.0%) | 0 (0.0%) |
| Professional & Scientific | 0 (0.0%) | 0 (0.0%) |
| Enterprise Management | 0 (0.0%) | 0 (0.0%) |
| Administrative & Support | 0 (0.0%) | 0 (0.0%) |
| Educational Services | 0 (0.0%) | 3 (100.0%) |
| Health Care & Social Assistance | 0 (0.0%) | 0 (0.0%) |
| Arts, Entertainment & Recreation | 6 (50.0%) | 6 (50.0%) |
| Accommodation & Food Services | 0 (0.0%) | 0 (0.0%) |
| Public Administration | 0 (0.0%) | 0 (0.0%) |
| Total | 6 (37.5%) | 10 (62.5%) |
Education in Solen
School Enrollment in Solen
The most common levels of schooling among the 19 students in Solen are high school (7 | 36.8%), middle school (6 | 31.6%), and elementary school (5 | 26.3%).
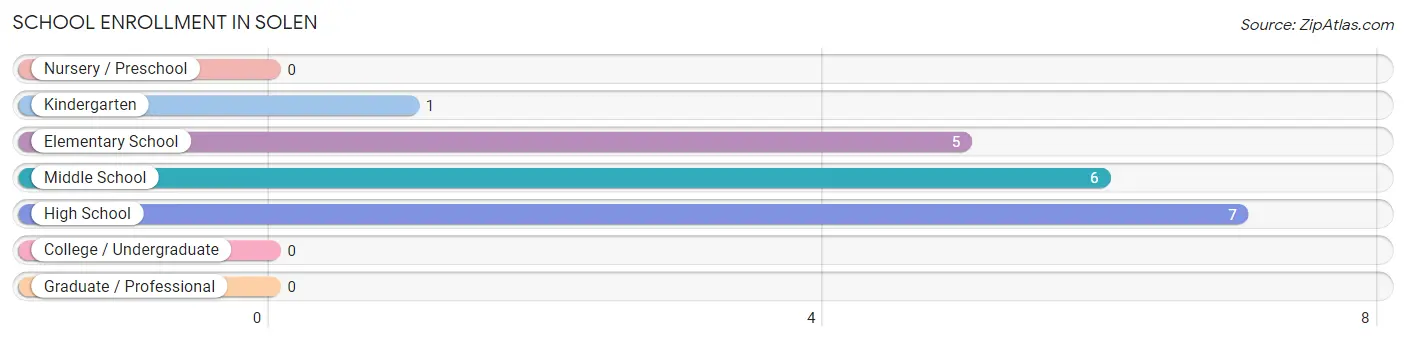
| School Level | # Students | % Students |
| Nursery / Preschool | 0 | 0.0% |
| Kindergarten | 1 | 5.3% |
| Elementary School | 5 | 26.3% |
| Middle School | 6 | 31.6% |
| High School | 7 | 36.8% |
| College / Undergraduate | 0 | 0.0% |
| Graduate / Professional | 0 | 0.0% |
| Total | 19 | 100.0% |
School Enrollment by Age by Funding Source in Solen
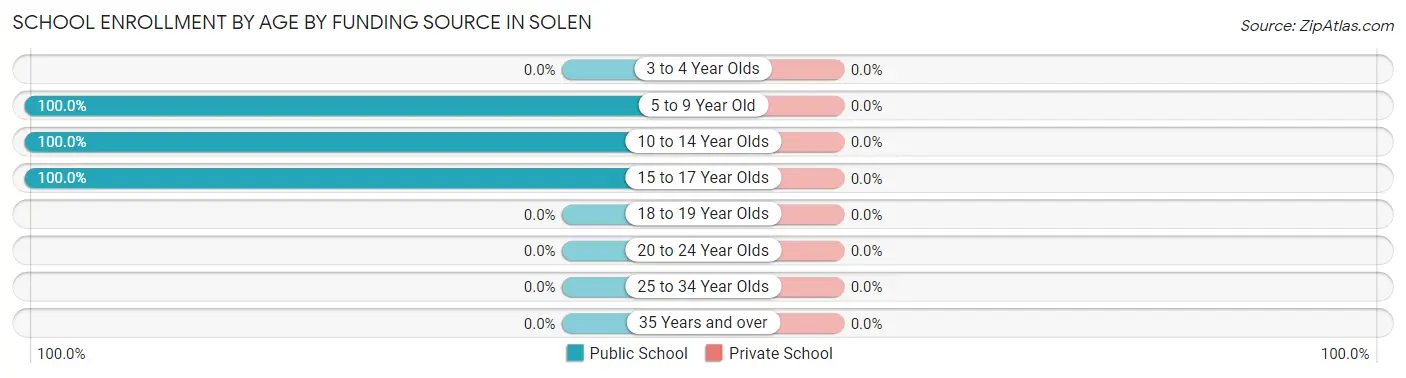
| Age Bracket | Public School | Private School |
| 3 to 4 Year Olds | 0 (0.0%) | 0 (0.0%) |
| 5 to 9 Year Old | 3 (100.0%) | 0 (0.0%) |
| 10 to 14 Year Olds | 9 (100.0%) | 0 (0.0%) |
| 15 to 17 Year Olds | 7 (100.0%) | 0 (0.0%) |
| 18 to 19 Year Olds | 0 (0.0%) | 0 (0.0%) |
| 20 to 24 Year Olds | 0 (0.0%) | 0 (0.0%) |
| 25 to 34 Year Olds | 0 (0.0%) | 0 (0.0%) |
| 35 Years and over | 0 (0.0%) | 0 (0.0%) |
| Total | 19 (100.0%) | 0 (0.0%) |
Educational Attainment by Field of Study in Solen
Education (2 | 66.7%), and science & technology (1 | 33.3%) are the most common fields of study among 3 individuals in Solen who have obtained a bachelor's degree or higher.
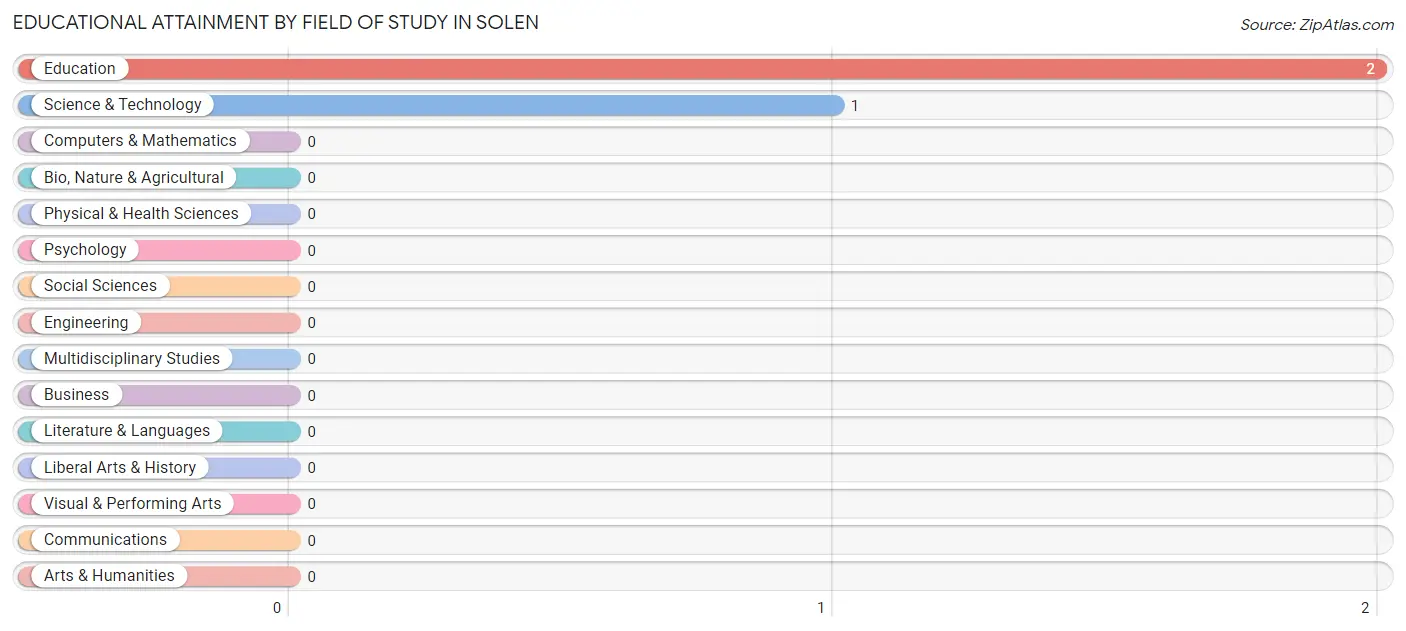
| Field of Study | # Graduates | % Graduates |
| Computers & Mathematics | 0 | 0.0% |
| Bio, Nature & Agricultural | 0 | 0.0% |
| Physical & Health Sciences | 0 | 0.0% |
| Psychology | 0 | 0.0% |
| Social Sciences | 0 | 0.0% |
| Engineering | 0 | 0.0% |
| Multidisciplinary Studies | 0 | 0.0% |
| Science & Technology | 1 | 33.3% |
| Business | 0 | 0.0% |
| Education | 2 | 66.7% |
| Literature & Languages | 0 | 0.0% |
| Liberal Arts & History | 0 | 0.0% |
| Visual & Performing Arts | 0 | 0.0% |
| Communications | 0 | 0.0% |
| Arts & Humanities | 0 | 0.0% |
| Total | 3 | 100.0% |
Transportation & Commute in Solen
Vehicle Availability by Sex in Solen
The most prevalent vehicle ownership categories in Solen are males with 3 vehicles (4, accounting for 66.7%) and females with 3 vehicles (4, making up 40.0%).
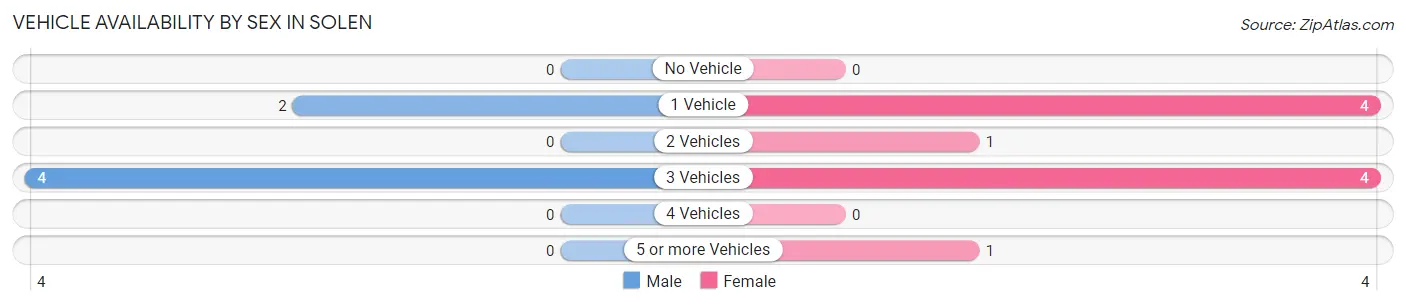
| Vehicles Available | Male | Female |
| No Vehicle | 0 (0.0%) | 0 (0.0%) |
| 1 Vehicle | 2 (33.3%) | 4 (40.0%) |
| 2 Vehicles | 0 (0.0%) | 1 (10.0%) |
| 3 Vehicles | 4 (66.7%) | 4 (40.0%) |
| 4 Vehicles | 0 (0.0%) | 0 (0.0%) |
| 5 or more Vehicles | 0 (0.0%) | 1 (10.0%) |
| Total | 6 (100.0%) | 10 (100.0%) |
Commute Time in Solen
The most frequently occuring commute durations in Solen are 20 to 24 minutes (10 commuters, 62.5%), 15 to 19 minutes (4 commuters, 25.0%), and 5 to 9 minutes (1 commuters, 6.2%).
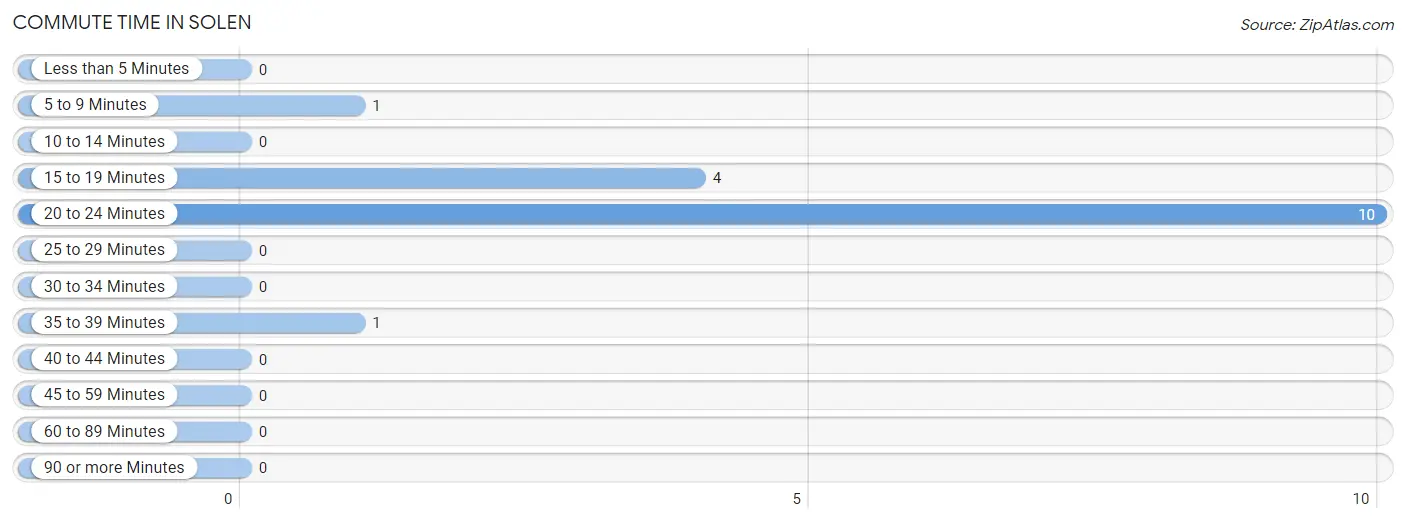
| Commute Time | # Commuters | % Commuters |
| Less than 5 Minutes | 0 | 0.0% |
| 5 to 9 Minutes | 1 | 6.2% |
| 10 to 14 Minutes | 0 | 0.0% |
| 15 to 19 Minutes | 4 | 25.0% |
| 20 to 24 Minutes | 10 | 62.5% |
| 25 to 29 Minutes | 0 | 0.0% |
| 30 to 34 Minutes | 0 | 0.0% |
| 35 to 39 Minutes | 1 | 6.2% |
| 40 to 44 Minutes | 0 | 0.0% |
| 45 to 59 Minutes | 0 | 0.0% |
| 60 to 89 Minutes | 0 | 0.0% |
| 90 or more Minutes | 0 | 0.0% |
Commute Time by Sex in Solen
The most common commute times in Solen are 15 to 19 minutes (4 commuters, 66.7%) for males and 20 to 24 minutes (8 commuters, 80.0%) for females.
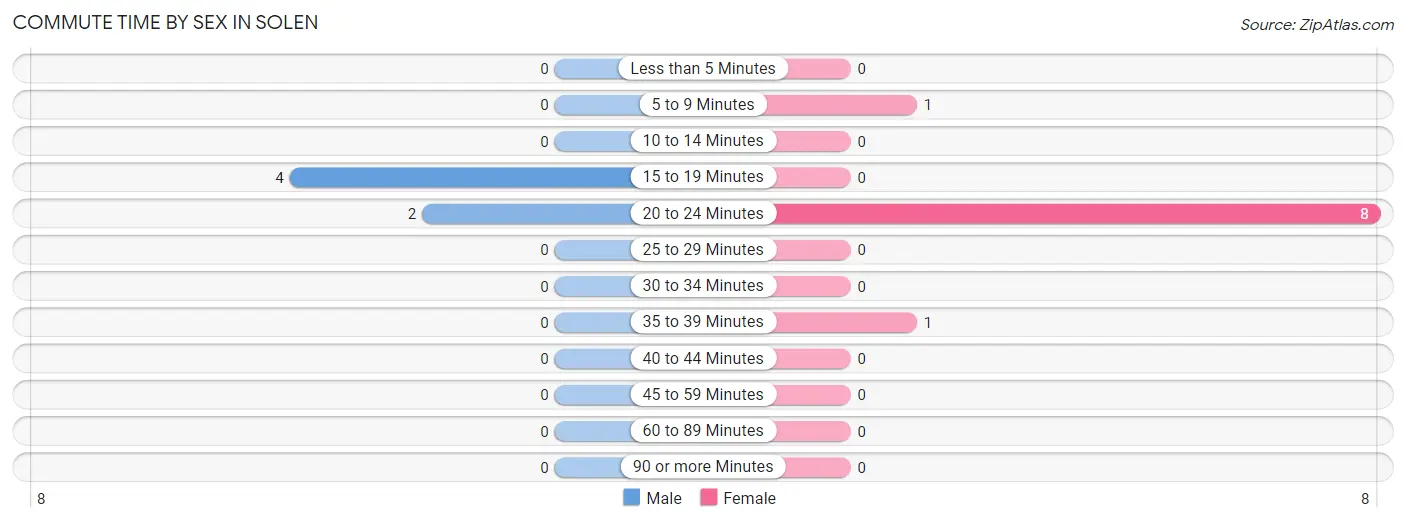
| Commute Time | Male | Female |
| Less than 5 Minutes | 0 (0.0%) | 0 (0.0%) |
| 5 to 9 Minutes | 0 (0.0%) | 1 (10.0%) |
| 10 to 14 Minutes | 0 (0.0%) | 0 (0.0%) |
| 15 to 19 Minutes | 4 (66.7%) | 0 (0.0%) |
| 20 to 24 Minutes | 2 (33.3%) | 8 (80.0%) |
| 25 to 29 Minutes | 0 (0.0%) | 0 (0.0%) |
| 30 to 34 Minutes | 0 (0.0%) | 0 (0.0%) |
| 35 to 39 Minutes | 0 (0.0%) | 1 (10.0%) |
| 40 to 44 Minutes | 0 (0.0%) | 0 (0.0%) |
| 45 to 59 Minutes | 0 (0.0%) | 0 (0.0%) |
| 60 to 89 Minutes | 0 (0.0%) | 0 (0.0%) |
| 90 or more Minutes | 0 (0.0%) | 0 (0.0%) |
Time of Departure to Work by Sex in Solen
The most frequent times of departure to work in Solen are 12:00 PM to 3:59 PM (4, 66.7%) for males and 6:00 AM to 6:29 AM (4, 40.0%) for females.
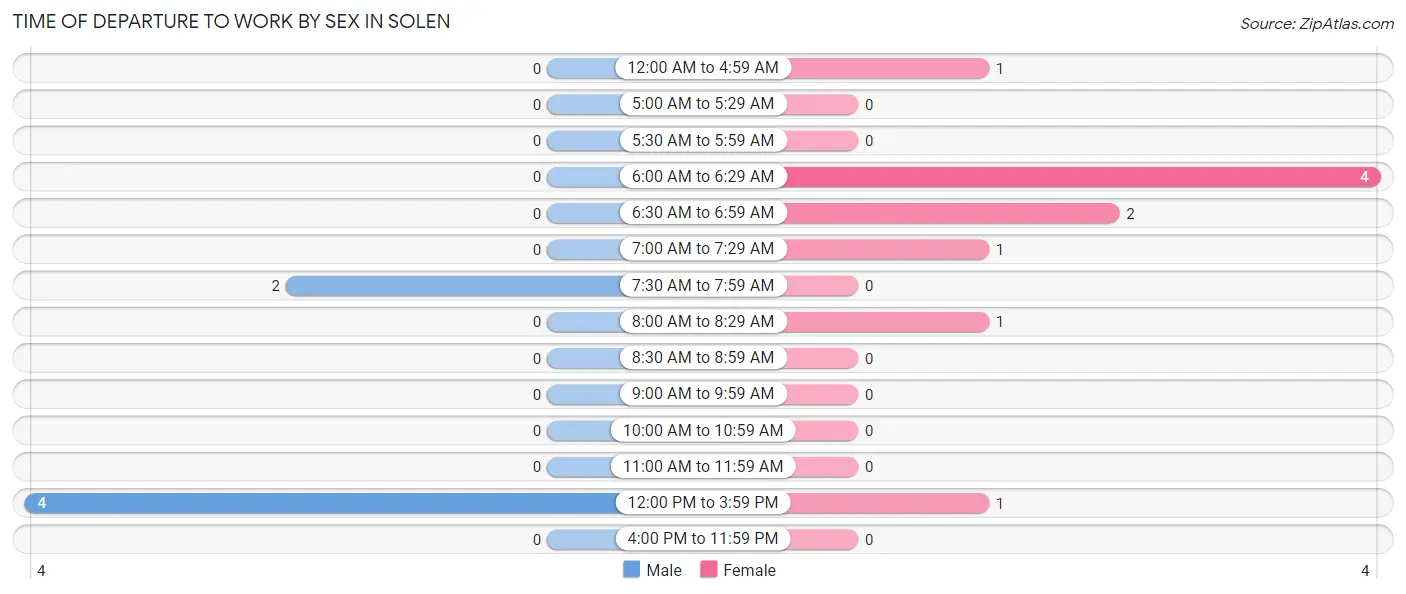
| Time of Departure | Male | Female |
| 12:00 AM to 4:59 AM | 0 (0.0%) | 1 (10.0%) |
| 5:00 AM to 5:29 AM | 0 (0.0%) | 0 (0.0%) |
| 5:30 AM to 5:59 AM | 0 (0.0%) | 0 (0.0%) |
| 6:00 AM to 6:29 AM | 0 (0.0%) | 4 (40.0%) |
| 6:30 AM to 6:59 AM | 0 (0.0%) | 2 (20.0%) |
| 7:00 AM to 7:29 AM | 0 (0.0%) | 1 (10.0%) |
| 7:30 AM to 7:59 AM | 2 (33.3%) | 0 (0.0%) |
| 8:00 AM to 8:29 AM | 0 (0.0%) | 1 (10.0%) |
| 8:30 AM to 8:59 AM | 0 (0.0%) | 0 (0.0%) |
| 9:00 AM to 9:59 AM | 0 (0.0%) | 0 (0.0%) |
| 10:00 AM to 10:59 AM | 0 (0.0%) | 0 (0.0%) |
| 11:00 AM to 11:59 AM | 0 (0.0%) | 0 (0.0%) |
| 12:00 PM to 3:59 PM | 4 (66.7%) | 1 (10.0%) |
| 4:00 PM to 11:59 PM | 0 (0.0%) | 0 (0.0%) |
| Total | 6 (100.0%) | 10 (100.0%) |
Housing Occupancy in Solen
Occupancy by Ownership in Solen
Of the total 26 dwellings in Solen, owner-occupied units account for 21 (80.8%), while renter-occupied units make up 5 (19.2%).
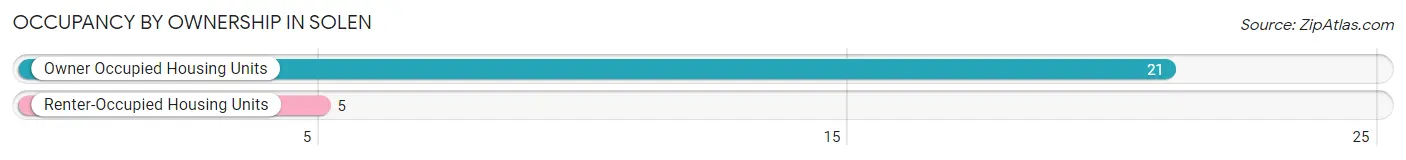
| Occupancy | # Housing Units | % Housing Units |
| Owner Occupied Housing Units | 21 | 80.8% |
| Renter-Occupied Housing Units | 5 | 19.2% |
| Total Occupied Housing Units | 26 | 100.0% |
Occupancy by Household Size in Solen
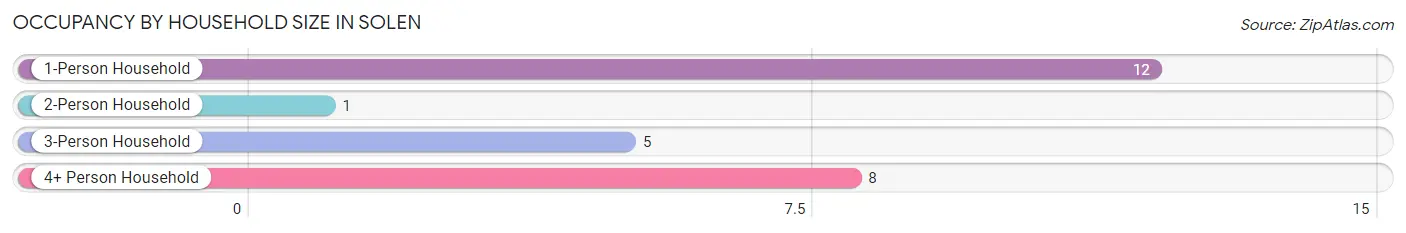
| Household Size | # Housing Units | % Housing Units |
| 1-Person Household | 12 | 46.2% |
| 2-Person Household | 1 | 3.8% |
| 3-Person Household | 5 | 19.2% |
| 4+ Person Household | 8 | 30.8% |
| Total Housing Units | 26 | 100.0% |
Occupancy by Ownership by Household Size in Solen
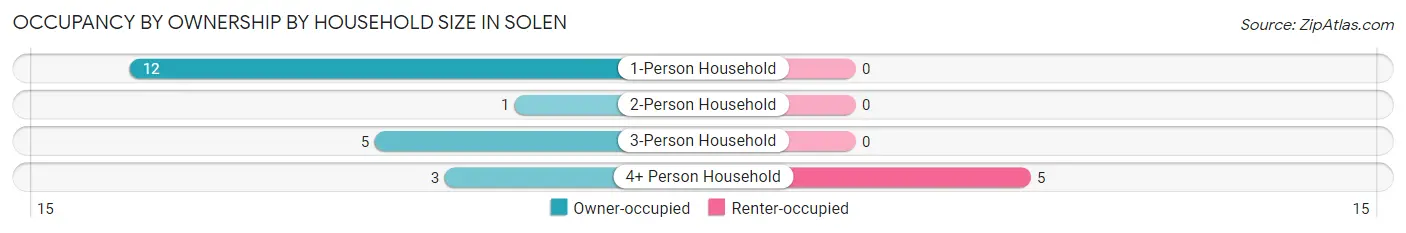
| Household Size | Owner-occupied | Renter-occupied |
| 1-Person Household | 12 (100.0%) | 0 (0.0%) |
| 2-Person Household | 1 (100.0%) | 0 (0.0%) |
| 3-Person Household | 5 (100.0%) | 0 (0.0%) |
| 4+ Person Household | 3 (37.5%) | 5 (62.5%) |
| Total Housing Units | 21 (80.8%) | 5 (19.2%) |
Occupancy by Educational Attainment in Solen
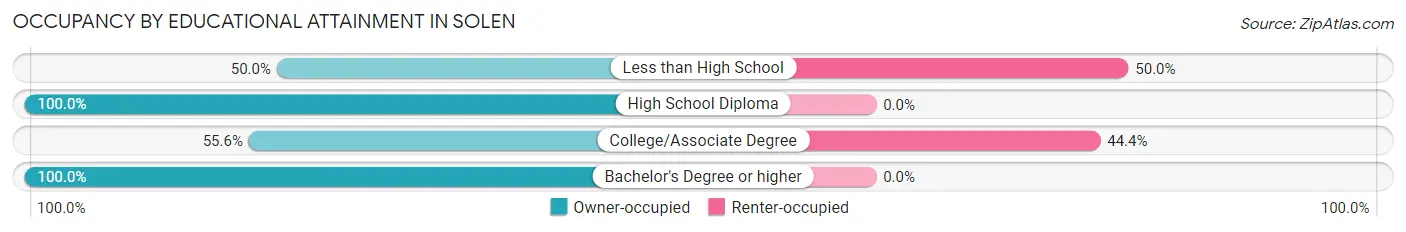
| Household Size | Owner-occupied | Renter-occupied |
| Less than High School | 1 (50.0%) | 1 (50.0%) |
| High School Diploma | 12 (100.0%) | 0 (0.0%) |
| College/Associate Degree | 5 (55.6%) | 4 (44.4%) |
| Bachelor's Degree or higher | 3 (100.0%) | 0 (0.0%) |
Occupancy by Age of Householder in Solen
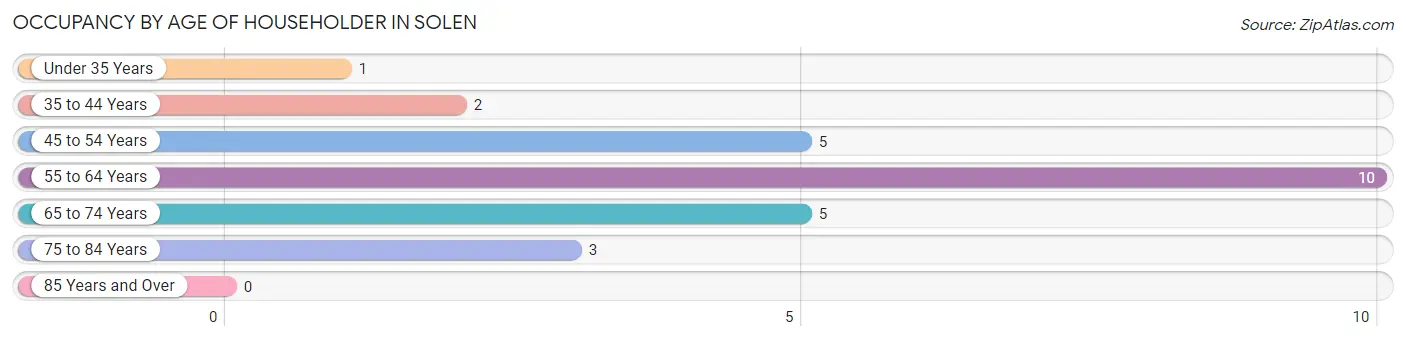
| Age Bracket | # Households | % Households |
| Under 35 Years | 1 | 3.8% |
| 35 to 44 Years | 2 | 7.7% |
| 45 to 54 Years | 5 | 19.2% |
| 55 to 64 Years | 10 | 38.5% |
| 65 to 74 Years | 5 | 19.2% |
| 75 to 84 Years | 3 | 11.5% |
| 85 Years and Over | 0 | 0.0% |
| Total | 26 | 100.0% |
Housing Finances in Solen
Median Income by Occupancy in Solen
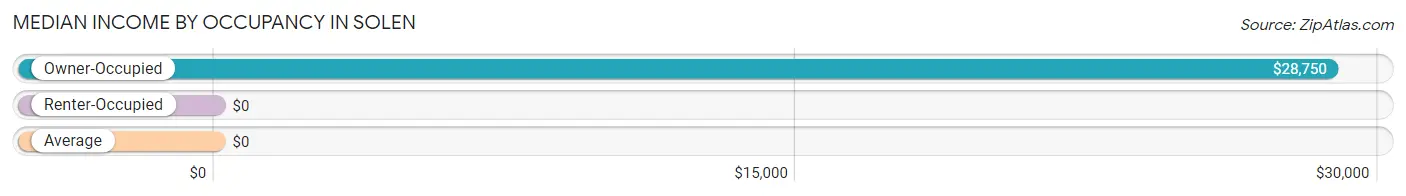
| Occupancy Type | # Households | Median Income |
| Owner-Occupied | 21 (80.8%) | $28,750 |
| Renter-Occupied | 5 (19.2%) | $0 |
| Average | 26 (100.0%) | $0 |
Occupancy by Householder Income Bracket in Solen
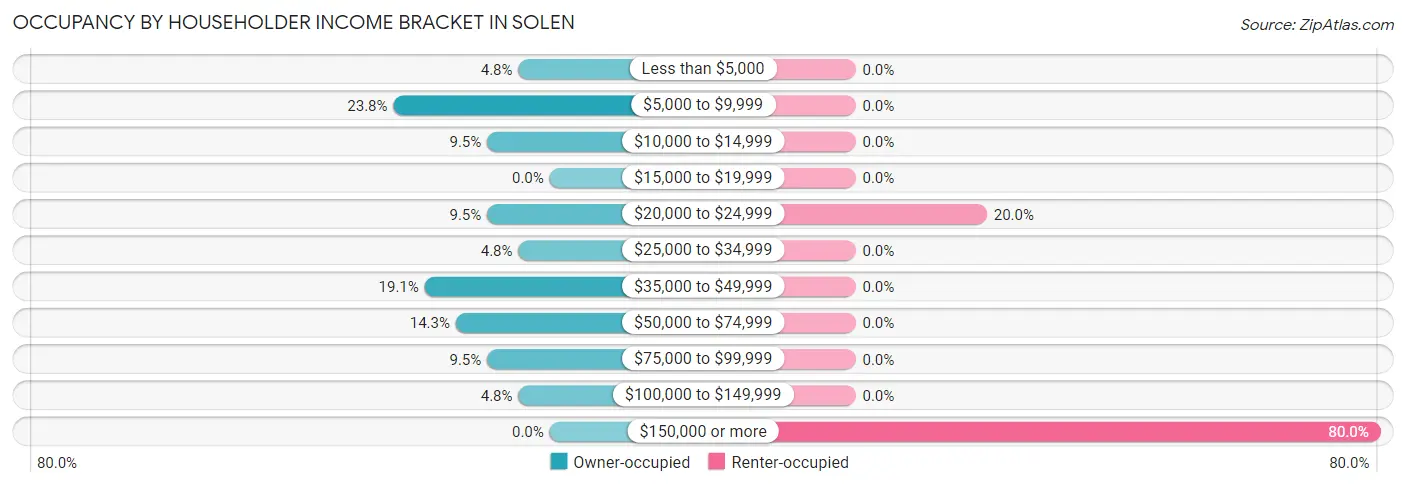
| Income Bracket | Owner-occupied | Renter-occupied |
| Less than $5,000 | 1 (4.8%) | 0 (0.0%) |
| $5,000 to $9,999 | 5 (23.8%) | 0 (0.0%) |
| $10,000 to $14,999 | 2 (9.5%) | 0 (0.0%) |
| $15,000 to $19,999 | 0 (0.0%) | 0 (0.0%) |
| $20,000 to $24,999 | 2 (9.5%) | 1 (20.0%) |
| $25,000 to $34,999 | 1 (4.8%) | 0 (0.0%) |
| $35,000 to $49,999 | 4 (19.1%) | 0 (0.0%) |
| $50,000 to $74,999 | 3 (14.3%) | 0 (0.0%) |
| $75,000 to $99,999 | 2 (9.5%) | 0 (0.0%) |
| $100,000 to $149,999 | 1 (4.8%) | 0 (0.0%) |
| $150,000 or more | 0 (0.0%) | 4 (80.0%) |
| Total | 21 (100.0%) | 5 (100.0%) |
Monthly Housing Cost Tiers in Solen
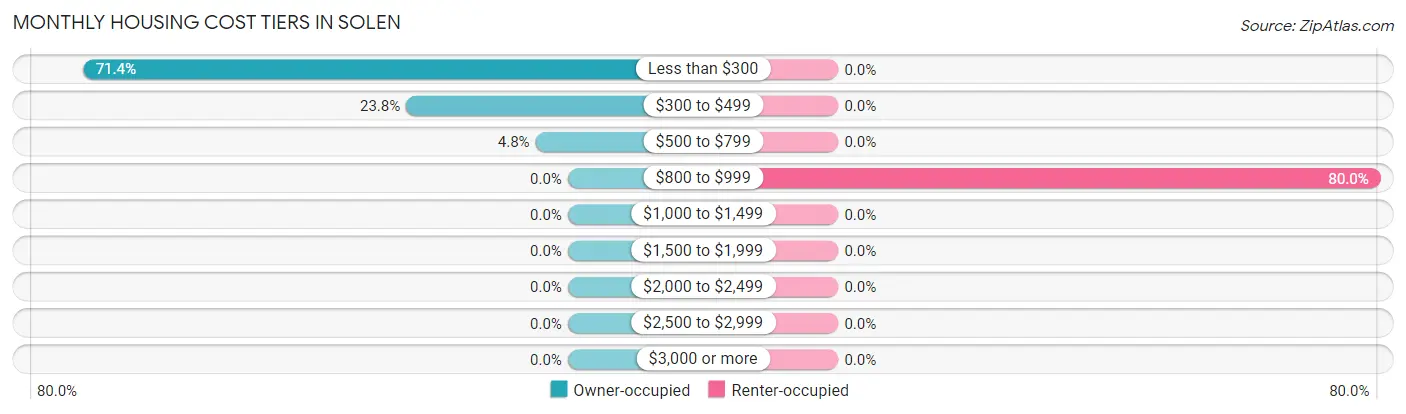
| Monthly Cost | Owner-occupied | Renter-occupied |
| Less than $300 | 15 (71.4%) | 0 (0.0%) |
| $300 to $499 | 5 (23.8%) | 0 (0.0%) |
| $500 to $799 | 1 (4.8%) | 0 (0.0%) |
| $800 to $999 | 0 (0.0%) | 4 (80.0%) |
| $1,000 to $1,499 | 0 (0.0%) | 0 (0.0%) |
| $1,500 to $1,999 | 0 (0.0%) | 0 (0.0%) |
| $2,000 to $2,499 | 0 (0.0%) | 0 (0.0%) |
| $2,500 to $2,999 | 0 (0.0%) | 0 (0.0%) |
| $3,000 or more | 0 (0.0%) | 0 (0.0%) |
| Total | 21 (100.0%) | 5 (100.0%) |
Physical Housing Characteristics in Solen
Housing Structures in Solen
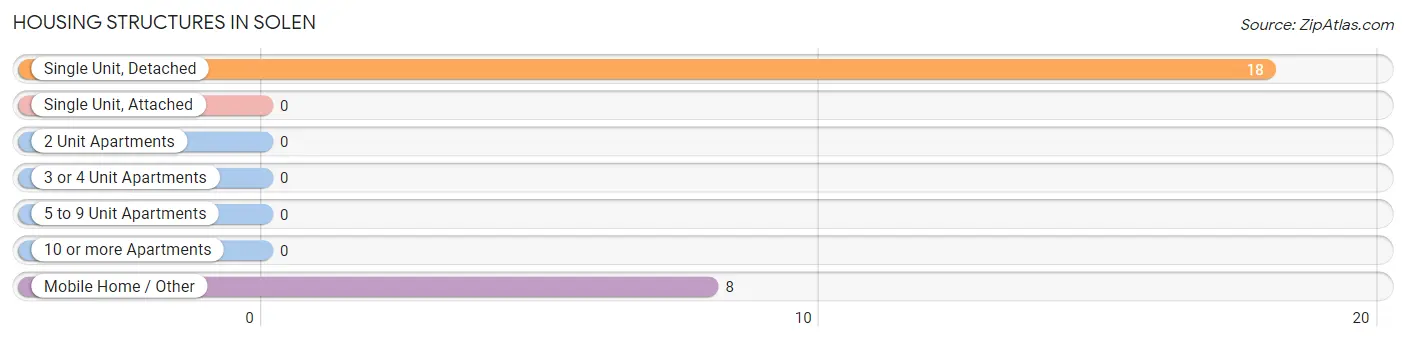
| Structure Type | # Housing Units | % Housing Units |
| Single Unit, Detached | 18 | 69.2% |
| Single Unit, Attached | 0 | 0.0% |
| 2 Unit Apartments | 0 | 0.0% |
| 3 or 4 Unit Apartments | 0 | 0.0% |
| 5 to 9 Unit Apartments | 0 | 0.0% |
| 10 or more Apartments | 0 | 0.0% |
| Mobile Home / Other | 8 | 30.8% |
| Total | 26 | 100.0% |
Housing Structures by Occupancy in Solen
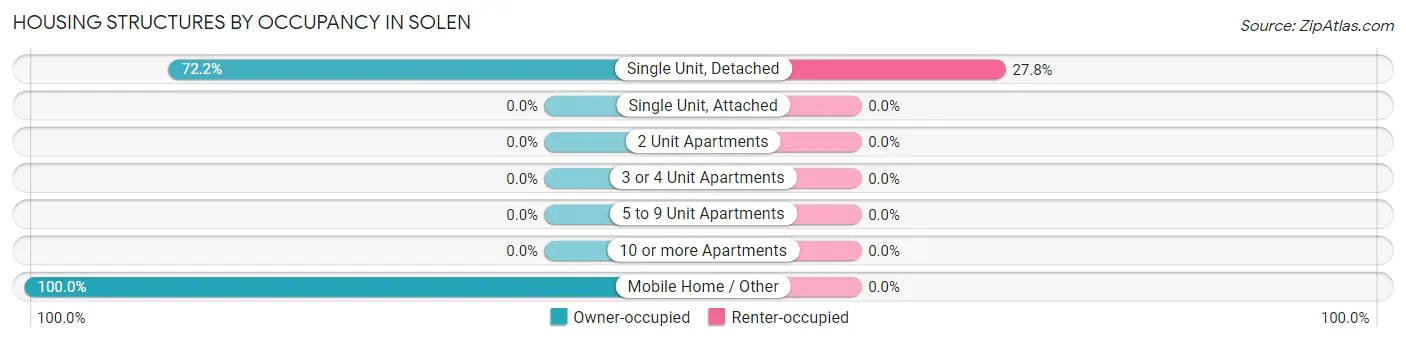
| Structure Type | Owner-occupied | Renter-occupied |
| Single Unit, Detached | 13 (72.2%) | 5 (27.8%) |
| Single Unit, Attached | 0 (0.0%) | 0 (0.0%) |
| 2 Unit Apartments | 0 (0.0%) | 0 (0.0%) |
| 3 or 4 Unit Apartments | 0 (0.0%) | 0 (0.0%) |
| 5 to 9 Unit Apartments | 0 (0.0%) | 0 (0.0%) |
| 10 or more Apartments | 0 (0.0%) | 0 (0.0%) |
| Mobile Home / Other | 8 (100.0%) | 0 (0.0%) |
| Total | 21 (80.8%) | 5 (19.2%) |
Housing Structures by Number of Rooms in Solen
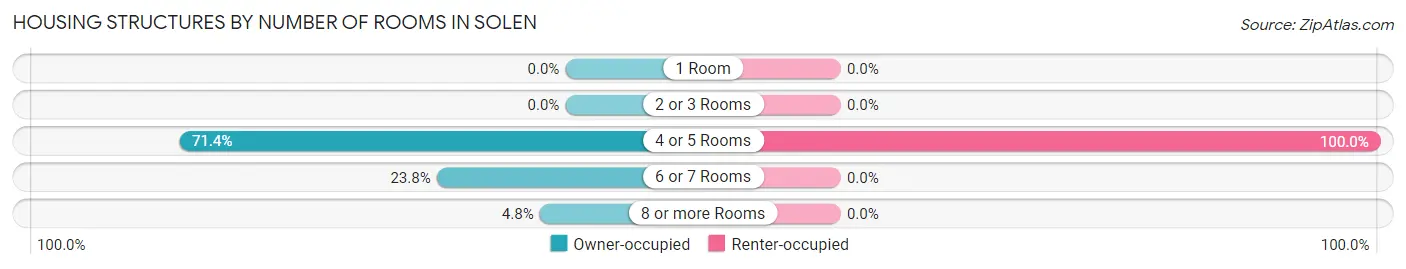
| Number of Rooms | Owner-occupied | Renter-occupied |
| 1 Room | 0 (0.0%) | 0 (0.0%) |
| 2 or 3 Rooms | 0 (0.0%) | 0 (0.0%) |
| 4 or 5 Rooms | 15 (71.4%) | 5 (100.0%) |
| 6 or 7 Rooms | 5 (23.8%) | 0 (0.0%) |
| 8 or more Rooms | 1 (4.8%) | 0 (0.0%) |
| Total | 21 (100.0%) | 5 (100.0%) |
Housing Structure by Heating Type in Solen
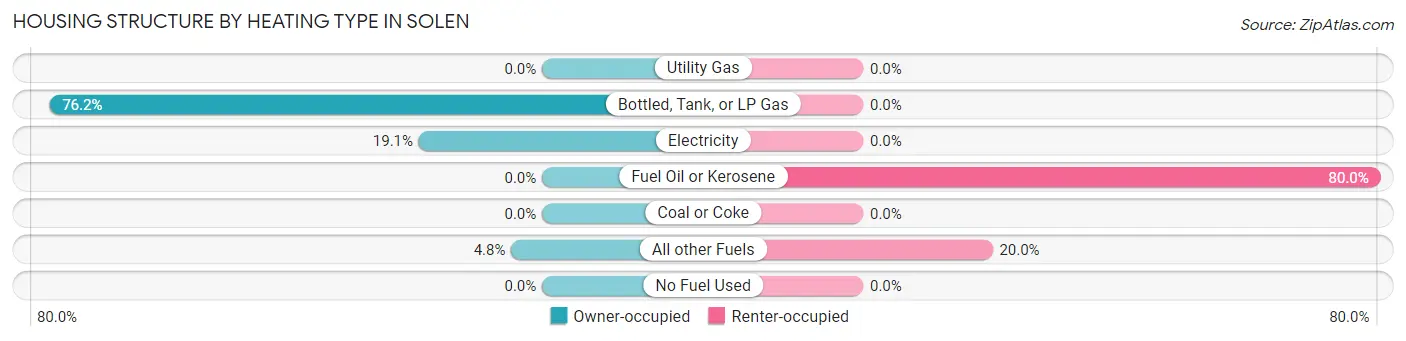
| Heating Type | Owner-occupied | Renter-occupied |
| Utility Gas | 0 (0.0%) | 0 (0.0%) |
| Bottled, Tank, or LP Gas | 16 (76.2%) | 0 (0.0%) |
| Electricity | 4 (19.1%) | 0 (0.0%) |
| Fuel Oil or Kerosene | 0 (0.0%) | 4 (80.0%) |
| Coal or Coke | 0 (0.0%) | 0 (0.0%) |
| All other Fuels | 1 (4.8%) | 1 (20.0%) |
| No Fuel Used | 0 (0.0%) | 0 (0.0%) |
| Total | 21 (100.0%) | 5 (100.0%) |
Household Vehicle Usage in Solen
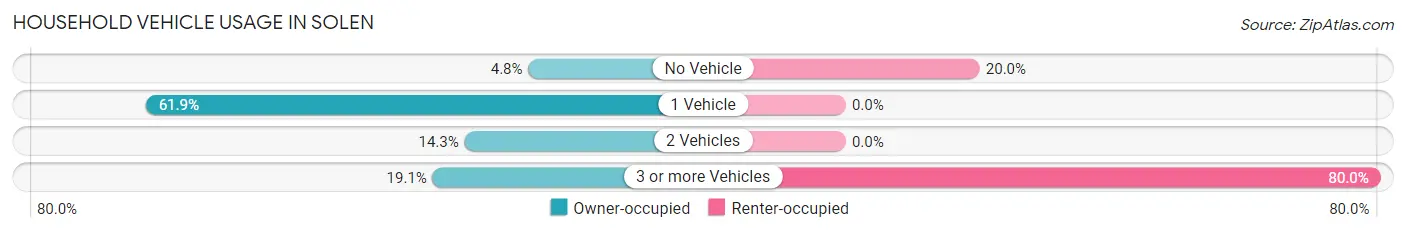
| Vehicles per Household | Owner-occupied | Renter-occupied |
| No Vehicle | 1 (4.8%) | 1 (20.0%) |
| 1 Vehicle | 13 (61.9%) | 0 (0.0%) |
| 2 Vehicles | 3 (14.3%) | 0 (0.0%) |
| 3 or more Vehicles | 4 (19.1%) | 4 (80.0%) |
| Total | 21 (100.0%) | 5 (100.0%) |
Real Estate & Mortgages in Solen
Real Estate and Mortgage Overview in Solen
| Characteristic | Without Mortgage | With Mortgage |
| Housing Units | 20 | 1 |
| Median Property Value | $13,300 | $0 |
| Median Household Income | - | - |
| Monthly Housing Costs | $258 | $0 |
| Real Estate Taxes | $199 | $0 |
Property Value by Mortgage Status in Solen
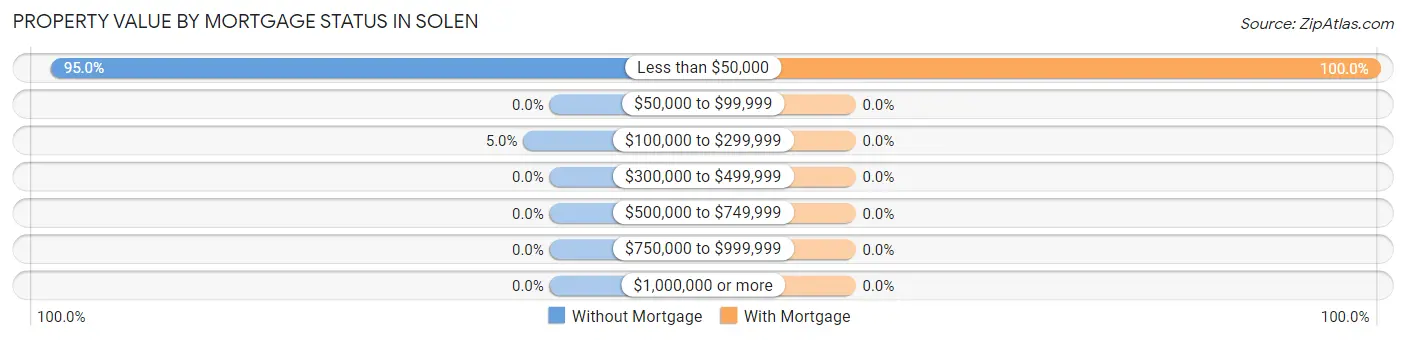
| Property Value | Without Mortgage | With Mortgage |
| Less than $50,000 | 19 (95.0%) | 1 (100.0%) |
| $50,000 to $99,999 | 0 (0.0%) | 0 (0.0%) |
| $100,000 to $299,999 | 1 (5.0%) | 0 (0.0%) |
| $300,000 to $499,999 | 0 (0.0%) | 0 (0.0%) |
| $500,000 to $749,999 | 0 (0.0%) | 0 (0.0%) |
| $750,000 to $999,999 | 0 (0.0%) | 0 (0.0%) |
| $1,000,000 or more | 0 (0.0%) | 0 (0.0%) |
| Total | 20 (100.0%) | 1 (100.0%) |
Household Income by Mortgage Status in Solen
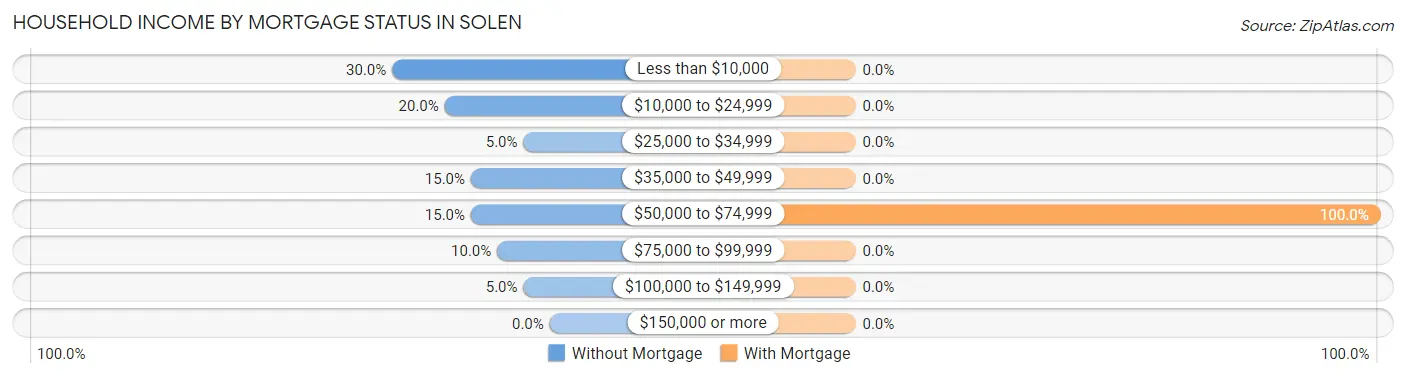
| Household Income | Without Mortgage | With Mortgage |
| Less than $10,000 | 6 (30.0%) | 0 (0.0%) |
| $10,000 to $24,999 | 4 (20.0%) | 0 (0.0%) |
| $25,000 to $34,999 | 1 (5.0%) | 0 (0.0%) |
| $35,000 to $49,999 | 3 (15.0%) | 0 (0.0%) |
| $50,000 to $74,999 | 3 (15.0%) | 1 (100.0%) |
| $75,000 to $99,999 | 2 (10.0%) | 0 (0.0%) |
| $100,000 to $149,999 | 1 (5.0%) | 0 (0.0%) |
| $150,000 or more | 0 (0.0%) | 0 (0.0%) |
| Total | 20 (100.0%) | 1 (100.0%) |
Property Value to Household Income Ratio in Solen
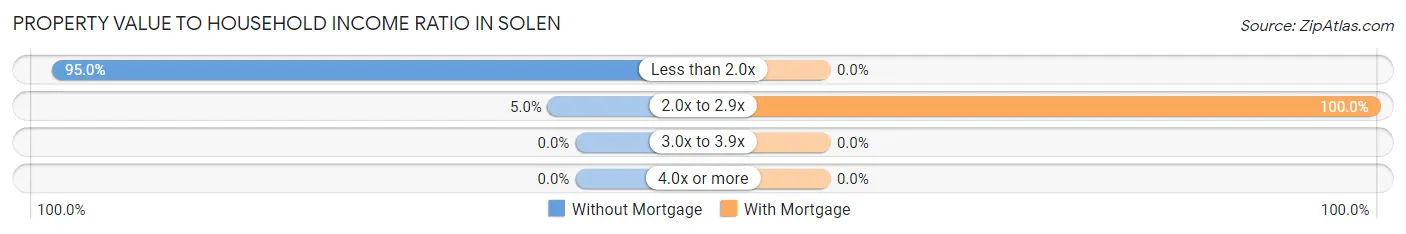
| Value-to-Income Ratio | Without Mortgage | With Mortgage |
| Less than 2.0x | 19 (95.0%) | 0 (0.0%) |
| 2.0x to 2.9x | 1 (5.0%) | 1 (100.0%) |
| 3.0x to 3.9x | 0 (0.0%) | 0 (0.0%) |
| 4.0x or more | 0 (0.0%) | 0 (0.0%) |
| Total | 20 (100.0%) | 1 (100.0%) |
Real Estate Taxes by Mortgage Status in Solen
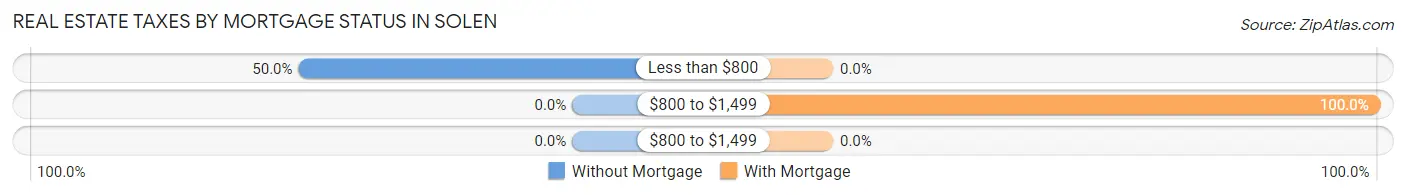
| Property Taxes | Without Mortgage | With Mortgage |
| Less than $800 | 10 (50.0%) | 0 (0.0%) |
| $800 to $1,499 | 0 (0.0%) | 1 (100.0%) |
| $800 to $1,499 | 0 (0.0%) | 0 (0.0%) |
| Total | 20 (100.0%) | 1 (100.0%) |
Health & Disability in Solen
Health Insurance Coverage by Age in Solen
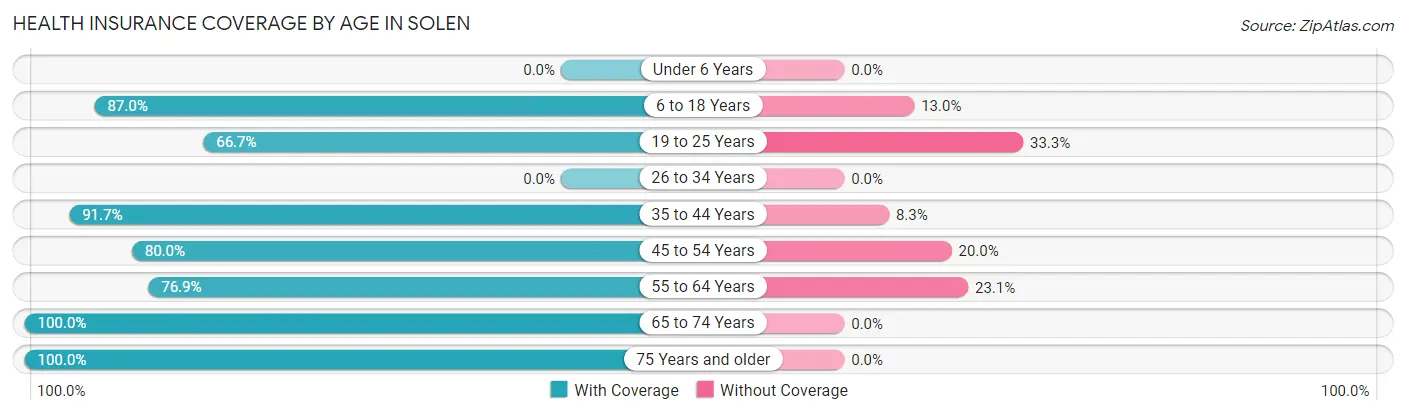
| Age Bracket | With Coverage | Without Coverage |
| Under 6 Years | 0 (0.0%) | 0 (0.0%) |
| 6 to 18 Years | 20 (87.0%) | 3 (13.0%) |
| 19 to 25 Years | 4 (66.7%) | 2 (33.3%) |
| 26 to 34 Years | 0 (0.0%) | 0 (0.0%) |
| 35 to 44 Years | 11 (91.7%) | 1 (8.3%) |
| 45 to 54 Years | 8 (80.0%) | 2 (20.0%) |
| 55 to 64 Years | 10 (76.9%) | 3 (23.1%) |
| 65 to 74 Years | 7 (100.0%) | 0 (0.0%) |
| 75 Years and older | 3 (100.0%) | 0 (0.0%) |
| Total | 63 (85.1%) | 11 (14.9%) |
Health Insurance Coverage by Citizenship Status in Solen
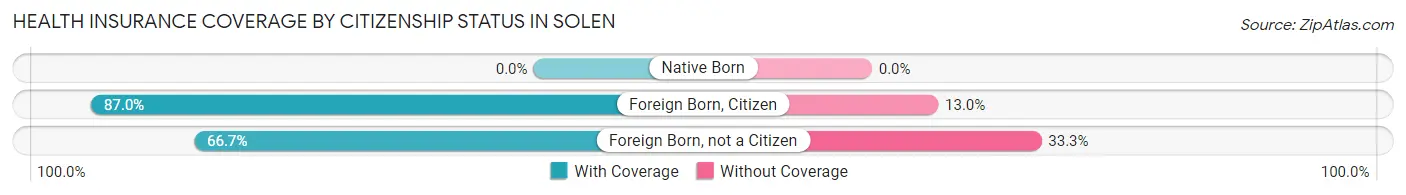
| Citizenship Status | With Coverage | Without Coverage |
| Native Born | 0 (0.0%) | 0 (0.0%) |
| Foreign Born, Citizen | 20 (87.0%) | 3 (13.0%) |
| Foreign Born, not a Citizen | 4 (66.7%) | 2 (33.3%) |
Health Insurance Coverage by Household Income in Solen
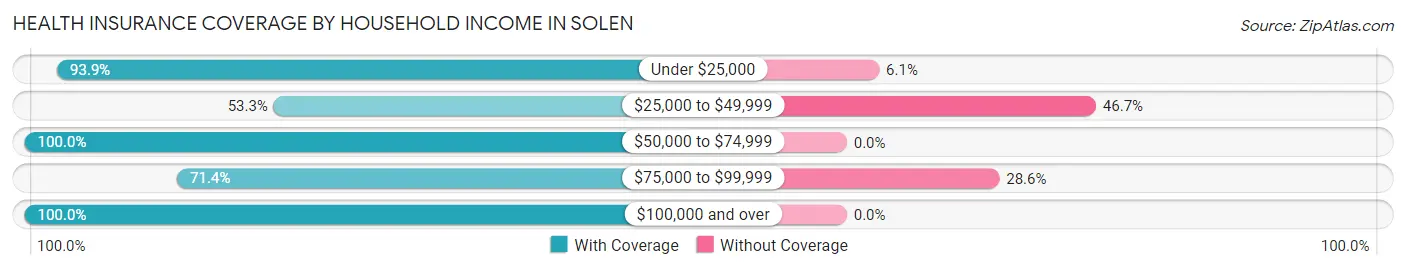
| Household Income | With Coverage | Without Coverage |
| Under $25,000 | 31 (93.9%) | 2 (6.1%) |
| $25,000 to $49,999 | 8 (53.3%) | 7 (46.7%) |
| $50,000 to $74,999 | 6 (100.0%) | 0 (0.0%) |
| $75,000 to $99,999 | 5 (71.4%) | 2 (28.6%) |
| $100,000 and over | 13 (100.0%) | 0 (0.0%) |
Public vs Private Health Insurance Coverage by Age in Solen
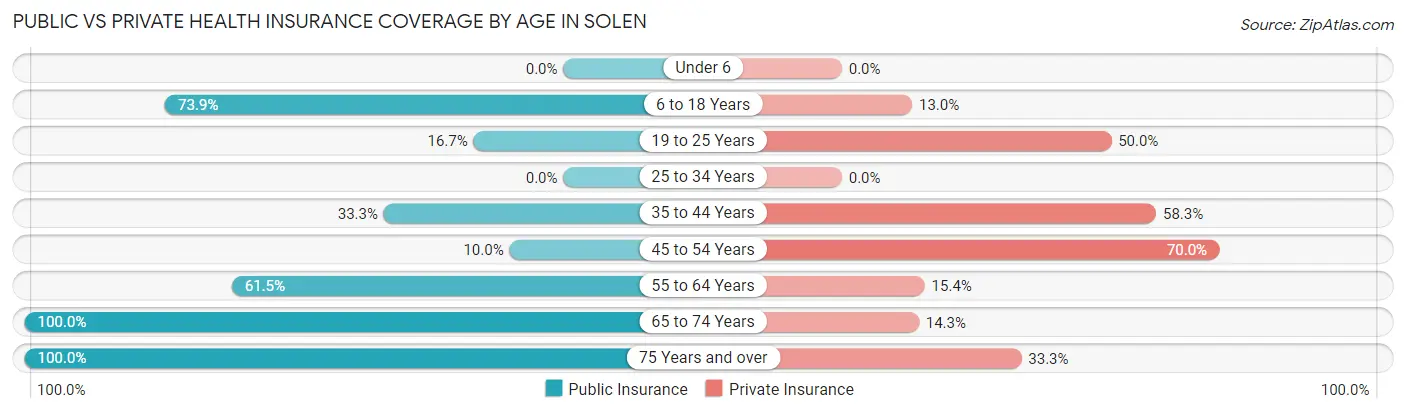
| Age Bracket | Public Insurance | Private Insurance |
| Under 6 | 0 (0.0%) | 0 (0.0%) |
| 6 to 18 Years | 17 (73.9%) | 3 (13.0%) |
| 19 to 25 Years | 1 (16.7%) | 3 (50.0%) |
| 25 to 34 Years | 0 (0.0%) | 0 (0.0%) |
| 35 to 44 Years | 4 (33.3%) | 7 (58.3%) |
| 45 to 54 Years | 1 (10.0%) | 7 (70.0%) |
| 55 to 64 Years | 8 (61.5%) | 2 (15.4%) |
| 65 to 74 Years | 7 (100.0%) | 1 (14.3%) |
| 75 Years and over | 3 (100.0%) | 1 (33.3%) |
| Total | 41 (55.4%) | 24 (32.4%) |
Disability Status by Sex by Age in Solen
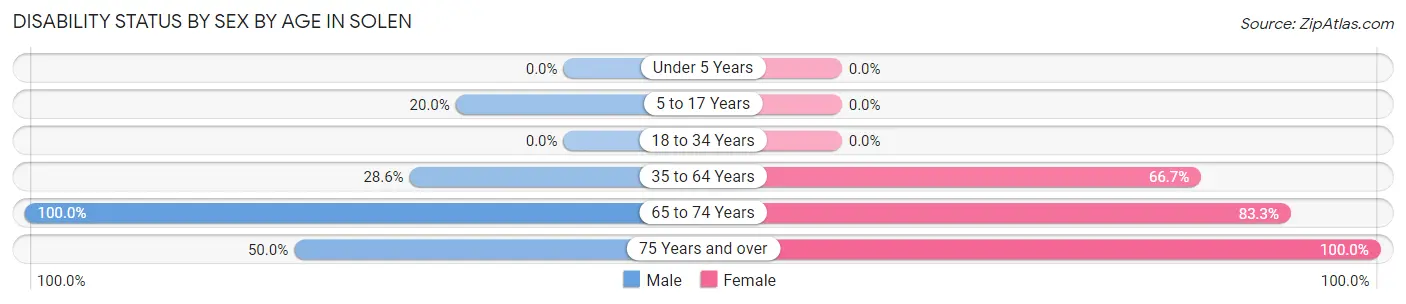
| Age Bracket | Male | Female |
| Under 5 Years | 0 (0.0%) | 0 (0.0%) |
| 5 to 17 Years | 3 (20.0%) | 0 (0.0%) |
| 18 to 34 Years | 0 (0.0%) | 0 (0.0%) |
| 35 to 64 Years | 4 (28.6%) | 14 (66.7%) |
| 65 to 74 Years | 1 (100.0%) | 5 (83.3%) |
| 75 Years and over | 1 (50.0%) | 1 (100.0%) |
Disability Class by Sex by Age in Solen
Disability Class: Hearing Difficulty
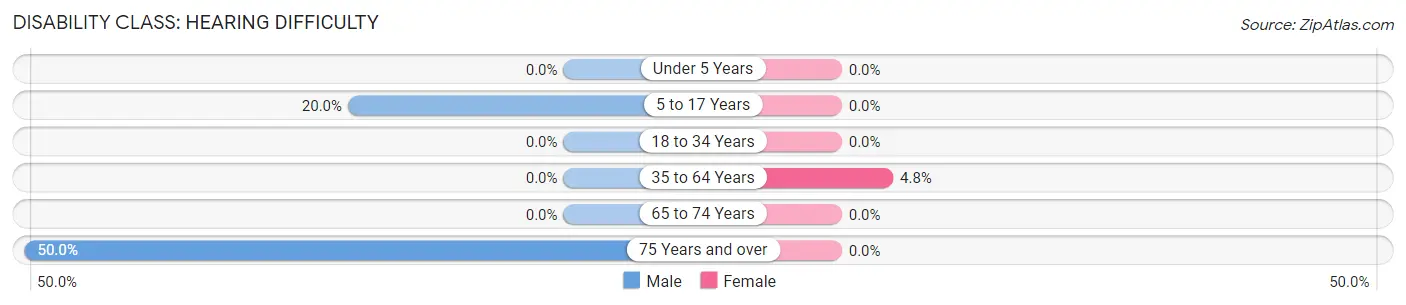
| Age Bracket | Male | Female |
| Under 5 Years | 0 (0.0%) | 0 (0.0%) |
| 5 to 17 Years | 3 (20.0%) | 0 (0.0%) |
| 18 to 34 Years | 0 (0.0%) | 0 (0.0%) |
| 35 to 64 Years | 0 (0.0%) | 1 (4.8%) |
| 65 to 74 Years | 0 (0.0%) | 0 (0.0%) |
| 75 Years and over | 1 (50.0%) | 0 (0.0%) |
Disability Class: Vision Difficulty
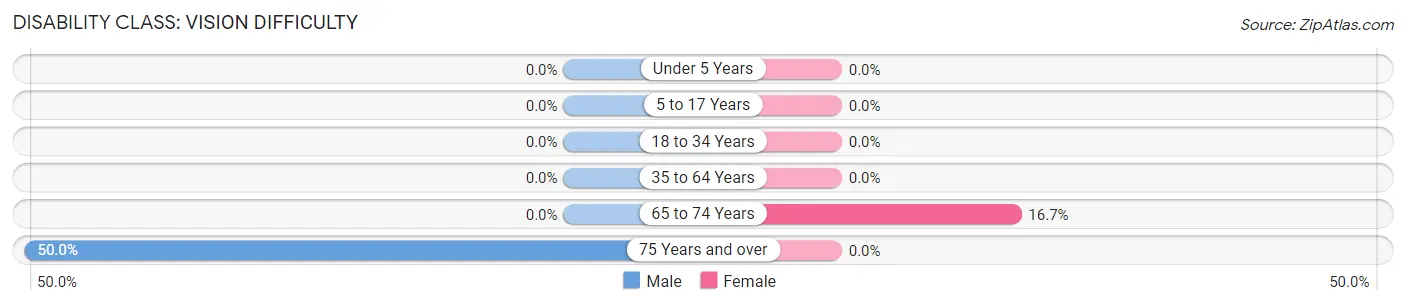
| Age Bracket | Male | Female |
| Under 5 Years | 0 (0.0%) | 0 (0.0%) |
| 5 to 17 Years | 0 (0.0%) | 0 (0.0%) |
| 18 to 34 Years | 0 (0.0%) | 0 (0.0%) |
| 35 to 64 Years | 0 (0.0%) | 0 (0.0%) |
| 65 to 74 Years | 0 (0.0%) | 1 (16.7%) |
| 75 Years and over | 1 (50.0%) | 0 (0.0%) |
Disability Class: Cognitive Difficulty
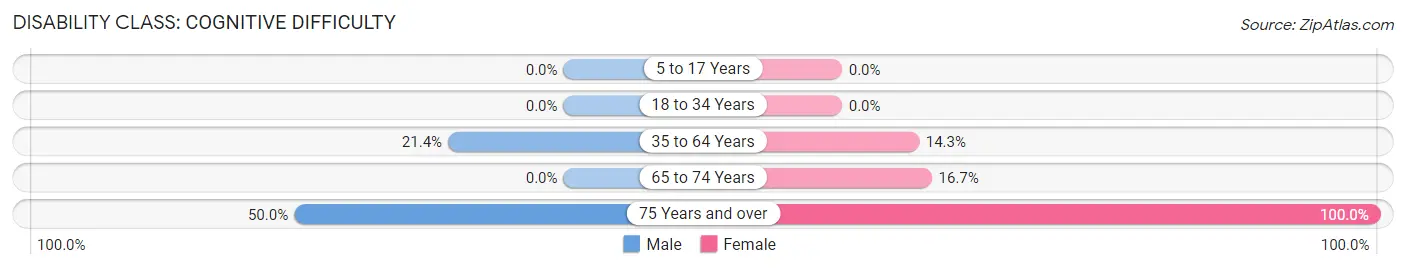
| Age Bracket | Male | Female |
| 5 to 17 Years | 0 (0.0%) | 0 (0.0%) |
| 18 to 34 Years | 0 (0.0%) | 0 (0.0%) |
| 35 to 64 Years | 3 (21.4%) | 3 (14.3%) |
| 65 to 74 Years | 0 (0.0%) | 1 (16.7%) |
| 75 Years and over | 1 (50.0%) | 1 (100.0%) |
Disability Class: Ambulatory Difficulty
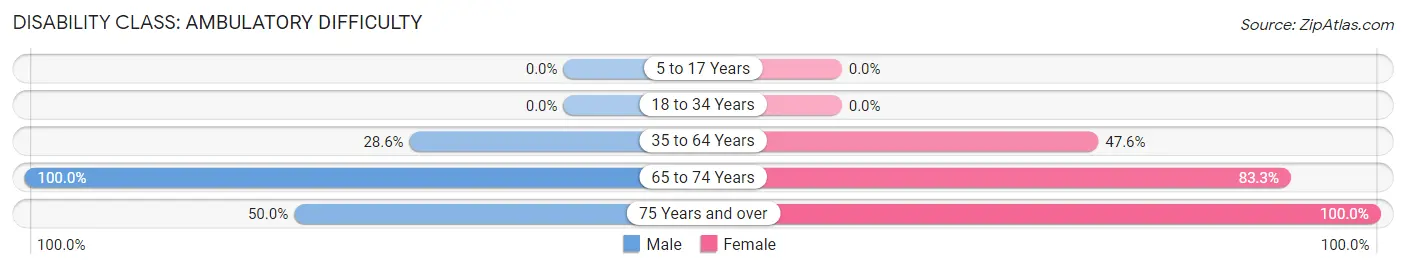
| Age Bracket | Male | Female |
| 5 to 17 Years | 0 (0.0%) | 0 (0.0%) |
| 18 to 34 Years | 0 (0.0%) | 0 (0.0%) |
| 35 to 64 Years | 4 (28.6%) | 10 (47.6%) |
| 65 to 74 Years | 1 (100.0%) | 5 (83.3%) |
| 75 Years and over | 1 (50.0%) | 1 (100.0%) |
Disability Class: Self-Care Difficulty
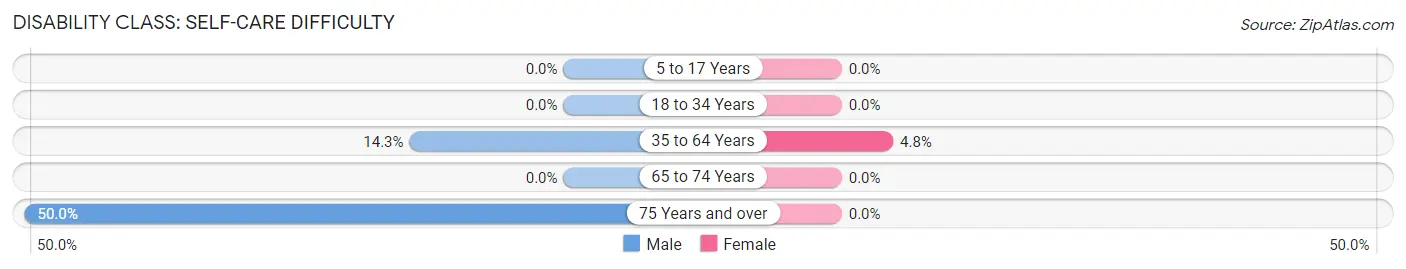
| Age Bracket | Male | Female |
| 5 to 17 Years | 0 (0.0%) | 0 (0.0%) |
| 18 to 34 Years | 0 (0.0%) | 0 (0.0%) |
| 35 to 64 Years | 2 (14.3%) | 1 (4.8%) |
| 65 to 74 Years | 0 (0.0%) | 0 (0.0%) |
| 75 Years and over | 1 (50.0%) | 0 (0.0%) |
Technology Access in Solen
Computing Device Access in Solen
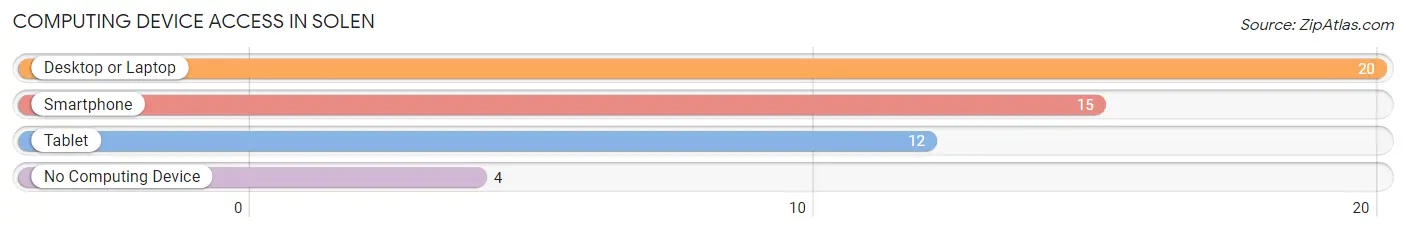
| Device Type | # Households | % Households |
| Desktop or Laptop | 20 | 76.9% |
| Smartphone | 15 | 57.7% |
| Tablet | 12 | 46.2% |
| No Computing Device | 4 | 15.4% |
| Total | 26 | 100.0% |
Internet Access in Solen
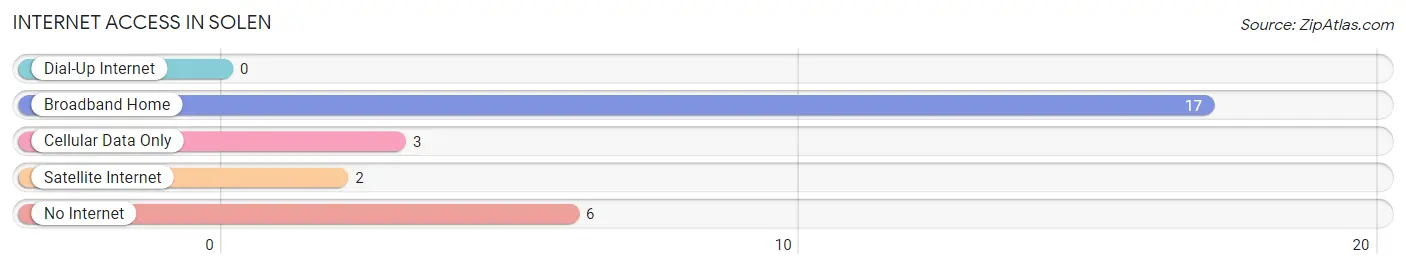
| Internet Type | # Households | % Households |
| Dial-Up Internet | 0 | 0.0% |
| Broadband Home | 17 | 65.4% |
| Cellular Data Only | 3 | 11.5% |
| Satellite Internet | 2 | 7.7% |
| No Internet | 6 | 23.1% |
| Total | 26 | 100.0% |
Solen Summary
History
Solen is a small city located in the state of North Dakota. It is situated in the southwestern part of the state, near the border with South Dakota. The city was founded in 1883 by a group of settlers from Norway. The settlers named the city after the Norwegian word for sun, solen.
The early settlers of Solen were mostly farmers and ranchers, and the city quickly grew to become an important agricultural center. The city was also home to a number of businesses, including a flour mill, a creamery, and a lumber yard.
In the early 1900s, Solen experienced a period of rapid growth. The city was connected to the rest of the state by the Great Northern Railway, and the population grew to over 1,000 people. The city also became a center for education, with the establishment of a high school and a college.
In the 1950s, Solen began to experience a decline in population. This was due to a number of factors, including the decline of the agricultural industry and the rise of suburbanization. By the 1970s, the population had dropped to just over 500 people.
Geography
Solen is located in the southwestern part of North Dakota, near the border with South Dakota. The city is situated in the Missouri Plateau region of the state, and is surrounded by rolling hills and prairies. The city is located at an elevation of 1,845 feet above sea level.
The climate in Solen is classified as semi-arid, with hot summers and cold winters. The average annual temperature is around 50 degrees Fahrenheit, and the average annual precipitation is around 16 inches.
Economy
Solen’s economy is largely based on agriculture. The city is home to a number of farms and ranches, and the surrounding area is known for its production of wheat, corn, and other grains. The city is also home to a number of businesses, including a flour mill, a creamery, and a lumber yard.
The city is also home to a number of manufacturing companies, including a furniture factory and a plastics factory. The city is also home to a number of retail stores, including a grocery store, a hardware store, and a clothing store.
Demographics
As of the 2010 census, the population of Solen was 545 people. The racial makeup of the city was 97.3% White, 0.2% African American, 0.2% Native American, 0.4% Asian, and 1.9% from other races. The median household income was $41,250, and the median family income was $50,000.
The city is home to a number of churches, including the First Lutheran Church, the United Methodist Church, and the Church of the Nazarene. The city is also home to a number of schools, including Solen High School and Solen Elementary School.
Conclusion
Solen is a small city located in the southwestern part of North Dakota. The city was founded in 1883 by a group of settlers from Norway, and it quickly grew to become an important agricultural center. The city experienced a period of rapid growth in the early 1900s, but by the 1970s the population had dropped to just over 500 people. Today, the city’s economy is largely based on agriculture, and it is home to a number of businesses and manufacturing companies. The population of Solen is 545 people, and the median household income is $41,250. The city is home to a number of churches and schools, and it is a popular destination for outdoor recreation.
Common Questions
What is Per Capita Income in Solen?
Per Capita income in Solen is $17,989.
What is Inequality or Gini Index in Solen?
Inequality or Gini Index in Solen is 0.50.
What is the Total Population of Solen?
Total Population of Solen is 74.
What is the Total Male Population of Solen?
Total Male Population of Solen is 38.
What is the Total Female Population of Solen?
Total Female Population of Solen is 36.
What is the Ratio of Males per 100 Females in Solen?
There are 105.56 Males per 100 Females in Solen.
What is the Ratio of Females per 100 Males in Solen?
There are 94.74 Females per 100 Males in Solen.
What is the Median Population Age in Solen?
Median Population Age in Solen is 41.0 Years.
What is the Average Family Size in Solen
Average Family Size in Solen is 4.2 People.
What is the Average Household Size in Solen
Average Household Size in Solen is 2.9 People.
How Large is the Labor Force in Solen?
There are 19 People in the Labor Forcein in Solen.
What is the Percentage of People in the Labor Force in Solen?
32.8% of People are in the Labor Force in Solen.
What is the Unemployment Rate in Solen?
Unemployment Rate in Solen is 15.8%.