Reeder, ND Map & Demographics
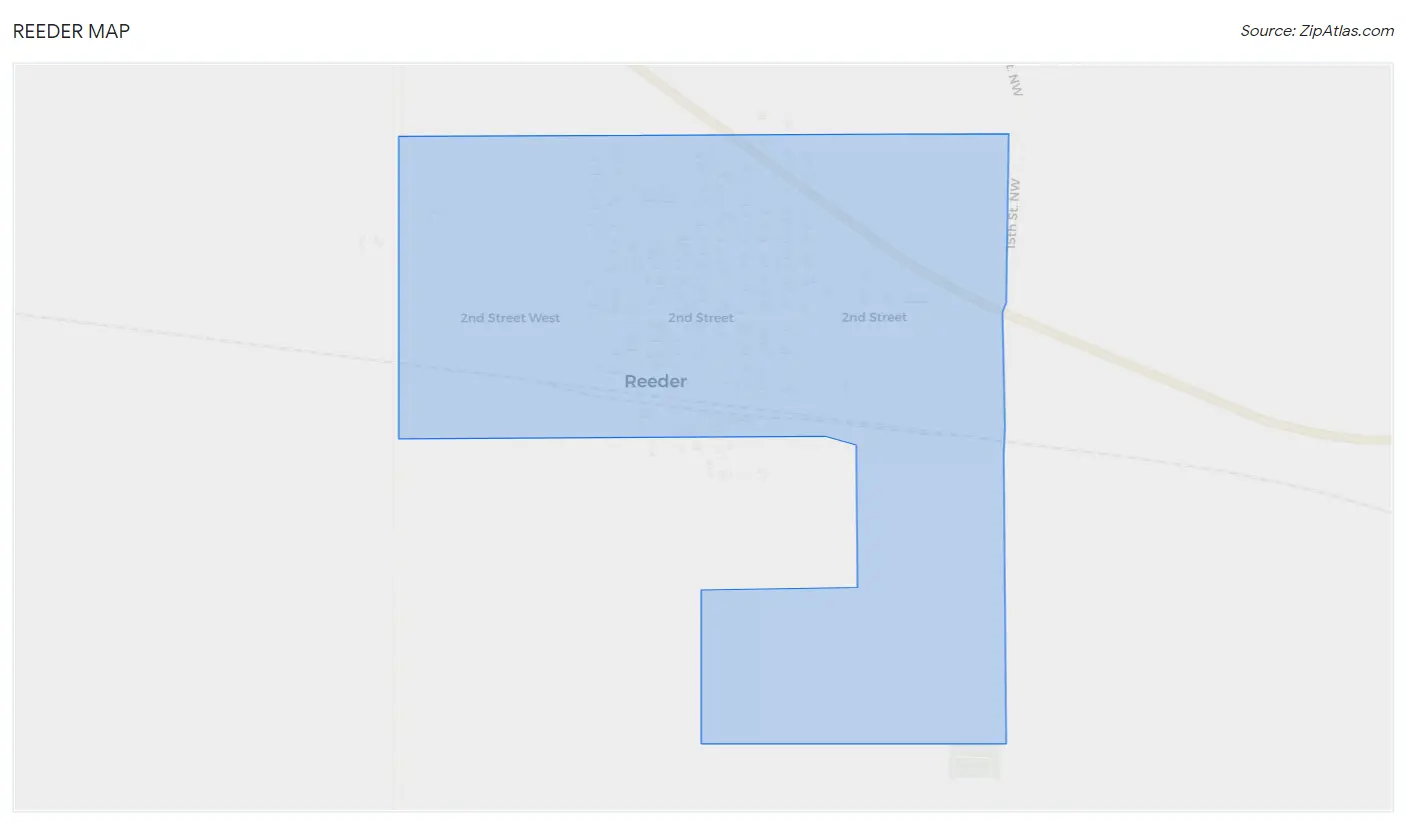
Reeder Map
Reeder Overview
$26,340
PER CAPITA INCOME
$38,750
AVG FAMILY INCOME
$33,750
AVG HOUSEHOLD INCOME
0.44
INEQUALITY / GINI INDEX
86
TOTAL POPULATION
43
MALE POPULATION
43
FEMALE POPULATION
100.00
MALES / 100 FEMALES
100.00
FEMALES / 100 MALES
62.5
MEDIAN AGE
2.5
AVG FAMILY SIZE
1.9
AVG HOUSEHOLD SIZE
26
LABOR FORCE [ PEOPLE ]
32.9%
PERCENT IN LABOR FORCE
Reeder Zip Codes
Reeder Area Codes
Income in Reeder
Income Overview in Reeder
Per Capita Income in Reeder is $26,340, while median incomes of families and households are $38,750 and $33,750 respectively.
| Characteristic | Number | Measure |
| Per Capita Income | 86 | $26,340 |
| Median Family Income | 26 | $38,750 |
| Mean Family Income | 26 | $59,281 |
| Median Household Income | 46 | $33,750 |
| Mean Household Income | 46 | $47,376 |
| Income Deficit | 26 | $0 |
| Wage / Income Gap (%) | 86 | 0.00% |
| Wage / Income Gap ($) | 86 | 100.00¢ per $1 |
| Gini / Inequality Index | 86 | 0.44 |
Earnings by Sex in Reeder
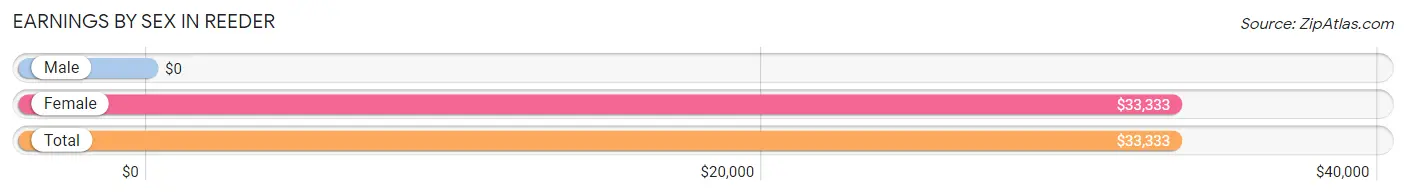
| Sex | Number | Average Earnings |
| Male | 14 (53.8%) | $0 |
| Female | 12 (46.2%) | $33,333 |
| Total | 26 (100.0%) | $33,333 |
Earnings by Sex by Income Bracket in Reeder
The most common earnings brackets in Reeder are $5,000 to $7,499 for men (6 | 42.9%) and $65,000 to $74,999 for women (4 | 33.3%).
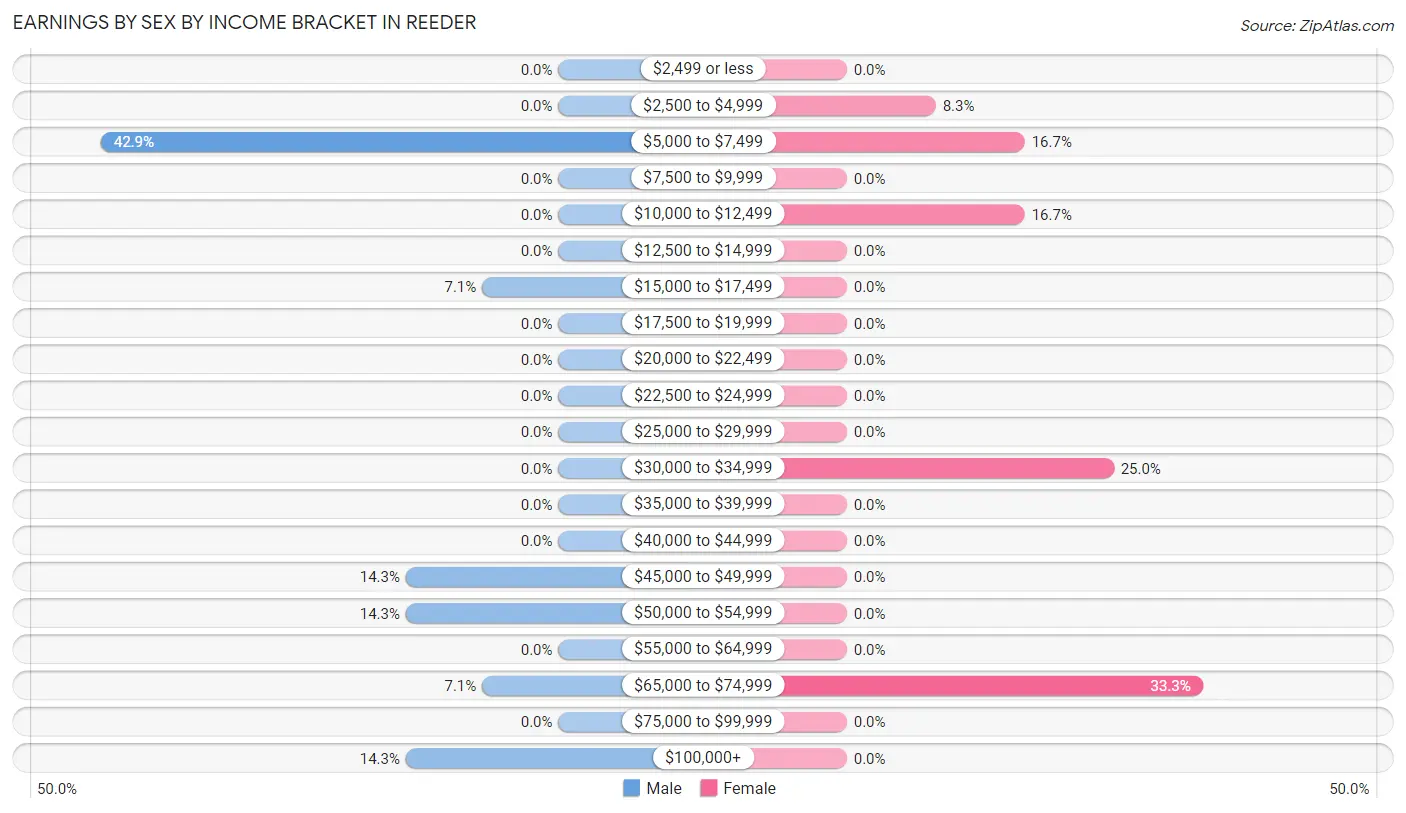
| Income | Male | Female |
| $2,499 or less | 0 (0.0%) | 0 (0.0%) |
| $2,500 to $4,999 | 0 (0.0%) | 1 (8.3%) |
| $5,000 to $7,499 | 6 (42.9%) | 2 (16.7%) |
| $7,500 to $9,999 | 0 (0.0%) | 0 (0.0%) |
| $10,000 to $12,499 | 0 (0.0%) | 2 (16.7%) |
| $12,500 to $14,999 | 0 (0.0%) | 0 (0.0%) |
| $15,000 to $17,499 | 1 (7.1%) | 0 (0.0%) |
| $17,500 to $19,999 | 0 (0.0%) | 0 (0.0%) |
| $20,000 to $22,499 | 0 (0.0%) | 0 (0.0%) |
| $22,500 to $24,999 | 0 (0.0%) | 0 (0.0%) |
| $25,000 to $29,999 | 0 (0.0%) | 0 (0.0%) |
| $30,000 to $34,999 | 0 (0.0%) | 3 (25.0%) |
| $35,000 to $39,999 | 0 (0.0%) | 0 (0.0%) |
| $40,000 to $44,999 | 0 (0.0%) | 0 (0.0%) |
| $45,000 to $49,999 | 2 (14.3%) | 0 (0.0%) |
| $50,000 to $54,999 | 2 (14.3%) | 0 (0.0%) |
| $55,000 to $64,999 | 0 (0.0%) | 0 (0.0%) |
| $65,000 to $74,999 | 1 (7.1%) | 4 (33.3%) |
| $75,000 to $99,999 | 0 (0.0%) | 0 (0.0%) |
| $100,000+ | 2 (14.3%) | 0 (0.0%) |
| Total | 14 (100.0%) | 12 (100.0%) |
Earnings by Sex by Educational Attainment in Reeder
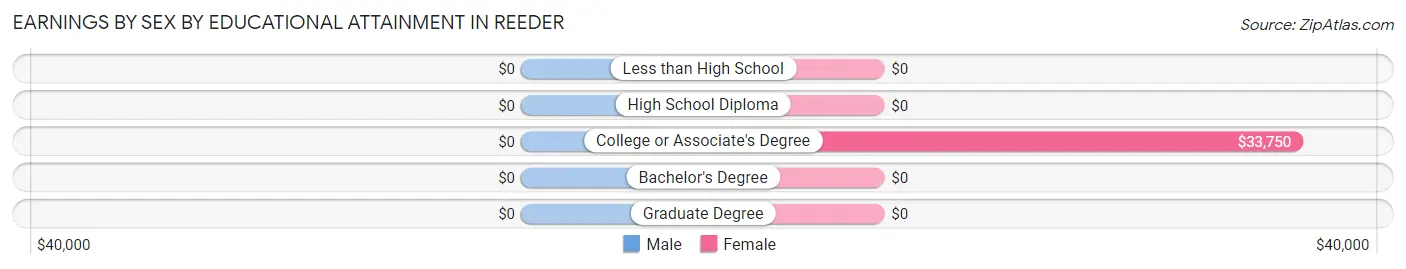
| Educational Attainment | Male Income | Female Income |
| Less than High School | - | - |
| High School Diploma | - | - |
| College or Associate's Degree | - | - |
| Bachelor's Degree | - | - |
| Graduate Degree | - | - |
| Total | - | - |
Family Income in Reeder
Family Income Brackets in Reeder
According to the Reeder family income data, there are 7 families falling into the $50,000 to $74,999 income range, which is the most common income bracket and makes up 26.9% of all families.
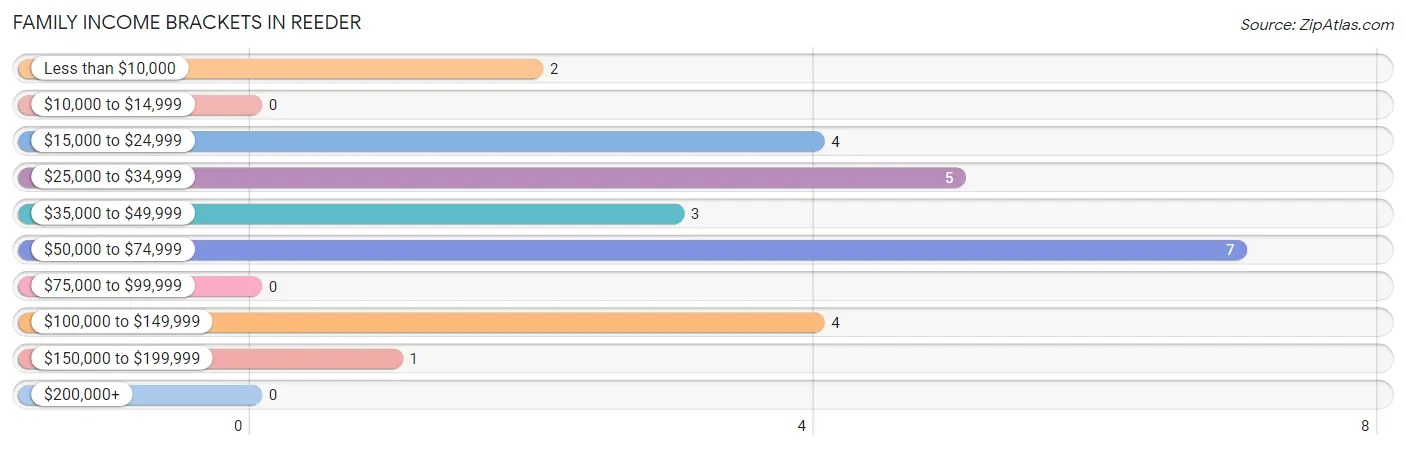
| Income Bracket | # Families | % Families |
| Less than $10,000 | 2 | 7.7% |
| $10,000 to $14,999 | 0 | 0.0% |
| $15,000 to $24,999 | 4 | 15.4% |
| $25,000 to $34,999 | 5 | 19.2% |
| $35,000 to $49,999 | 3 | 11.5% |
| $50,000 to $74,999 | 7 | 26.9% |
| $75,000 to $99,999 | 0 | 0.0% |
| $100,000 to $149,999 | 4 | 15.4% |
| $150,000 to $199,999 | 1 | 3.8% |
| $200,000+ | 0 | 0.0% |
Family Income by Famaliy Size in Reeder
2-person families (19 | 73.1%) account for the highest median family income in Reeder with $58,750 per family, while 2-person families (19 | 73.1%) have the highest median income of $29,375 per family member.
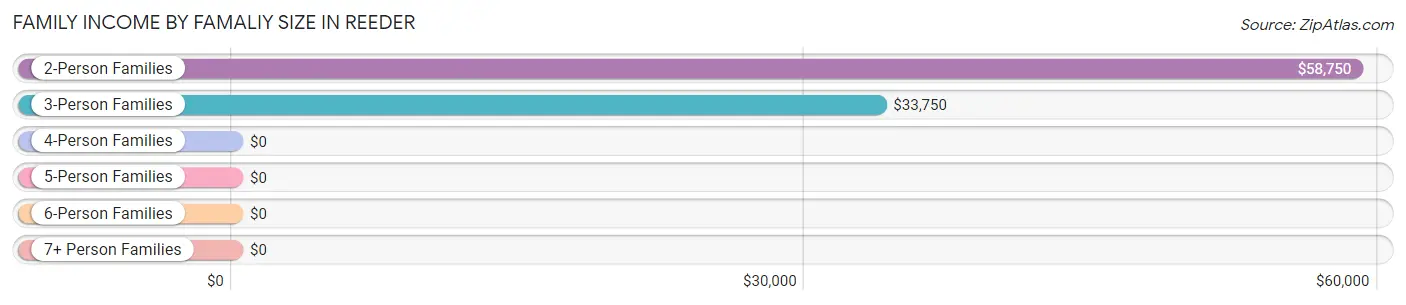
| Income Bracket | # Families | Median Income |
| 2-Person Families | 19 (73.1%) | $58,750 |
| 3-Person Families | 7 (26.9%) | $33,750 |
| 4-Person Families | 0 (0.0%) | $0 |
| 5-Person Families | 0 (0.0%) | $0 |
| 6-Person Families | 0 (0.0%) | $0 |
| 7+ Person Families | 0 (0.0%) | $0 |
| Total | 26 (100.0%) | $38,750 |
Family Income by Number of Earners in Reeder
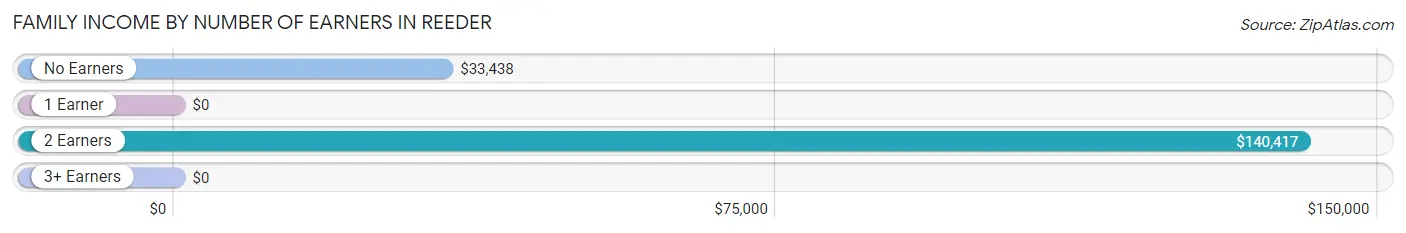
| Number of Earners | # Families | Median Income |
| No Earners | 13 (50.0%) | $33,438 |
| 1 Earner | 7 (26.9%) | $0 |
| 2 Earners | 5 (19.2%) | $140,417 |
| 3+ Earners | 1 (3.8%) | $0 |
| Total | 26 (100.0%) | $38,750 |
Household Income in Reeder
Household Income Brackets in Reeder
With 11 households falling in the category, the $50,000 to $74,999 income range is the most frequent in Reeder, accounting for 23.9% of all households.
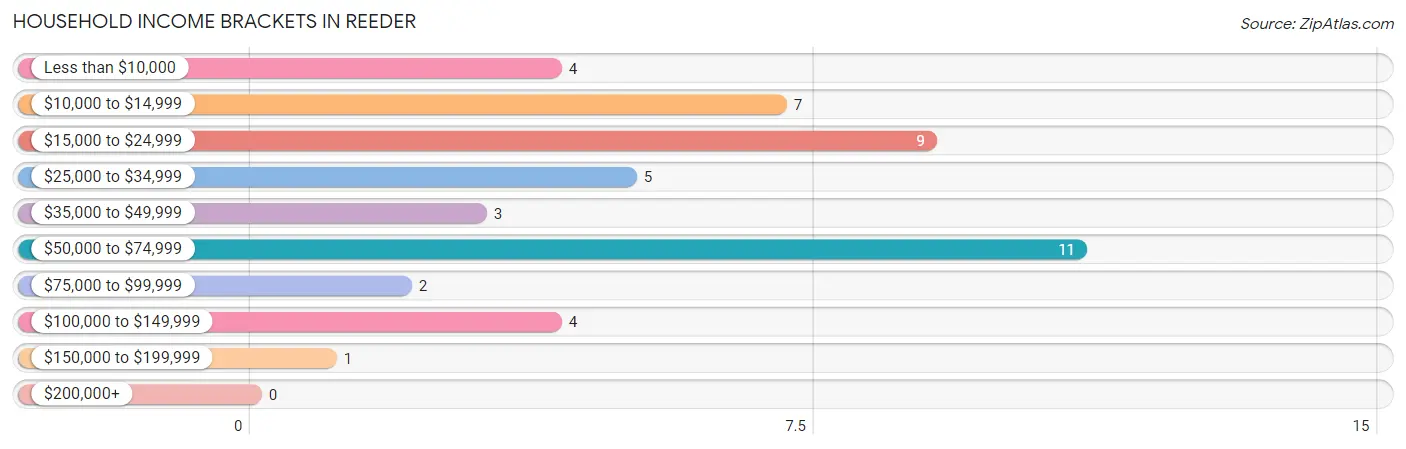
| Income Bracket | # Households | % Households |
| Less than $10,000 | 4 | 8.7% |
| $10,000 to $14,999 | 7 | 15.2% |
| $15,000 to $24,999 | 9 | 19.6% |
| $25,000 to $34,999 | 5 | 10.9% |
| $35,000 to $49,999 | 3 | 6.5% |
| $50,000 to $74,999 | 11 | 23.9% |
| $75,000 to $99,999 | 2 | 4.3% |
| $100,000 to $149,999 | 4 | 8.7% |
| $150,000 to $199,999 | 1 | 2.2% |
| $200,000+ | 0 | 0.0% |
Household Income by Householder Age in Reeder
The median household income in Reeder is $33,750, with the highest median household income of $23,750 found in the 65+ years age bracket for the primary householder. A total of 26 households (56.5%) fall into this category.
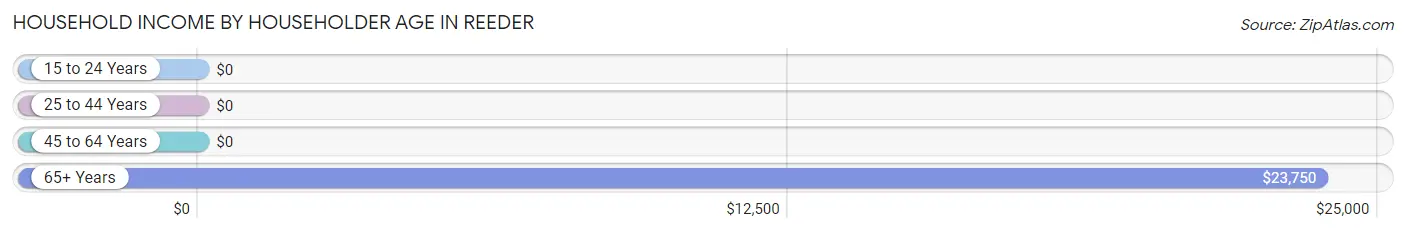
| Income Bracket | # Households | Median Income |
| 15 to 24 Years | 0 (0.0%) | $0 |
| 25 to 44 Years | 12 (26.1%) | $0 |
| 45 to 64 Years | 8 (17.4%) | $0 |
| 65+ Years | 26 (56.5%) | $23,750 |
| Total | 46 (100.0%) | $33,750 |
Poverty in Reeder
Income Below Poverty by Sex and Age in Reeder
With 7.0% poverty level for males and 25.6% for females among the residents of Reeder, under 5 year old males and 18 to 24 year old females are the most vulnerable to poverty, with 2 males (100.0%) and 2 females (100.0%) in their respective age groups living below the poverty level.
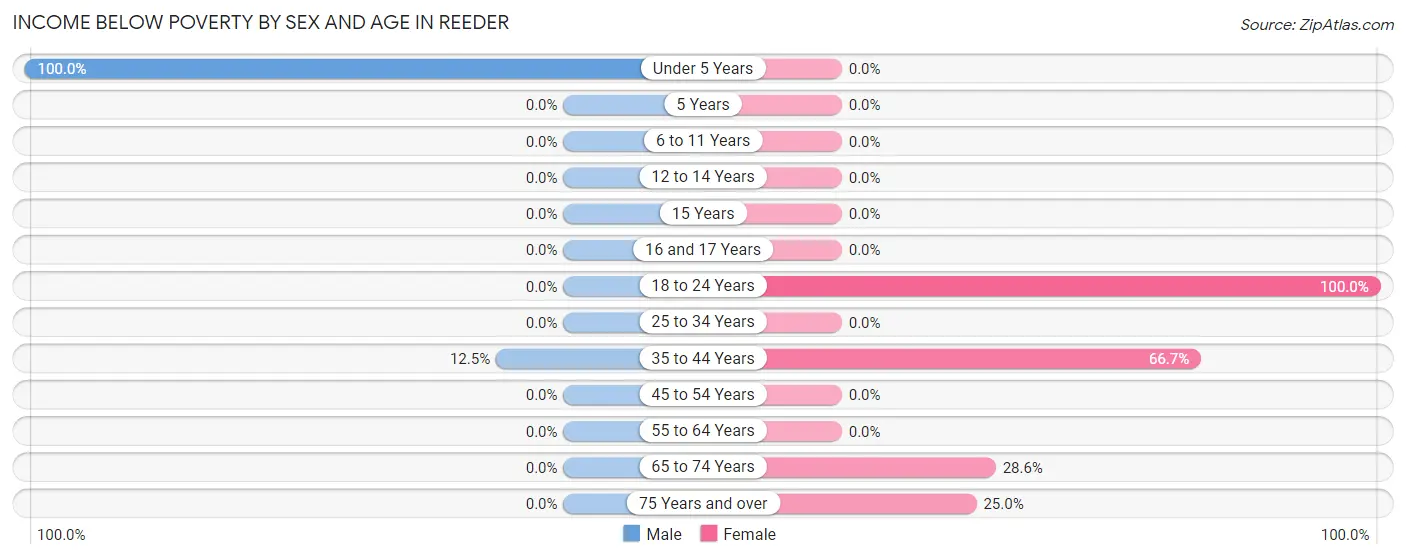
| Age Bracket | Male | Female |
| Under 5 Years | 2 (100.0%) | 0 (0.0%) |
| 5 Years | 0 (0.0%) | 0 (0.0%) |
| 6 to 11 Years | 0 (0.0%) | 0 (0.0%) |
| 12 to 14 Years | 0 (0.0%) | 0 (0.0%) |
| 15 Years | 0 (0.0%) | 0 (0.0%) |
| 16 and 17 Years | 0 (0.0%) | 0 (0.0%) |
| 18 to 24 Years | 0 (0.0%) | 2 (100.0%) |
| 25 to 34 Years | 0 (0.0%) | 0 (0.0%) |
| 35 to 44 Years | 1 (12.5%) | 2 (66.7%) |
| 45 to 54 Years | 0 (0.0%) | 0 (0.0%) |
| 55 to 64 Years | 0 (0.0%) | 0 (0.0%) |
| 65 to 74 Years | 0 (0.0%) | 4 (28.6%) |
| 75 Years and over | 0 (0.0%) | 3 (25.0%) |
| Total | 3 (7.0%) | 11 (25.6%) |
Income Above Poverty by Sex and Age in Reeder
According to the poverty statistics in Reeder, males aged 6 to 11 years and females aged 16 and 17 years are the age groups that are most secure financially, with 100.0% of males and 100.0% of females in these age groups living above the poverty line.
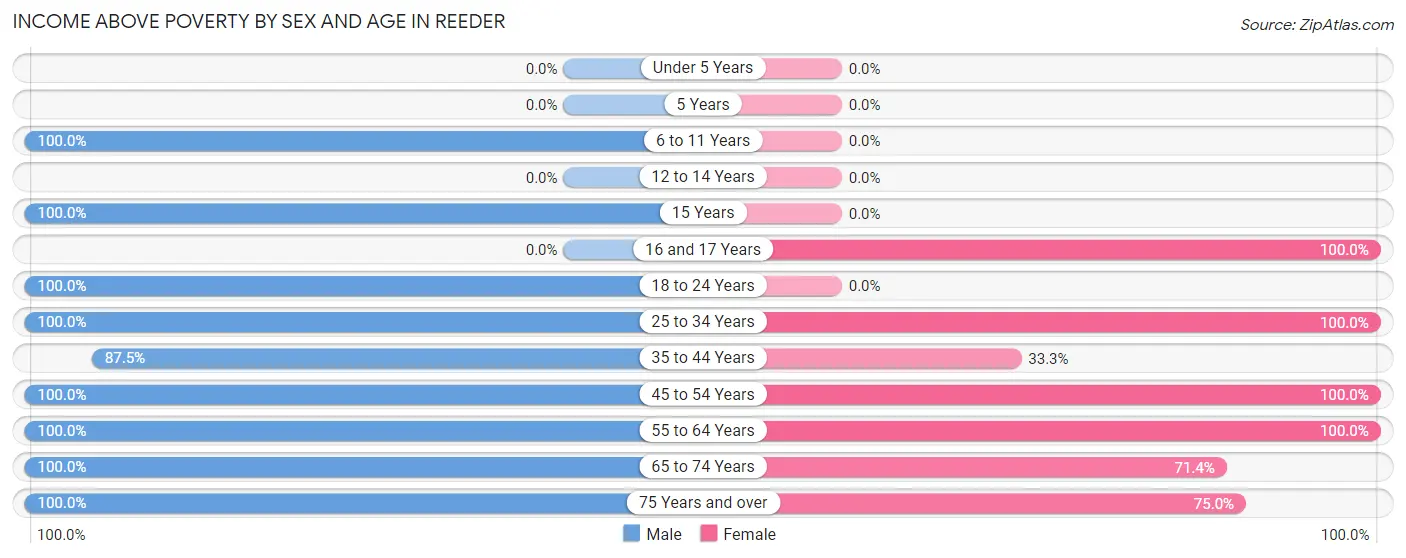
| Age Bracket | Male | Female |
| Under 5 Years | 0 (0.0%) | 0 (0.0%) |
| 5 Years | 0 (0.0%) | 0 (0.0%) |
| 6 to 11 Years | 4 (100.0%) | 0 (0.0%) |
| 12 to 14 Years | 0 (0.0%) | 0 (0.0%) |
| 15 Years | 1 (100.0%) | 0 (0.0%) |
| 16 and 17 Years | 0 (0.0%) | 1 (100.0%) |
| 18 to 24 Years | 1 (100.0%) | 0 (0.0%) |
| 25 to 34 Years | 1 (100.0%) | 2 (100.0%) |
| 35 to 44 Years | 7 (87.5%) | 1 (33.3%) |
| 45 to 54 Years | 9 (100.0%) | 5 (100.0%) |
| 55 to 64 Years | 2 (100.0%) | 4 (100.0%) |
| 65 to 74 Years | 3 (100.0%) | 10 (71.4%) |
| 75 Years and over | 12 (100.0%) | 9 (75.0%) |
| Total | 40 (93.0%) | 32 (74.4%) |
Income Below Poverty Among Married-Couple Families in Reeder
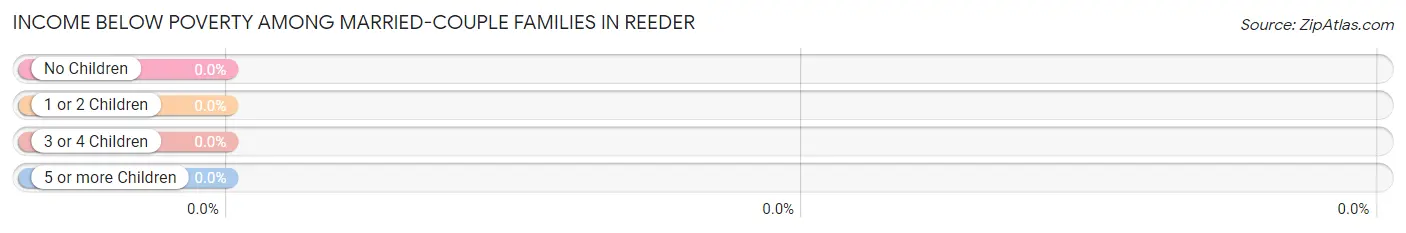
| Children | Above Poverty | Below Poverty |
| No Children | 20 (100.0%) | 0 (0.0%) |
| 1 or 2 Children | 3 (100.0%) | 0 (0.0%) |
| 3 or 4 Children | 0 (0.0%) | 0 (0.0%) |
| 5 or more Children | 0 (0.0%) | 0 (0.0%) |
| Total | 23 (100.0%) | 0 (0.0%) |
Income Below Poverty Among Single-Parent Households in Reeder
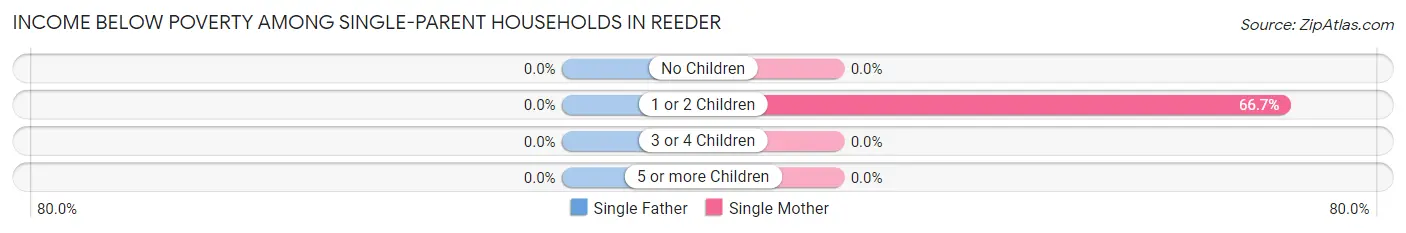
| Children | Single Father | Single Mother |
| No Children | 0 (0.0%) | 0 (0.0%) |
| 1 or 2 Children | 0 (0.0%) | 2 (66.7%) |
| 3 or 4 Children | 0 (0.0%) | 0 (0.0%) |
| 5 or more Children | 0 (0.0%) | 0 (0.0%) |
| Total | 0 (0.0%) | 2 (66.7%) |
Income Below Poverty Among Married-Couple vs Single-Parent Households in Reeder
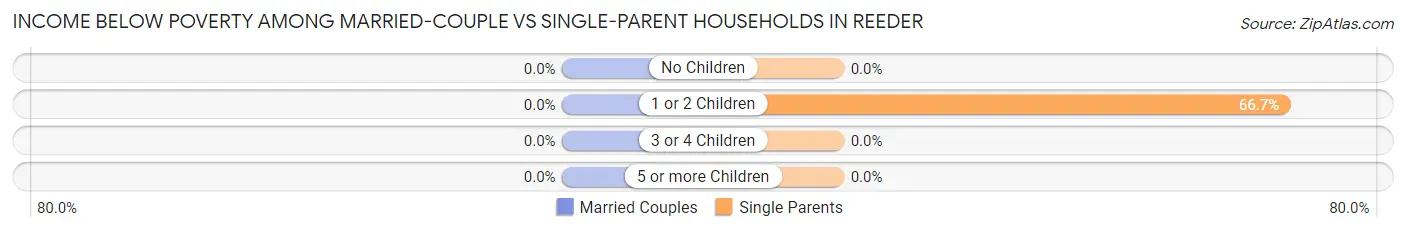
| Children | Married-Couple Families | Single-Parent Households |
| No Children | 0 (0.0%) | 0 (0.0%) |
| 1 or 2 Children | 0 (0.0%) | 2 (66.7%) |
| 3 or 4 Children | 0 (0.0%) | 0 (0.0%) |
| 5 or more Children | 0 (0.0%) | 0 (0.0%) |
| Total | 0 (0.0%) | 2 (66.7%) |
Race in Reeder
The most populous races in Reeder are White / Caucasian (76 | 88.4%), Two or more Races (8 | 9.3%), and Native / Alaskan (2 | 2.3%).
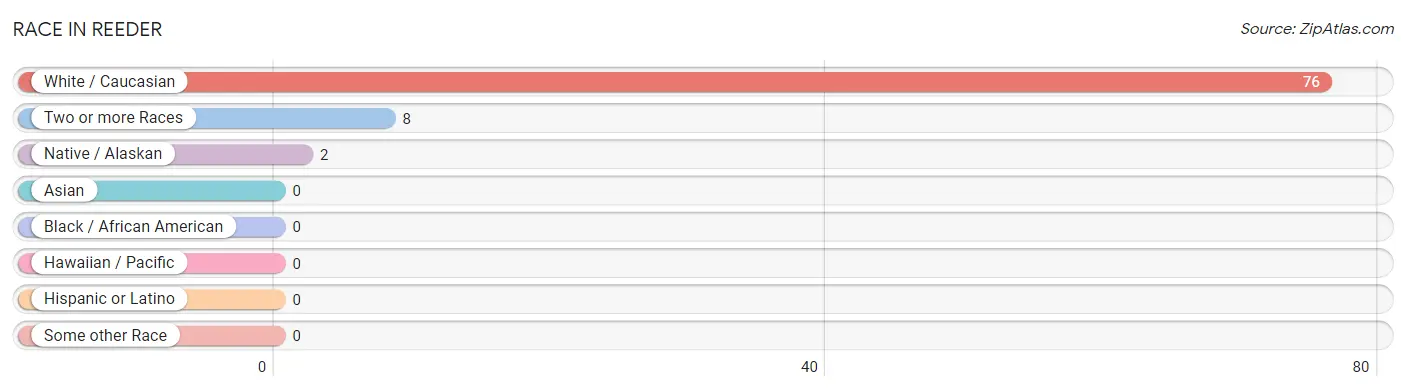
| Race | # Population | % Population |
| Asian | 0 | 0.0% |
| Black / African American | 0 | 0.0% |
| Hawaiian / Pacific | 0 | 0.0% |
| Hispanic or Latino | 0 | 0.0% |
| Native / Alaskan | 2 | 2.3% |
| White / Caucasian | 76 | 88.4% |
| Two or more Races | 8 | 9.3% |
| Some other Race | 0 | 0.0% |
| Total | 86 | 100.0% |
Ancestry in Reeder
The most populous ancestries reported in Reeder are German (53 | 61.6%), Norwegian (25 | 29.1%), Irish (11 | 12.8%), English (10 | 11.6%), and Russian (6 | 7.0%), together accounting for 122.1% of all Reeder residents.
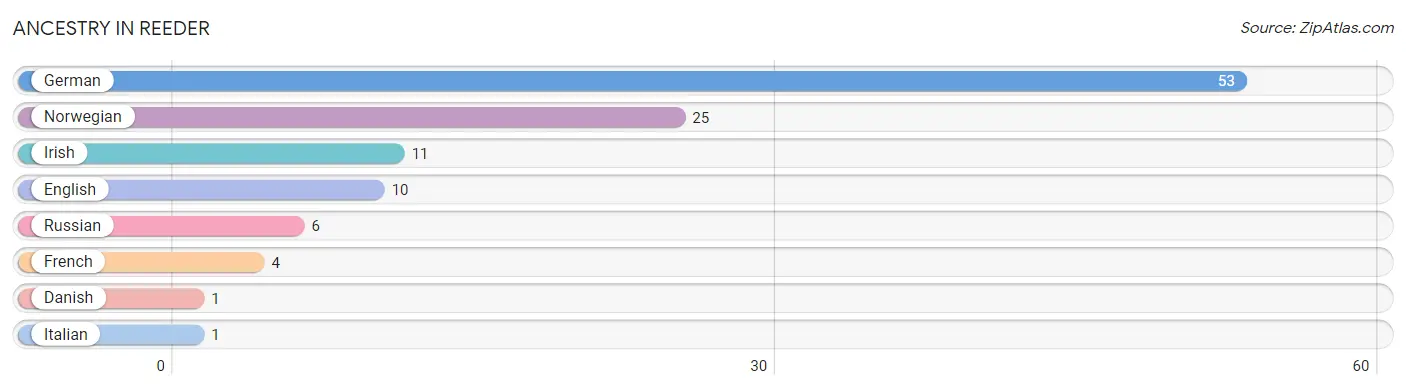
| Ancestry | # Population | % Population |
| Danish | 1 | 1.2% |
| English | 10 | 11.6% |
| French | 4 | 4.6% |
| German | 53 | 61.6% |
| Irish | 11 | 12.8% |
| Italian | 1 | 1.2% |
| Norwegian | 25 | 29.1% |
| Russian | 6 | 7.0% | View All 8 Rows |
Immigrants in Reeder

| Immigration Origin | # Population | % Population | View All 0 Rows |
Sex and Age in Reeder
Sex and Age in Reeder
The most populous age groups in Reeder are 80 to 84 Years (10 | 23.3%) for men and 70 to 74 Years (10 | 23.3%) for women.
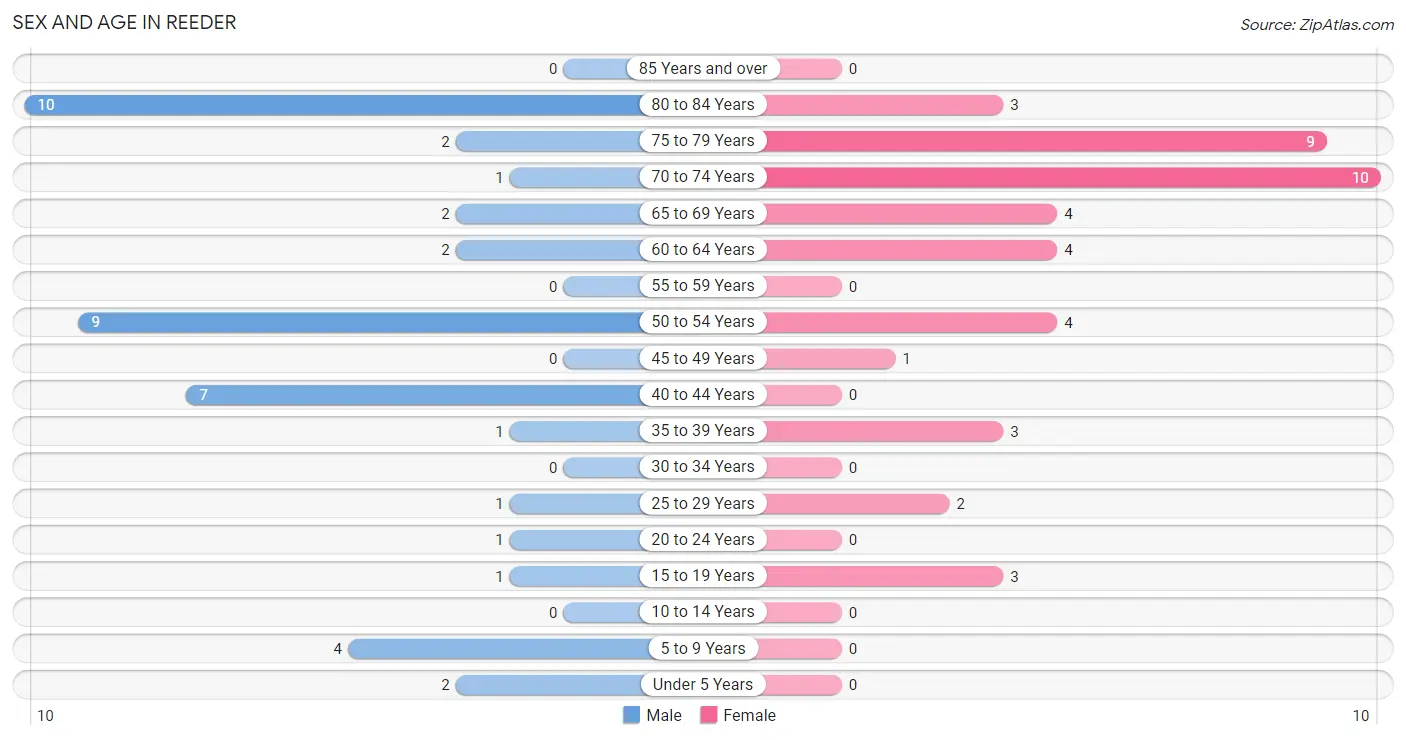
| Age Bracket | Male | Female |
| Under 5 Years | 2 (4.6%) | 0 (0.0%) |
| 5 to 9 Years | 4 (9.3%) | 0 (0.0%) |
| 10 to 14 Years | 0 (0.0%) | 0 (0.0%) |
| 15 to 19 Years | 1 (2.3%) | 3 (7.0%) |
| 20 to 24 Years | 1 (2.3%) | 0 (0.0%) |
| 25 to 29 Years | 1 (2.3%) | 2 (4.6%) |
| 30 to 34 Years | 0 (0.0%) | 0 (0.0%) |
| 35 to 39 Years | 1 (2.3%) | 3 (7.0%) |
| 40 to 44 Years | 7 (16.3%) | 0 (0.0%) |
| 45 to 49 Years | 0 (0.0%) | 1 (2.3%) |
| 50 to 54 Years | 9 (20.9%) | 4 (9.3%) |
| 55 to 59 Years | 0 (0.0%) | 0 (0.0%) |
| 60 to 64 Years | 2 (4.6%) | 4 (9.3%) |
| 65 to 69 Years | 2 (4.6%) | 4 (9.3%) |
| 70 to 74 Years | 1 (2.3%) | 10 (23.3%) |
| 75 to 79 Years | 2 (4.6%) | 9 (20.9%) |
| 80 to 84 Years | 10 (23.3%) | 3 (7.0%) |
| 85 Years and over | 0 (0.0%) | 0 (0.0%) |
| Total | 43 (100.0%) | 43 (100.0%) |
Families and Households in Reeder
Median Family Size in Reeder
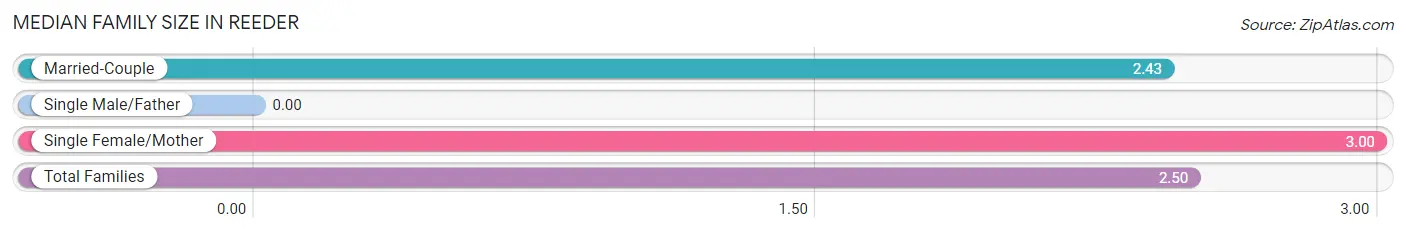
| Family Type | # Families | Family Size |
| Married-Couple | 23 (88.5%) | 2.43 |
| Single Male/Father | 0 (0.0%) | - |
| Single Female/Mother | 3 (11.5%) | 3.00 |
| Total Families | 26 (100.0%) | 2.50 |
Median Household Size in Reeder
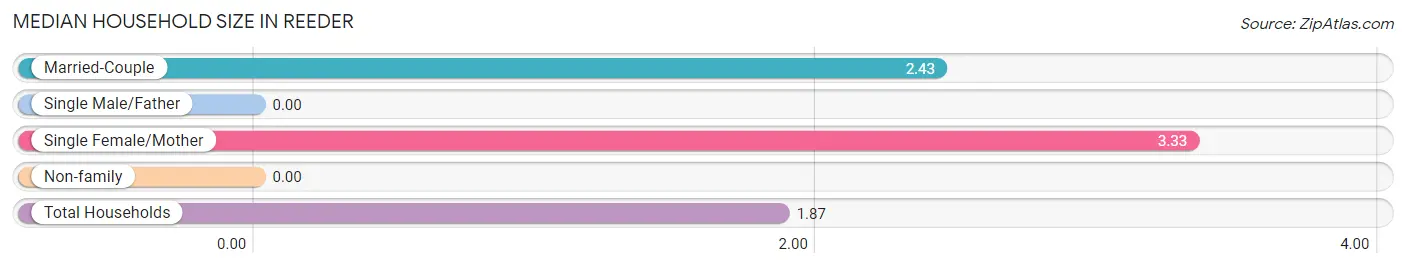
| Household Type | # Households | Household Size |
| Married-Couple | 23 (50.0%) | 2.43 |
| Single Male/Father | 0 (0.0%) | - |
| Single Female/Mother | 3 (6.5%) | 3.33 |
| Non-family | 20 (43.5%) | - |
| Total Households | 46 (100.0%) | 1.87 |
Household Size by Marriage Status in Reeder
Out of a total of 46 households in Reeder, 26 (56.5%) are family households, while 20 (43.5%) are nonfamily households. The most numerous type of family households are 2-person households, comprising 19, and the most common type of nonfamily households are 1-person households, comprising 20.
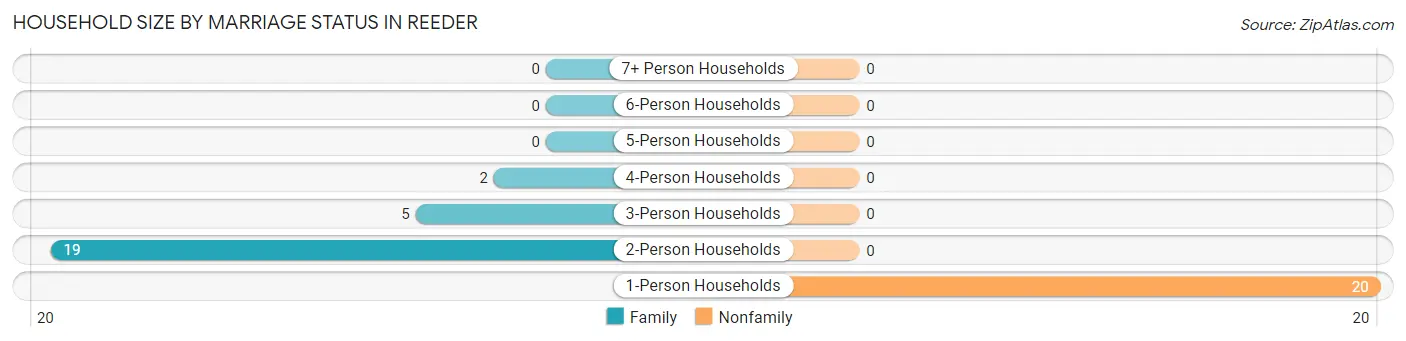
| Household Size | Family Households | Nonfamily Households |
| 1-Person Households | - | 20 (43.5%) |
| 2-Person Households | 19 (41.3%) | 0 (0.0%) |
| 3-Person Households | 5 (10.9%) | 0 (0.0%) |
| 4-Person Households | 2 (4.3%) | 0 (0.0%) |
| 5-Person Households | 0 (0.0%) | 0 (0.0%) |
| 6-Person Households | 0 (0.0%) | 0 (0.0%) |
| 7+ Person Households | 0 (0.0%) | 0 (0.0%) |
| Total | 26 (56.5%) | 20 (43.5%) |
Female Fertility in Reeder
Fertility by Age in Reeder
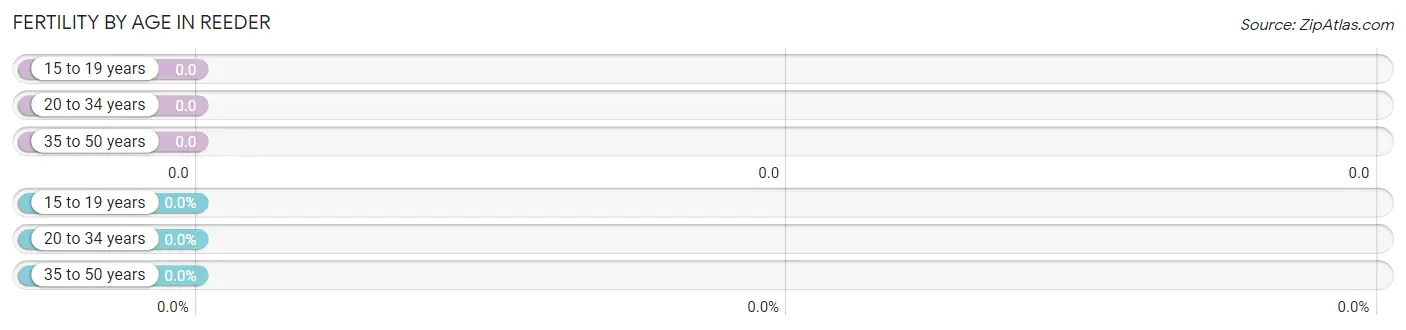
| Age Bracket | Women with Births | Births / 1,000 Women |
| 15 to 19 years | 0 (0.0%) | 0.0 |
| 20 to 34 years | 0 (0.0%) | 0.0 |
| 35 to 50 years | 0 (0.0%) | 0.0 |
| Total | 0 (0.0%) | 0.0 |
Fertility by Age by Marriage Status in Reeder
| Age Bracket | Married | Unmarried |
| 15 to 19 years | 0 (0.0%) | 0 (0.0%) |
| 20 to 34 years | 0 (0.0%) | 0 (0.0%) |
| 35 to 50 years | 0 (0.0%) | 0 (0.0%) |
| Total | 0 (0.0%) | 0 (0.0%) |
Fertility by Education in Reeder
| Educational Attainment | Women with Births | Births / 1,000 Women |
| Less than High School | 0 (0.0%) | 0.0 |
| High School Diploma | 0 (0.0%) | 0.0 |
| College or Associate's Degree | 0 (0.0%) | 0.0 |
| Bachelor's Degree | 0 (0.0%) | 0.0 |
| Graduate Degree | 0 (0.0%) | 0.0 |
| Total | 0 (0.0%) | 0.0 |
Fertility by Education by Marriage Status in Reeder
| Educational Attainment | Married | Unmarried |
| Less than High School | 0 (0.0%) | 0 (0.0%) |
| High School Diploma | 0 (0.0%) | 0 (0.0%) |
| College or Associate's Degree | 0 (0.0%) | 0 (0.0%) |
| Bachelor's Degree | 0 (0.0%) | 0 (0.0%) |
| Graduate Degree | 0 (0.0%) | 0 (0.0%) |
| Total | 0 (0.0%) | 0 (0.0%) |
Employment Characteristics in Reeder
Employment by Class of Employer in Reeder
Among the 26 employed individuals in Reeder, private company employees (18 | 69.2%), federal government employees (6 | 23.1%), and self-employed (not incorporated) (1 | 3.8%) make up the most common classes of employment.
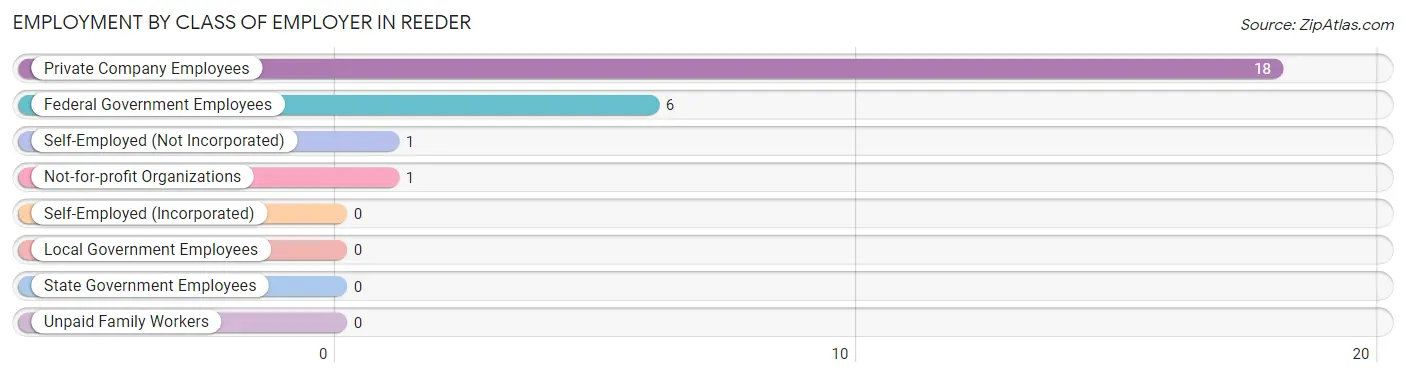
| Employer Class | # Employees | % Employees |
| Private Company Employees | 18 | 69.2% |
| Self-Employed (Incorporated) | 0 | 0.0% |
| Self-Employed (Not Incorporated) | 1 | 3.8% |
| Not-for-profit Organizations | 1 | 3.8% |
| Local Government Employees | 0 | 0.0% |
| State Government Employees | 0 | 0.0% |
| Federal Government Employees | 6 | 23.1% |
| Unpaid Family Workers | 0 | 0.0% |
| Total | 26 | 100.0% |
Employment Status by Age in Reeder
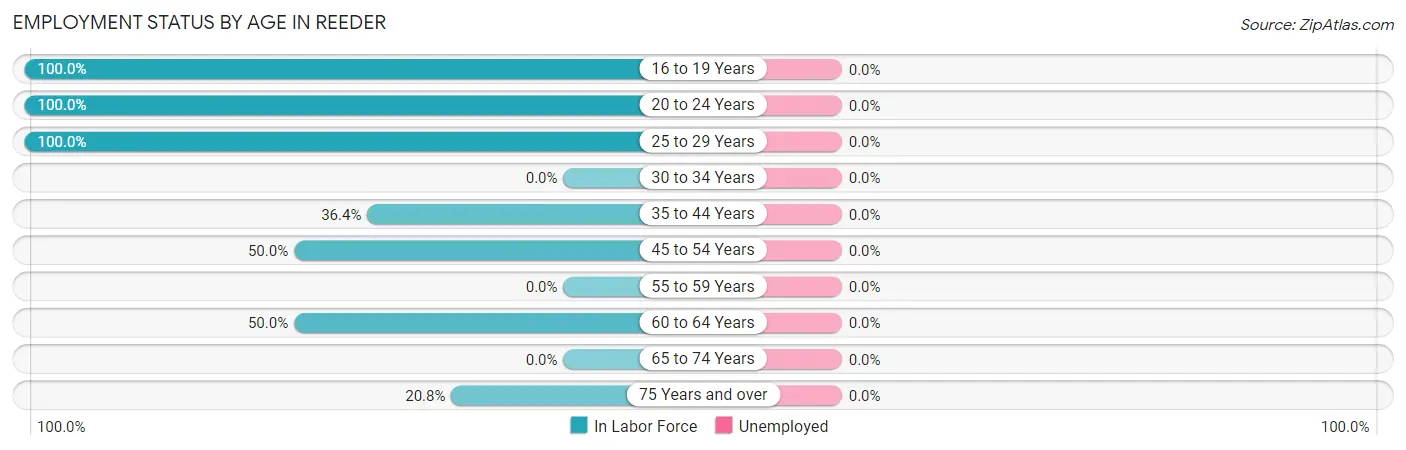
| Age Bracket | In Labor Force | Unemployed |
| 16 to 19 Years | 3 (100.0%) | 0 (0.0%) |
| 20 to 24 Years | 1 (100.0%) | 0 (0.0%) |
| 25 to 29 Years | 3 (100.0%) | 0 (0.0%) |
| 30 to 34 Years | 0 (0.0%) | 0 (0.0%) |
| 35 to 44 Years | 4 (36.4%) | 0 (0.0%) |
| 45 to 54 Years | 7 (50.0%) | 0 (0.0%) |
| 55 to 59 Years | 0 (0.0%) | 0 (0.0%) |
| 60 to 64 Years | 3 (50.0%) | 0 (0.0%) |
| 65 to 74 Years | 0 (0.0%) | 0 (0.0%) |
| 75 Years and over | 5 (20.8%) | 0 (0.0%) |
| Total | 26 (32.9%) | 0 (0.0%) |
Employment Status by Educational Attainment in Reeder
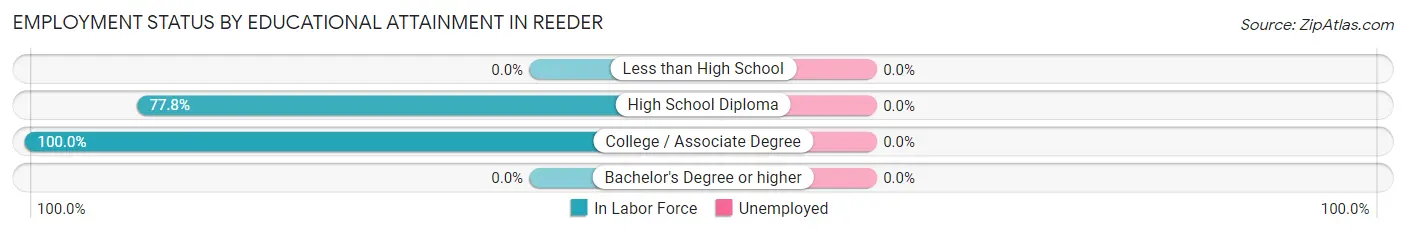
| Educational Attainment | In Labor Force | Unemployed |
| Less than High School | 0 (0.0%) | 0 (0.0%) |
| High School Diploma | 7 (77.8%) | 0 (0.0%) |
| College / Associate Degree | 10 (100.0%) | 0 (0.0%) |
| Bachelor's Degree or higher | 0 (0.0%) | 0 (0.0%) |
| Total | 17 (50.0%) | 0 (0.0%) |
Employment Occupations by Sex in Reeder
Management, Business, Science and Arts Occupations
The most common Management, Business, Science and Arts occupations in Reeder are Business & Financial (5 | 19.2%), Computers, Engineering & Science (3 | 11.5%), and Architecture & Engineering (3 | 11.5%).
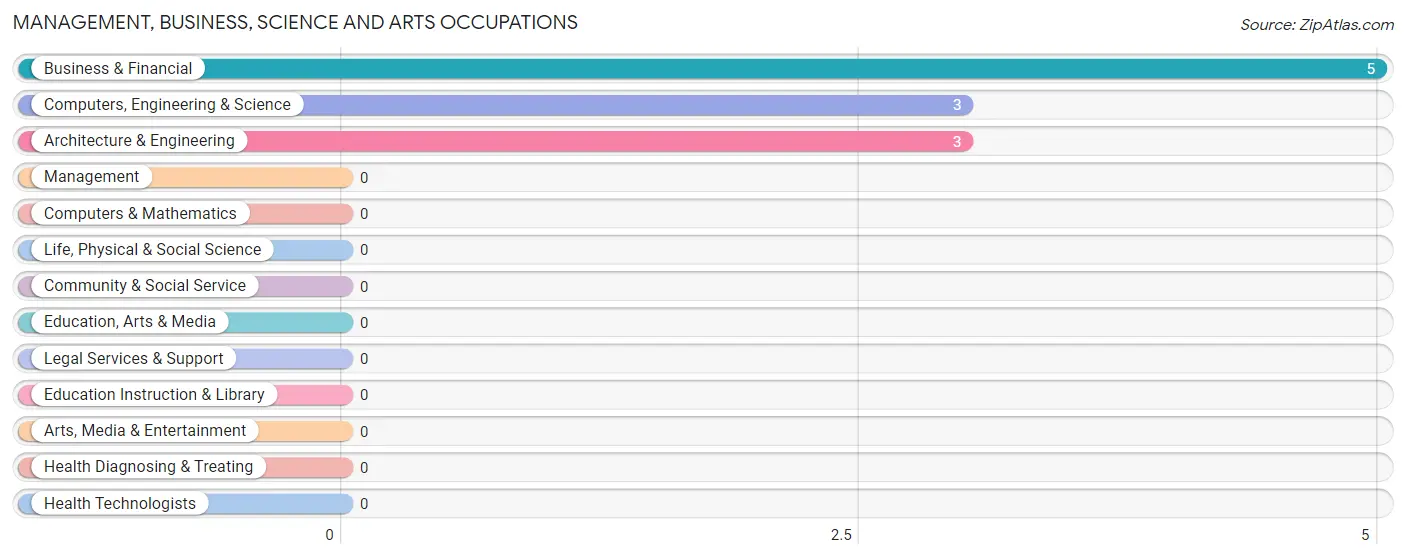
Management, Business, Science and Arts Occupations by Sex
Within the Management, Business, Science and Arts occupations in Reeder, the most male-oriented occupations are Business & Financial (100.0%), Computers, Engineering & Science (33.3%), and Architecture & Engineering (33.3%), while the most female-oriented occupations are Computers, Engineering & Science (66.7%), and Architecture & Engineering (66.7%).
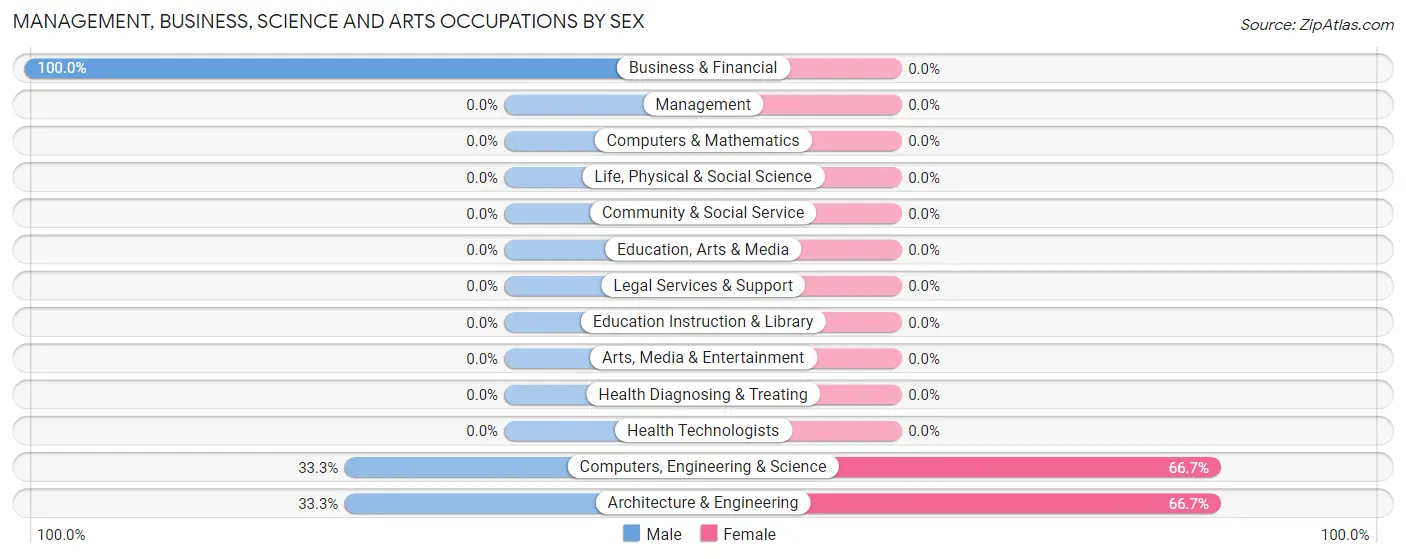
| Occupation | Male | Female |
| Management | 0 (0.0%) | 0 (0.0%) |
| Business & Financial | 5 (100.0%) | 0 (0.0%) |
| Computers, Engineering & Science | 1 (33.3%) | 2 (66.7%) |
| Computers & Mathematics | 0 (0.0%) | 0 (0.0%) |
| Architecture & Engineering | 1 (33.3%) | 2 (66.7%) |
| Life, Physical & Social Science | 0 (0.0%) | 0 (0.0%) |
| Community & Social Service | 0 (0.0%) | 0 (0.0%) |
| Education, Arts & Media | 0 (0.0%) | 0 (0.0%) |
| Legal Services & Support | 0 (0.0%) | 0 (0.0%) |
| Education Instruction & Library | 0 (0.0%) | 0 (0.0%) |
| Arts, Media & Entertainment | 0 (0.0%) | 0 (0.0%) |
| Health Diagnosing & Treating | 0 (0.0%) | 0 (0.0%) |
| Health Technologists | 0 (0.0%) | 0 (0.0%) |
| Total (Category) | 6 (75.0%) | 2 (25.0%) |
| Total (Overall) | 14 (53.8%) | 12 (46.2%) |
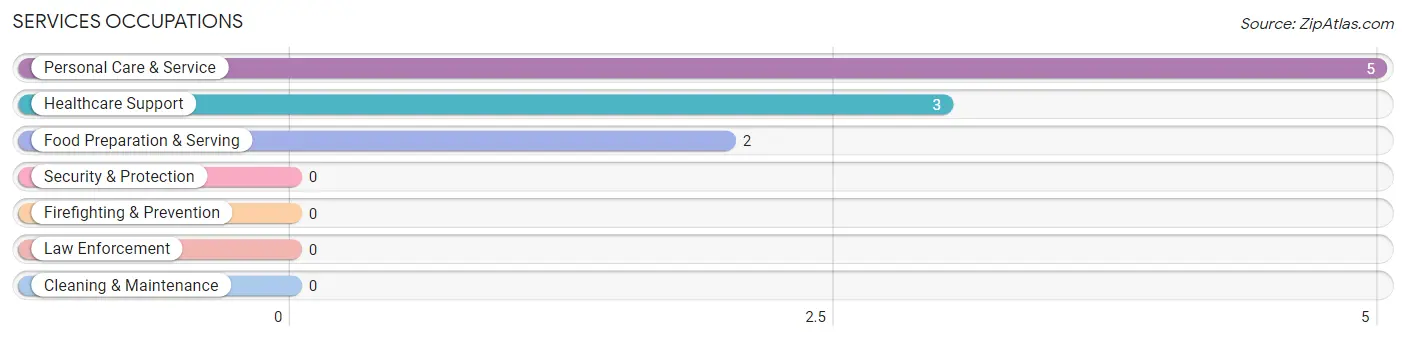
Services Occupations
The most common Services occupations in Reeder are Personal Care & Service (5 | 19.2%), Healthcare Support (3 | 11.5%), and Food Preparation & Serving (2 | 7.7%).
Services Occupations by Sex
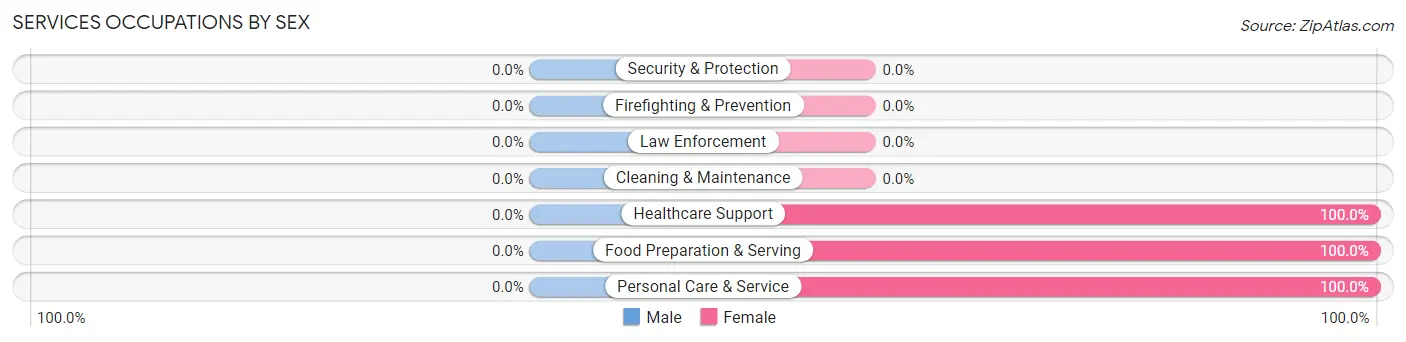
| Occupation | Male | Female |
| Healthcare Support | 0 (0.0%) | 3 (100.0%) |
| Security & Protection | 0 (0.0%) | 0 (0.0%) |
| Firefighting & Prevention | 0 (0.0%) | 0 (0.0%) |
| Law Enforcement | 0 (0.0%) | 0 (0.0%) |
| Food Preparation & Serving | 0 (0.0%) | 2 (100.0%) |
| Cleaning & Maintenance | 0 (0.0%) | 0 (0.0%) |
| Personal Care & Service | 0 (0.0%) | 5 (100.0%) |
| Total (Category) | 0 (0.0%) | 10 (100.0%) |
| Total (Overall) | 14 (53.8%) | 12 (46.2%) |
Sales and Office Occupations
The most common Sales and Office occupations in Reeder are Sales & Related (1 | 3.8%), and Office & Administration (1 | 3.8%).
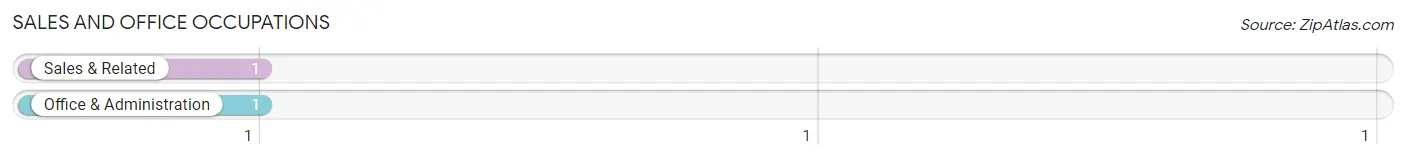
Sales and Office Occupations by Sex
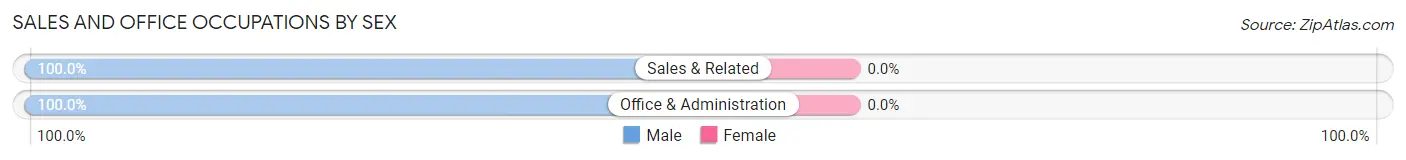
| Occupation | Male | Female |
| Sales & Related | 1 (100.0%) | 0 (0.0%) |
| Office & Administration | 1 (100.0%) | 0 (0.0%) |
| Total (Category) | 2 (100.0%) | 0 (0.0%) |
| Total (Overall) | 14 (53.8%) | 12 (46.2%) |
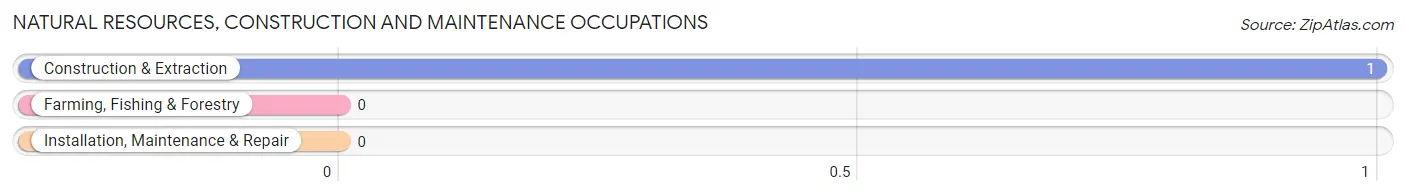
Natural Resources, Construction and Maintenance Occupations
The most common Natural Resources, Construction and Maintenance occupations in Reeder are , and Construction & Extraction (1 | 3.8%).
Natural Resources, Construction and Maintenance Occupations by Sex
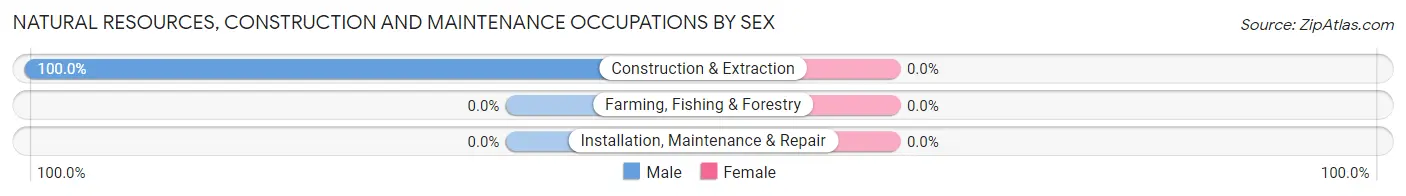
| Occupation | Male | Female |
| Farming, Fishing & Forestry | 0 (0.0%) | 0 (0.0%) |
| Construction & Extraction | 1 (100.0%) | 0 (0.0%) |
| Installation, Maintenance & Repair | 0 (0.0%) | 0 (0.0%) |
| Total (Category) | 1 (100.0%) | 0 (0.0%) |
| Total (Overall) | 14 (53.8%) | 12 (46.2%) |
Production, Transportation and Moving Occupations
The most common Production, Transportation and Moving occupations in Reeder are Production (4 | 15.4%), and Transportation (1 | 3.8%).
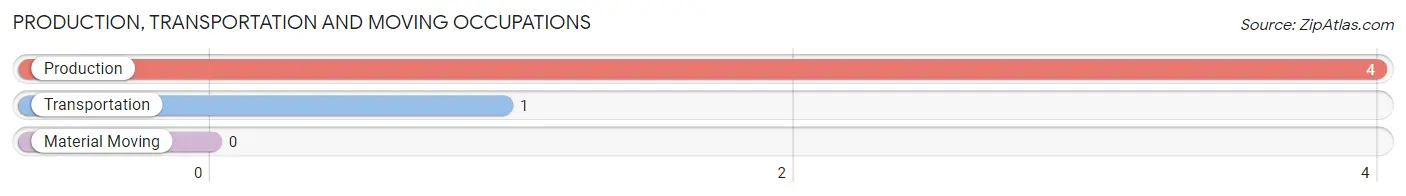
Production, Transportation and Moving Occupations by Sex
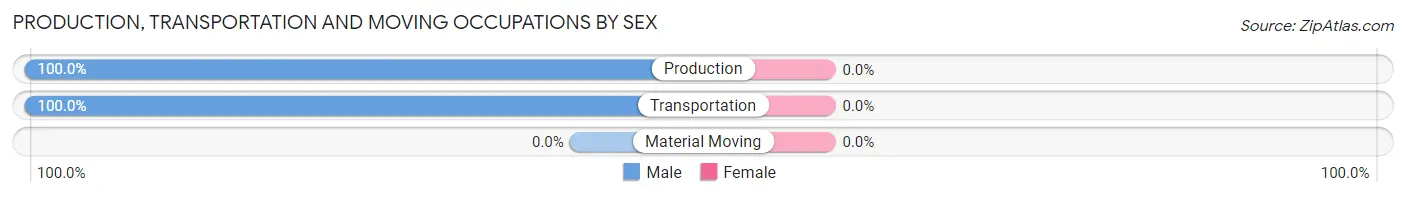
| Occupation | Male | Female |
| Production | 4 (100.0%) | 0 (0.0%) |
| Transportation | 1 (100.0%) | 0 (0.0%) |
| Material Moving | 0 (0.0%) | 0 (0.0%) |
| Total (Category) | 5 (100.0%) | 0 (0.0%) |
| Total (Overall) | 14 (53.8%) | 12 (46.2%) |
Employment Industries by Sex in Reeder
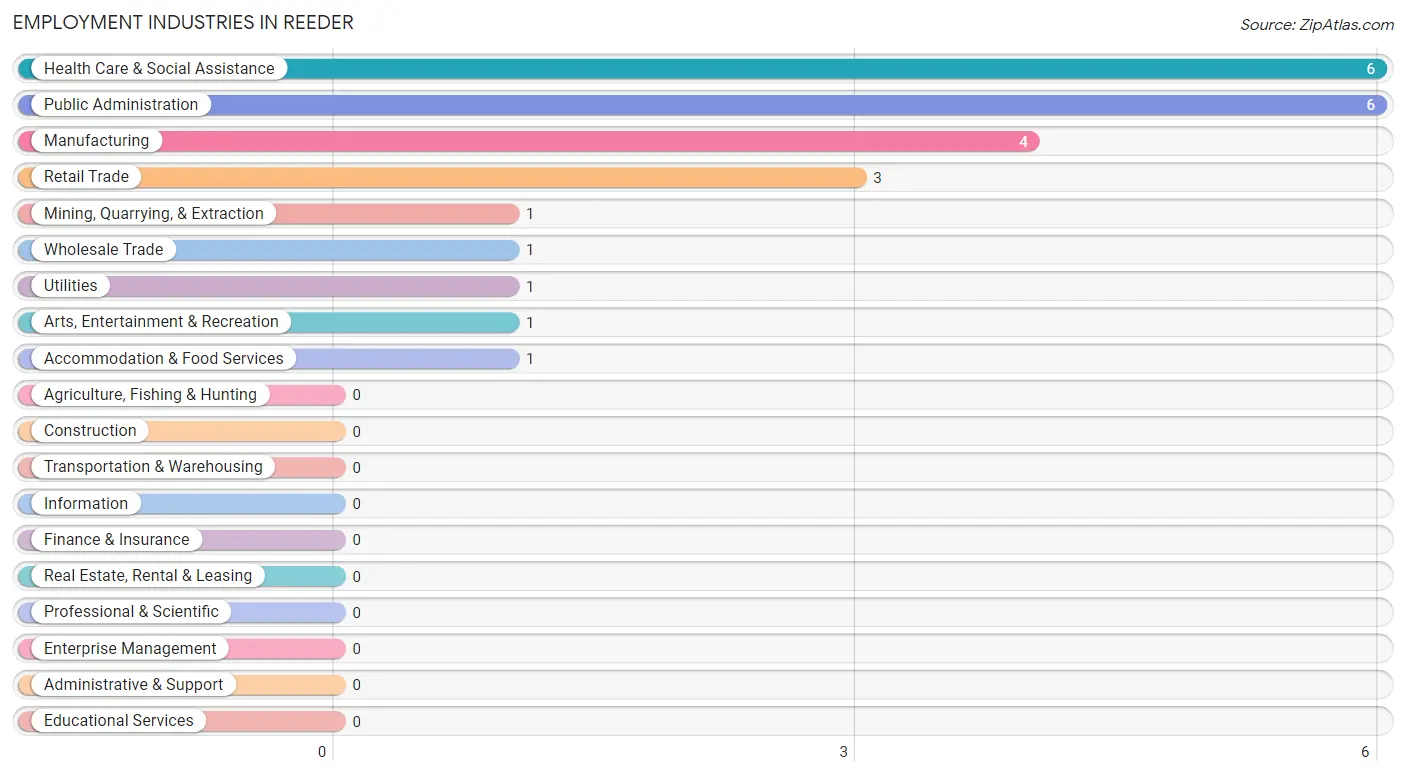
Employment Industries in Reeder
The major employment industries in Reeder include Health Care & Social Assistance (6 | 23.1%), Public Administration (6 | 23.1%), Manufacturing (4 | 15.4%), Retail Trade (3 | 11.5%), and Mining, Quarrying, & Extraction (1 | 3.8%).
Employment Industries by Sex in Reeder
The Reeder industries that see more men than women are Mining, Quarrying, & Extraction (100.0%), Wholesale Trade (100.0%), and Retail Trade (100.0%), whereas the industries that tend to have a higher number of women are Health Care & Social Assistance (100.0%), Arts, Entertainment & Recreation (100.0%), and Accommodation & Food Services (100.0%).
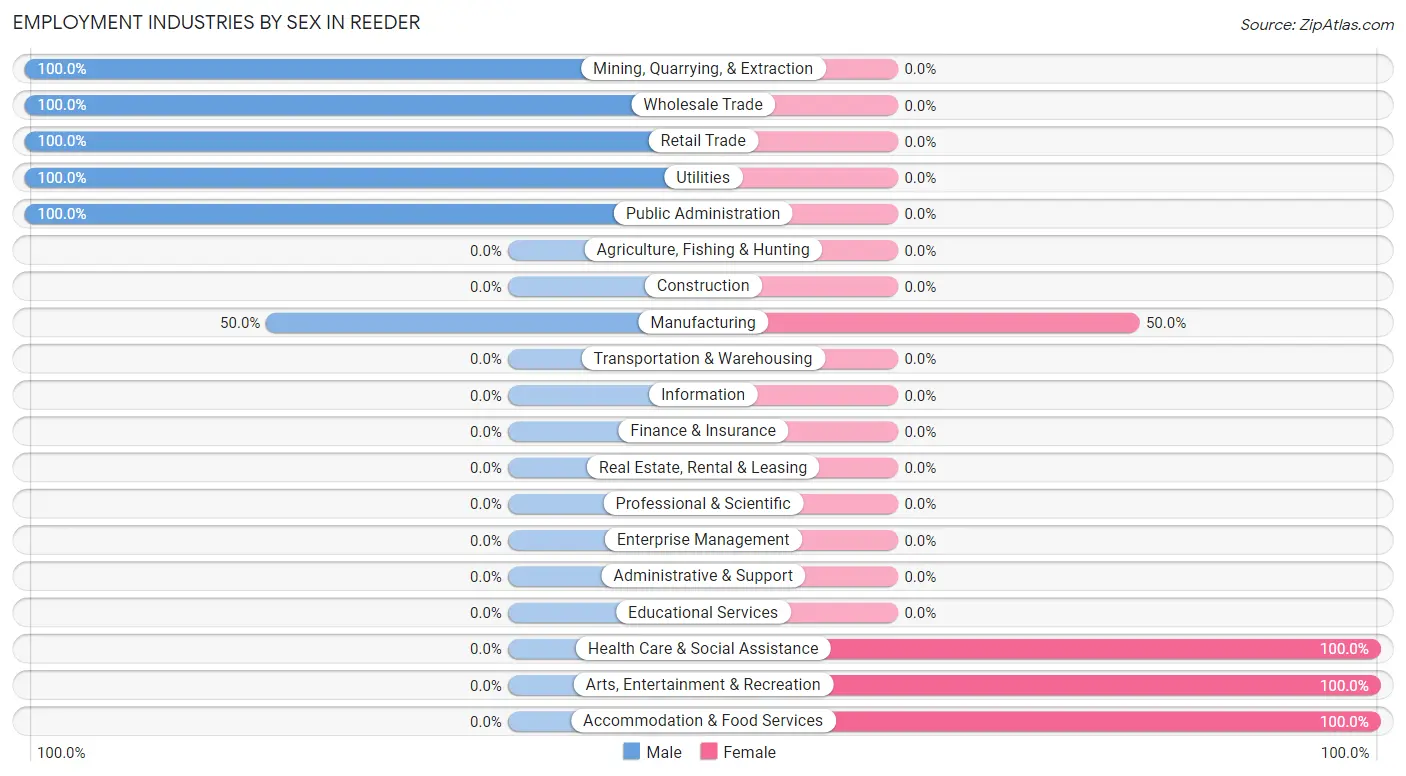
| Industry | Male | Female |
| Agriculture, Fishing & Hunting | 0 (0.0%) | 0 (0.0%) |
| Mining, Quarrying, & Extraction | 1 (100.0%) | 0 (0.0%) |
| Construction | 0 (0.0%) | 0 (0.0%) |
| Manufacturing | 2 (50.0%) | 2 (50.0%) |
| Wholesale Trade | 1 (100.0%) | 0 (0.0%) |
| Retail Trade | 3 (100.0%) | 0 (0.0%) |
| Transportation & Warehousing | 0 (0.0%) | 0 (0.0%) |
| Utilities | 1 (100.0%) | 0 (0.0%) |
| Information | 0 (0.0%) | 0 (0.0%) |
| Finance & Insurance | 0 (0.0%) | 0 (0.0%) |
| Real Estate, Rental & Leasing | 0 (0.0%) | 0 (0.0%) |
| Professional & Scientific | 0 (0.0%) | 0 (0.0%) |
| Enterprise Management | 0 (0.0%) | 0 (0.0%) |
| Administrative & Support | 0 (0.0%) | 0 (0.0%) |
| Educational Services | 0 (0.0%) | 0 (0.0%) |
| Health Care & Social Assistance | 0 (0.0%) | 6 (100.0%) |
| Arts, Entertainment & Recreation | 0 (0.0%) | 1 (100.0%) |
| Accommodation & Food Services | 0 (0.0%) | 1 (100.0%) |
| Public Administration | 6 (100.0%) | 0 (0.0%) |
| Total | 14 (53.8%) | 12 (46.2%) |
Education in Reeder
School Enrollment in Reeder
The most common levels of schooling among the 6 students in Reeder are elementary school (4 | 66.7%), middle school (1 | 16.7%), and high school (1 | 16.7%).
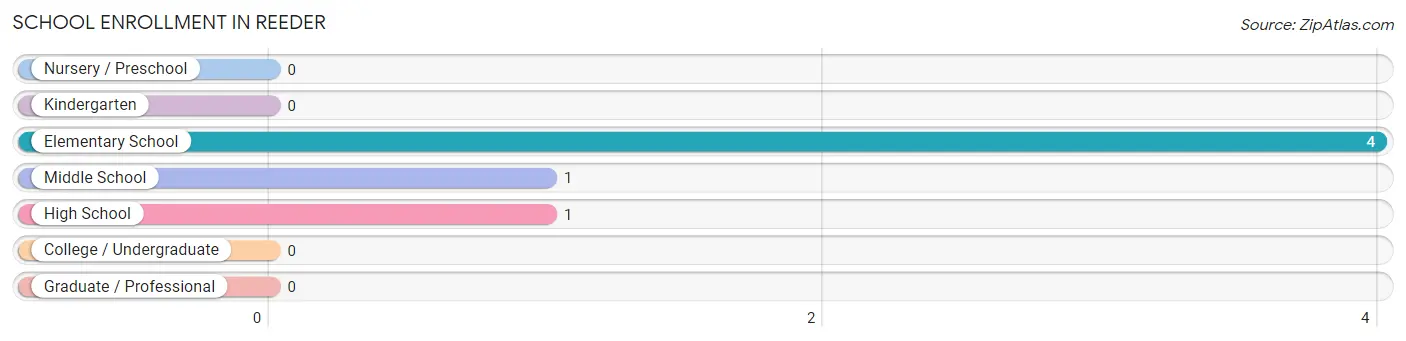
| School Level | # Students | % Students |
| Nursery / Preschool | 0 | 0.0% |
| Kindergarten | 0 | 0.0% |
| Elementary School | 4 | 66.7% |
| Middle School | 1 | 16.7% |
| High School | 1 | 16.7% |
| College / Undergraduate | 0 | 0.0% |
| Graduate / Professional | 0 | 0.0% |
| Total | 6 | 100.0% |
School Enrollment by Age by Funding Source in Reeder
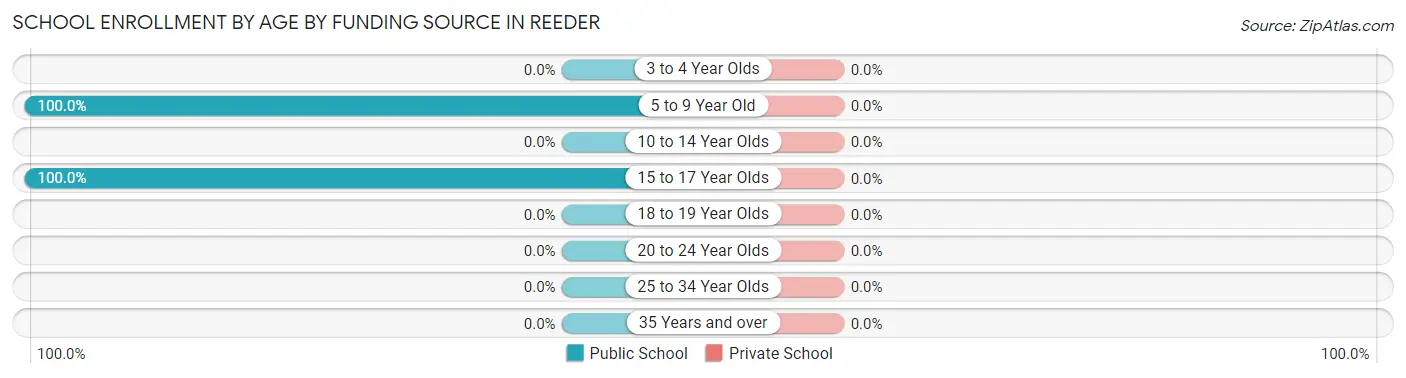
| Age Bracket | Public School | Private School |
| 3 to 4 Year Olds | 0 (0.0%) | 0 (0.0%) |
| 5 to 9 Year Old | 4 (100.0%) | 0 (0.0%) |
| 10 to 14 Year Olds | 0 (0.0%) | 0 (0.0%) |
| 15 to 17 Year Olds | 2 (100.0%) | 0 (0.0%) |
| 18 to 19 Year Olds | 0 (0.0%) | 0 (0.0%) |
| 20 to 24 Year Olds | 0 (0.0%) | 0 (0.0%) |
| 25 to 34 Year Olds | 0 (0.0%) | 0 (0.0%) |
| 35 Years and over | 0 (0.0%) | 0 (0.0%) |
| Total | 6 (100.0%) | 0 (0.0%) |
Educational Attainment by Field of Study in Reeder
Engineering (5 | 83.3%), and education (1 | 16.7%) are the most common fields of study among 6 individuals in Reeder who have obtained a bachelor's degree or higher.
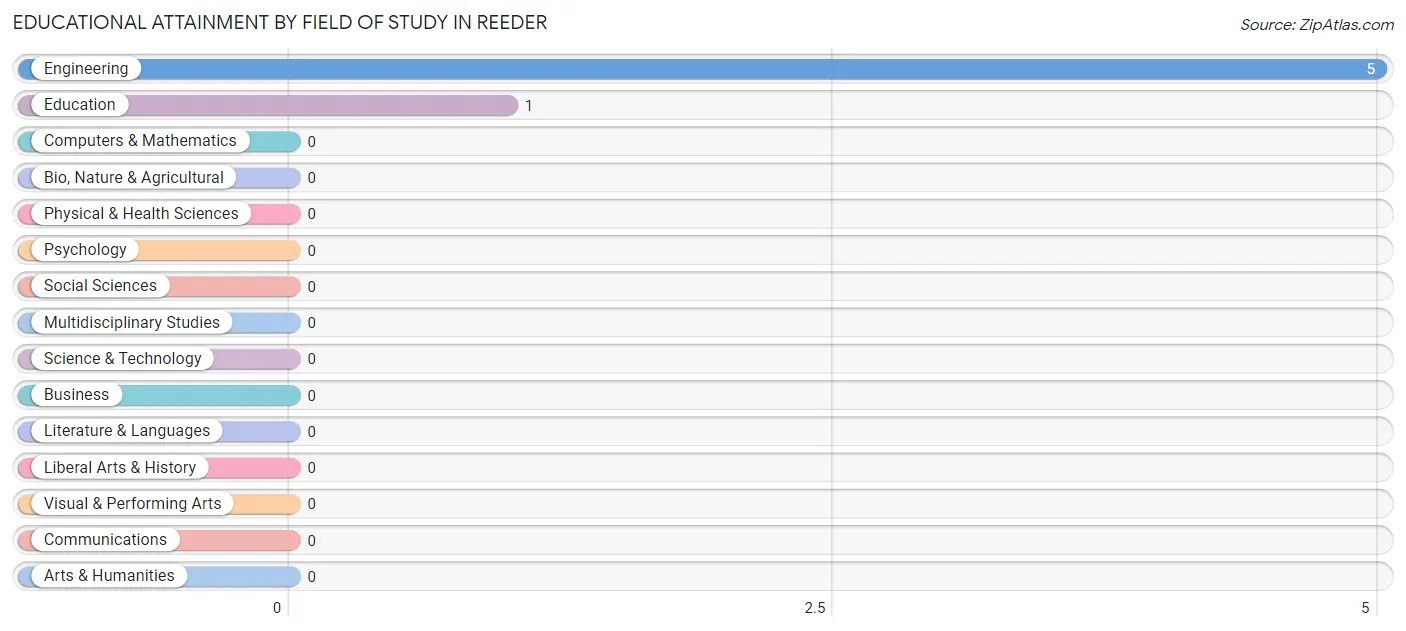
| Field of Study | # Graduates | % Graduates |
| Computers & Mathematics | 0 | 0.0% |
| Bio, Nature & Agricultural | 0 | 0.0% |
| Physical & Health Sciences | 0 | 0.0% |
| Psychology | 0 | 0.0% |
| Social Sciences | 0 | 0.0% |
| Engineering | 5 | 83.3% |
| Multidisciplinary Studies | 0 | 0.0% |
| Science & Technology | 0 | 0.0% |
| Business | 0 | 0.0% |
| Education | 1 | 16.7% |
| Literature & Languages | 0 | 0.0% |
| Liberal Arts & History | 0 | 0.0% |
| Visual & Performing Arts | 0 | 0.0% |
| Communications | 0 | 0.0% |
| Arts & Humanities | 0 | 0.0% |
| Total | 6 | 100.0% |
Transportation & Commute in Reeder
Vehicle Availability by Sex in Reeder
The most prevalent vehicle ownership categories in Reeder are males with 3 vehicles (8, accounting for 57.1%) and females with 3 vehicles (3, making up 66.7%).
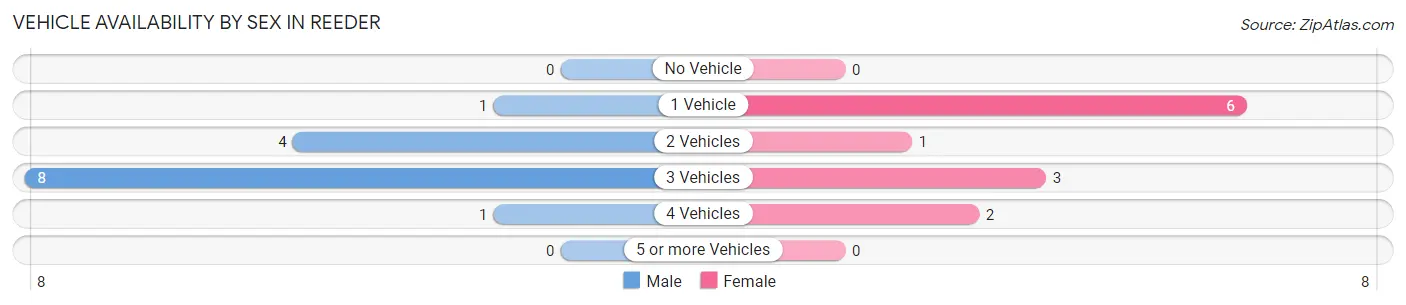
| Vehicles Available | Male | Female |
| No Vehicle | 0 (0.0%) | 0 (0.0%) |
| 1 Vehicle | 1 (7.1%) | 6 (50.0%) |
| 2 Vehicles | 4 (28.6%) | 1 (8.3%) |
| 3 Vehicles | 8 (57.1%) | 3 (25.0%) |
| 4 Vehicles | 1 (7.1%) | 2 (16.7%) |
| 5 or more Vehicles | 0 (0.0%) | 0 (0.0%) |
| Total | 14 (100.0%) | 12 (100.0%) |
Commute Time in Reeder
The most frequently occuring commute durations in Reeder are 10 to 14 minutes (7 commuters, 28.0%), 25 to 29 minutes (6 commuters, 24.0%), and 15 to 19 minutes (5 commuters, 20.0%).
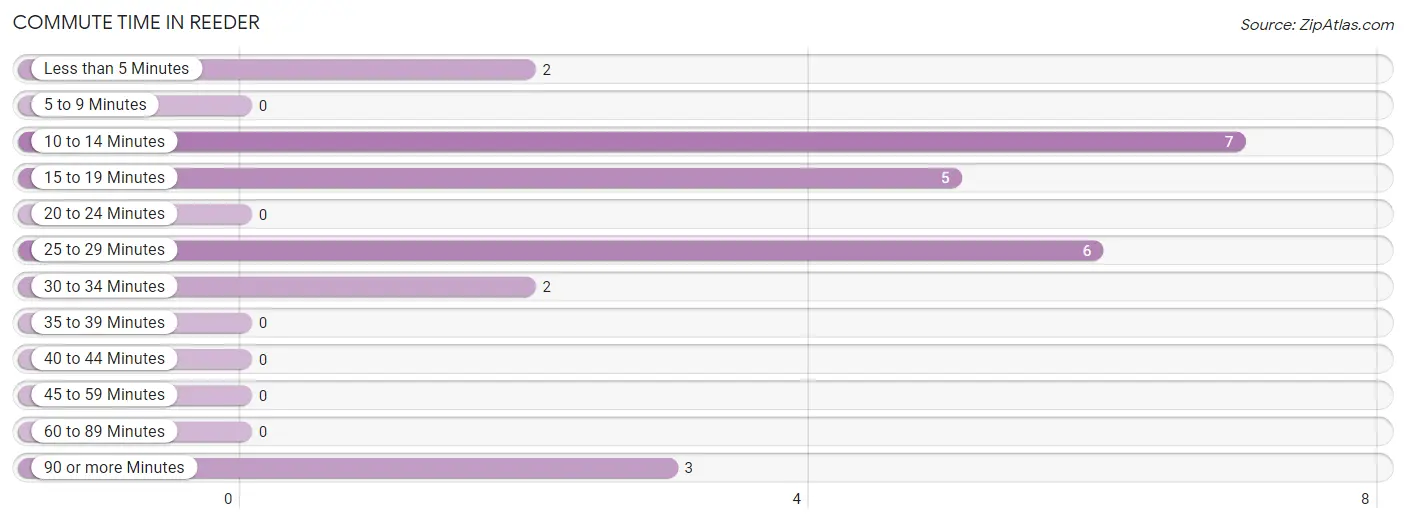
| Commute Time | # Commuters | % Commuters |
| Less than 5 Minutes | 2 | 8.0% |
| 5 to 9 Minutes | 0 | 0.0% |
| 10 to 14 Minutes | 7 | 28.0% |
| 15 to 19 Minutes | 5 | 20.0% |
| 20 to 24 Minutes | 0 | 0.0% |
| 25 to 29 Minutes | 6 | 24.0% |
| 30 to 34 Minutes | 2 | 8.0% |
| 35 to 39 Minutes | 0 | 0.0% |
| 40 to 44 Minutes | 0 | 0.0% |
| 45 to 59 Minutes | 0 | 0.0% |
| 60 to 89 Minutes | 0 | 0.0% |
| 90 or more Minutes | 3 | 12.0% |
Commute Time by Sex in Reeder
The most common commute times in Reeder are 10 to 14 minutes (7 commuters, 50.0%) for males and 25 to 29 minutes (4 commuters, 36.4%) for females.
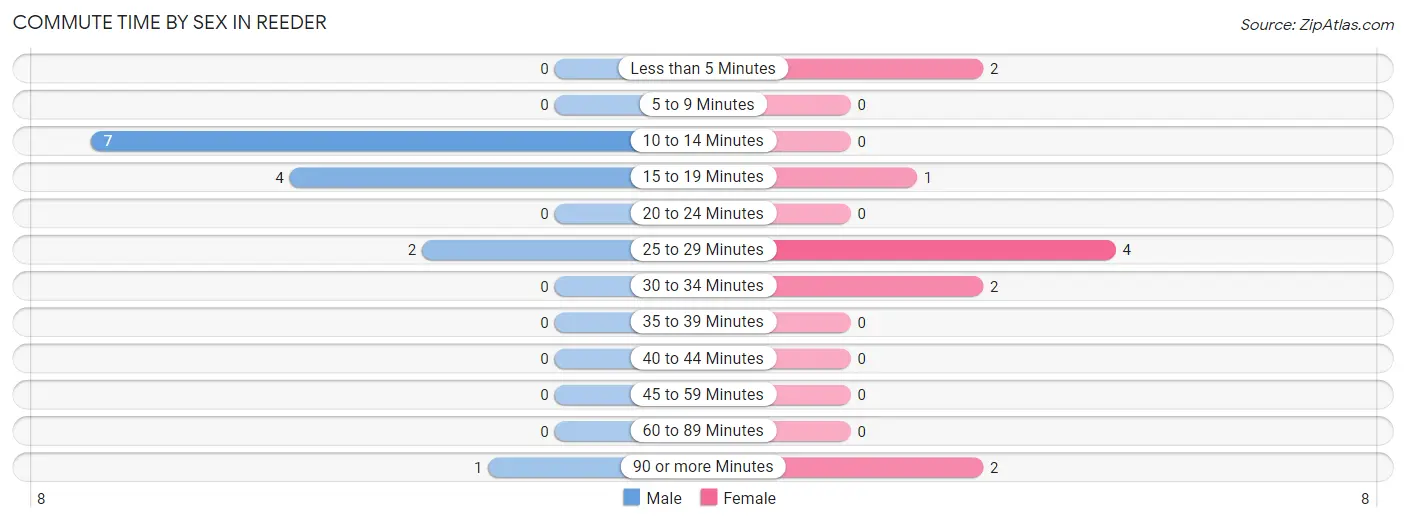
| Commute Time | Male | Female |
| Less than 5 Minutes | 0 (0.0%) | 2 (18.2%) |
| 5 to 9 Minutes | 0 (0.0%) | 0 (0.0%) |
| 10 to 14 Minutes | 7 (50.0%) | 0 (0.0%) |
| 15 to 19 Minutes | 4 (28.6%) | 1 (9.1%) |
| 20 to 24 Minutes | 0 (0.0%) | 0 (0.0%) |
| 25 to 29 Minutes | 2 (14.3%) | 4 (36.4%) |
| 30 to 34 Minutes | 0 (0.0%) | 2 (18.2%) |
| 35 to 39 Minutes | 0 (0.0%) | 0 (0.0%) |
| 40 to 44 Minutes | 0 (0.0%) | 0 (0.0%) |
| 45 to 59 Minutes | 0 (0.0%) | 0 (0.0%) |
| 60 to 89 Minutes | 0 (0.0%) | 0 (0.0%) |
| 90 or more Minutes | 1 (7.1%) | 2 (18.2%) |
Time of Departure to Work by Sex in Reeder
The most frequent times of departure to work in Reeder are 8:30 AM to 8:59 AM (6, 42.9%) for males and 5:00 AM to 5:29 AM (2, 18.2%) for females.
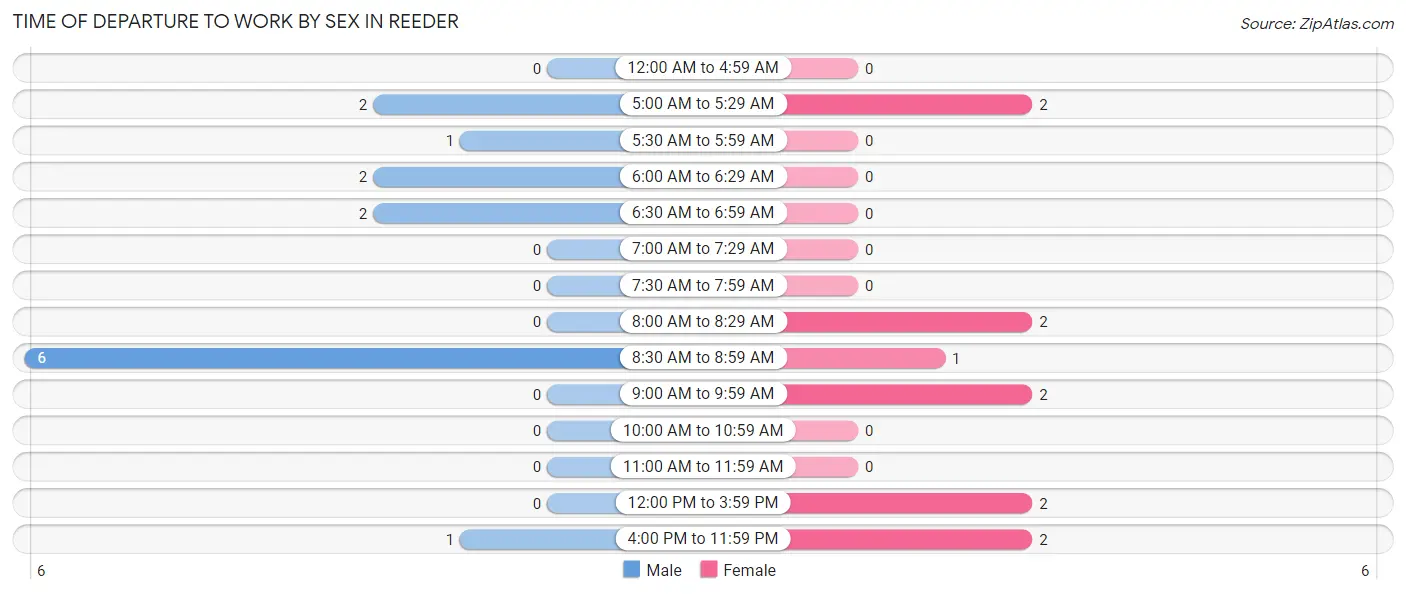
| Time of Departure | Male | Female |
| 12:00 AM to 4:59 AM | 0 (0.0%) | 0 (0.0%) |
| 5:00 AM to 5:29 AM | 2 (14.3%) | 2 (18.2%) |
| 5:30 AM to 5:59 AM | 1 (7.1%) | 0 (0.0%) |
| 6:00 AM to 6:29 AM | 2 (14.3%) | 0 (0.0%) |
| 6:30 AM to 6:59 AM | 2 (14.3%) | 0 (0.0%) |
| 7:00 AM to 7:29 AM | 0 (0.0%) | 0 (0.0%) |
| 7:30 AM to 7:59 AM | 0 (0.0%) | 0 (0.0%) |
| 8:00 AM to 8:29 AM | 0 (0.0%) | 2 (18.2%) |
| 8:30 AM to 8:59 AM | 6 (42.9%) | 1 (9.1%) |
| 9:00 AM to 9:59 AM | 0 (0.0%) | 2 (18.2%) |
| 10:00 AM to 10:59 AM | 0 (0.0%) | 0 (0.0%) |
| 11:00 AM to 11:59 AM | 0 (0.0%) | 0 (0.0%) |
| 12:00 PM to 3:59 PM | 0 (0.0%) | 2 (18.2%) |
| 4:00 PM to 11:59 PM | 1 (7.1%) | 2 (18.2%) |
| Total | 14 (100.0%) | 11 (100.0%) |
Housing Occupancy in Reeder
Occupancy by Ownership in Reeder
Of the total 46 dwellings in Reeder, owner-occupied units account for 41 (89.1%), while renter-occupied units make up 5 (10.9%).
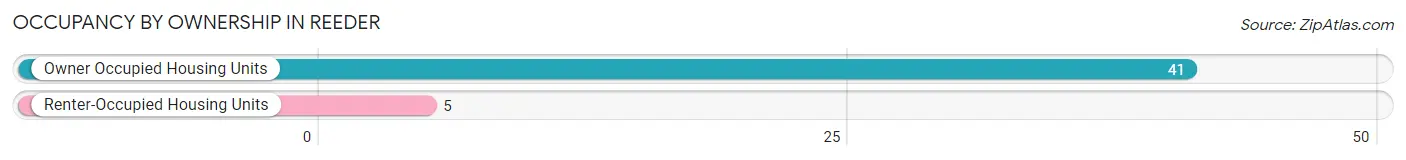
| Occupancy | # Housing Units | % Housing Units |
| Owner Occupied Housing Units | 41 | 89.1% |
| Renter-Occupied Housing Units | 5 | 10.9% |
| Total Occupied Housing Units | 46 | 100.0% |
Occupancy by Household Size in Reeder
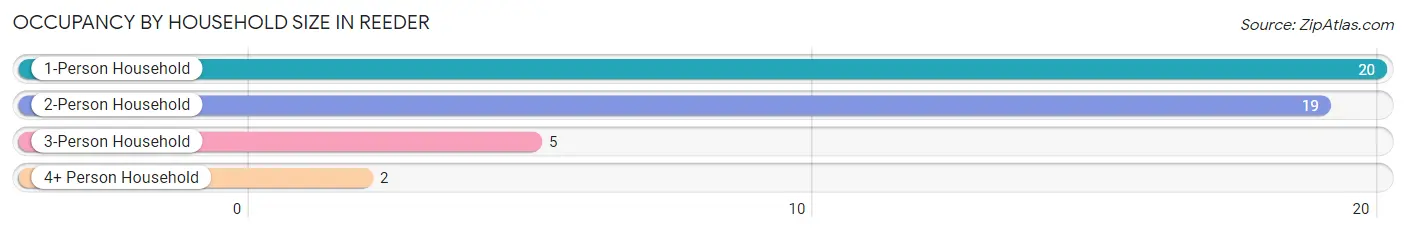
| Household Size | # Housing Units | % Housing Units |
| 1-Person Household | 20 | 43.5% |
| 2-Person Household | 19 | 41.3% |
| 3-Person Household | 5 | 10.9% |
| 4+ Person Household | 2 | 4.3% |
| Total Housing Units | 46 | 100.0% |
Occupancy by Ownership by Household Size in Reeder
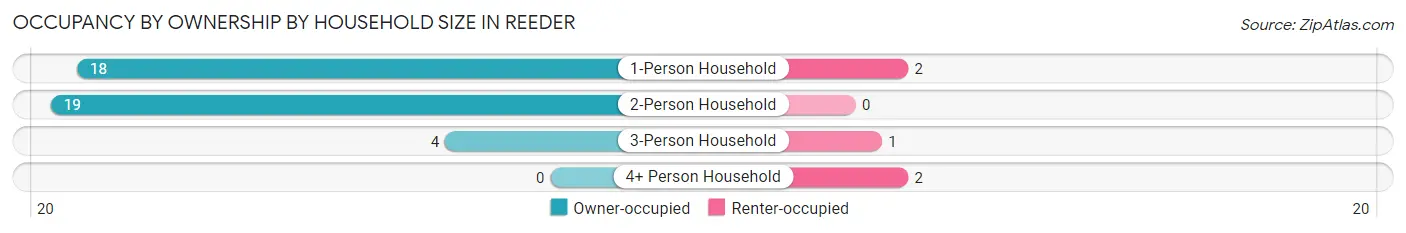
| Household Size | Owner-occupied | Renter-occupied |
| 1-Person Household | 18 (90.0%) | 2 (10.0%) |
| 2-Person Household | 19 (100.0%) | 0 (0.0%) |
| 3-Person Household | 4 (80.0%) | 1 (20.0%) |
| 4+ Person Household | 0 (0.0%) | 2 (100.0%) |
| Total Housing Units | 41 (89.1%) | 5 (10.9%) |
Occupancy by Educational Attainment in Reeder
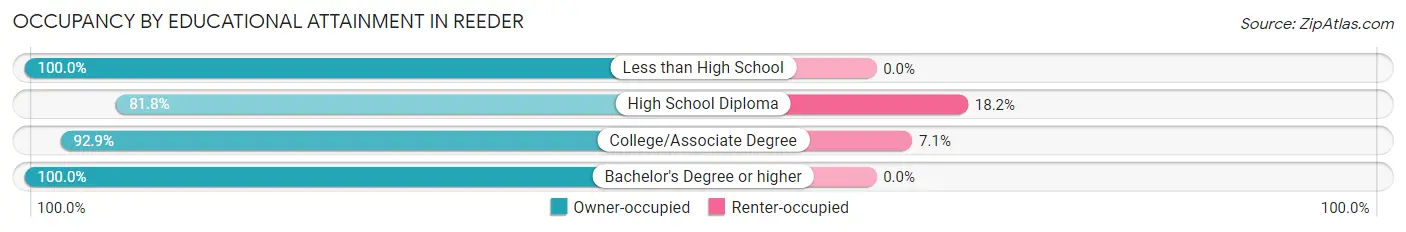
| Household Size | Owner-occupied | Renter-occupied |
| Less than High School | 5 (100.0%) | 0 (0.0%) |
| High School Diploma | 18 (81.8%) | 4 (18.2%) |
| College/Associate Degree | 13 (92.9%) | 1 (7.1%) |
| Bachelor's Degree or higher | 5 (100.0%) | 0 (0.0%) |
Occupancy by Age of Householder in Reeder

| Age Bracket | # Households | % Households |
| Under 35 Years | 2 | 4.3% |
| 35 to 44 Years | 10 | 21.7% |
| 45 to 54 Years | 3 | 6.5% |
| 55 to 64 Years | 5 | 10.9% |
| 65 to 74 Years | 11 | 23.9% |
| 75 to 84 Years | 15 | 32.6% |
| 85 Years and Over | 0 | 0.0% |
| Total | 46 | 100.0% |
Housing Finances in Reeder
Median Income by Occupancy in Reeder
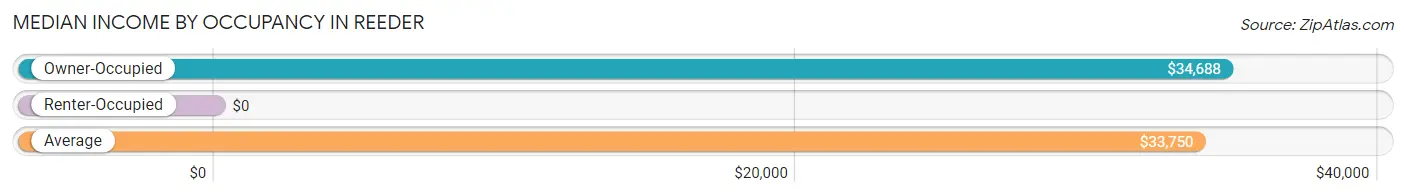
| Occupancy Type | # Households | Median Income |
| Owner-Occupied | 41 (89.1%) | $34,688 |
| Renter-Occupied | 5 (10.9%) | $0 |
| Average | 46 (100.0%) | $33,750 |
Occupancy by Householder Income Bracket in Reeder
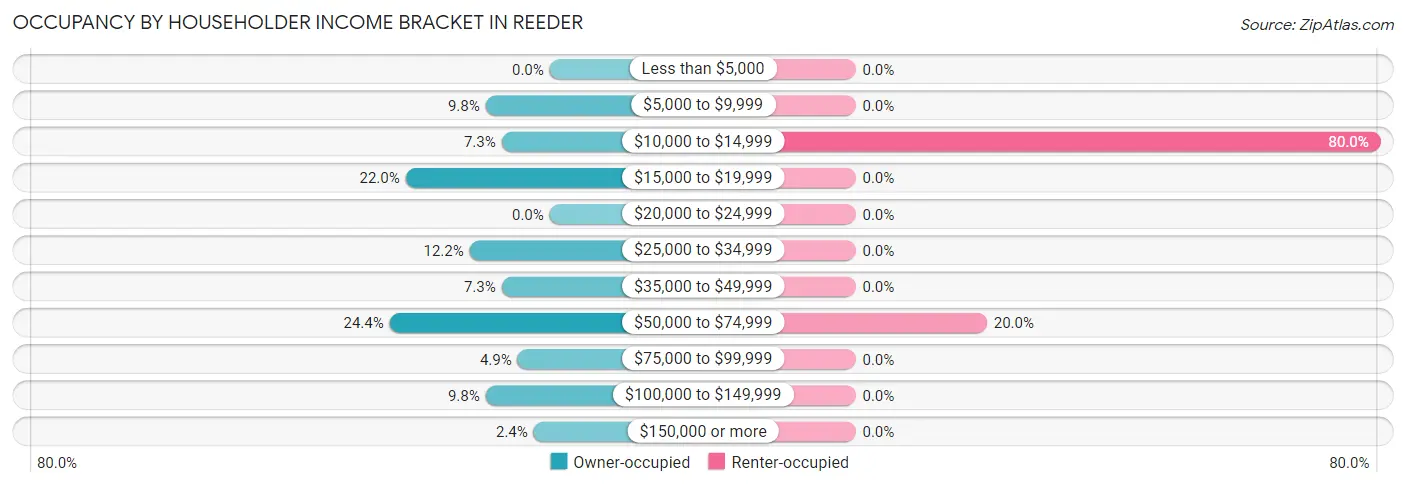
| Income Bracket | Owner-occupied | Renter-occupied |
| Less than $5,000 | 0 (0.0%) | 0 (0.0%) |
| $5,000 to $9,999 | 4 (9.8%) | 0 (0.0%) |
| $10,000 to $14,999 | 3 (7.3%) | 4 (80.0%) |
| $15,000 to $19,999 | 9 (22.0%) | 0 (0.0%) |
| $20,000 to $24,999 | 0 (0.0%) | 0 (0.0%) |
| $25,000 to $34,999 | 5 (12.2%) | 0 (0.0%) |
| $35,000 to $49,999 | 3 (7.3%) | 0 (0.0%) |
| $50,000 to $74,999 | 10 (24.4%) | 1 (20.0%) |
| $75,000 to $99,999 | 2 (4.9%) | 0 (0.0%) |
| $100,000 to $149,999 | 4 (9.8%) | 0 (0.0%) |
| $150,000 or more | 1 (2.4%) | 0 (0.0%) |
| Total | 41 (100.0%) | 5 (100.0%) |
Monthly Housing Cost Tiers in Reeder
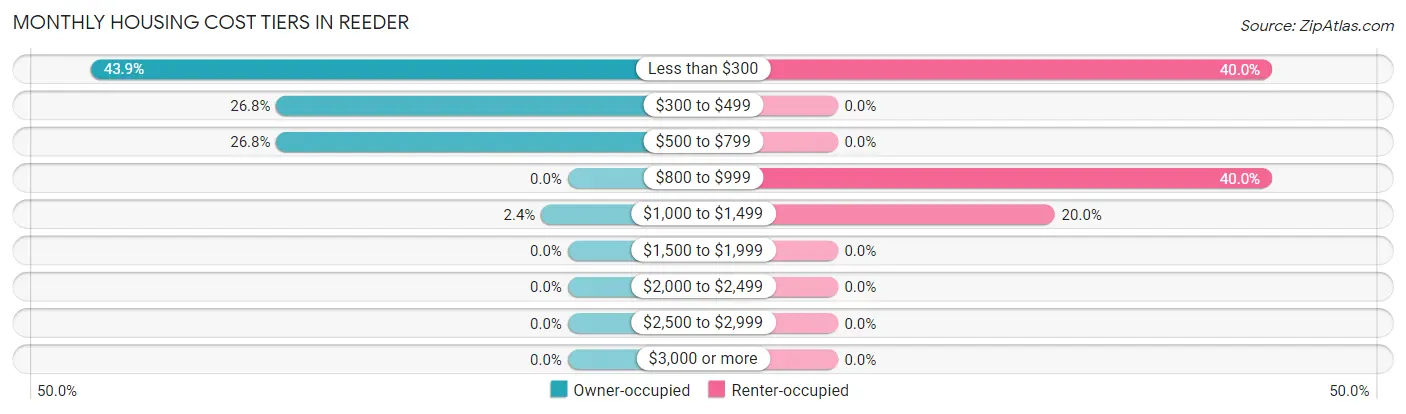
| Monthly Cost | Owner-occupied | Renter-occupied |
| Less than $300 | 18 (43.9%) | 2 (40.0%) |
| $300 to $499 | 11 (26.8%) | 0 (0.0%) |
| $500 to $799 | 11 (26.8%) | 0 (0.0%) |
| $800 to $999 | 0 (0.0%) | 2 (40.0%) |
| $1,000 to $1,499 | 1 (2.4%) | 1 (20.0%) |
| $1,500 to $1,999 | 0 (0.0%) | 0 (0.0%) |
| $2,000 to $2,499 | 0 (0.0%) | 0 (0.0%) |
| $2,500 to $2,999 | 0 (0.0%) | 0 (0.0%) |
| $3,000 or more | 0 (0.0%) | 0 (0.0%) |
| Total | 41 (100.0%) | 5 (100.0%) |
Physical Housing Characteristics in Reeder
Housing Structures in Reeder
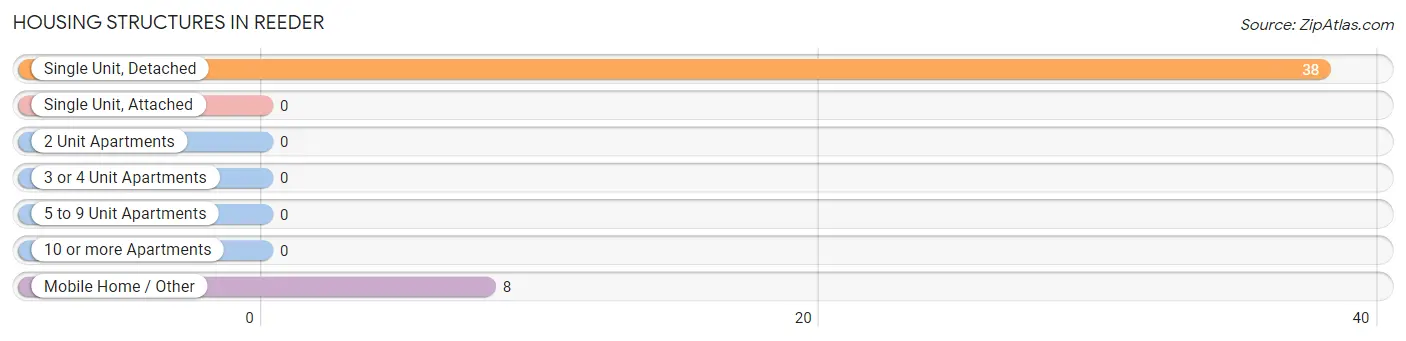
| Structure Type | # Housing Units | % Housing Units |
| Single Unit, Detached | 38 | 82.6% |
| Single Unit, Attached | 0 | 0.0% |
| 2 Unit Apartments | 0 | 0.0% |
| 3 or 4 Unit Apartments | 0 | 0.0% |
| 5 to 9 Unit Apartments | 0 | 0.0% |
| 10 or more Apartments | 0 | 0.0% |
| Mobile Home / Other | 8 | 17.4% |
| Total | 46 | 100.0% |
Housing Structures by Occupancy in Reeder
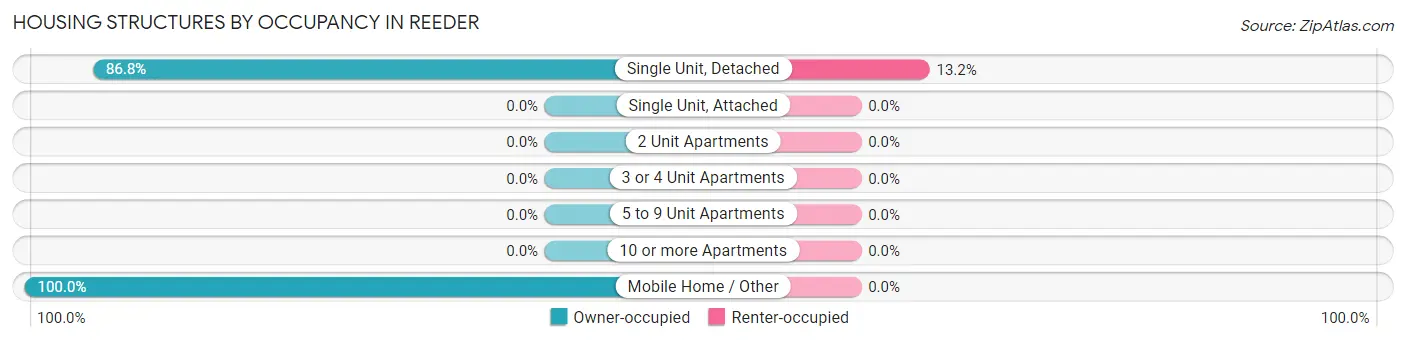
| Structure Type | Owner-occupied | Renter-occupied |
| Single Unit, Detached | 33 (86.8%) | 5 (13.2%) |
| Single Unit, Attached | 0 (0.0%) | 0 (0.0%) |
| 2 Unit Apartments | 0 (0.0%) | 0 (0.0%) |
| 3 or 4 Unit Apartments | 0 (0.0%) | 0 (0.0%) |
| 5 to 9 Unit Apartments | 0 (0.0%) | 0 (0.0%) |
| 10 or more Apartments | 0 (0.0%) | 0 (0.0%) |
| Mobile Home / Other | 8 (100.0%) | 0 (0.0%) |
| Total | 41 (89.1%) | 5 (10.9%) |
Housing Structures by Number of Rooms in Reeder
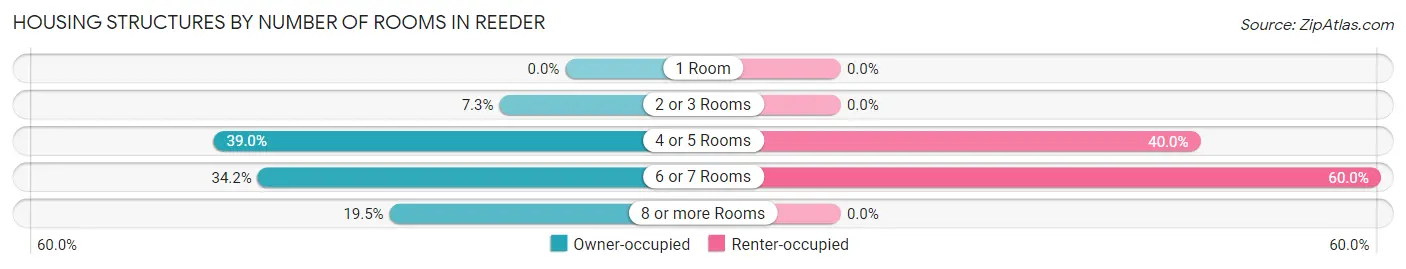
| Number of Rooms | Owner-occupied | Renter-occupied |
| 1 Room | 0 (0.0%) | 0 (0.0%) |
| 2 or 3 Rooms | 3 (7.3%) | 0 (0.0%) |
| 4 or 5 Rooms | 16 (39.0%) | 2 (40.0%) |
| 6 or 7 Rooms | 14 (34.2%) | 3 (60.0%) |
| 8 or more Rooms | 8 (19.5%) | 0 (0.0%) |
| Total | 41 (100.0%) | 5 (100.0%) |
Housing Structure by Heating Type in Reeder
| Heating Type | Owner-occupied | Renter-occupied |
| Utility Gas | 7 (17.1%) | 0 (0.0%) |
| Bottled, Tank, or LP Gas | 22 (53.7%) | 5 (100.0%) |
| Electricity | 9 (22.0%) | 0 (0.0%) |
| Fuel Oil or Kerosene | 0 (0.0%) | 0 (0.0%) |
| Coal or Coke | 0 (0.0%) | 0 (0.0%) |
| All other Fuels | 3 (7.3%) | 0 (0.0%) |
| No Fuel Used | 0 (0.0%) | 0 (0.0%) |
| Total | 41 (100.0%) | 5 (100.0%) |
Household Vehicle Usage in Reeder
| Vehicles per Household | Owner-occupied | Renter-occupied |
| No Vehicle | 0 (0.0%) | 0 (0.0%) |
| 1 Vehicle | 13 (31.7%) | 3 (60.0%) |
| 2 Vehicles | 16 (39.0%) | 0 (0.0%) |
| 3 or more Vehicles | 12 (29.3%) | 2 (40.0%) |
| Total | 41 (100.0%) | 5 (100.0%) |
Real Estate & Mortgages in Reeder
Real Estate and Mortgage Overview in Reeder
| Characteristic | Without Mortgage | With Mortgage |
| Housing Units | 38 | 3 |
| Median Property Value | $43,800 | $0 |
| Median Household Income | $33,750 | $0 |
| Monthly Housing Costs | $310 | $0 |
| Real Estate Taxes | $589 | $0 |
Property Value by Mortgage Status in Reeder
| Property Value | Without Mortgage | With Mortgage |
| Less than $50,000 | 27 (71.1%) | 1 (33.3%) |
| $50,000 to $99,999 | 10 (26.3%) | 2 (66.7%) |
| $100,000 to $299,999 | 1 (2.6%) | 0 (0.0%) |
| $300,000 to $499,999 | 0 (0.0%) | 0 (0.0%) |
| $500,000 to $749,999 | 0 (0.0%) | 0 (0.0%) |
| $750,000 to $999,999 | 0 (0.0%) | 0 (0.0%) |
| $1,000,000 or more | 0 (0.0%) | 0 (0.0%) |
| Total | 38 (100.0%) | 3 (100.0%) |
Household Income by Mortgage Status in Reeder
| Household Income | Without Mortgage | With Mortgage |
| Less than $10,000 | 4 (10.5%) | 0 (0.0%) |
| $10,000 to $24,999 | 12 (31.6%) | 0 (0.0%) |
| $25,000 to $34,999 | 5 (13.2%) | 0 (0.0%) |
| $35,000 to $49,999 | 3 (7.9%) | 0 (0.0%) |
| $50,000 to $74,999 | 8 (21.0%) | 0 (0.0%) |
| $75,000 to $99,999 | 2 (5.3%) | 2 (66.7%) |
| $100,000 to $149,999 | 3 (7.9%) | 0 (0.0%) |
| $150,000 or more | 1 (2.6%) | 1 (33.3%) |
| Total | 38 (100.0%) | 3 (100.0%) |
Property Value to Household Income Ratio in Reeder
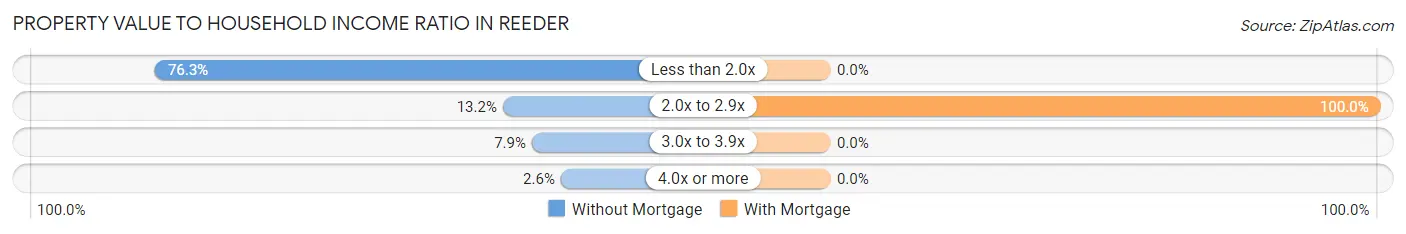
| Value-to-Income Ratio | Without Mortgage | With Mortgage |
| Less than 2.0x | 29 (76.3%) | 0 (0.0%) |
| 2.0x to 2.9x | 5 (13.2%) | 3 (100.0%) |
| 3.0x to 3.9x | 3 (7.9%) | 0 (0.0%) |
| 4.0x or more | 1 (2.6%) | 0 (0.0%) |
| Total | 38 (100.0%) | 3 (100.0%) |
Real Estate Taxes by Mortgage Status in Reeder
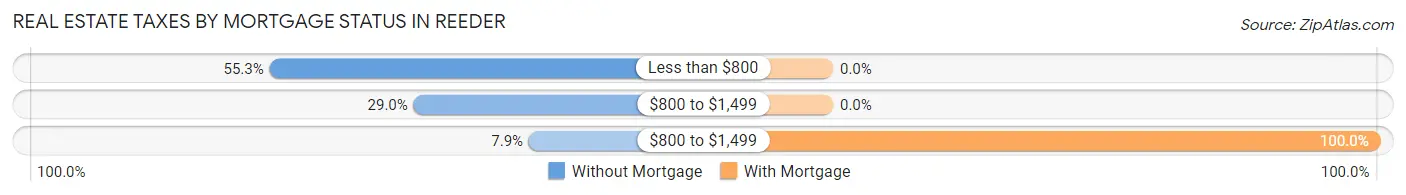
| Property Taxes | Without Mortgage | With Mortgage |
| Less than $800 | 21 (55.3%) | 0 (0.0%) |
| $800 to $1,499 | 11 (28.9%) | 0 (0.0%) |
| $800 to $1,499 | 3 (7.9%) | 3 (100.0%) |
| Total | 38 (100.0%) | 3 (100.0%) |
Health & Disability in Reeder
Health Insurance Coverage by Age in Reeder
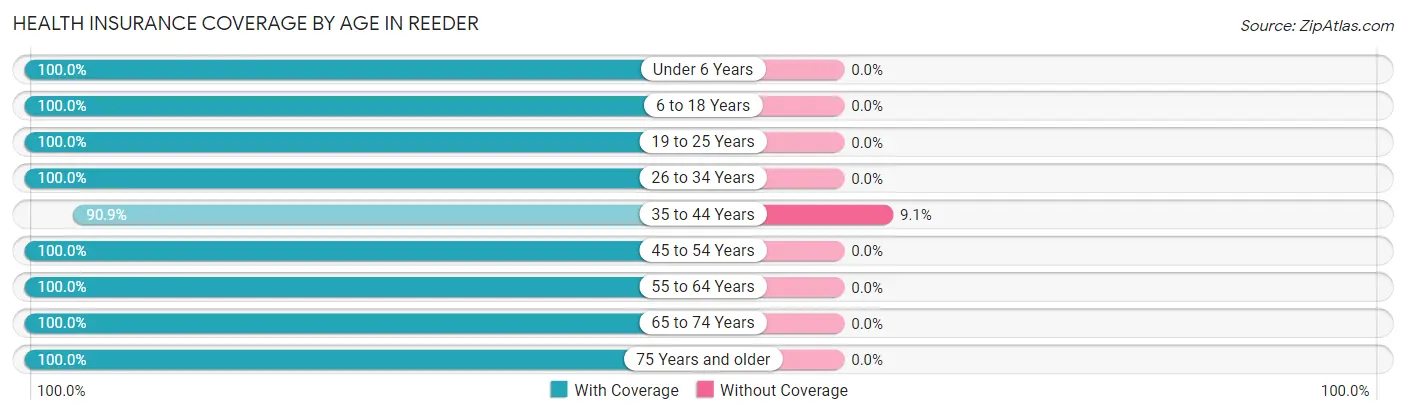
| Age Bracket | With Coverage | Without Coverage |
| Under 6 Years | 2 (100.0%) | 0 (0.0%) |
| 6 to 18 Years | 8 (100.0%) | 0 (0.0%) |
| 19 to 25 Years | 1 (100.0%) | 0 (0.0%) |
| 26 to 34 Years | 3 (100.0%) | 0 (0.0%) |
| 35 to 44 Years | 10 (90.9%) | 1 (9.1%) |
| 45 to 54 Years | 14 (100.0%) | 0 (0.0%) |
| 55 to 64 Years | 6 (100.0%) | 0 (0.0%) |
| 65 to 74 Years | 17 (100.0%) | 0 (0.0%) |
| 75 Years and older | 24 (100.0%) | 0 (0.0%) |
| Total | 85 (98.8%) | 1 (1.2%) |
Health Insurance Coverage by Citizenship Status in Reeder
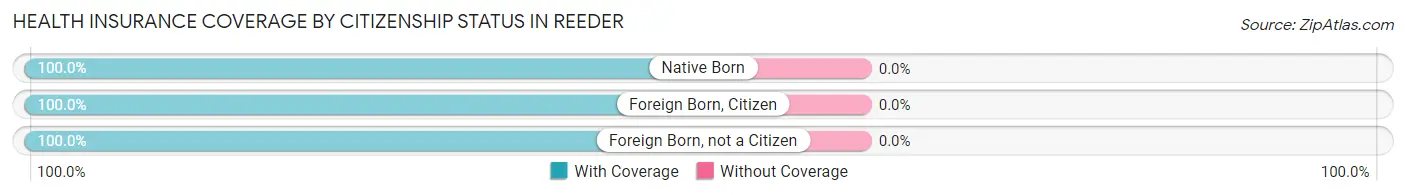
| Citizenship Status | With Coverage | Without Coverage |
| Native Born | 2 (100.0%) | 0 (0.0%) |
| Foreign Born, Citizen | 8 (100.0%) | 0 (0.0%) |
| Foreign Born, not a Citizen | 1 (100.0%) | 0 (0.0%) |
Health Insurance Coverage by Household Income in Reeder
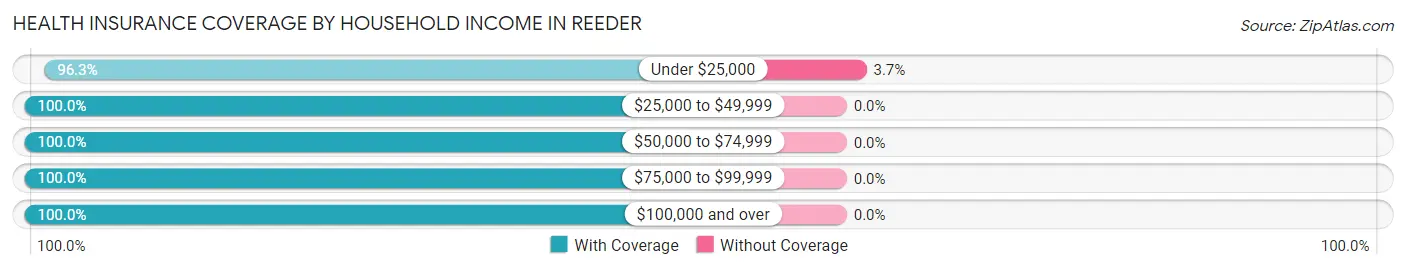
| Household Income | With Coverage | Without Coverage |
| Under $25,000 | 26 (96.3%) | 1 (3.7%) |
| $25,000 to $49,999 | 25 (100.0%) | 0 (0.0%) |
| $50,000 to $74,999 | 20 (100.0%) | 0 (0.0%) |
| $75,000 to $99,999 | 2 (100.0%) | 0 (0.0%) |
| $100,000 and over | 12 (100.0%) | 0 (0.0%) |
Public vs Private Health Insurance Coverage by Age in Reeder
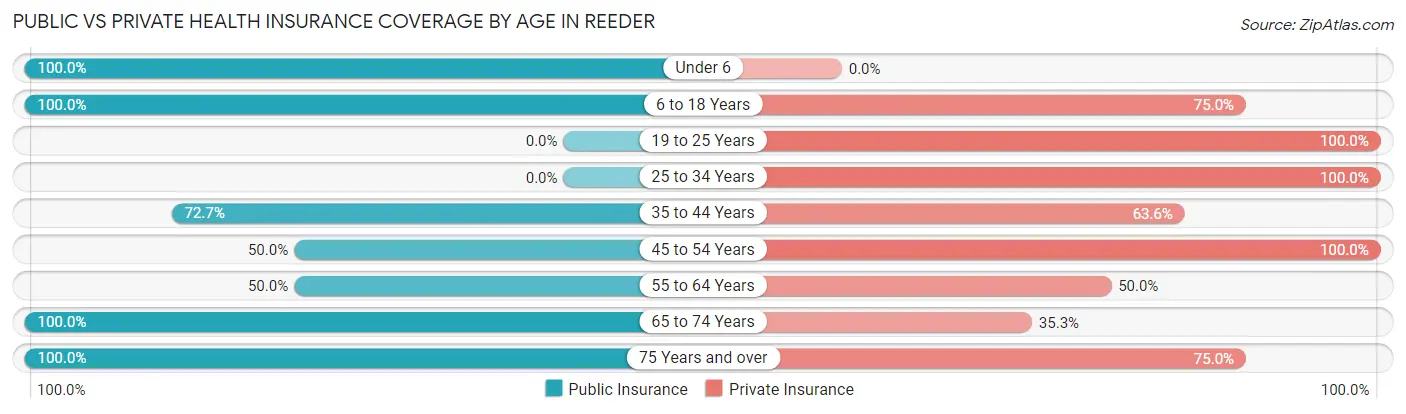
| Age Bracket | Public Insurance | Private Insurance |
| Under 6 | 2 (100.0%) | 0 (0.0%) |
| 6 to 18 Years | 8 (100.0%) | 6 (75.0%) |
| 19 to 25 Years | 0 (0.0%) | 1 (100.0%) |
| 25 to 34 Years | 0 (0.0%) | 3 (100.0%) |
| 35 to 44 Years | 8 (72.7%) | 7 (63.6%) |
| 45 to 54 Years | 7 (50.0%) | 14 (100.0%) |
| 55 to 64 Years | 3 (50.0%) | 3 (50.0%) |
| 65 to 74 Years | 17 (100.0%) | 6 (35.3%) |
| 75 Years and over | 24 (100.0%) | 18 (75.0%) |
| Total | 69 (80.2%) | 58 (67.4%) |
Disability Status by Sex by Age in Reeder
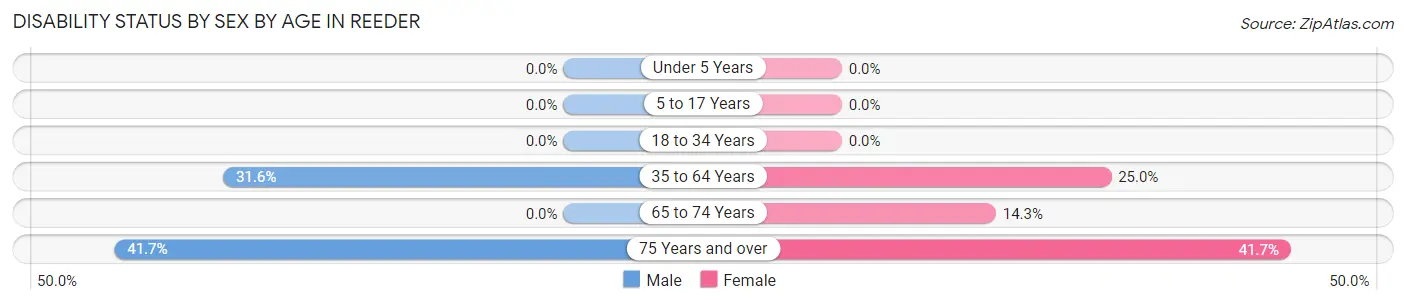
| Age Bracket | Male | Female |
| Under 5 Years | 0 (0.0%) | 0 (0.0%) |
| 5 to 17 Years | 0 (0.0%) | 0 (0.0%) |
| 18 to 34 Years | 0 (0.0%) | 0 (0.0%) |
| 35 to 64 Years | 6 (31.6%) | 3 (25.0%) |
| 65 to 74 Years | 0 (0.0%) | 2 (14.3%) |
| 75 Years and over | 5 (41.7%) | 5 (41.7%) |
Disability Class by Sex by Age in Reeder
Disability Class: Hearing Difficulty
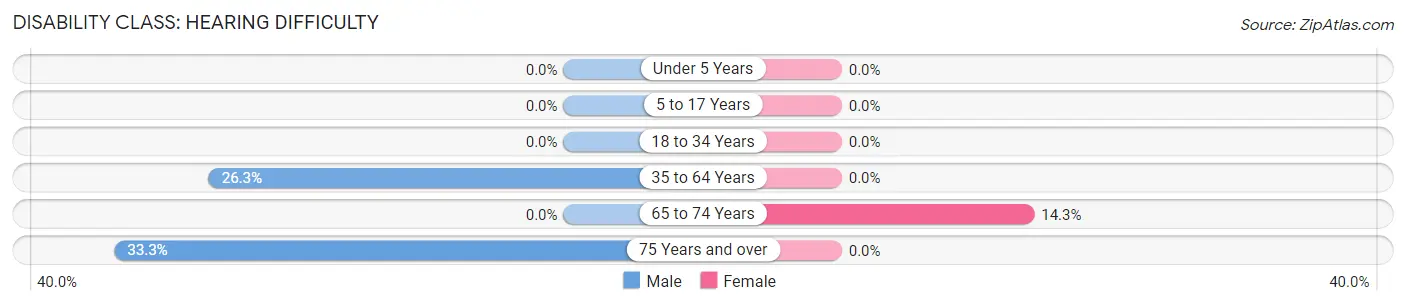
| Age Bracket | Male | Female |
| Under 5 Years | 0 (0.0%) | 0 (0.0%) |
| 5 to 17 Years | 0 (0.0%) | 0 (0.0%) |
| 18 to 34 Years | 0 (0.0%) | 0 (0.0%) |
| 35 to 64 Years | 5 (26.3%) | 0 (0.0%) |
| 65 to 74 Years | 0 (0.0%) | 2 (14.3%) |
| 75 Years and over | 4 (33.3%) | 0 (0.0%) |
Disability Class: Vision Difficulty
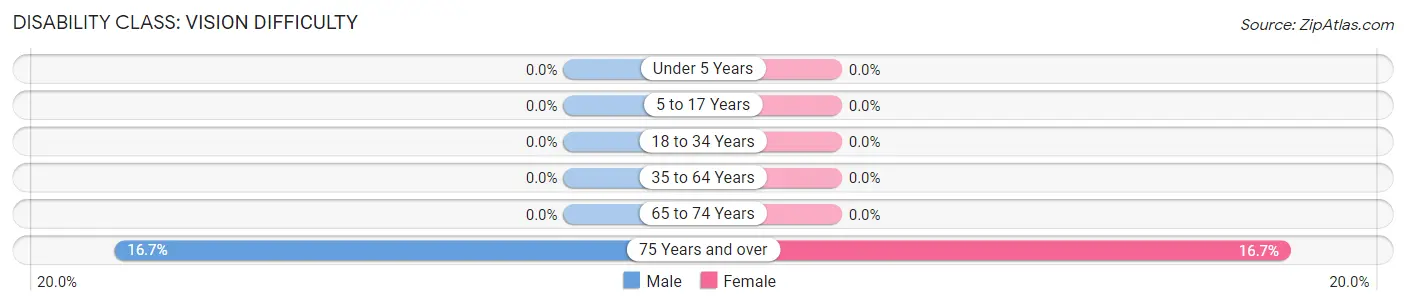
| Age Bracket | Male | Female |
| Under 5 Years | 0 (0.0%) | 0 (0.0%) |
| 5 to 17 Years | 0 (0.0%) | 0 (0.0%) |
| 18 to 34 Years | 0 (0.0%) | 0 (0.0%) |
| 35 to 64 Years | 0 (0.0%) | 0 (0.0%) |
| 65 to 74 Years | 0 (0.0%) | 0 (0.0%) |
| 75 Years and over | 2 (16.7%) | 2 (16.7%) |
Disability Class: Cognitive Difficulty
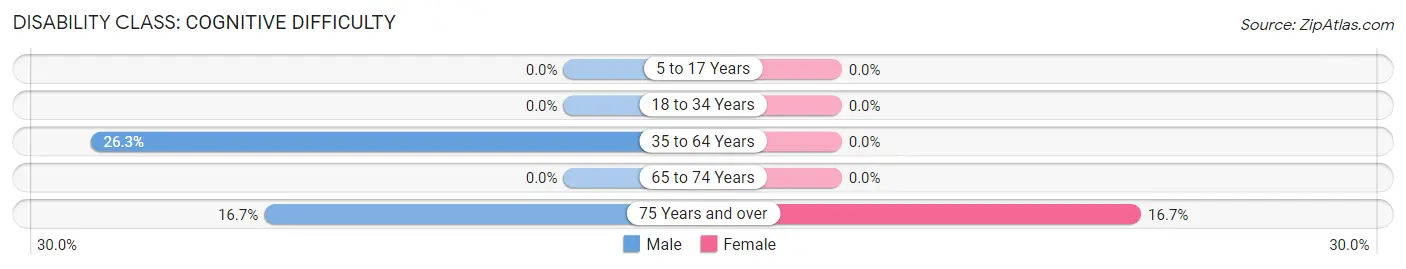
| Age Bracket | Male | Female |
| 5 to 17 Years | 0 (0.0%) | 0 (0.0%) |
| 18 to 34 Years | 0 (0.0%) | 0 (0.0%) |
| 35 to 64 Years | 5 (26.3%) | 0 (0.0%) |
| 65 to 74 Years | 0 (0.0%) | 0 (0.0%) |
| 75 Years and over | 2 (16.7%) | 2 (16.7%) |
Disability Class: Ambulatory Difficulty
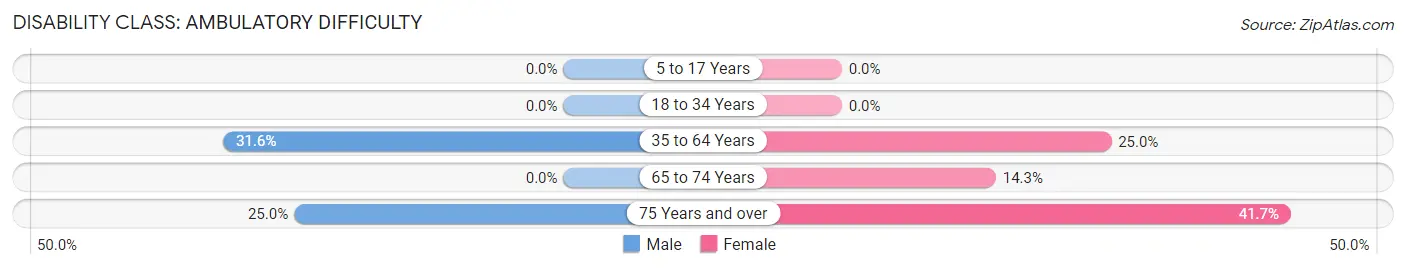
| Age Bracket | Male | Female |
| 5 to 17 Years | 0 (0.0%) | 0 (0.0%) |
| 18 to 34 Years | 0 (0.0%) | 0 (0.0%) |
| 35 to 64 Years | 6 (31.6%) | 3 (25.0%) |
| 65 to 74 Years | 0 (0.0%) | 2 (14.3%) |
| 75 Years and over | 3 (25.0%) | 5 (41.7%) |
Disability Class: Self-Care Difficulty
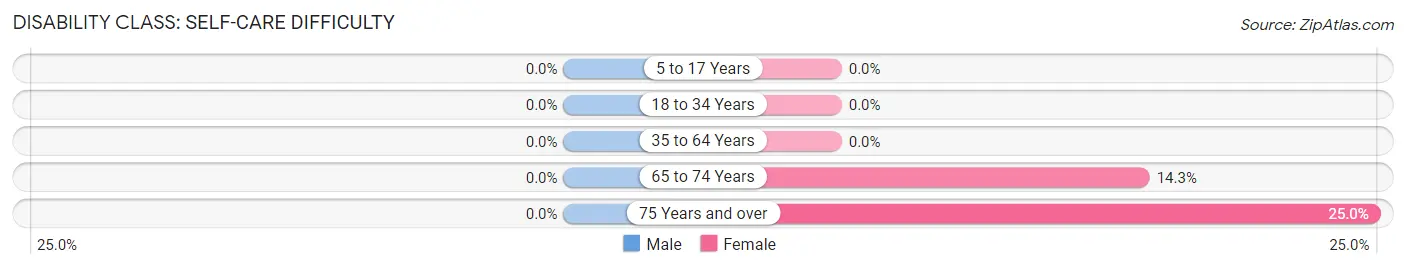
| Age Bracket | Male | Female |
| 5 to 17 Years | 0 (0.0%) | 0 (0.0%) |
| 18 to 34 Years | 0 (0.0%) | 0 (0.0%) |
| 35 to 64 Years | 0 (0.0%) | 0 (0.0%) |
| 65 to 74 Years | 0 (0.0%) | 2 (14.3%) |
| 75 Years and over | 0 (0.0%) | 3 (25.0%) |
Technology Access in Reeder
Computing Device Access in Reeder
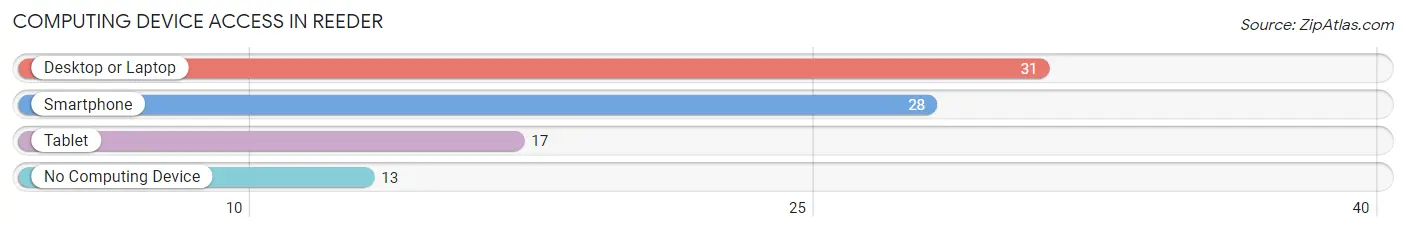
| Device Type | # Households | % Households |
| Desktop or Laptop | 31 | 67.4% |
| Smartphone | 28 | 60.9% |
| Tablet | 17 | 37.0% |
| No Computing Device | 13 | 28.3% |
| Total | 46 | 100.0% |
Internet Access in Reeder
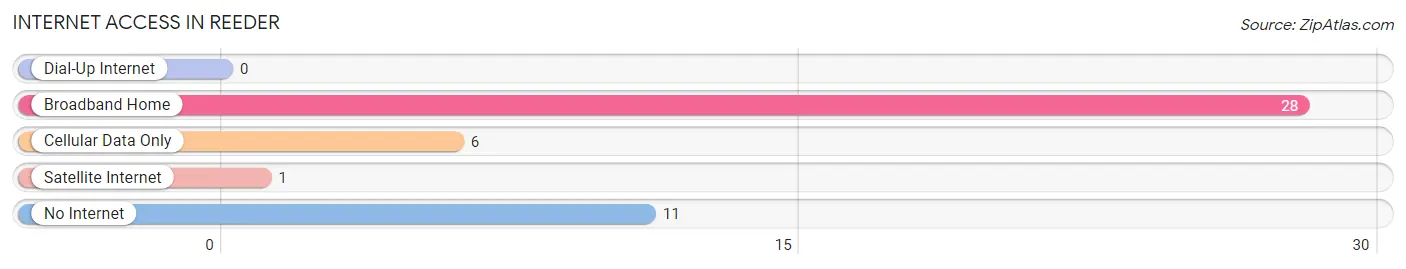
| Internet Type | # Households | % Households |
| Dial-Up Internet | 0 | 0.0% |
| Broadband Home | 28 | 60.9% |
| Cellular Data Only | 6 | 13.0% |
| Satellite Internet | 1 | 2.2% |
| No Internet | 11 | 23.9% |
| Total | 46 | 100.0% |
Reeder Summary
Reeder is a small town located in the southwestern corner of North Dakota. It is situated in the heart of the Badlands, a region of rugged terrain and sparse vegetation. The town has a population of just over 500 people and is the county seat of Grant County.
Reeder was founded in 1883 by a group of homesteaders who were attracted to the area by its rich soil and abundant wildlife. The town was named after the Reeder family, who were among the first settlers. The town quickly grew and by the turn of the century, it had become a bustling center of commerce and industry.
Reeder’s economy is largely based on agriculture. The town is surrounded by vast tracts of farmland, and the majority of its residents are involved in farming and ranching. The town also has a small manufacturing sector, which produces a variety of products, including furniture, clothing, and food products.
The town is served by a number of small businesses, including a grocery store, a hardware store, and a few restaurants. There is also a small airport located just outside of town.
Reeder is home to a number of historic sites, including the Reeder Homestead, which was built in 1883 and is now a museum. The town also has a number of churches, including the First Presbyterian Church, which was built in 1885.
The town is served by the Grant County School District, which includes two elementary schools, a middle school, and a high school. The town also has a public library and a community center.
Reeder has a semi-arid climate, with hot summers and cold winters. The average temperature in the summer is around 80 degrees Fahrenheit, while in the winter it is around 20 degrees Fahrenheit. The town receives an average of 16 inches of precipitation each year.
Reeder is a small, rural town with a rich history and a strong sense of community. Its residents are proud of their town and its heritage, and they are committed to preserving its unique character.
Common Questions
What is Per Capita Income in Reeder?
Per Capita income in Reeder is $26,340.
What is the Median Family Income in Reeder?
Median Family Income in Reeder is $38,750.
What is the Median Household income in Reeder?
Median Household Income in Reeder is $33,750.
What is Inequality or Gini Index in Reeder?
Inequality or Gini Index in Reeder is 0.44.
What is the Total Population of Reeder?
Total Population of Reeder is 86.
What is the Total Male Population of Reeder?
Total Male Population of Reeder is 43.
What is the Total Female Population of Reeder?
Total Female Population of Reeder is 43.
What is the Ratio of Males per 100 Females in Reeder?
There are 100.00 Males per 100 Females in Reeder.
What is the Ratio of Females per 100 Males in Reeder?
There are 100.00 Females per 100 Males in Reeder.
What is the Median Population Age in Reeder?
Median Population Age in Reeder is 62.5 Years.
What is the Average Family Size in Reeder
Average Family Size in Reeder is 2.5 People.
What is the Average Household Size in Reeder
Average Household Size in Reeder is 1.9 People.
How Large is the Labor Force in Reeder?
There are 26 People in the Labor Forcein in Reeder.
What is the Percentage of People in the Labor Force in Reeder?
32.9% of People are in the Labor Force in Reeder.