Jud, ND Map & Demographics
Jud Map
Jud Overview
$32,057
PER CAPITA INCOME
$93,125
AVG FAMILY INCOME
$69,583
AVG HOUSEHOLD INCOME
0.35
INEQUALITY / GINI INDEX
47
TOTAL POPULATION
20
MALE POPULATION
27
FEMALE POPULATION
74.07
MALES / 100 FEMALES
135.00
FEMALES / 100 MALES
54.9
MEDIAN AGE
2.1
AVG FAMILY SIZE
1.7
AVG HOUSEHOLD SIZE
21
LABOR FORCE [ PEOPLE ]
50.0%
PERCENT IN LABOR FORCE
Jud Zip Codes
Jud Area Codes
Income in Jud
Income Overview in Jud
Per Capita Income in Jud is $32,057, while median incomes of families and households are $93,125 and $69,583 respectively.
| Characteristic | Number | Measure |
| Per Capita Income | 47 | $32,057 |
| Median Family Income | 16 | $93,125 |
| Mean Family Income | 16 | $83,406 |
| Median Household Income | 25 | $69,583 |
| Mean Household Income | 25 | $61,672 |
| Income Deficit | 16 | $0 |
| Wage / Income Gap (%) | 47 | 0.00% |
| Wage / Income Gap ($) | 47 | 100.00¢ per $1 |
| Gini / Inequality Index | 47 | 0.35 |
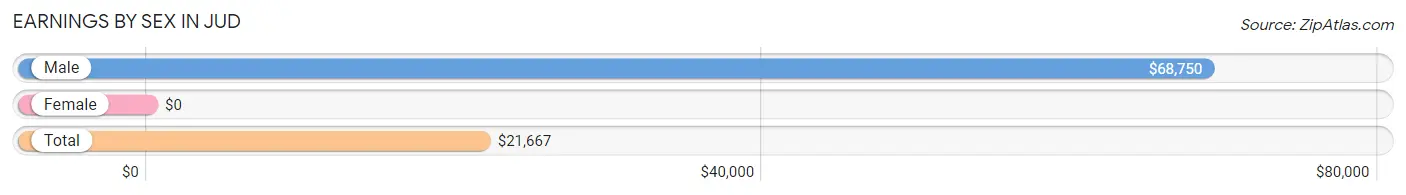
Earnings by Sex in Jud
| Sex | Number | Average Earnings |
| Male | 14 (53.8%) | $68,750 |
| Female | 12 (46.2%) | $0 |
| Total | 26 (100.0%) | $21,667 |
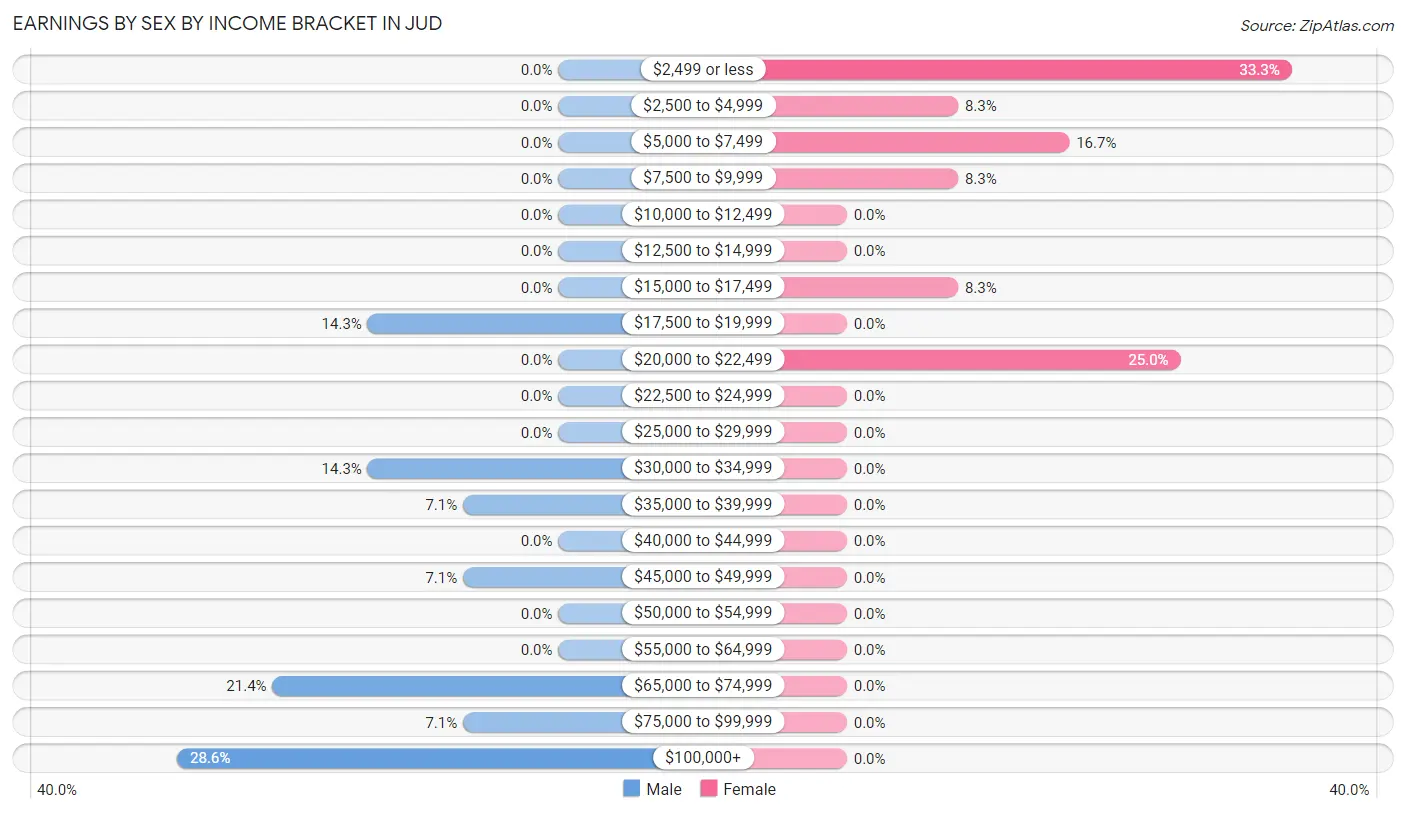
Earnings by Sex by Income Bracket in Jud
The most common earnings brackets in Jud are $100,000+ for men (4 | 28.6%) and $2,499 or less for women (4 | 33.3%).
| Income | Male | Female |
| $2,499 or less | 0 (0.0%) | 4 (33.3%) |
| $2,500 to $4,999 | 0 (0.0%) | 1 (8.3%) |
| $5,000 to $7,499 | 0 (0.0%) | 2 (16.7%) |
| $7,500 to $9,999 | 0 (0.0%) | 1 (8.3%) |
| $10,000 to $12,499 | 0 (0.0%) | 0 (0.0%) |
| $12,500 to $14,999 | 0 (0.0%) | 0 (0.0%) |
| $15,000 to $17,499 | 0 (0.0%) | 1 (8.3%) |
| $17,500 to $19,999 | 2 (14.3%) | 0 (0.0%) |
| $20,000 to $22,499 | 0 (0.0%) | 3 (25.0%) |
| $22,500 to $24,999 | 0 (0.0%) | 0 (0.0%) |
| $25,000 to $29,999 | 0 (0.0%) | 0 (0.0%) |
| $30,000 to $34,999 | 2 (14.3%) | 0 (0.0%) |
| $35,000 to $39,999 | 1 (7.1%) | 0 (0.0%) |
| $40,000 to $44,999 | 0 (0.0%) | 0 (0.0%) |
| $45,000 to $49,999 | 1 (7.1%) | 0 (0.0%) |
| $50,000 to $54,999 | 0 (0.0%) | 0 (0.0%) |
| $55,000 to $64,999 | 0 (0.0%) | 0 (0.0%) |
| $65,000 to $74,999 | 3 (21.4%) | 0 (0.0%) |
| $75,000 to $99,999 | 1 (7.1%) | 0 (0.0%) |
| $100,000+ | 4 (28.6%) | 0 (0.0%) |
| Total | 14 (100.0%) | 12 (100.0%) |
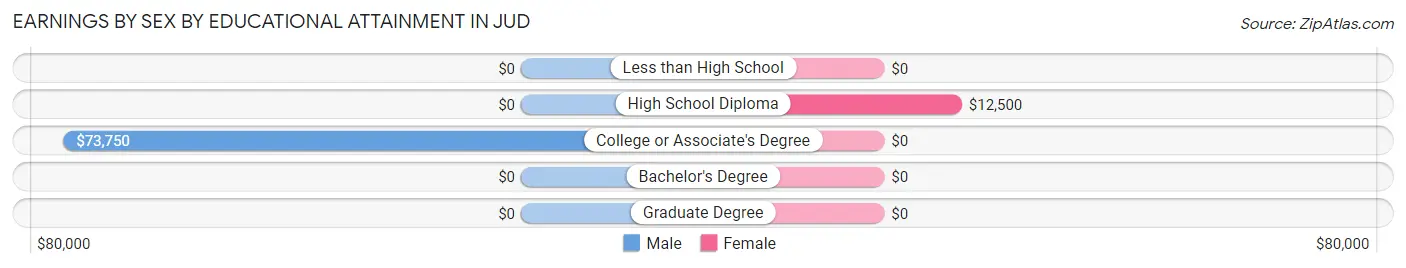
Earnings by Sex by Educational Attainment in Jud
| Educational Attainment | Male Income | Female Income |
| Less than High School | - | - |
| High School Diploma | - | - |
| College or Associate's Degree | $73,750 | $0 |
| Bachelor's Degree | - | - |
| Graduate Degree | - | - |
| Total | $68,750 | $0 |
Family Income in Jud
Family Income Brackets in Jud
According to the Jud family income data, there are 7 families falling into the $75,000 to $99,999 income range, which is the most common income bracket and makes up 43.8% of all families.
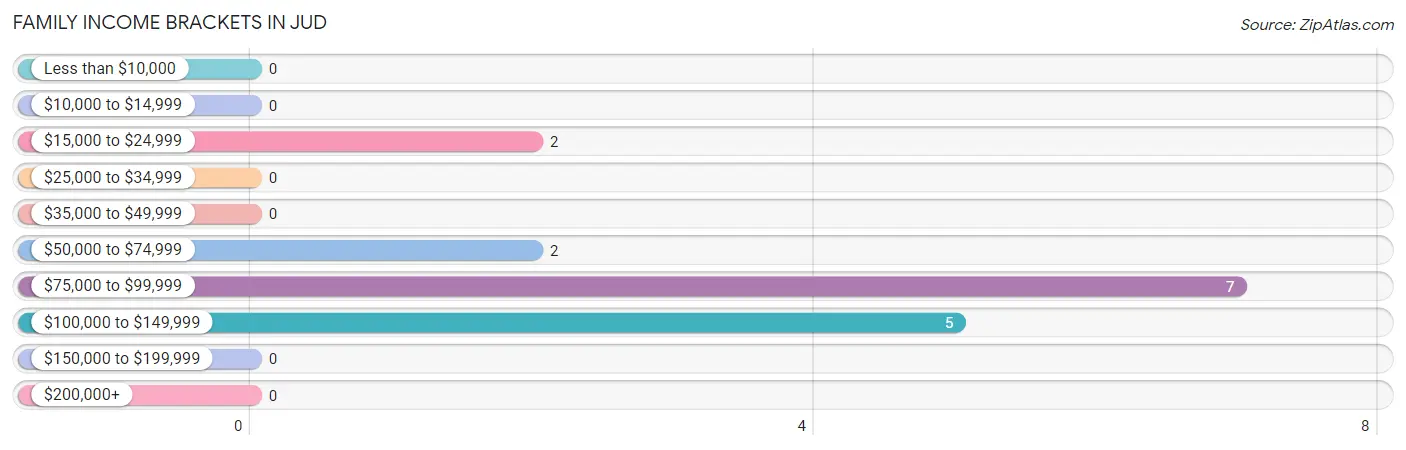
| Income Bracket | # Families | % Families |
| Less than $10,000 | 0 | 0.0% |
| $10,000 to $14,999 | 0 | 0.0% |
| $15,000 to $24,999 | 2 | 12.5% |
| $25,000 to $34,999 | 0 | 0.0% |
| $35,000 to $49,999 | 0 | 0.0% |
| $50,000 to $74,999 | 2 | 12.5% |
| $75,000 to $99,999 | 7 | 43.8% |
| $100,000 to $149,999 | 5 | 31.3% |
| $150,000 to $199,999 | 0 | 0.0% |
| $200,000+ | 0 | 0.0% |
Family Income by Famaliy Size in Jud
2-person families (14 | 87.5%) account for the highest median family income in Jud with $93,750 per family, while 2-person families (14 | 87.5%) have the highest median income of $46,875 per family member.
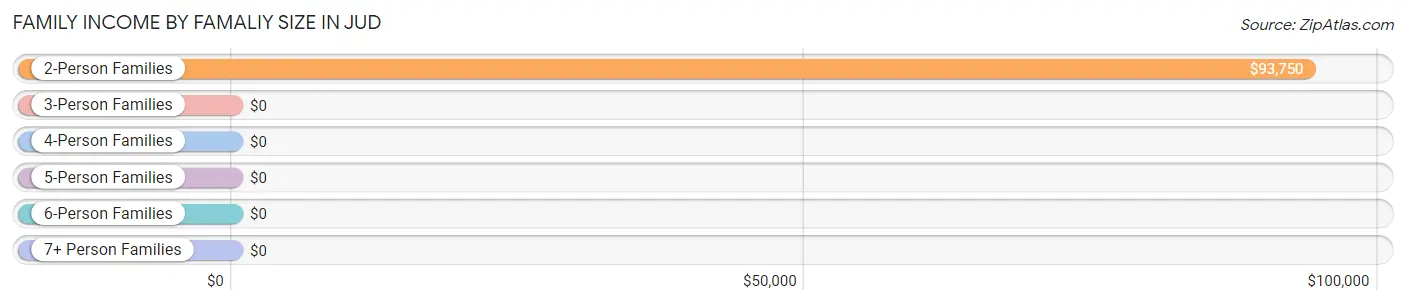
| Income Bracket | # Families | Median Income |
| 2-Person Families | 14 (87.5%) | $93,750 |
| 3-Person Families | 2 (12.5%) | $0 |
| 4-Person Families | 0 (0.0%) | $0 |
| 5-Person Families | 0 (0.0%) | $0 |
| 6-Person Families | 0 (0.0%) | $0 |
| 7+ Person Families | 0 (0.0%) | $0 |
| Total | 16 (100.0%) | $93,125 |
Family Income by Number of Earners in Jud
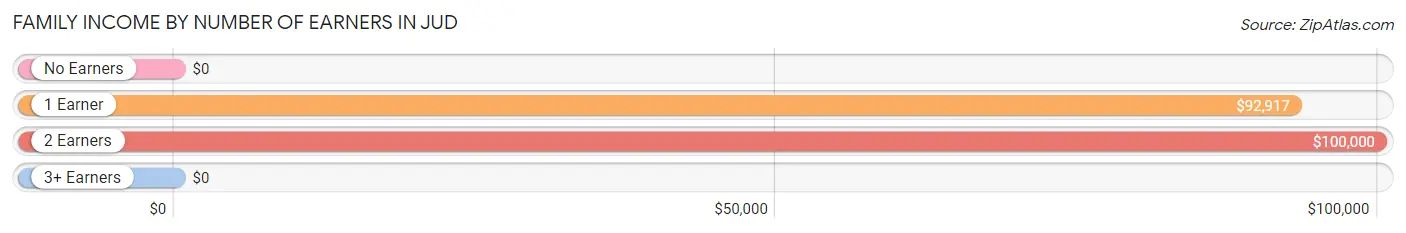
| Number of Earners | # Families | Median Income |
| No Earners | 1 (6.2%) | $0 |
| 1 Earner | 7 (43.8%) | $92,917 |
| 2 Earners | 8 (50.0%) | $100,000 |
| 3+ Earners | 0 (0.0%) | $0 |
| Total | 16 (100.0%) | $93,125 |
Household Income in Jud
Household Income Brackets in Jud
With 7 households falling in the category, the $75,000 to $99,999 income range is the most frequent in Jud, accounting for 28.0% of all households.
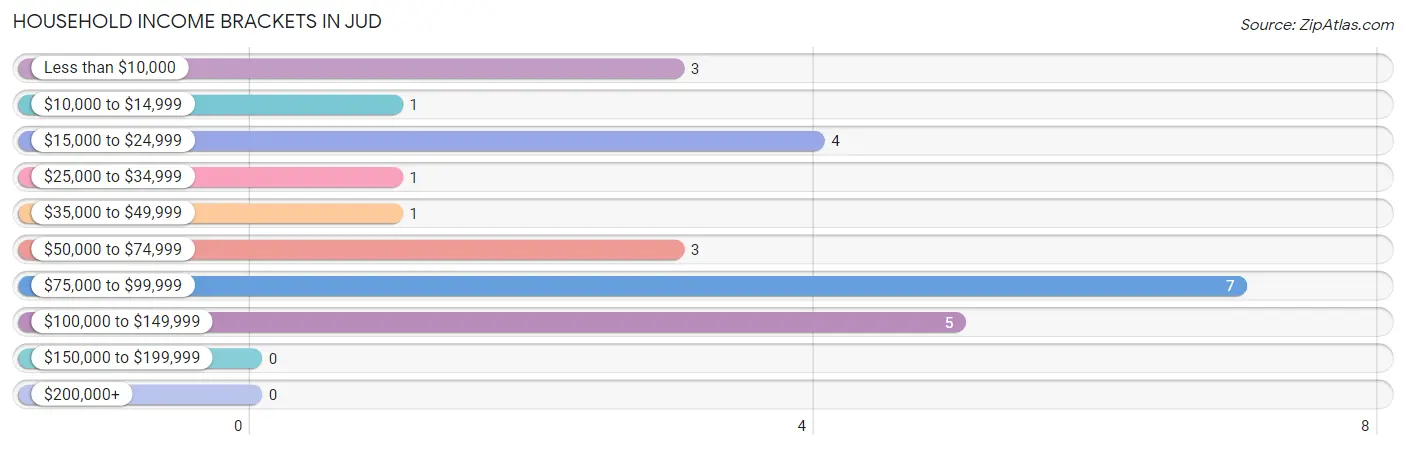
| Income Bracket | # Households | % Households |
| Less than $10,000 | 3 | 12.0% |
| $10,000 to $14,999 | 1 | 4.0% |
| $15,000 to $24,999 | 4 | 16.0% |
| $25,000 to $34,999 | 1 | 4.0% |
| $35,000 to $49,999 | 1 | 4.0% |
| $50,000 to $74,999 | 3 | 12.0% |
| $75,000 to $99,999 | 7 | 28.0% |
| $100,000 to $149,999 | 5 | 20.0% |
| $150,000 to $199,999 | 0 | 0.0% |
| $200,000+ | 0 | 0.0% |
Household Income by Householder Age in Jud
The median household income in Jud is $69,583, with the highest median household income of $93,750 found in the 45 to 64 years age bracket for the primary householder. A total of 9 households (36.0%) fall into this category.
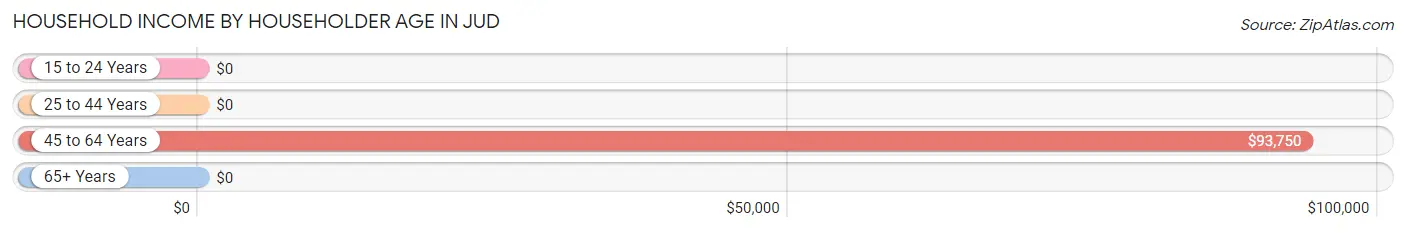
| Income Bracket | # Households | Median Income |
| 15 to 24 Years | 0 (0.0%) | $0 |
| 25 to 44 Years | 4 (16.0%) | $0 |
| 45 to 64 Years | 9 (36.0%) | $93,750 |
| 65+ Years | 12 (48.0%) | $0 |
| Total | 25 (100.0%) | $69,583 |
Poverty in Jud
Income Below Poverty by Sex and Age in Jud
With 11.1% poverty level for males and 20.0% for females among the residents of Jud, under 5 year old males and 75 year old and over females are the most vulnerable to poverty, with 2 males (100.0%) and 4 females (66.7%) in their respective age groups living below the poverty level.
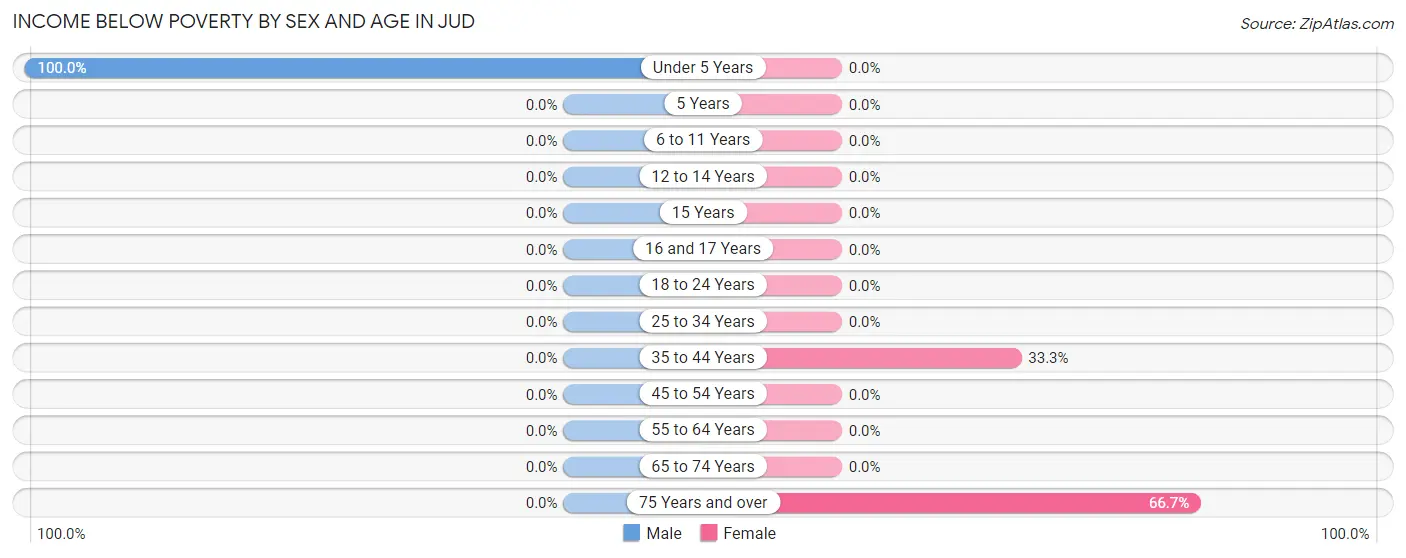
| Age Bracket | Male | Female |
| Under 5 Years | 2 (100.0%) | 0 (0.0%) |
| 5 Years | 0 (0.0%) | 0 (0.0%) |
| 6 to 11 Years | 0 (0.0%) | 0 (0.0%) |
| 12 to 14 Years | 0 (0.0%) | 0 (0.0%) |
| 15 Years | 0 (0.0%) | 0 (0.0%) |
| 16 and 17 Years | 0 (0.0%) | 0 (0.0%) |
| 18 to 24 Years | 0 (0.0%) | 0 (0.0%) |
| 25 to 34 Years | 0 (0.0%) | 0 (0.0%) |
| 35 to 44 Years | 0 (0.0%) | 1 (33.3%) |
| 45 to 54 Years | 0 (0.0%) | 0 (0.0%) |
| 55 to 64 Years | 0 (0.0%) | 0 (0.0%) |
| 65 to 74 Years | 0 (0.0%) | 0 (0.0%) |
| 75 Years and over | 0 (0.0%) | 4 (66.7%) |
| Total | 2 (11.1%) | 5 (20.0%) |
Income Above Poverty by Sex and Age in Jud
According to the poverty statistics in Jud, males aged 25 to 34 years and females aged 12 to 14 years are the age groups that are most secure financially, with 100.0% of males and 100.0% of females in these age groups living above the poverty line.
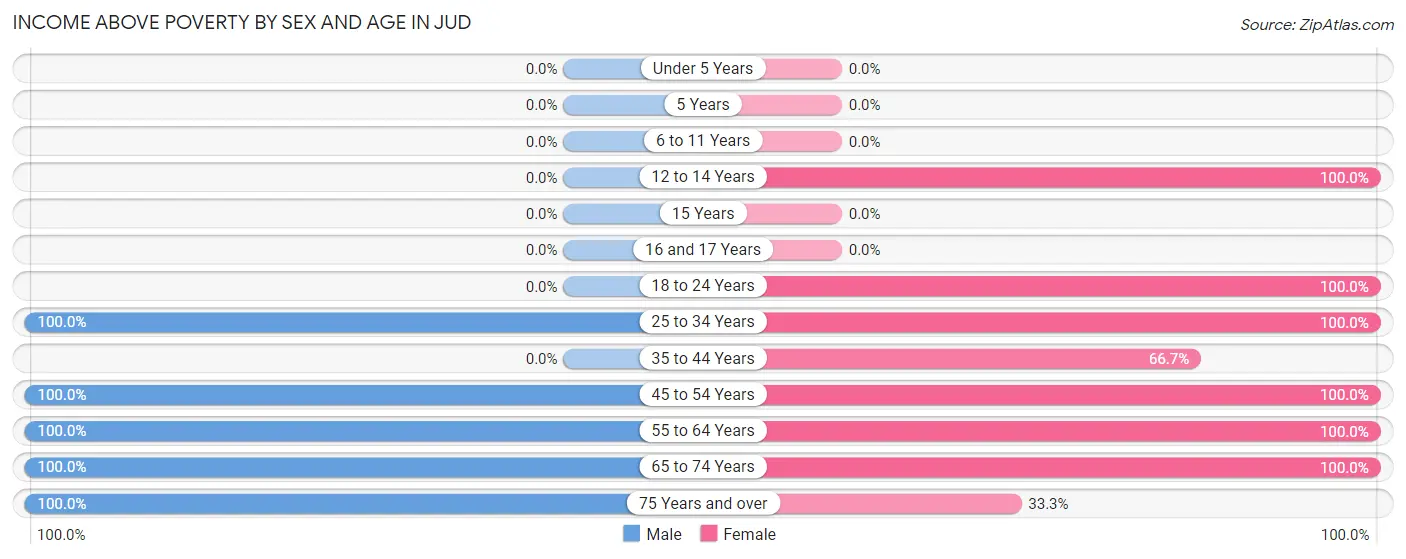
| Age Bracket | Male | Female |
| Under 5 Years | 0 (0.0%) | 0 (0.0%) |
| 5 Years | 0 (0.0%) | 0 (0.0%) |
| 6 to 11 Years | 0 (0.0%) | 0 (0.0%) |
| 12 to 14 Years | 0 (0.0%) | 2 (100.0%) |
| 15 Years | 0 (0.0%) | 0 (0.0%) |
| 16 and 17 Years | 0 (0.0%) | 0 (0.0%) |
| 18 to 24 Years | 0 (0.0%) | 1 (100.0%) |
| 25 to 34 Years | 1 (100.0%) | 2 (100.0%) |
| 35 to 44 Years | 0 (0.0%) | 2 (66.7%) |
| 45 to 54 Years | 5 (100.0%) | 4 (100.0%) |
| 55 to 64 Years | 4 (100.0%) | 2 (100.0%) |
| 65 to 74 Years | 5 (100.0%) | 5 (100.0%) |
| 75 Years and over | 1 (100.0%) | 2 (33.3%) |
| Total | 16 (88.9%) | 20 (80.0%) |
Income Below Poverty Among Married-Couple Families in Jud
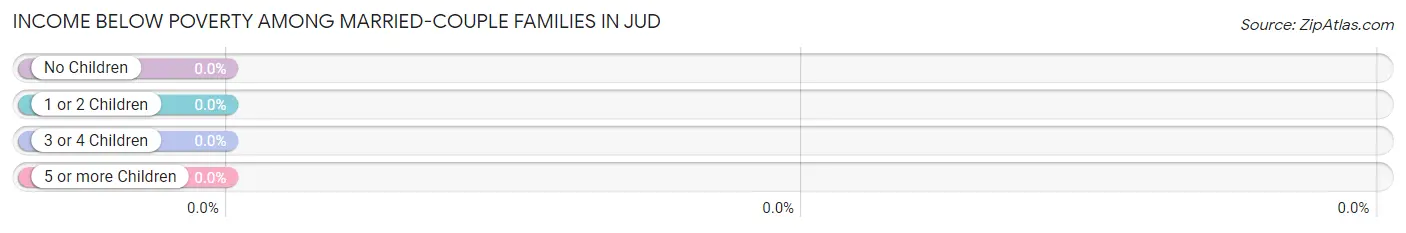
| Children | Above Poverty | Below Poverty |
| No Children | 13 (100.0%) | 0 (0.0%) |
| 1 or 2 Children | 2 (100.0%) | 0 (0.0%) |
| 3 or 4 Children | 0 (0.0%) | 0 (0.0%) |
| 5 or more Children | 0 (0.0%) | 0 (0.0%) |
| Total | 15 (100.0%) | 0 (0.0%) |
Income Below Poverty Among Single-Parent Households in Jud
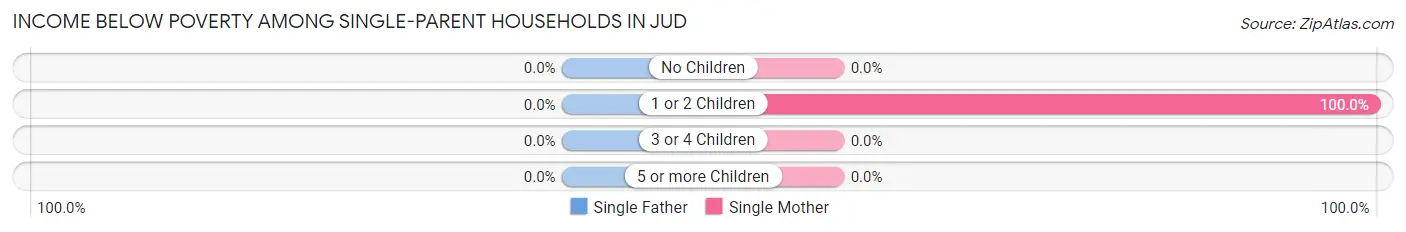
| Children | Single Father | Single Mother |
| No Children | 0 (0.0%) | 0 (0.0%) |
| 1 or 2 Children | 0 (0.0%) | 1 (100.0%) |
| 3 or 4 Children | 0 (0.0%) | 0 (0.0%) |
| 5 or more Children | 0 (0.0%) | 0 (0.0%) |
| Total | 0 (0.0%) | 1 (100.0%) |
Income Below Poverty Among Married-Couple vs Single-Parent Households in Jud
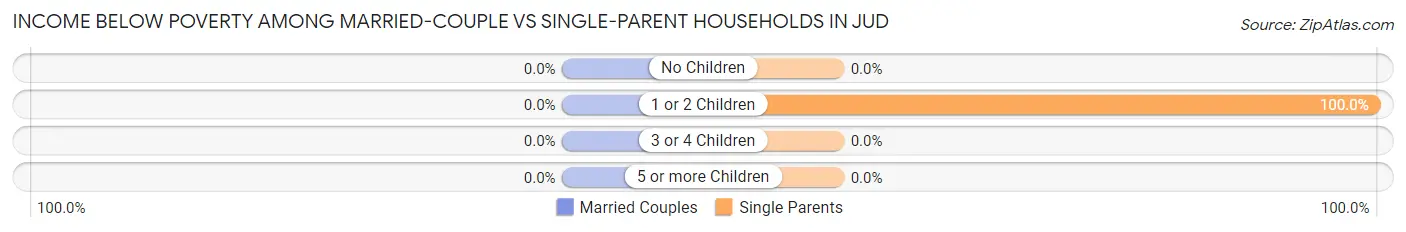
| Children | Married-Couple Families | Single-Parent Households |
| No Children | 0 (0.0%) | 0 (0.0%) |
| 1 or 2 Children | 0 (0.0%) | 1 (100.0%) |
| 3 or 4 Children | 0 (0.0%) | 0 (0.0%) |
| 5 or more Children | 0 (0.0%) | 0 (0.0%) |
| Total | 0 (0.0%) | 1 (100.0%) |
Race in Jud
The most populous races in Jud are White / Caucasian (45 | 95.7%), Hispanic or Latino (4 | 8.5%), and Native / Alaskan (2 | 4.3%).
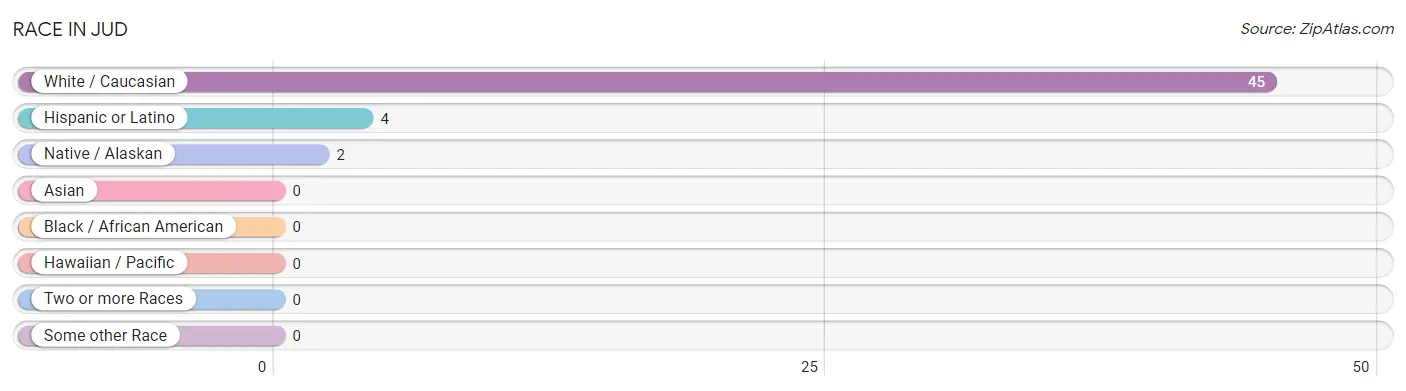
| Race | # Population | % Population |
| Asian | 0 | 0.0% |
| Black / African American | 0 | 0.0% |
| Hawaiian / Pacific | 0 | 0.0% |
| Hispanic or Latino | 4 | 8.5% |
| Native / Alaskan | 2 | 4.3% |
| White / Caucasian | 45 | 95.7% |
| Two or more Races | 0 | 0.0% |
| Some other Race | 0 | 0.0% |
| Total | 47 | 100.0% |
Ancestry in Jud
The most populous ancestries reported in Jud are German (20 | 42.5%), Colombian (4 | 8.5%), South American (4 | 8.5%), American (3 | 6.4%), and English (2 | 4.3%), together accounting for 70.2% of all Jud residents.
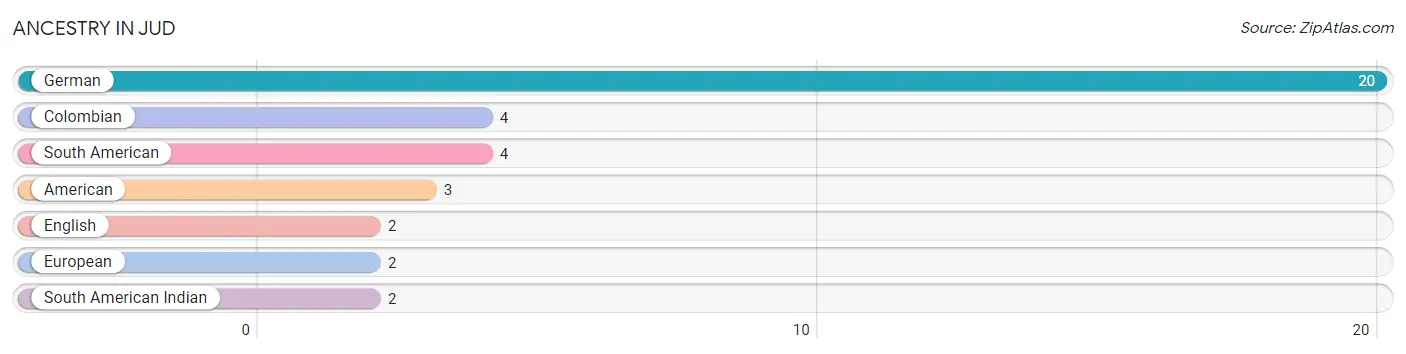
| Ancestry | # Population | % Population |
| American | 3 | 6.4% |
| Colombian | 4 | 8.5% |
| English | 2 | 4.3% |
| European | 2 | 4.3% |
| German | 20 | 42.5% |
| South American | 4 | 8.5% |
| South American Indian | 2 | 4.3% | View All 7 Rows |
Immigrants in Jud
The most numerous immigrant groups reported in Jud came from Colombia (2 | 4.3%), Latin America (2 | 4.3%), and South America (2 | 4.3%), together accounting for 12.8% of all Jud residents.

| Immigration Origin | # Population | % Population |
| Colombia | 2 | 4.3% |
| Latin America | 2 | 4.3% |
| South America | 2 | 4.3% | View All 3 Rows |
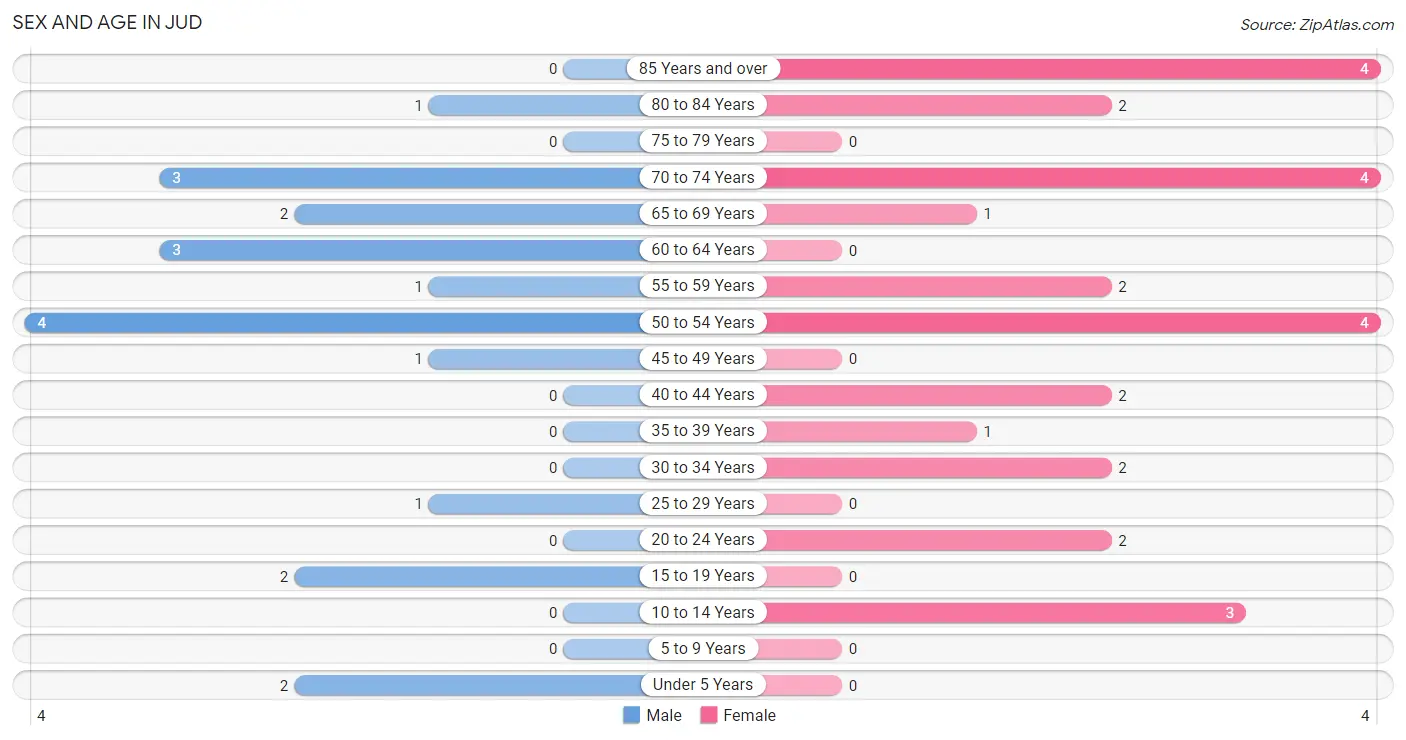
Sex and Age in Jud
Sex and Age in Jud
The most populous age groups in Jud are 50 to 54 Years (4 | 20.0%) for men and 50 to 54 Years (4 | 14.8%) for women.
| Age Bracket | Male | Female |
| Under 5 Years | 2 (10.0%) | 0 (0.0%) |
| 5 to 9 Years | 0 (0.0%) | 0 (0.0%) |
| 10 to 14 Years | 0 (0.0%) | 3 (11.1%) |
| 15 to 19 Years | 2 (10.0%) | 0 (0.0%) |
| 20 to 24 Years | 0 (0.0%) | 2 (7.4%) |
| 25 to 29 Years | 1 (5.0%) | 0 (0.0%) |
| 30 to 34 Years | 0 (0.0%) | 2 (7.4%) |
| 35 to 39 Years | 0 (0.0%) | 1 (3.7%) |
| 40 to 44 Years | 0 (0.0%) | 2 (7.4%) |
| 45 to 49 Years | 1 (5.0%) | 0 (0.0%) |
| 50 to 54 Years | 4 (20.0%) | 4 (14.8%) |
| 55 to 59 Years | 1 (5.0%) | 2 (7.4%) |
| 60 to 64 Years | 3 (15.0%) | 0 (0.0%) |
| 65 to 69 Years | 2 (10.0%) | 1 (3.7%) |
| 70 to 74 Years | 3 (15.0%) | 4 (14.8%) |
| 75 to 79 Years | 0 (0.0%) | 0 (0.0%) |
| 80 to 84 Years | 1 (5.0%) | 2 (7.4%) |
| 85 Years and over | 0 (0.0%) | 4 (14.8%) |
| Total | 20 (100.0%) | 27 (100.0%) |
Families and Households in Jud
Median Family Size in Jud
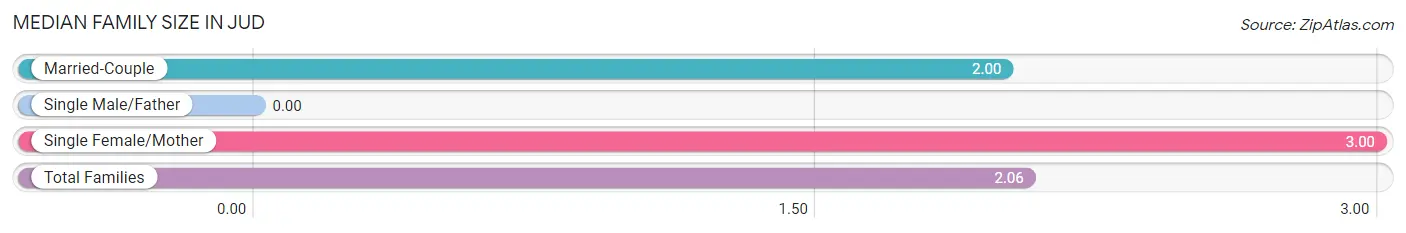
| Family Type | # Families | Family Size |
| Married-Couple | 15 (93.8%) | 2.00 |
| Single Male/Father | 0 (0.0%) | - |
| Single Female/Mother | 1 (6.2%) | 3.00 |
| Total Families | 16 (100.0%) | 2.06 |
Median Household Size in Jud
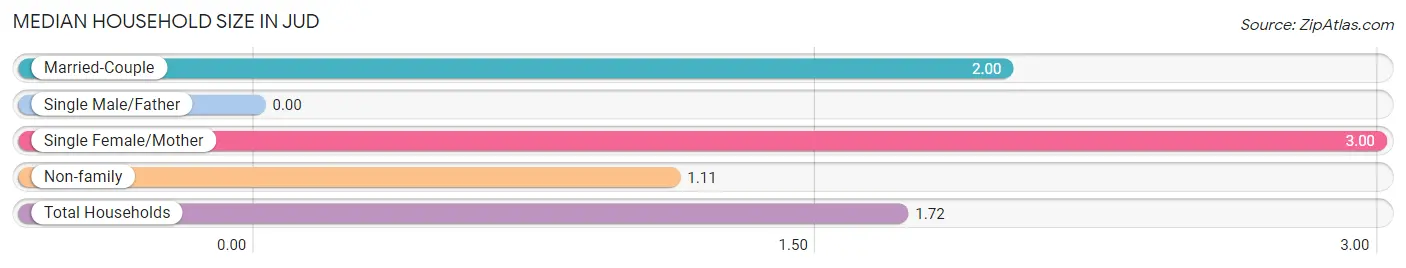
| Household Type | # Households | Household Size |
| Married-Couple | 15 (60.0%) | 2.00 |
| Single Male/Father | 0 (0.0%) | - |
| Single Female/Mother | 1 (4.0%) | 3.00 |
| Non-family | 9 (36.0%) | 1.11 |
| Total Households | 25 (100.0%) | 1.72 |
Household Size by Marriage Status in Jud
Out of a total of 25 households in Jud, 16 (64.0%) are family households, while 9 (36.0%) are nonfamily households. The most numerous type of family households are 2-person households, comprising 14, and the most common type of nonfamily households are 1-person households, comprising 8.
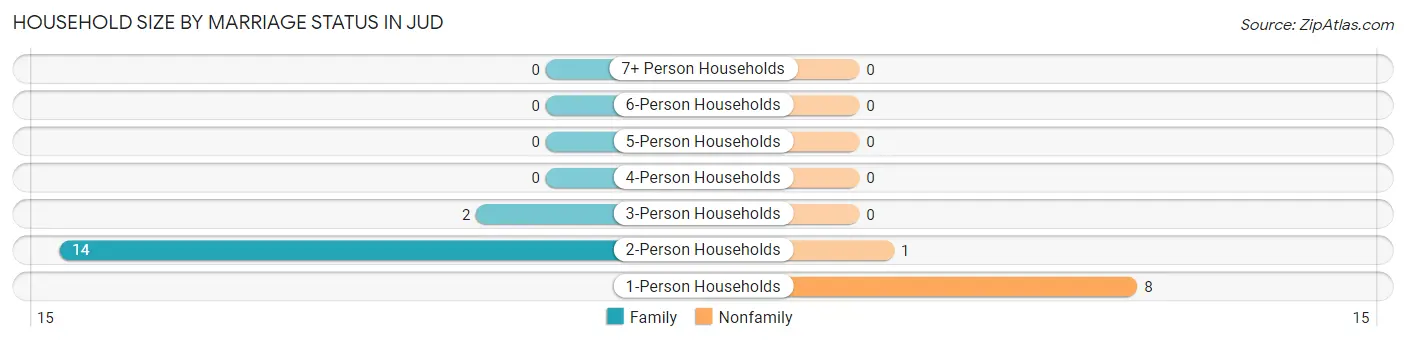
| Household Size | Family Households | Nonfamily Households |
| 1-Person Households | - | 8 (32.0%) |
| 2-Person Households | 14 (56.0%) | 1 (4.0%) |
| 3-Person Households | 2 (8.0%) | 0 (0.0%) |
| 4-Person Households | 0 (0.0%) | 0 (0.0%) |
| 5-Person Households | 0 (0.0%) | 0 (0.0%) |
| 6-Person Households | 0 (0.0%) | 0 (0.0%) |
| 7+ Person Households | 0 (0.0%) | 0 (0.0%) |
| Total | 16 (64.0%) | 9 (36.0%) |
Female Fertility in Jud
Fertility by Age in Jud
| Age Bracket | Women with Births | Births / 1,000 Women |
| 15 to 19 years | 0 (0.0%) | 0.0 |
| 20 to 34 years | 0 (0.0%) | 0.0 |
| 35 to 50 years | 0 (0.0%) | 0.0 |
| Total | 0 (0.0%) | 0.0 |
Fertility by Age by Marriage Status in Jud
| Age Bracket | Married | Unmarried |
| 15 to 19 years | 0 (0.0%) | 0 (0.0%) |
| 20 to 34 years | 0 (0.0%) | 0 (0.0%) |
| 35 to 50 years | 0 (0.0%) | 0 (0.0%) |
| Total | 0 (0.0%) | 0 (0.0%) |
Fertility by Education in Jud
| Educational Attainment | Women with Births | Births / 1,000 Women |
| Less than High School | 0 (0.0%) | 0.0 |
| High School Diploma | 0 (0.0%) | 0.0 |
| College or Associate's Degree | 0 (0.0%) | 0.0 |
| Bachelor's Degree | 0 (0.0%) | 0.0 |
| Graduate Degree | 0 (0.0%) | 0.0 |
| Total | 0 (0.0%) | 0.0 |
Fertility by Education by Marriage Status in Jud
| Educational Attainment | Married | Unmarried |
| Less than High School | 0 (0.0%) | 0 (0.0%) |
| High School Diploma | 0 (0.0%) | 0 (0.0%) |
| College or Associate's Degree | 0 (0.0%) | 0 (0.0%) |
| Bachelor's Degree | 0 (0.0%) | 0 (0.0%) |
| Graduate Degree | 0 (0.0%) | 0 (0.0%) |
| Total | 0 (0.0%) | 0 (0.0%) |
Employment Characteristics in Jud
Employment by Class of Employer in Jud
Among the 21 employed individuals in Jud, private company employees (14 | 66.7%), self-employed (not incorporated) (4 | 19.1%), and not-for-profit organizations (3 | 14.3%) make up the most common classes of employment.
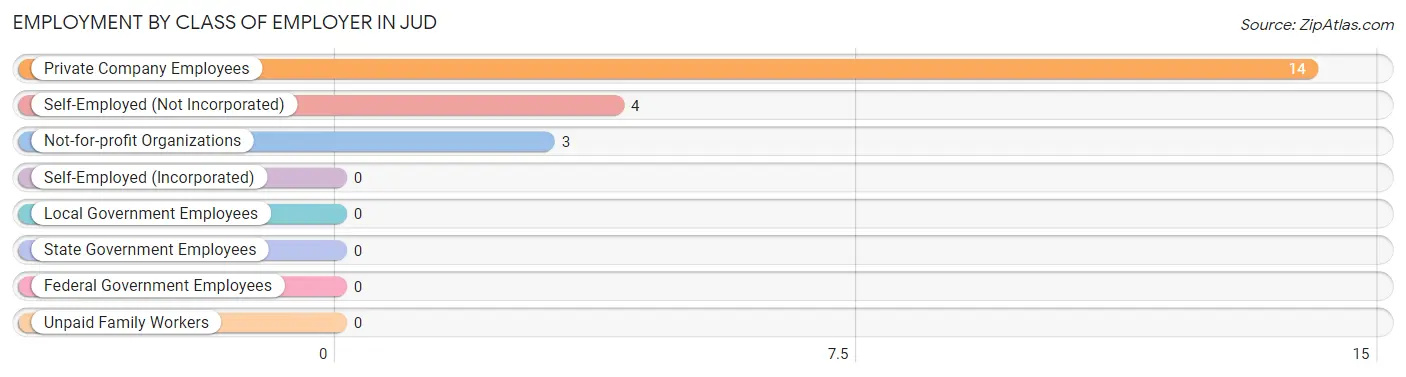
| Employer Class | # Employees | % Employees |
| Private Company Employees | 14 | 66.7% |
| Self-Employed (Incorporated) | 0 | 0.0% |
| Self-Employed (Not Incorporated) | 4 | 19.1% |
| Not-for-profit Organizations | 3 | 14.3% |
| Local Government Employees | 0 | 0.0% |
| State Government Employees | 0 | 0.0% |
| Federal Government Employees | 0 | 0.0% |
| Unpaid Family Workers | 0 | 0.0% |
| Total | 21 | 100.0% |
Employment Status by Age in Jud
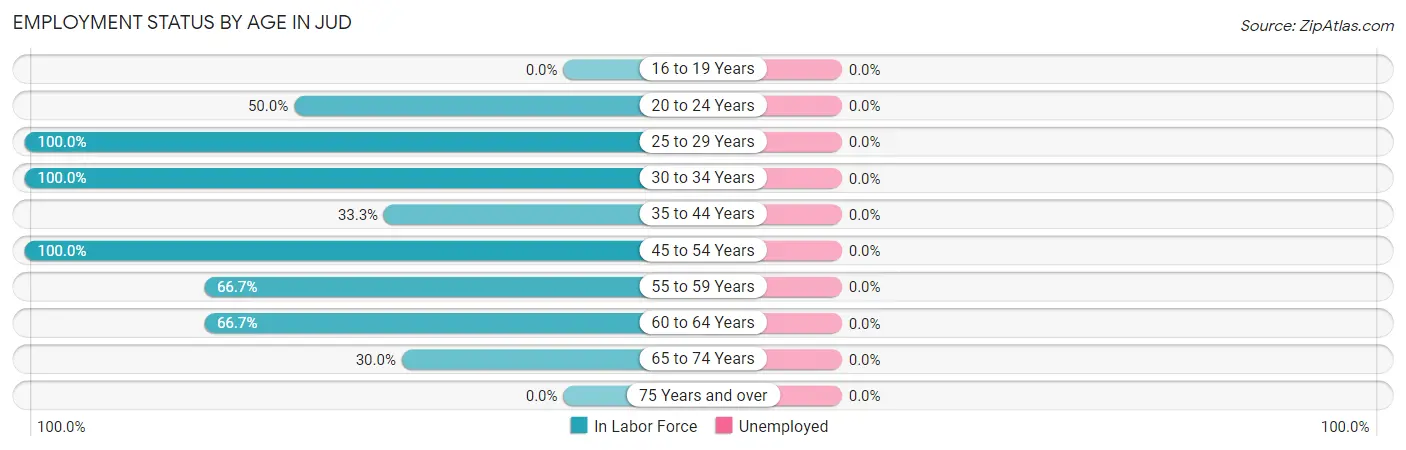
| Age Bracket | In Labor Force | Unemployed |
| 16 to 19 Years | 0 (0.0%) | 0 (0.0%) |
| 20 to 24 Years | 1 (50.0%) | 0 (0.0%) |
| 25 to 29 Years | 1 (100.0%) | 0 (0.0%) |
| 30 to 34 Years | 2 (100.0%) | 0 (0.0%) |
| 35 to 44 Years | 1 (33.3%) | 0 (0.0%) |
| 45 to 54 Years | 9 (100.0%) | 0 (0.0%) |
| 55 to 59 Years | 2 (66.7%) | 0 (0.0%) |
| 60 to 64 Years | 2 (66.7%) | 0 (0.0%) |
| 65 to 74 Years | 3 (30.0%) | 0 (0.0%) |
| 75 Years and over | 0 (0.0%) | 0 (0.0%) |
| Total | 21 (50.0%) | 0 (0.0%) |
Employment Status by Educational Attainment in Jud
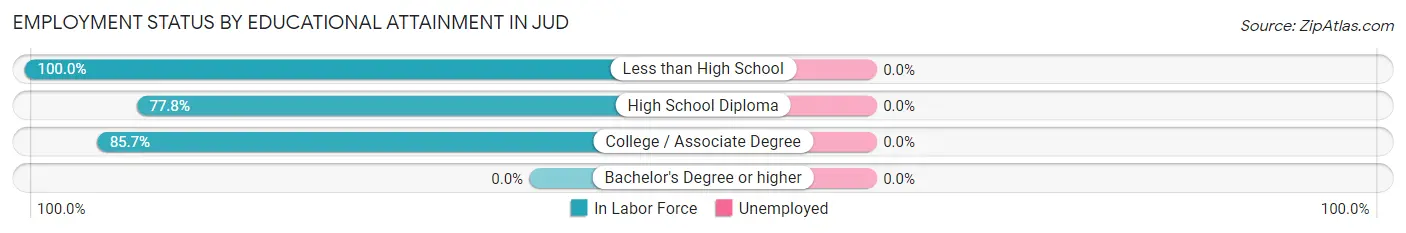
| Educational Attainment | In Labor Force | Unemployed |
| Less than High School | 4 (100.0%) | 0 (0.0%) |
| High School Diploma | 7 (77.8%) | 0 (0.0%) |
| College / Associate Degree | 6 (85.7%) | 0 (0.0%) |
| Bachelor's Degree or higher | 0 (0.0%) | 0 (0.0%) |
| Total | 17 (81.0%) | 0 (0.0%) |
Employment Occupations by Sex in Jud
Management, Business, Science and Arts Occupations
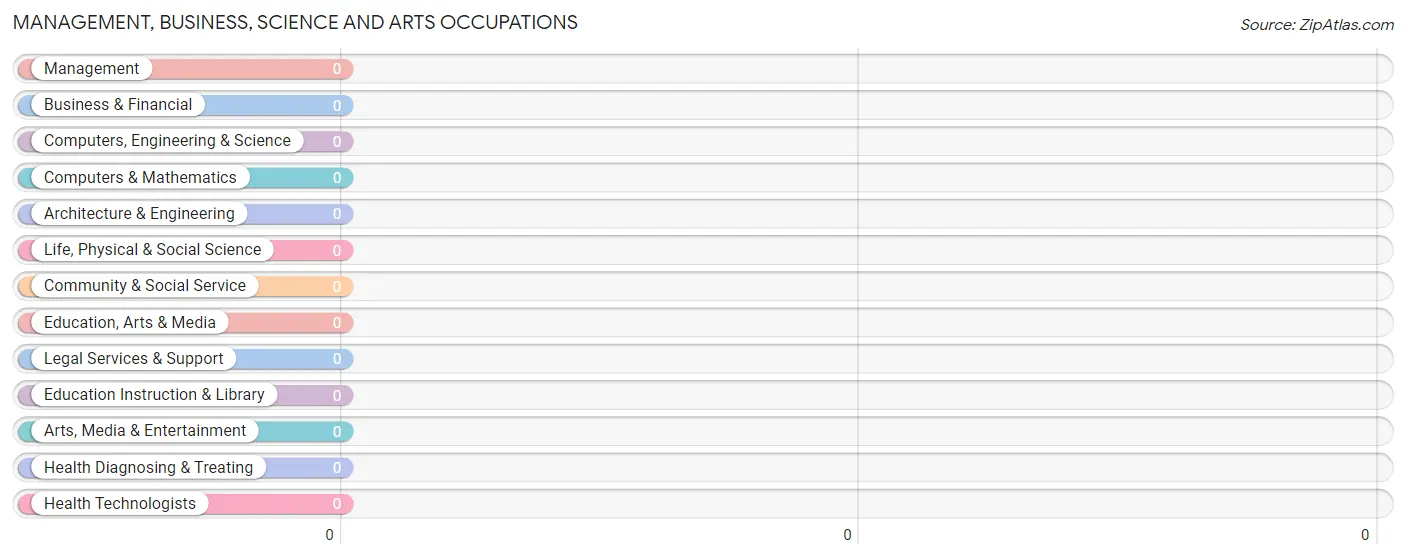
Management, Business, Science and Arts Occupations by Sex
| Occupation | Male | Female |
| Management | 0 (0.0%) | 0 (0.0%) |
| Business & Financial | 0 (0.0%) | 0 (0.0%) |
| Computers, Engineering & Science | 0 (0.0%) | 0 (0.0%) |
| Computers & Mathematics | 0 (0.0%) | 0 (0.0%) |
| Architecture & Engineering | 0 (0.0%) | 0 (0.0%) |
| Life, Physical & Social Science | 0 (0.0%) | 0 (0.0%) |
| Community & Social Service | 0 (0.0%) | 0 (0.0%) |
| Education, Arts & Media | 0 (0.0%) | 0 (0.0%) |
| Legal Services & Support | 0 (0.0%) | 0 (0.0%) |
| Education Instruction & Library | 0 (0.0%) | 0 (0.0%) |
| Arts, Media & Entertainment | 0 (0.0%) | 0 (0.0%) |
| Health Diagnosing & Treating | 0 (0.0%) | 0 (0.0%) |
| Health Technologists | 0 (0.0%) | 0 (0.0%) |
| Total (Category) | 0 (0.0%) | 0 (0.0%) |
| Total (Overall) | 12 (57.1%) | 9 (42.9%) |
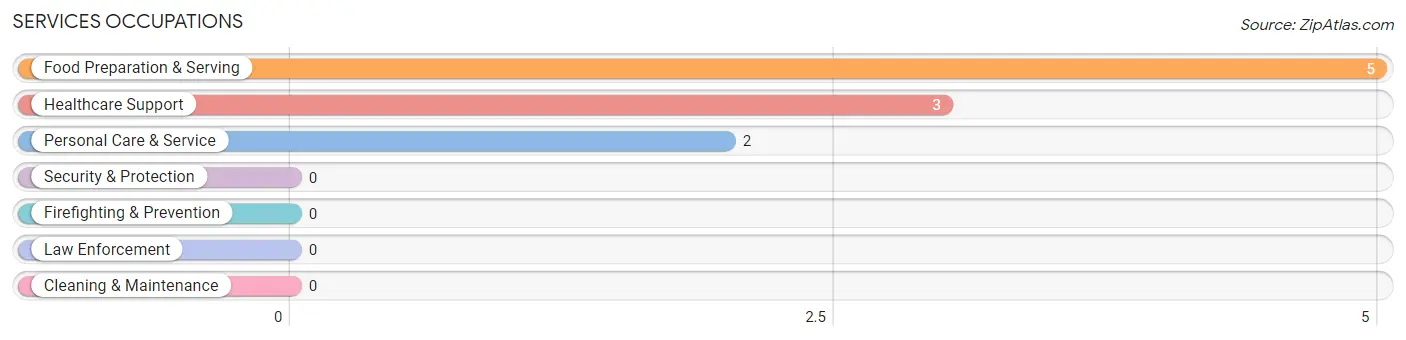
Services Occupations
The most common Services occupations in Jud are Food Preparation & Serving (5 | 23.8%), Healthcare Support (3 | 14.3%), and Personal Care & Service (2 | 9.5%).
Services Occupations by Sex
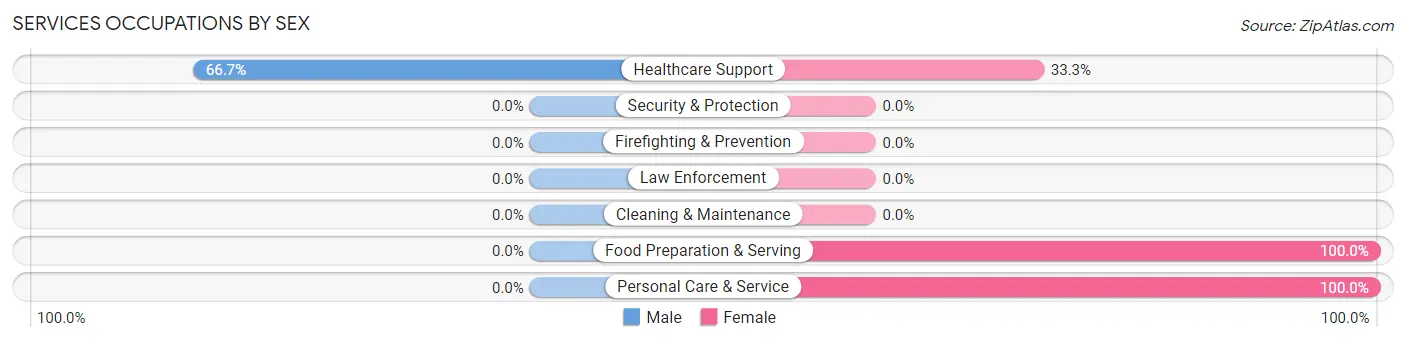
| Occupation | Male | Female |
| Healthcare Support | 2 (66.7%) | 1 (33.3%) |
| Security & Protection | 0 (0.0%) | 0 (0.0%) |
| Firefighting & Prevention | 0 (0.0%) | 0 (0.0%) |
| Law Enforcement | 0 (0.0%) | 0 (0.0%) |
| Food Preparation & Serving | 0 (0.0%) | 5 (100.0%) |
| Cleaning & Maintenance | 0 (0.0%) | 0 (0.0%) |
| Personal Care & Service | 0 (0.0%) | 2 (100.0%) |
| Total (Category) | 2 (20.0%) | 8 (80.0%) |
| Total (Overall) | 12 (57.1%) | 9 (42.9%) |
Sales and Office Occupations
The most common Sales and Office occupations in Jud are , and Office & Administration (1 | 4.8%).
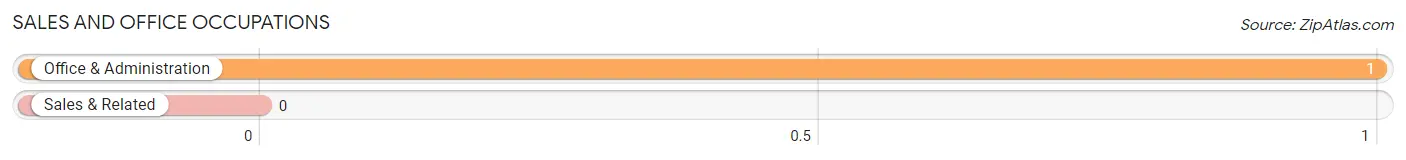
Sales and Office Occupations by Sex
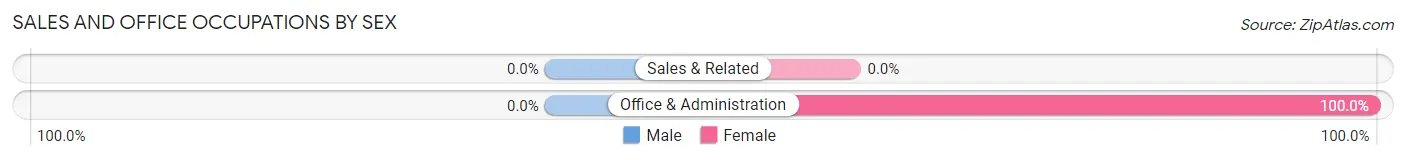
| Occupation | Male | Female |
| Sales & Related | 0 (0.0%) | 0 (0.0%) |
| Office & Administration | 0 (0.0%) | 1 (100.0%) |
| Total (Category) | 0 (0.0%) | 1 (100.0%) |
| Total (Overall) | 12 (57.1%) | 9 (42.9%) |
Natural Resources, Construction and Maintenance Occupations
The most common Natural Resources, Construction and Maintenance occupations in Jud are Installation, Maintenance & Repair (5 | 23.8%), and Construction & Extraction (3 | 14.3%).
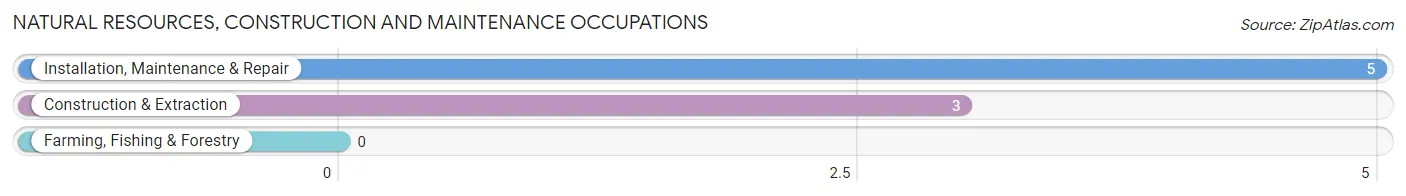
Natural Resources, Construction and Maintenance Occupations by Sex
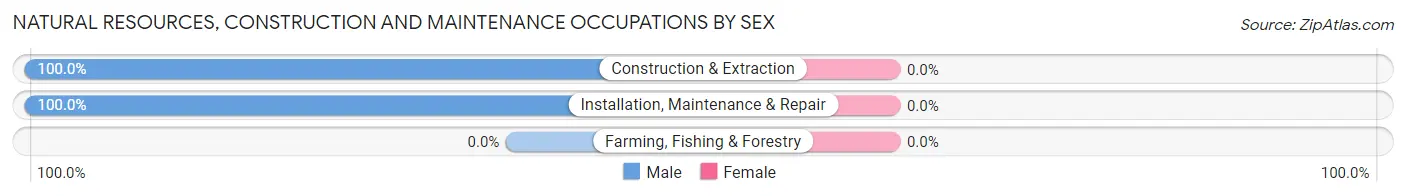
| Occupation | Male | Female |
| Farming, Fishing & Forestry | 0 (0.0%) | 0 (0.0%) |
| Construction & Extraction | 3 (100.0%) | 0 (0.0%) |
| Installation, Maintenance & Repair | 5 (100.0%) | 0 (0.0%) |
| Total (Category) | 8 (100.0%) | 0 (0.0%) |
| Total (Overall) | 12 (57.1%) | 9 (42.9%) |
Production, Transportation and Moving Occupations
The most common Production, Transportation and Moving occupations in Jud are Production (1 | 4.8%), and Transportation (1 | 4.8%).
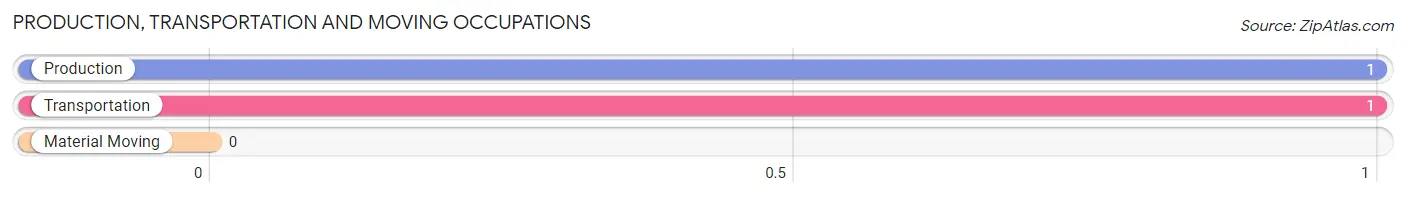
Production, Transportation and Moving Occupations by Sex
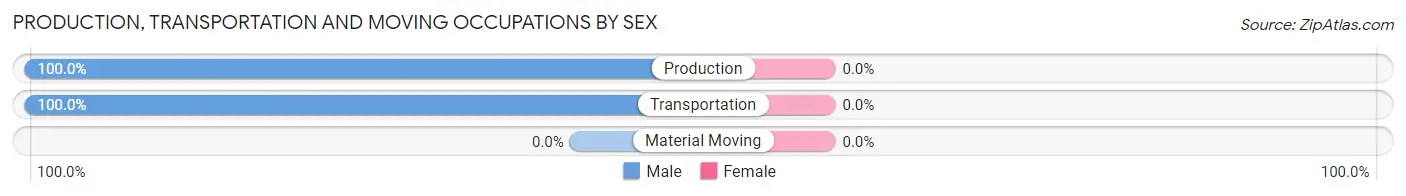
| Occupation | Male | Female |
| Production | 1 (100.0%) | 0 (0.0%) |
| Transportation | 1 (100.0%) | 0 (0.0%) |
| Material Moving | 0 (0.0%) | 0 (0.0%) |
| Total (Category) | 2 (100.0%) | 0 (0.0%) |
| Total (Overall) | 12 (57.1%) | 9 (42.9%) |
Employment Industries by Sex in Jud
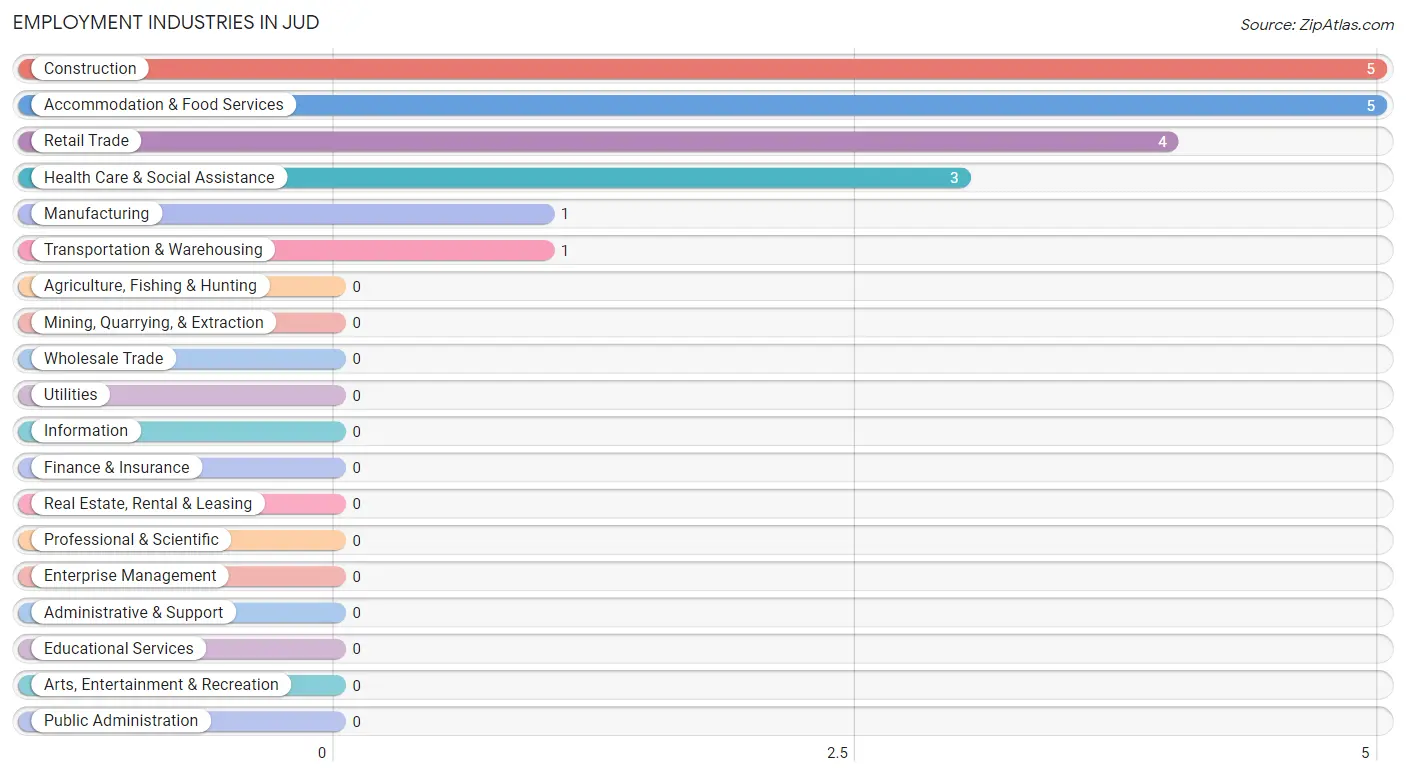
Employment Industries in Jud
The major employment industries in Jud include Construction (5 | 23.8%), Accommodation & Food Services (5 | 23.8%), Retail Trade (4 | 19.1%), Health Care & Social Assistance (3 | 14.3%), and Manufacturing (1 | 4.8%).
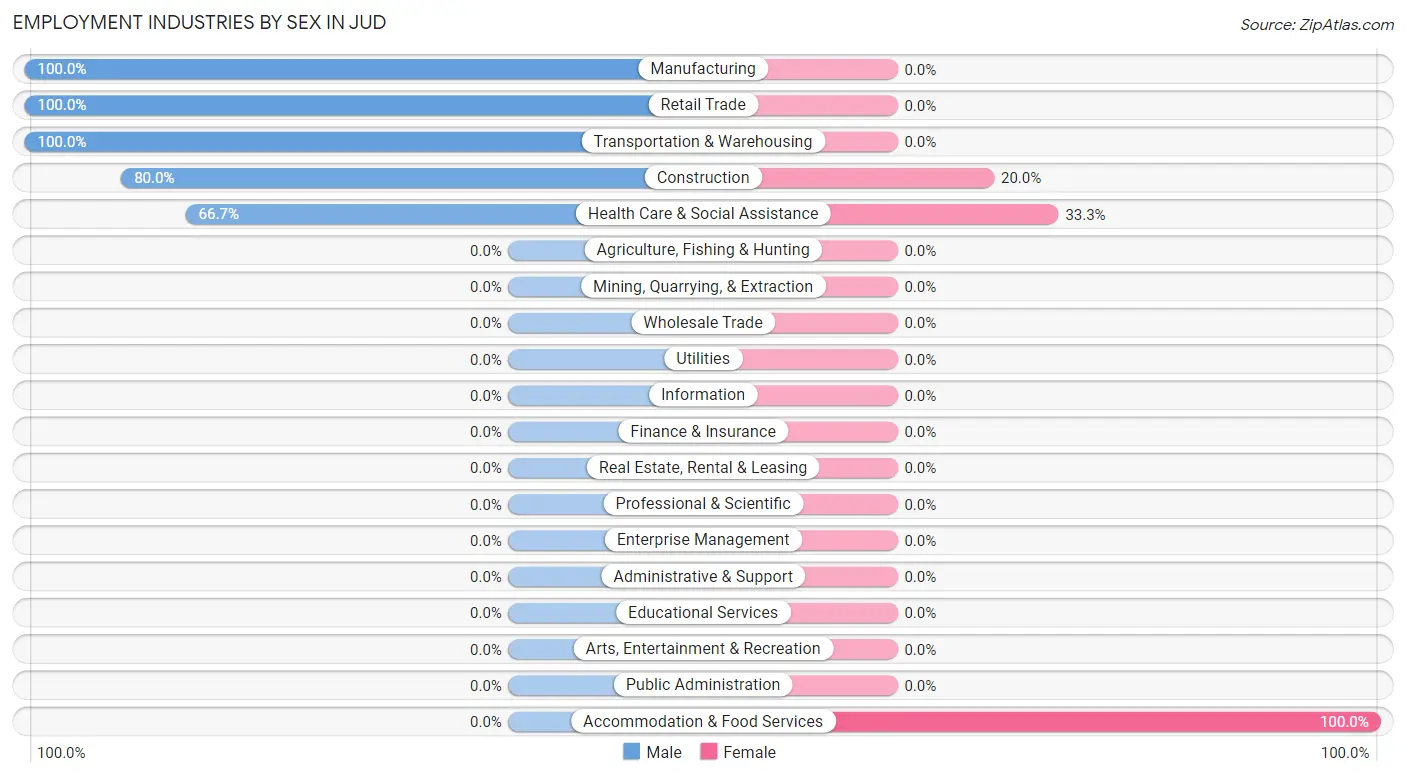
Employment Industries by Sex in Jud
The Jud industries that see more men than women are Manufacturing (100.0%), Retail Trade (100.0%), and Transportation & Warehousing (100.0%), whereas the industries that tend to have a higher number of women are Accommodation & Food Services (100.0%), Health Care & Social Assistance (33.3%), and Construction (20.0%).
| Industry | Male | Female |
| Agriculture, Fishing & Hunting | 0 (0.0%) | 0 (0.0%) |
| Mining, Quarrying, & Extraction | 0 (0.0%) | 0 (0.0%) |
| Construction | 4 (80.0%) | 1 (20.0%) |
| Manufacturing | 1 (100.0%) | 0 (0.0%) |
| Wholesale Trade | 0 (0.0%) | 0 (0.0%) |
| Retail Trade | 4 (100.0%) | 0 (0.0%) |
| Transportation & Warehousing | 1 (100.0%) | 0 (0.0%) |
| Utilities | 0 (0.0%) | 0 (0.0%) |
| Information | 0 (0.0%) | 0 (0.0%) |
| Finance & Insurance | 0 (0.0%) | 0 (0.0%) |
| Real Estate, Rental & Leasing | 0 (0.0%) | 0 (0.0%) |
| Professional & Scientific | 0 (0.0%) | 0 (0.0%) |
| Enterprise Management | 0 (0.0%) | 0 (0.0%) |
| Administrative & Support | 0 (0.0%) | 0 (0.0%) |
| Educational Services | 0 (0.0%) | 0 (0.0%) |
| Health Care & Social Assistance | 2 (66.7%) | 1 (33.3%) |
| Arts, Entertainment & Recreation | 0 (0.0%) | 0 (0.0%) |
| Accommodation & Food Services | 0 (0.0%) | 5 (100.0%) |
| Public Administration | 0 (0.0%) | 0 (0.0%) |
| Total | 12 (57.1%) | 9 (42.9%) |
Education in Jud
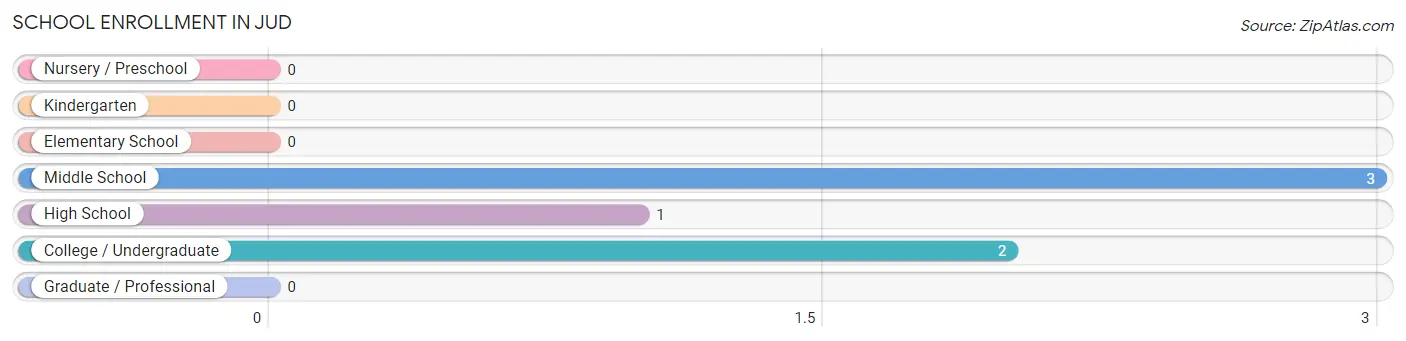
School Enrollment in Jud
The most common levels of schooling among the 6 students in Jud are middle school (3 | 50.0%), college / undergraduate (2 | 33.3%), and high school (1 | 16.7%).
| School Level | # Students | % Students |
| Nursery / Preschool | 0 | 0.0% |
| Kindergarten | 0 | 0.0% |
| Elementary School | 0 | 0.0% |
| Middle School | 3 | 50.0% |
| High School | 1 | 16.7% |
| College / Undergraduate | 2 | 33.3% |
| Graduate / Professional | 0 | 0.0% |
| Total | 6 | 100.0% |
School Enrollment by Age by Funding Source in Jud
Out of a total of 6 students who are enrolled in schools in Jud, 5 (83.3%) attend a private institution, while the remaining 1 (16.7%) are enrolled in public schools. The age group of 10 to 14 year olds has the highest likelihood of being enrolled in private schools, with 3 (100.0% in the age bracket) enrolled. Conversely, the age group of 18 to 19 year olds has the lowest likelihood of being enrolled in a private school, with 1 (100.0% in the age bracket) attending a public institution.
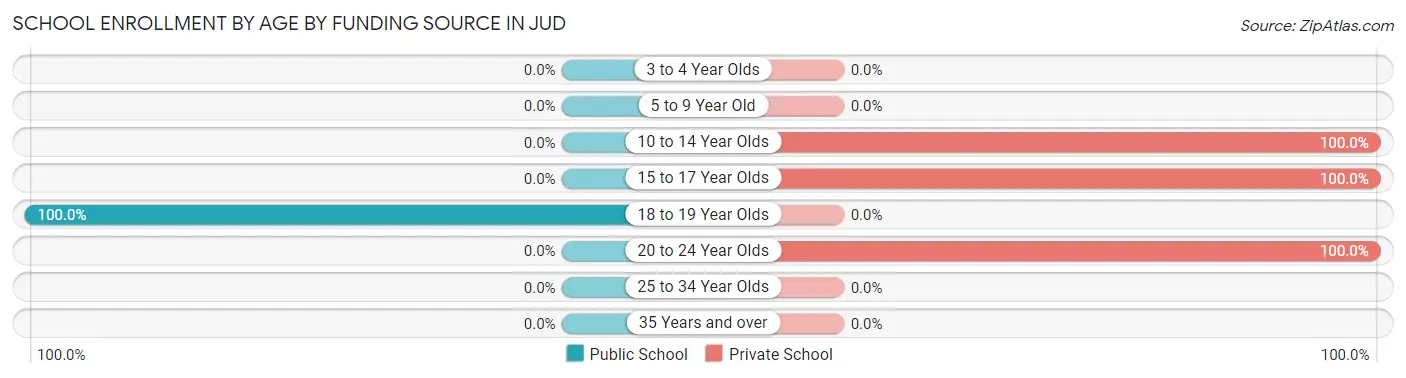
| Age Bracket | Public School | Private School |
| 3 to 4 Year Olds | 0 (0.0%) | 0 (0.0%) |
| 5 to 9 Year Old | 0 (0.0%) | 0 (0.0%) |
| 10 to 14 Year Olds | 0 (0.0%) | 3 (100.0%) |
| 15 to 17 Year Olds | 0 (0.0%) | 1 (100.0%) |
| 18 to 19 Year Olds | 1 (100.0%) | 0 (0.0%) |
| 20 to 24 Year Olds | 0 (0.0%) | 1 (100.0%) |
| 25 to 34 Year Olds | 0 (0.0%) | 0 (0.0%) |
| 35 Years and over | 0 (0.0%) | 0 (0.0%) |
| Total | 1 (16.7%) | 5 (83.3%) |
Educational Attainment by Field of Study in Jud
Education (4 | 80.0%), and engineering (1 | 20.0%) are the most common fields of study among 5 individuals in Jud who have obtained a bachelor's degree or higher.
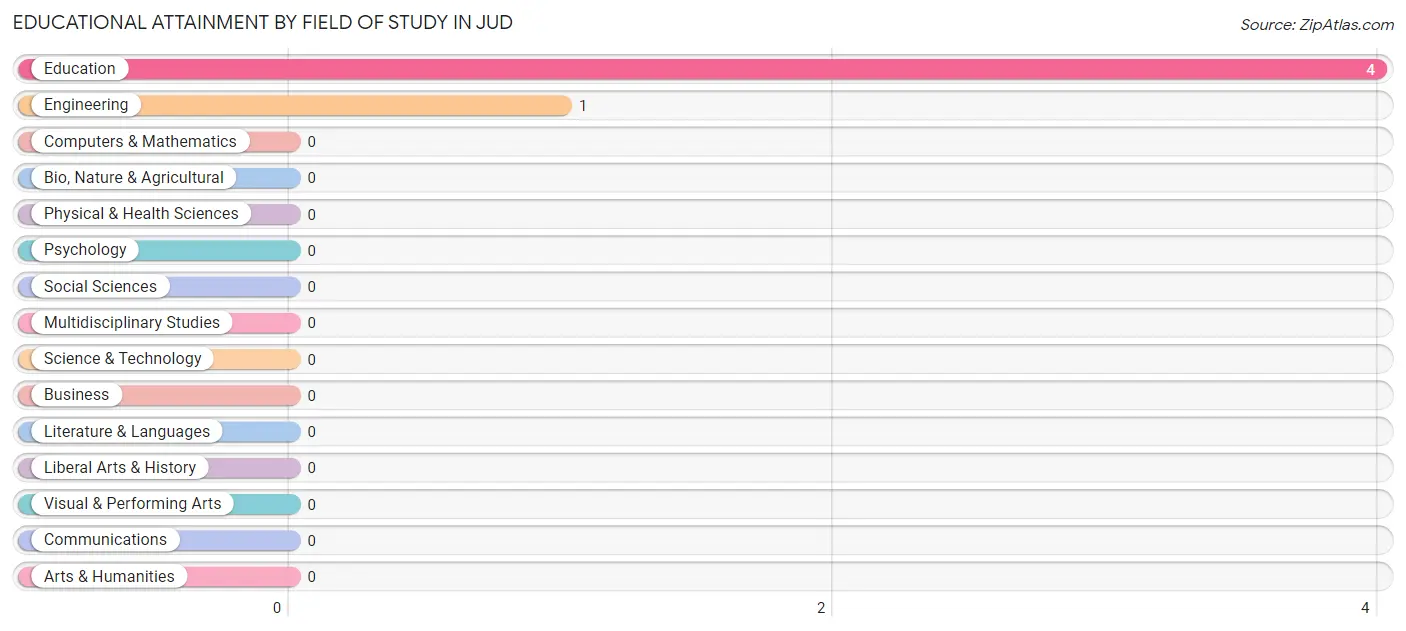
| Field of Study | # Graduates | % Graduates |
| Computers & Mathematics | 0 | 0.0% |
| Bio, Nature & Agricultural | 0 | 0.0% |
| Physical & Health Sciences | 0 | 0.0% |
| Psychology | 0 | 0.0% |
| Social Sciences | 0 | 0.0% |
| Engineering | 1 | 20.0% |
| Multidisciplinary Studies | 0 | 0.0% |
| Science & Technology | 0 | 0.0% |
| Business | 0 | 0.0% |
| Education | 4 | 80.0% |
| Literature & Languages | 0 | 0.0% |
| Liberal Arts & History | 0 | 0.0% |
| Visual & Performing Arts | 0 | 0.0% |
| Communications | 0 | 0.0% |
| Arts & Humanities | 0 | 0.0% |
| Total | 5 | 100.0% |
Transportation & Commute in Jud
Vehicle Availability by Sex in Jud
The most prevalent vehicle ownership categories in Jud are males with 2 vehicles (5, accounting for 41.7%) and females with 2 vehicles (1, making up 55.6%).
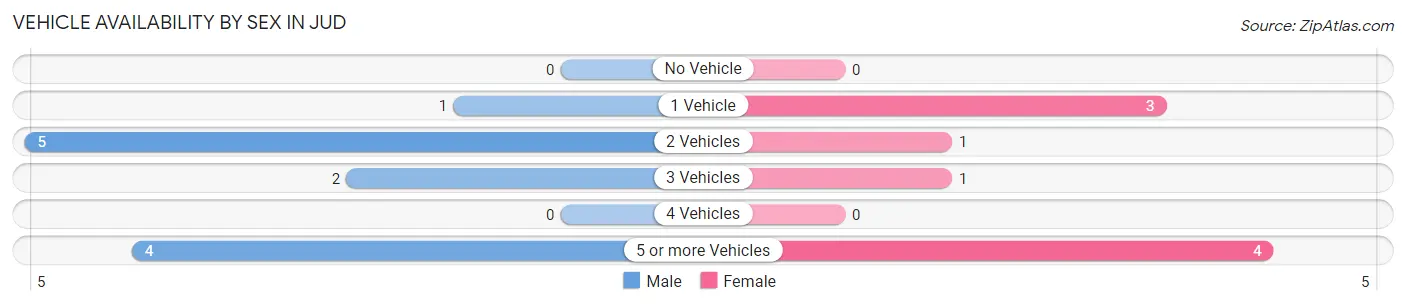
| Vehicles Available | Male | Female |
| No Vehicle | 0 (0.0%) | 0 (0.0%) |
| 1 Vehicle | 1 (8.3%) | 3 (33.3%) |
| 2 Vehicles | 5 (41.7%) | 1 (11.1%) |
| 3 Vehicles | 2 (16.7%) | 1 (11.1%) |
| 4 Vehicles | 0 (0.0%) | 0 (0.0%) |
| 5 or more Vehicles | 4 (33.3%) | 4 (44.4%) |
| Total | 12 (100.0%) | 9 (100.0%) |
Commute Time in Jud
The most frequently occuring commute durations in Jud are less than 5 minutes (8 commuters, 40.0%), 20 to 24 minutes (4 commuters, 20.0%), and 5 to 9 minutes (2 commuters, 10.0%).
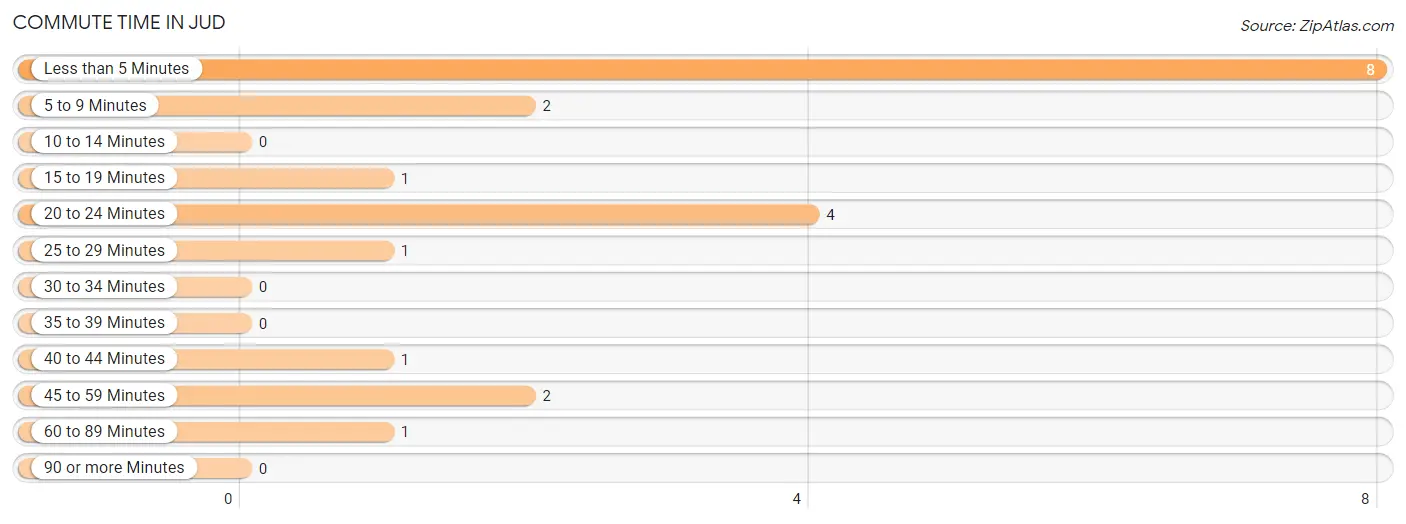
| Commute Time | # Commuters | % Commuters |
| Less than 5 Minutes | 8 | 40.0% |
| 5 to 9 Minutes | 2 | 10.0% |
| 10 to 14 Minutes | 0 | 0.0% |
| 15 to 19 Minutes | 1 | 5.0% |
| 20 to 24 Minutes | 4 | 20.0% |
| 25 to 29 Minutes | 1 | 5.0% |
| 30 to 34 Minutes | 0 | 0.0% |
| 35 to 39 Minutes | 0 | 0.0% |
| 40 to 44 Minutes | 1 | 5.0% |
| 45 to 59 Minutes | 2 | 10.0% |
| 60 to 89 Minutes | 1 | 5.0% |
| 90 or more Minutes | 0 | 0.0% |
Commute Time by Sex in Jud
The most common commute times in Jud are 20 to 24 minutes (4 commuters, 33.3%) for males and less than 5 minutes (6 commuters, 75.0%) for females.
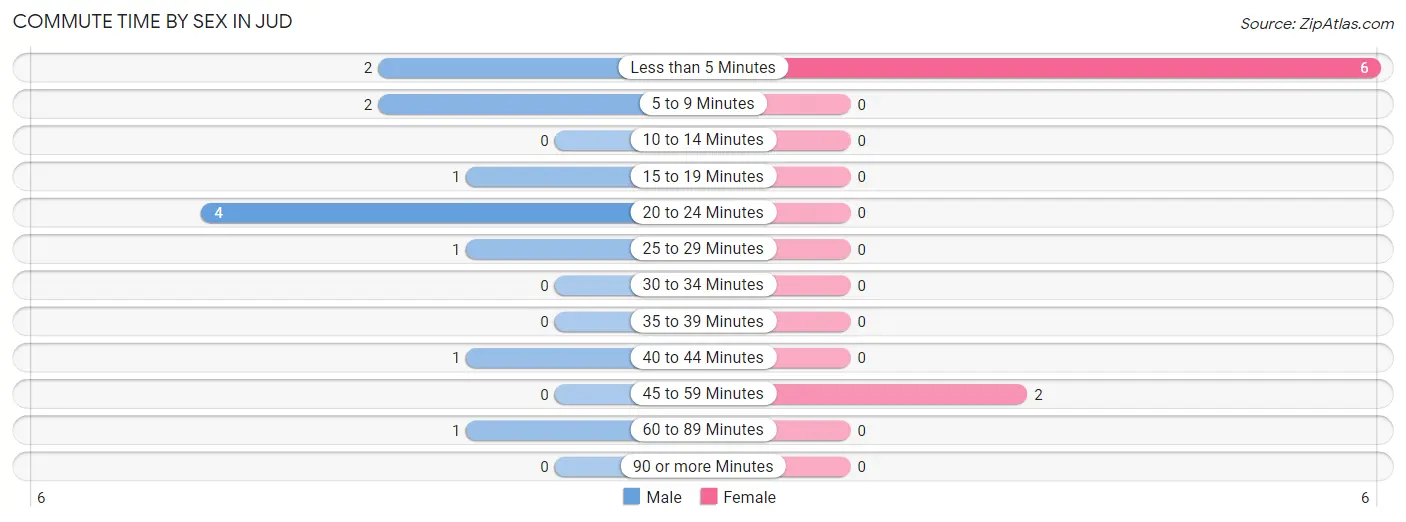
| Commute Time | Male | Female |
| Less than 5 Minutes | 2 (16.7%) | 6 (75.0%) |
| 5 to 9 Minutes | 2 (16.7%) | 0 (0.0%) |
| 10 to 14 Minutes | 0 (0.0%) | 0 (0.0%) |
| 15 to 19 Minutes | 1 (8.3%) | 0 (0.0%) |
| 20 to 24 Minutes | 4 (33.3%) | 0 (0.0%) |
| 25 to 29 Minutes | 1 (8.3%) | 0 (0.0%) |
| 30 to 34 Minutes | 0 (0.0%) | 0 (0.0%) |
| 35 to 39 Minutes | 0 (0.0%) | 0 (0.0%) |
| 40 to 44 Minutes | 1 (8.3%) | 0 (0.0%) |
| 45 to 59 Minutes | 0 (0.0%) | 2 (25.0%) |
| 60 to 89 Minutes | 1 (8.3%) | 0 (0.0%) |
| 90 or more Minutes | 0 (0.0%) | 0 (0.0%) |
Time of Departure to Work by Sex in Jud
The most frequent times of departure to work in Jud are 8:00 AM to 8:29 AM (5, 41.7%) for males and 7:00 AM to 7:29 AM (4, 50.0%) for females.
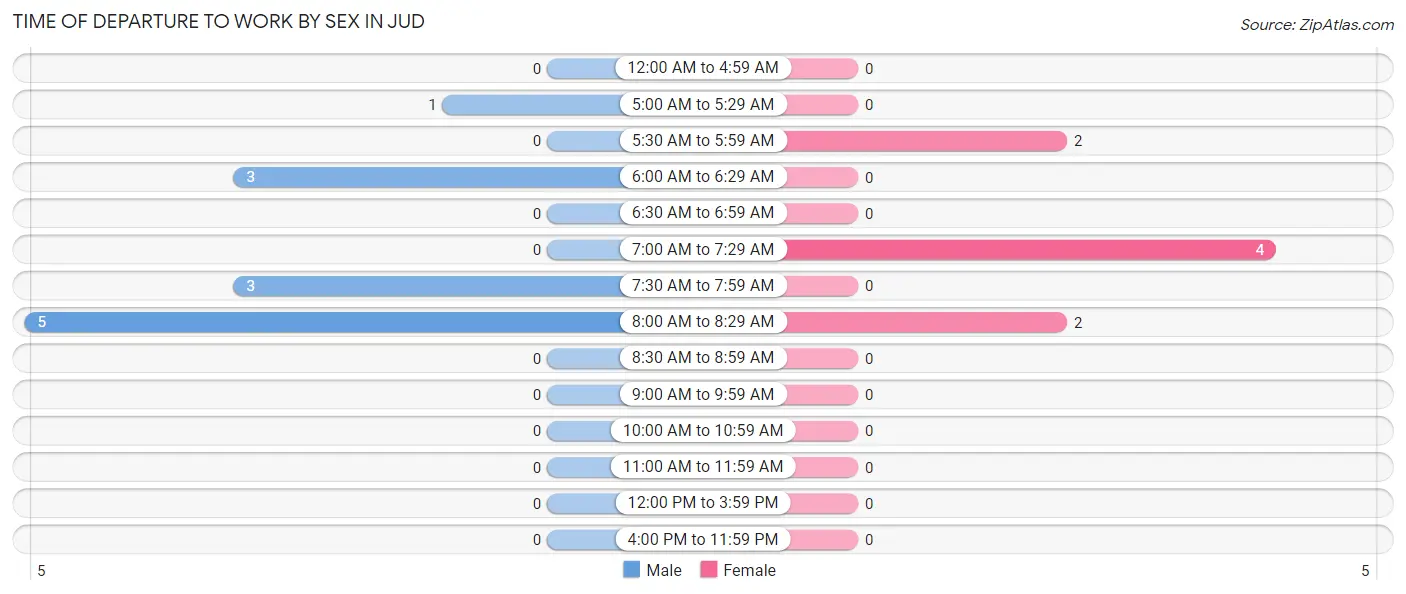
| Time of Departure | Male | Female |
| 12:00 AM to 4:59 AM | 0 (0.0%) | 0 (0.0%) |
| 5:00 AM to 5:29 AM | 1 (8.3%) | 0 (0.0%) |
| 5:30 AM to 5:59 AM | 0 (0.0%) | 2 (25.0%) |
| 6:00 AM to 6:29 AM | 3 (25.0%) | 0 (0.0%) |
| 6:30 AM to 6:59 AM | 0 (0.0%) | 0 (0.0%) |
| 7:00 AM to 7:29 AM | 0 (0.0%) | 4 (50.0%) |
| 7:30 AM to 7:59 AM | 3 (25.0%) | 0 (0.0%) |
| 8:00 AM to 8:29 AM | 5 (41.7%) | 2 (25.0%) |
| 8:30 AM to 8:59 AM | 0 (0.0%) | 0 (0.0%) |
| 9:00 AM to 9:59 AM | 0 (0.0%) | 0 (0.0%) |
| 10:00 AM to 10:59 AM | 0 (0.0%) | 0 (0.0%) |
| 11:00 AM to 11:59 AM | 0 (0.0%) | 0 (0.0%) |
| 12:00 PM to 3:59 PM | 0 (0.0%) | 0 (0.0%) |
| 4:00 PM to 11:59 PM | 0 (0.0%) | 0 (0.0%) |
| Total | 12 (100.0%) | 8 (100.0%) |
Housing Occupancy in Jud
Occupancy by Ownership in Jud
Of the total 25 dwellings in Jud, owner-occupied units account for 21 (84.0%), while renter-occupied units make up 4 (16.0%).
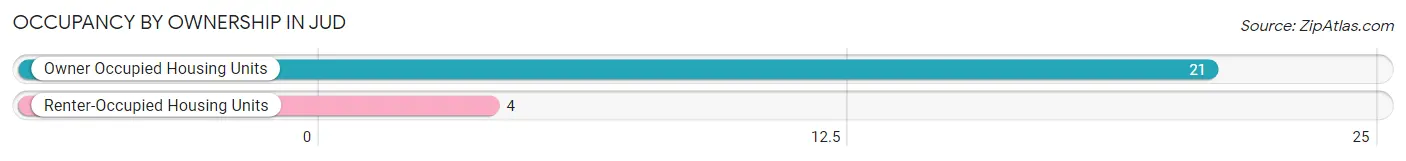
| Occupancy | # Housing Units | % Housing Units |
| Owner Occupied Housing Units | 21 | 84.0% |
| Renter-Occupied Housing Units | 4 | 16.0% |
| Total Occupied Housing Units | 25 | 100.0% |
Occupancy by Household Size in Jud
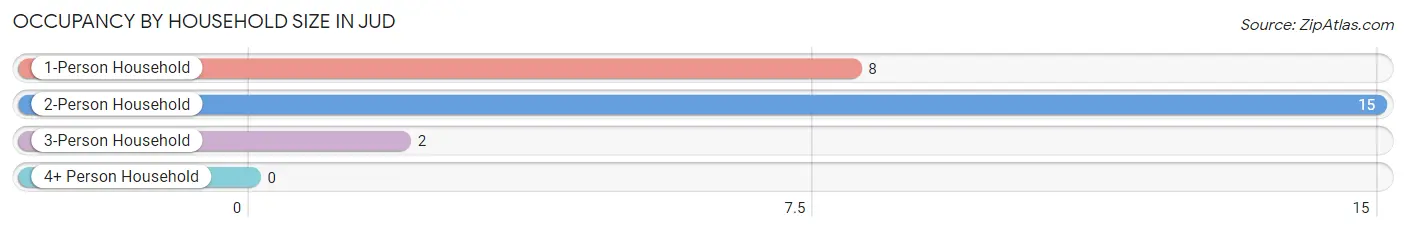
| Household Size | # Housing Units | % Housing Units |
| 1-Person Household | 8 | 32.0% |
| 2-Person Household | 15 | 60.0% |
| 3-Person Household | 2 | 8.0% |
| 4+ Person Household | 0 | 0.0% |
| Total Housing Units | 25 | 100.0% |
Occupancy by Ownership by Household Size in Jud
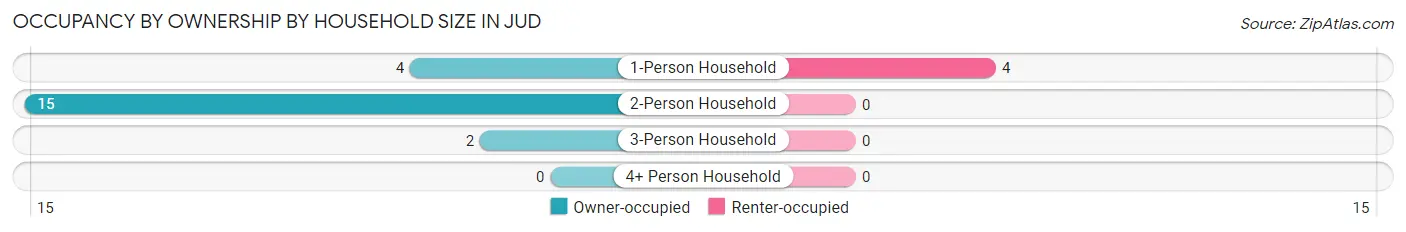
| Household Size | Owner-occupied | Renter-occupied |
| 1-Person Household | 4 (50.0%) | 4 (50.0%) |
| 2-Person Household | 15 (100.0%) | 0 (0.0%) |
| 3-Person Household | 2 (100.0%) | 0 (0.0%) |
| 4+ Person Household | 0 (0.0%) | 0 (0.0%) |
| Total Housing Units | 21 (84.0%) | 4 (16.0%) |
Occupancy by Educational Attainment in Jud
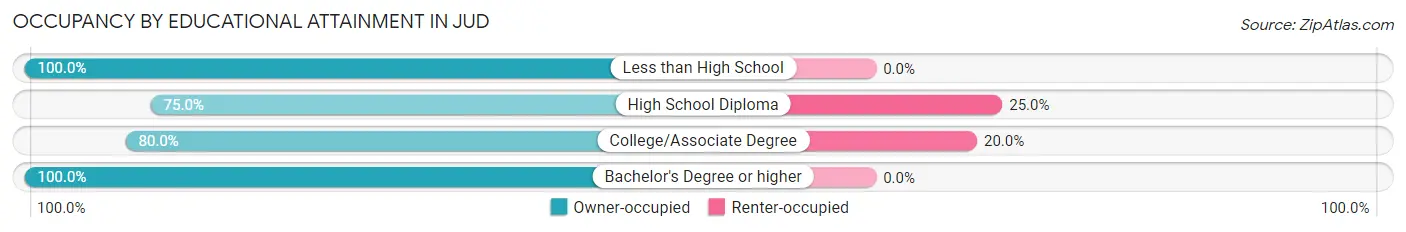
| Household Size | Owner-occupied | Renter-occupied |
| Less than High School | 5 (100.0%) | 0 (0.0%) |
| High School Diploma | 9 (75.0%) | 3 (25.0%) |
| College/Associate Degree | 4 (80.0%) | 1 (20.0%) |
| Bachelor's Degree or higher | 3 (100.0%) | 0 (0.0%) |
Occupancy by Age of Householder in Jud
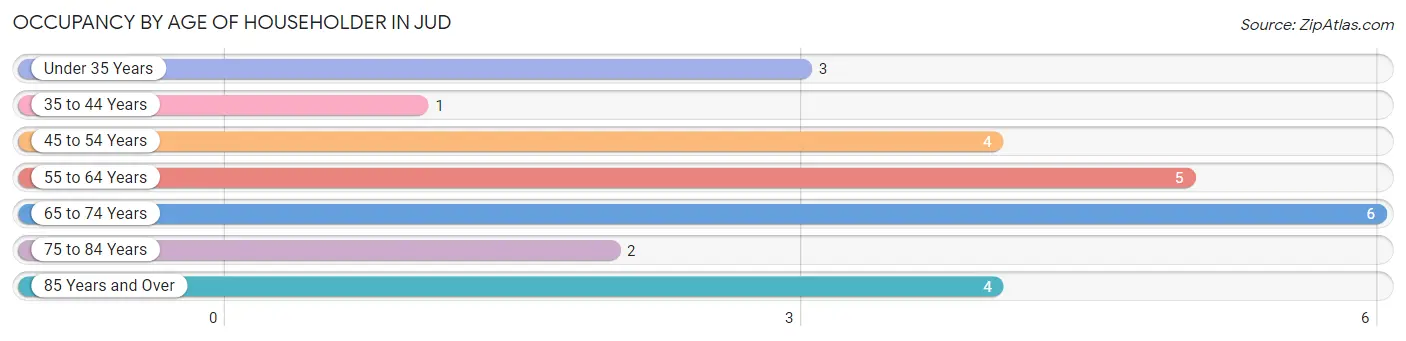
| Age Bracket | # Households | % Households |
| Under 35 Years | 3 | 12.0% |
| 35 to 44 Years | 1 | 4.0% |
| 45 to 54 Years | 4 | 16.0% |
| 55 to 64 Years | 5 | 20.0% |
| 65 to 74 Years | 6 | 24.0% |
| 75 to 84 Years | 2 | 8.0% |
| 85 Years and Over | 4 | 16.0% |
| Total | 25 | 100.0% |
Housing Finances in Jud
Median Income by Occupancy in Jud
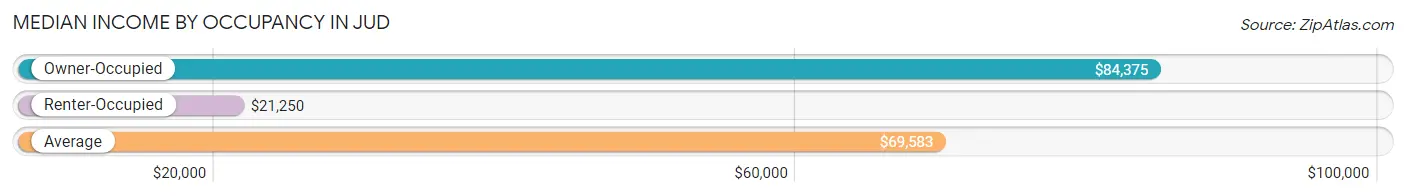
| Occupancy Type | # Households | Median Income |
| Owner-Occupied | 21 (84.0%) | $84,375 |
| Renter-Occupied | 4 (16.0%) | $21,250 |
| Average | 25 (100.0%) | $69,583 |
Occupancy by Householder Income Bracket in Jud
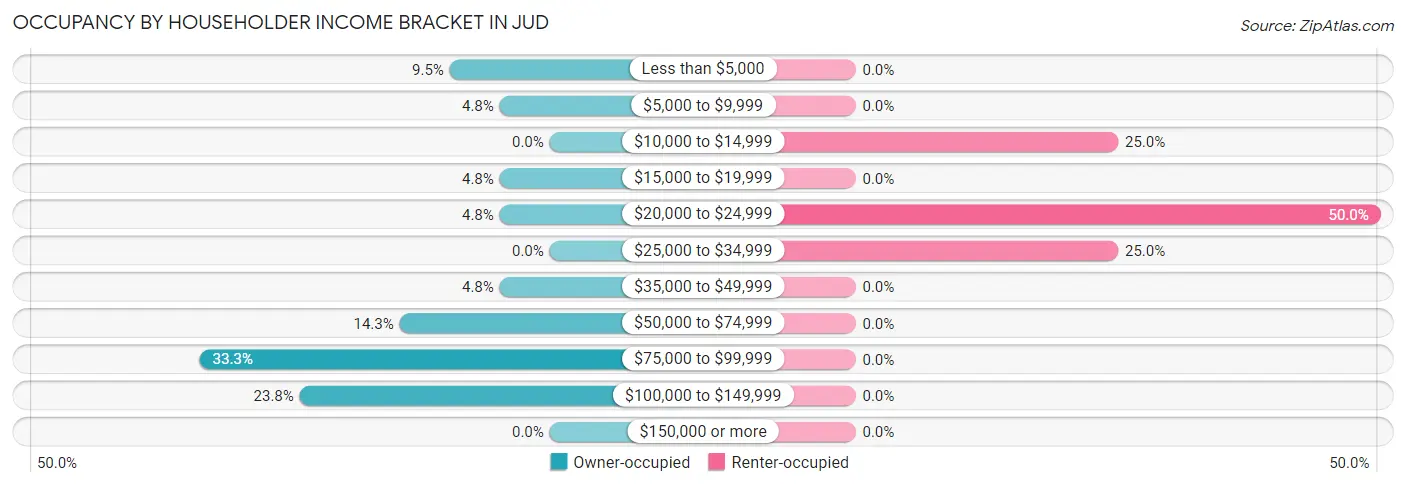
| Income Bracket | Owner-occupied | Renter-occupied |
| Less than $5,000 | 2 (9.5%) | 0 (0.0%) |
| $5,000 to $9,999 | 1 (4.8%) | 0 (0.0%) |
| $10,000 to $14,999 | 0 (0.0%) | 1 (25.0%) |
| $15,000 to $19,999 | 1 (4.8%) | 0 (0.0%) |
| $20,000 to $24,999 | 1 (4.8%) | 2 (50.0%) |
| $25,000 to $34,999 | 0 (0.0%) | 1 (25.0%) |
| $35,000 to $49,999 | 1 (4.8%) | 0 (0.0%) |
| $50,000 to $74,999 | 3 (14.3%) | 0 (0.0%) |
| $75,000 to $99,999 | 7 (33.3%) | 0 (0.0%) |
| $100,000 to $149,999 | 5 (23.8%) | 0 (0.0%) |
| $150,000 or more | 0 (0.0%) | 0 (0.0%) |
| Total | 21 (100.0%) | 4 (100.0%) |
Monthly Housing Cost Tiers in Jud
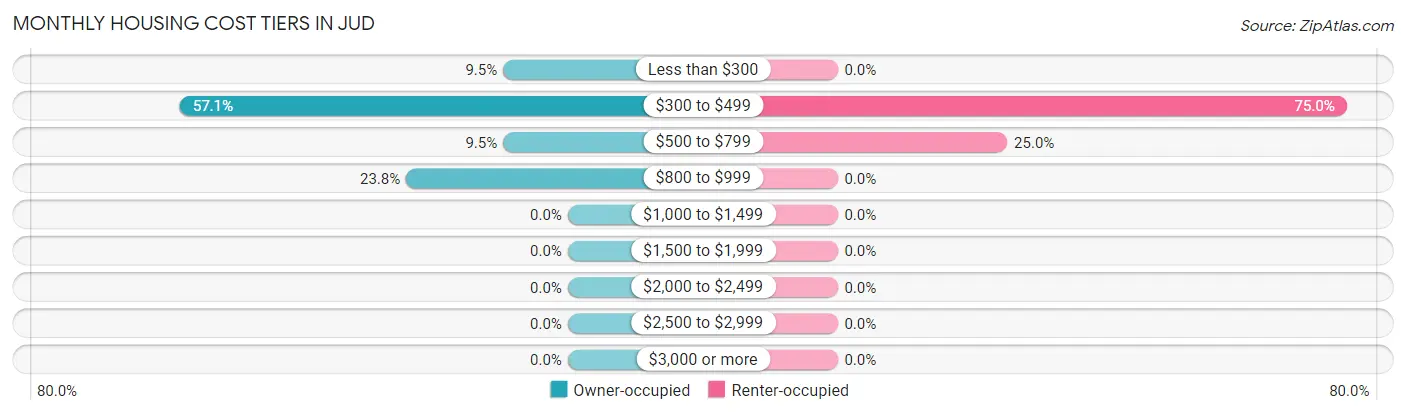
| Monthly Cost | Owner-occupied | Renter-occupied |
| Less than $300 | 2 (9.5%) | 0 (0.0%) |
| $300 to $499 | 12 (57.1%) | 3 (75.0%) |
| $500 to $799 | 2 (9.5%) | 1 (25.0%) |
| $800 to $999 | 5 (23.8%) | 0 (0.0%) |
| $1,000 to $1,499 | 0 (0.0%) | 0 (0.0%) |
| $1,500 to $1,999 | 0 (0.0%) | 0 (0.0%) |
| $2,000 to $2,499 | 0 (0.0%) | 0 (0.0%) |
| $2,500 to $2,999 | 0 (0.0%) | 0 (0.0%) |
| $3,000 or more | 0 (0.0%) | 0 (0.0%) |
| Total | 21 (100.0%) | 4 (100.0%) |
Physical Housing Characteristics in Jud
Housing Structures in Jud
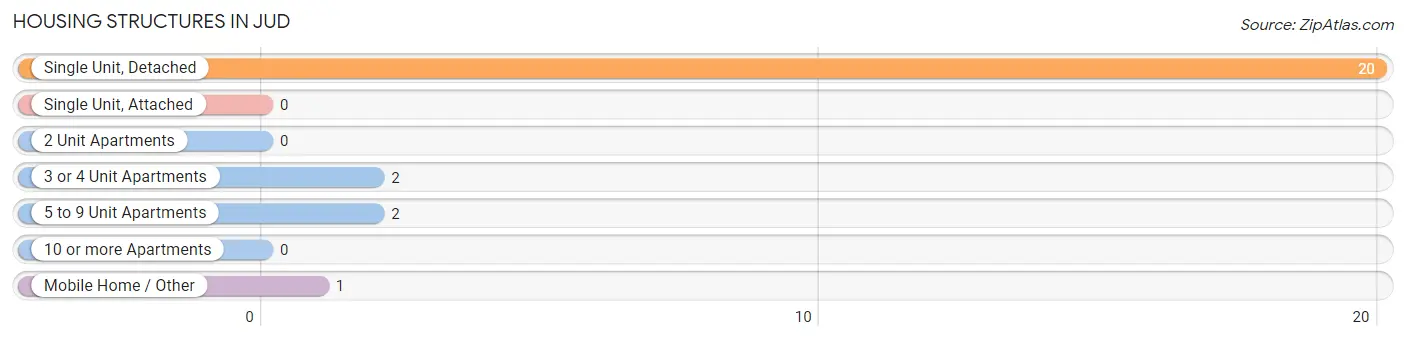
| Structure Type | # Housing Units | % Housing Units |
| Single Unit, Detached | 20 | 80.0% |
| Single Unit, Attached | 0 | 0.0% |
| 2 Unit Apartments | 0 | 0.0% |
| 3 or 4 Unit Apartments | 2 | 8.0% |
| 5 to 9 Unit Apartments | 2 | 8.0% |
| 10 or more Apartments | 0 | 0.0% |
| Mobile Home / Other | 1 | 4.0% |
| Total | 25 | 100.0% |
Housing Structures by Occupancy in Jud
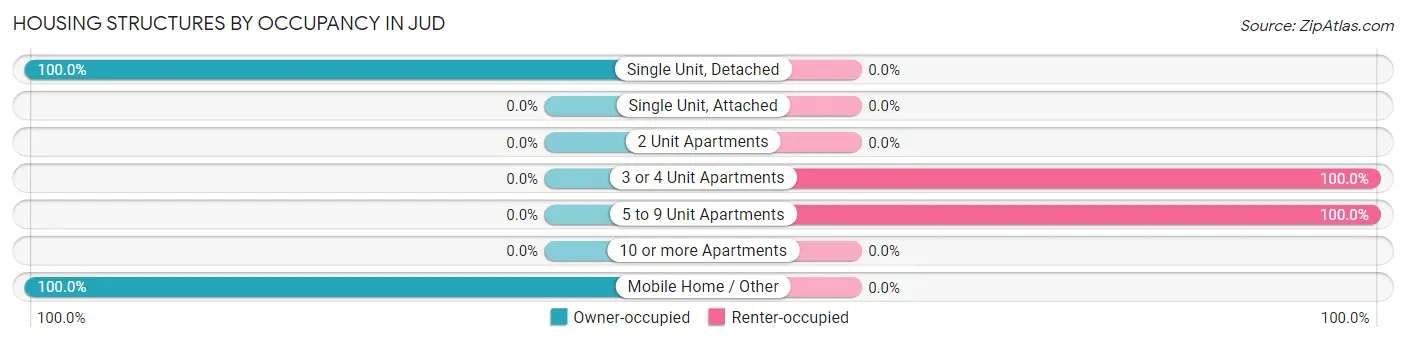
| Structure Type | Owner-occupied | Renter-occupied |
| Single Unit, Detached | 20 (100.0%) | 0 (0.0%) |
| Single Unit, Attached | 0 (0.0%) | 0 (0.0%) |
| 2 Unit Apartments | 0 (0.0%) | 0 (0.0%) |
| 3 or 4 Unit Apartments | 0 (0.0%) | 2 (100.0%) |
| 5 to 9 Unit Apartments | 0 (0.0%) | 2 (100.0%) |
| 10 or more Apartments | 0 (0.0%) | 0 (0.0%) |
| Mobile Home / Other | 1 (100.0%) | 0 (0.0%) |
| Total | 21 (84.0%) | 4 (16.0%) |
Housing Structures by Number of Rooms in Jud
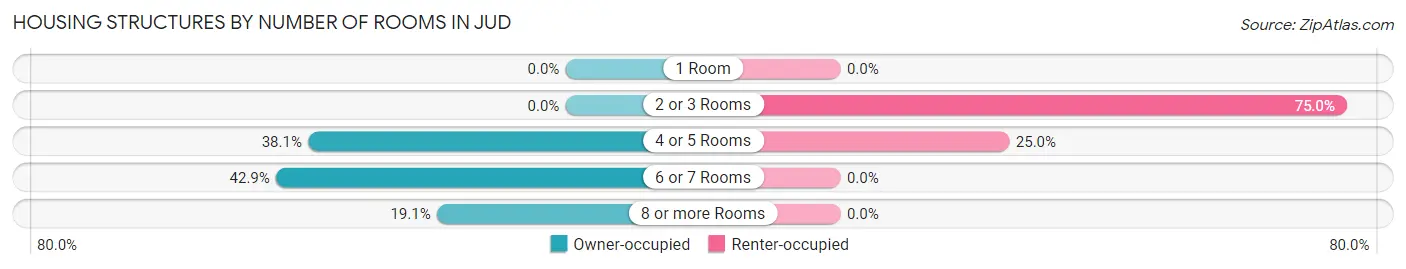
| Number of Rooms | Owner-occupied | Renter-occupied |
| 1 Room | 0 (0.0%) | 0 (0.0%) |
| 2 or 3 Rooms | 0 (0.0%) | 3 (75.0%) |
| 4 or 5 Rooms | 8 (38.1%) | 1 (25.0%) |
| 6 or 7 Rooms | 9 (42.9%) | 0 (0.0%) |
| 8 or more Rooms | 4 (19.1%) | 0 (0.0%) |
| Total | 21 (100.0%) | 4 (100.0%) |
Housing Structure by Heating Type in Jud
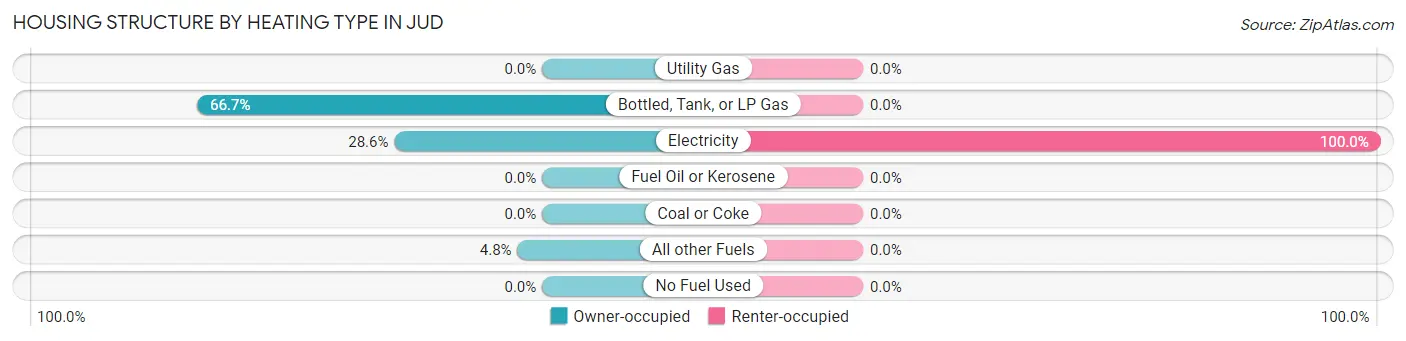
| Heating Type | Owner-occupied | Renter-occupied |
| Utility Gas | 0 (0.0%) | 0 (0.0%) |
| Bottled, Tank, or LP Gas | 14 (66.7%) | 0 (0.0%) |
| Electricity | 6 (28.6%) | 4 (100.0%) |
| Fuel Oil or Kerosene | 0 (0.0%) | 0 (0.0%) |
| Coal or Coke | 0 (0.0%) | 0 (0.0%) |
| All other Fuels | 1 (4.8%) | 0 (0.0%) |
| No Fuel Used | 0 (0.0%) | 0 (0.0%) |
| Total | 21 (100.0%) | 4 (100.0%) |
Household Vehicle Usage in Jud
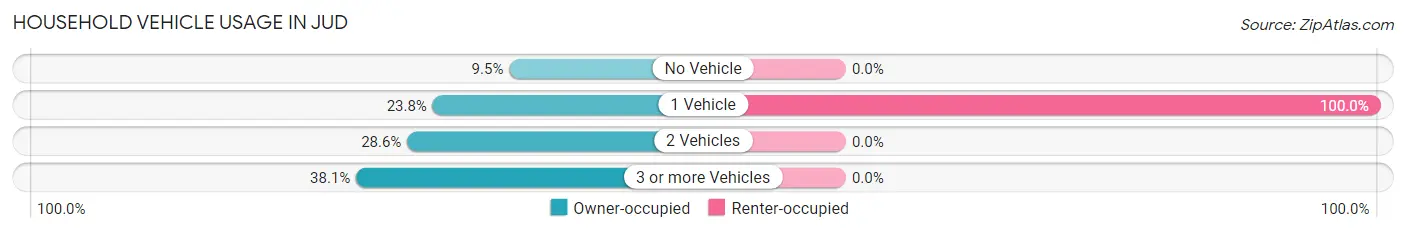
| Vehicles per Household | Owner-occupied | Renter-occupied |
| No Vehicle | 2 (9.5%) | 0 (0.0%) |
| 1 Vehicle | 5 (23.8%) | 4 (100.0%) |
| 2 Vehicles | 6 (28.6%) | 0 (0.0%) |
| 3 or more Vehicles | 8 (38.1%) | 0 (0.0%) |
| Total | 21 (100.0%) | 4 (100.0%) |
Real Estate & Mortgages in Jud
Real Estate and Mortgage Overview in Jud
| Characteristic | Without Mortgage | With Mortgage |
| Housing Units | 18 | 3 |
| Median Property Value | $75,000 | $0 |
| Median Household Income | $77,500 | $0 |
| Monthly Housing Costs | $429 | $0 |
| Real Estate Taxes | $800 | $0 |
Property Value by Mortgage Status in Jud
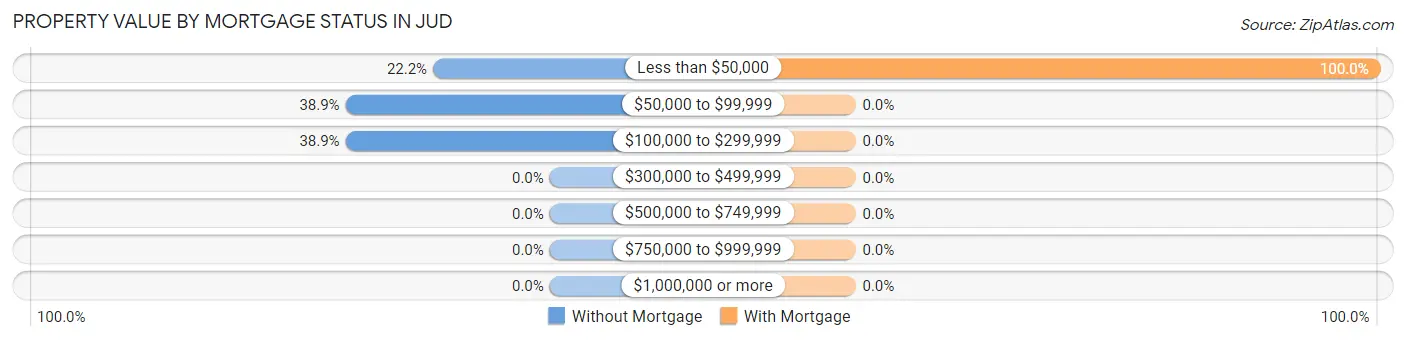
| Property Value | Without Mortgage | With Mortgage |
| Less than $50,000 | 4 (22.2%) | 3 (100.0%) |
| $50,000 to $99,999 | 7 (38.9%) | 0 (0.0%) |
| $100,000 to $299,999 | 7 (38.9%) | 0 (0.0%) |
| $300,000 to $499,999 | 0 (0.0%) | 0 (0.0%) |
| $500,000 to $749,999 | 0 (0.0%) | 0 (0.0%) |
| $750,000 to $999,999 | 0 (0.0%) | 0 (0.0%) |
| $1,000,000 or more | 0 (0.0%) | 0 (0.0%) |
| Total | 18 (100.0%) | 3 (100.0%) |
Household Income by Mortgage Status in Jud
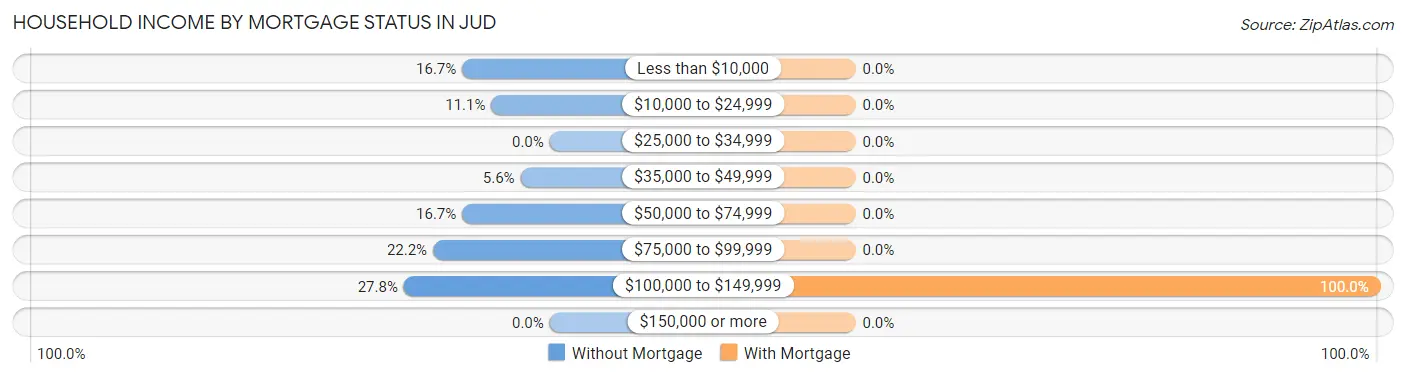
| Household Income | Without Mortgage | With Mortgage |
| Less than $10,000 | 3 (16.7%) | 0 (0.0%) |
| $10,000 to $24,999 | 2 (11.1%) | 0 (0.0%) |
| $25,000 to $34,999 | 0 (0.0%) | 0 (0.0%) |
| $35,000 to $49,999 | 1 (5.6%) | 0 (0.0%) |
| $50,000 to $74,999 | 3 (16.7%) | 0 (0.0%) |
| $75,000 to $99,999 | 4 (22.2%) | 0 (0.0%) |
| $100,000 to $149,999 | 5 (27.8%) | 3 (100.0%) |
| $150,000 or more | 0 (0.0%) | 0 (0.0%) |
| Total | 18 (100.0%) | 3 (100.0%) |
Property Value to Household Income Ratio in Jud
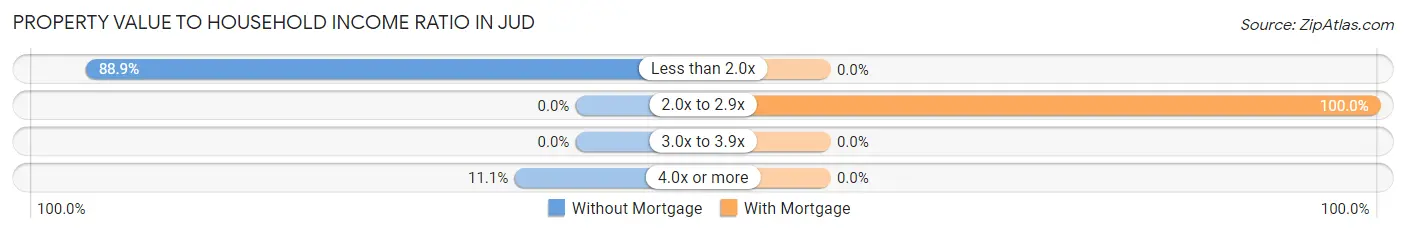
| Value-to-Income Ratio | Without Mortgage | With Mortgage |
| Less than 2.0x | 16 (88.9%) | 0 (0.0%) |
| 2.0x to 2.9x | 0 (0.0%) | 3 (100.0%) |
| 3.0x to 3.9x | 0 (0.0%) | 0 (0.0%) |
| 4.0x or more | 2 (11.1%) | 0 (0.0%) |
| Total | 18 (100.0%) | 3 (100.0%) |
Real Estate Taxes by Mortgage Status in Jud
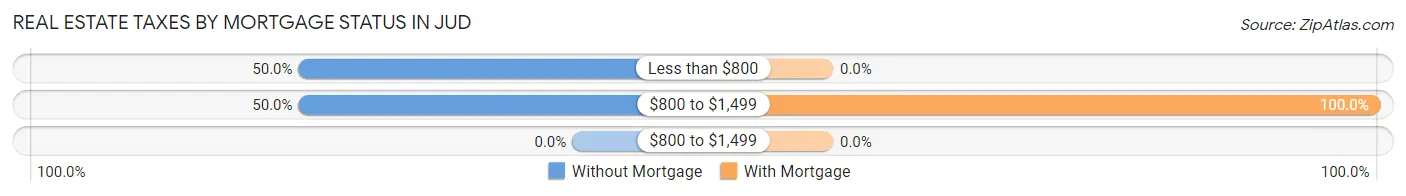
| Property Taxes | Without Mortgage | With Mortgage |
| Less than $800 | 9 (50.0%) | 0 (0.0%) |
| $800 to $1,499 | 9 (50.0%) | 3 (100.0%) |
| $800 to $1,499 | 0 (0.0%) | 0 (0.0%) |
| Total | 18 (100.0%) | 3 (100.0%) |
Health & Disability in Jud
Health Insurance Coverage by Age in Jud
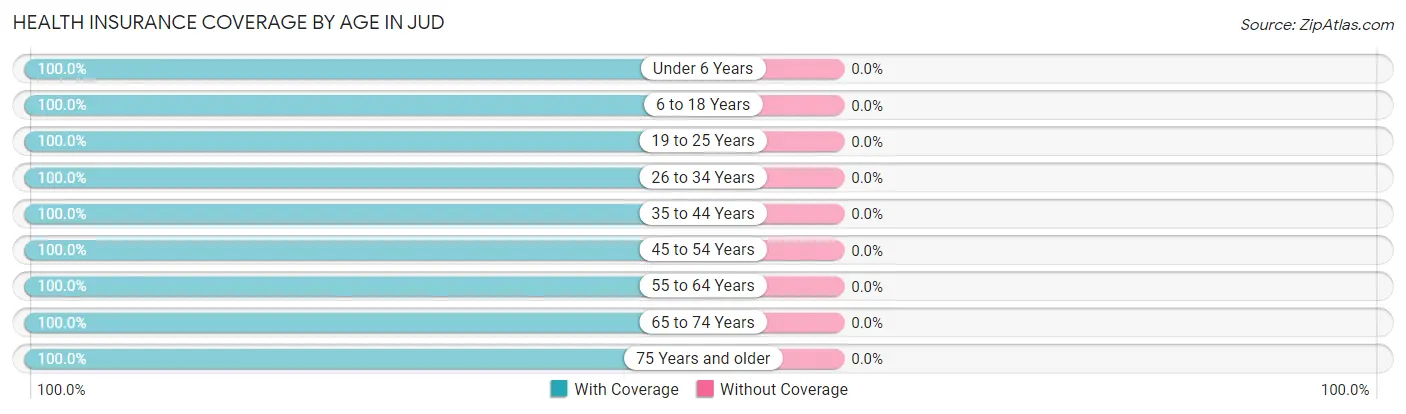
| Age Bracket | With Coverage | Without Coverage |
| Under 6 Years | 2 (100.0%) | 0 (0.0%) |
| 6 to 18 Years | 2 (100.0%) | 0 (0.0%) |
| 19 to 25 Years | 1 (100.0%) | 0 (0.0%) |
| 26 to 34 Years | 3 (100.0%) | 0 (0.0%) |
| 35 to 44 Years | 3 (100.0%) | 0 (0.0%) |
| 45 to 54 Years | 9 (100.0%) | 0 (0.0%) |
| 55 to 64 Years | 6 (100.0%) | 0 (0.0%) |
| 65 to 74 Years | 10 (100.0%) | 0 (0.0%) |
| 75 Years and older | 7 (100.0%) | 0 (0.0%) |
| Total | 43 (100.0%) | 0 (0.0%) |
Health Insurance Coverage by Citizenship Status in Jud
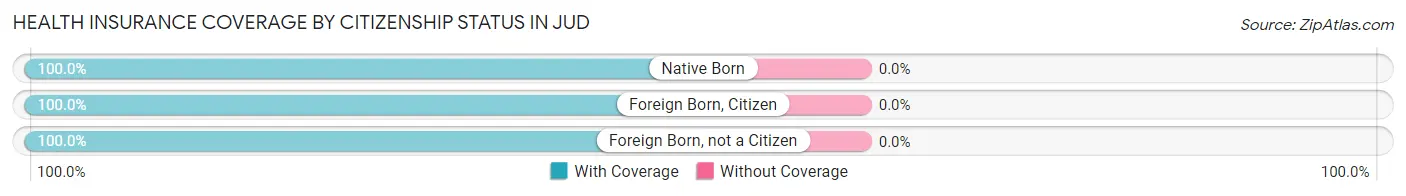
| Citizenship Status | With Coverage | Without Coverage |
| Native Born | 2 (100.0%) | 0 (0.0%) |
| Foreign Born, Citizen | 2 (100.0%) | 0 (0.0%) |
| Foreign Born, not a Citizen | 1 (100.0%) | 0 (0.0%) |
Health Insurance Coverage by Household Income in Jud
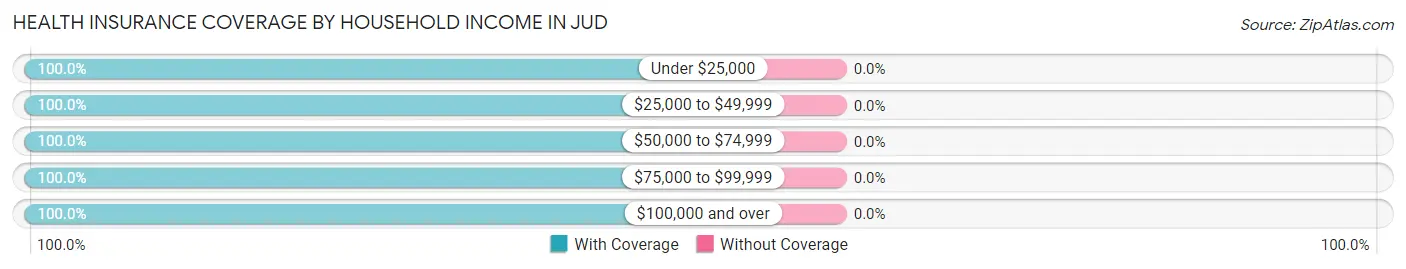
| Household Income | With Coverage | Without Coverage |
| Under $25,000 | 11 (100.0%) | 0 (0.0%) |
| $25,000 to $49,999 | 2 (100.0%) | 0 (0.0%) |
| $50,000 to $74,999 | 8 (100.0%) | 0 (0.0%) |
| $75,000 to $99,999 | 11 (100.0%) | 0 (0.0%) |
| $100,000 and over | 11 (100.0%) | 0 (0.0%) |
Public vs Private Health Insurance Coverage by Age in Jud
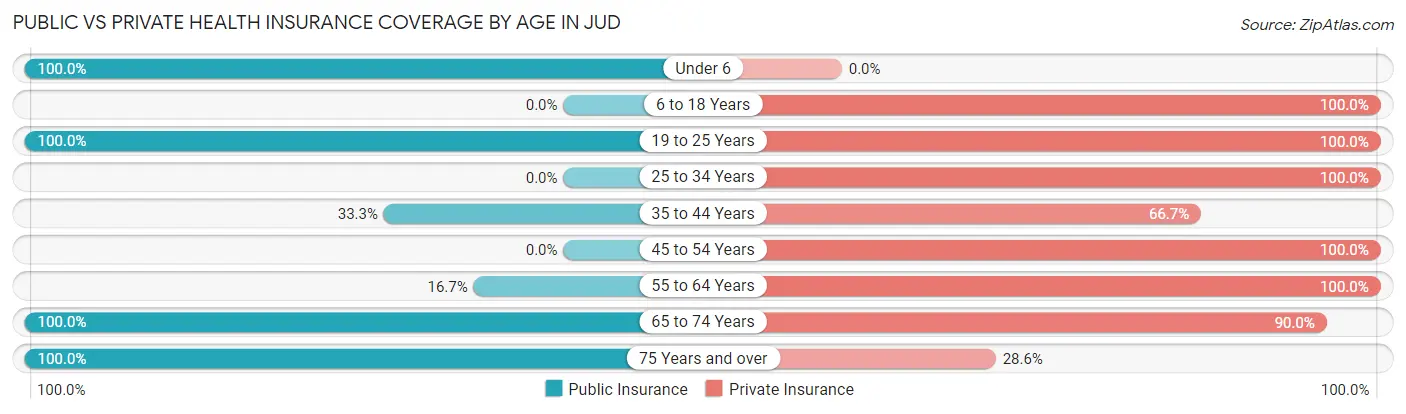
| Age Bracket | Public Insurance | Private Insurance |
| Under 6 | 2 (100.0%) | 0 (0.0%) |
| 6 to 18 Years | 0 (0.0%) | 2 (100.0%) |
| 19 to 25 Years | 1 (100.0%) | 1 (100.0%) |
| 25 to 34 Years | 0 (0.0%) | 3 (100.0%) |
| 35 to 44 Years | 1 (33.3%) | 2 (66.7%) |
| 45 to 54 Years | 0 (0.0%) | 9 (100.0%) |
| 55 to 64 Years | 1 (16.7%) | 6 (100.0%) |
| 65 to 74 Years | 10 (100.0%) | 9 (90.0%) |
| 75 Years and over | 7 (100.0%) | 2 (28.6%) |
| Total | 22 (51.2%) | 34 (79.1%) |
Disability Status by Sex by Age in Jud
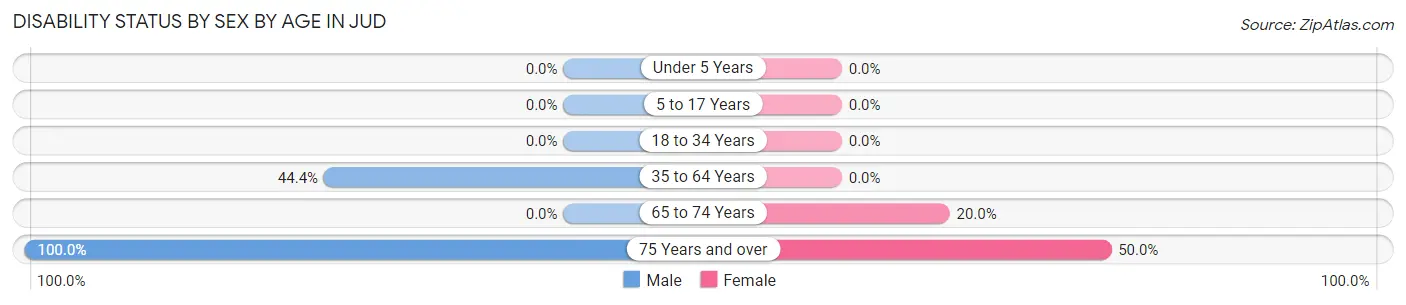
| Age Bracket | Male | Female |
| Under 5 Years | 0 (0.0%) | 0 (0.0%) |
| 5 to 17 Years | 0 (0.0%) | 0 (0.0%) |
| 18 to 34 Years | 0 (0.0%) | 0 (0.0%) |
| 35 to 64 Years | 4 (44.4%) | 0 (0.0%) |
| 65 to 74 Years | 0 (0.0%) | 1 (20.0%) |
| 75 Years and over | 1 (100.0%) | 3 (50.0%) |
Disability Class by Sex by Age in Jud
Disability Class: Hearing Difficulty
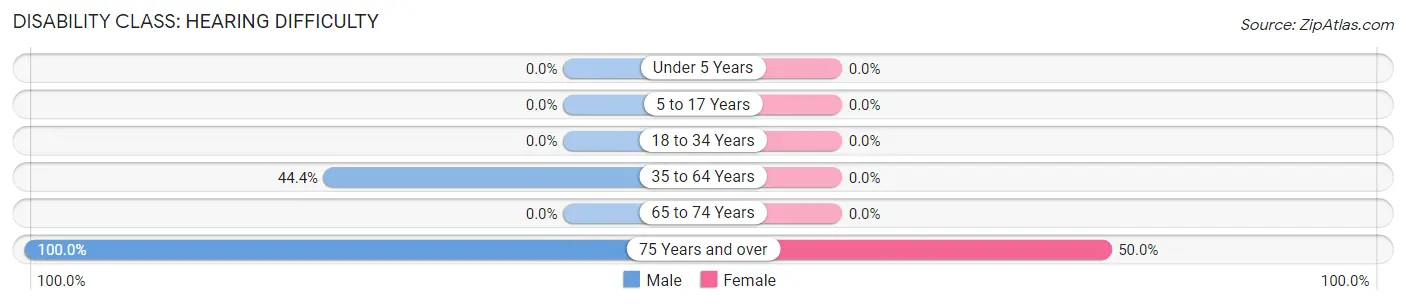
| Age Bracket | Male | Female |
| Under 5 Years | 0 (0.0%) | 0 (0.0%) |
| 5 to 17 Years | 0 (0.0%) | 0 (0.0%) |
| 18 to 34 Years | 0 (0.0%) | 0 (0.0%) |
| 35 to 64 Years | 4 (44.4%) | 0 (0.0%) |
| 65 to 74 Years | 0 (0.0%) | 0 (0.0%) |
| 75 Years and over | 1 (100.0%) | 3 (50.0%) |
Disability Class: Vision Difficulty
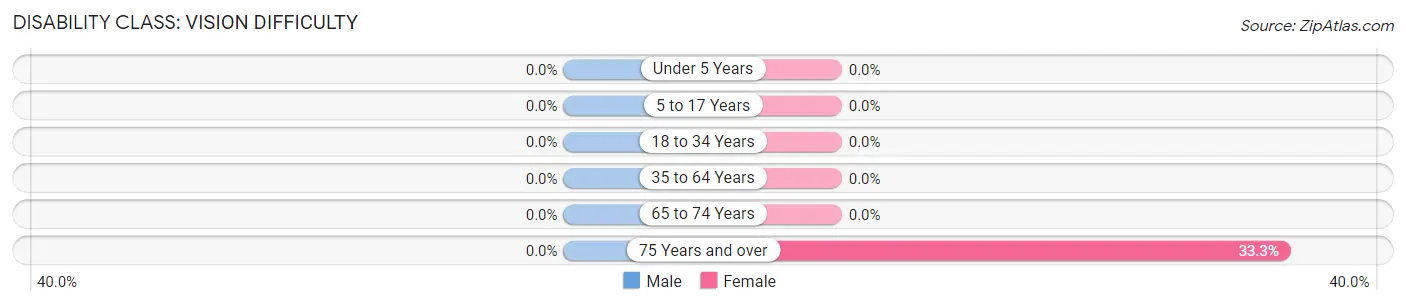
| Age Bracket | Male | Female |
| Under 5 Years | 0 (0.0%) | 0 (0.0%) |
| 5 to 17 Years | 0 (0.0%) | 0 (0.0%) |
| 18 to 34 Years | 0 (0.0%) | 0 (0.0%) |
| 35 to 64 Years | 0 (0.0%) | 0 (0.0%) |
| 65 to 74 Years | 0 (0.0%) | 0 (0.0%) |
| 75 Years and over | 0 (0.0%) | 2 (33.3%) |
Disability Class: Cognitive Difficulty
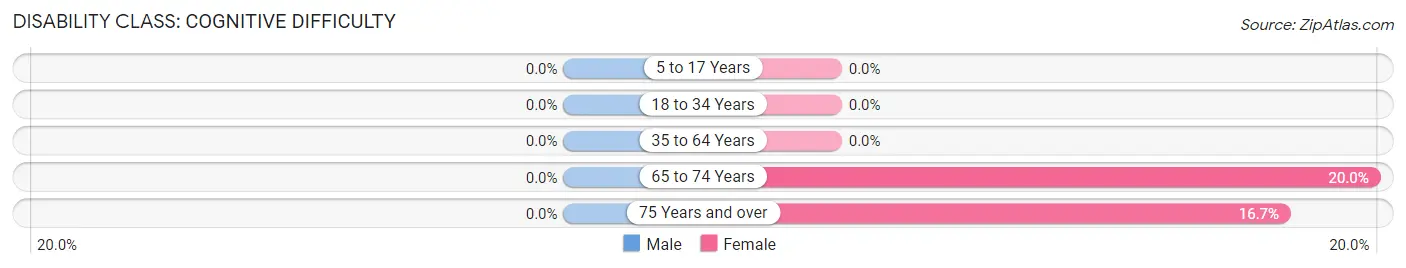
| Age Bracket | Male | Female |
| 5 to 17 Years | 0 (0.0%) | 0 (0.0%) |
| 18 to 34 Years | 0 (0.0%) | 0 (0.0%) |
| 35 to 64 Years | 0 (0.0%) | 0 (0.0%) |
| 65 to 74 Years | 0 (0.0%) | 1 (20.0%) |
| 75 Years and over | 0 (0.0%) | 1 (16.7%) |
Disability Class: Ambulatory Difficulty
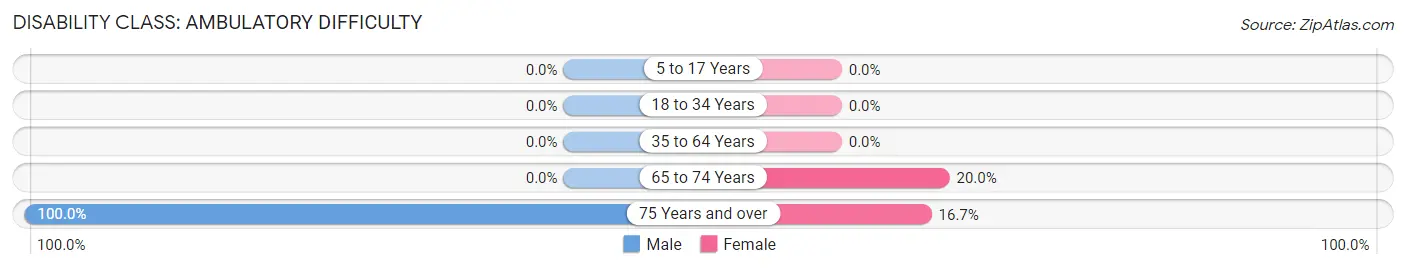
| Age Bracket | Male | Female |
| 5 to 17 Years | 0 (0.0%) | 0 (0.0%) |
| 18 to 34 Years | 0 (0.0%) | 0 (0.0%) |
| 35 to 64 Years | 0 (0.0%) | 0 (0.0%) |
| 65 to 74 Years | 0 (0.0%) | 1 (20.0%) |
| 75 Years and over | 1 (100.0%) | 1 (16.7%) |
Disability Class: Self-Care Difficulty
| Age Bracket | Male | Female |
| 5 to 17 Years | 0 (0.0%) | 0 (0.0%) |
| 18 to 34 Years | 0 (0.0%) | 0 (0.0%) |
| 35 to 64 Years | 0 (0.0%) | 0 (0.0%) |
| 65 to 74 Years | 0 (0.0%) | 0 (0.0%) |
| 75 Years and over | 0 (0.0%) | 0 (0.0%) |
Technology Access in Jud
Computing Device Access in Jud
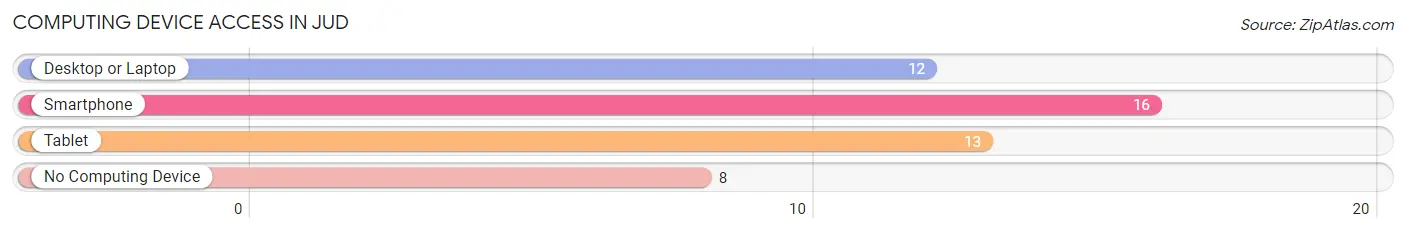
| Device Type | # Households | % Households |
| Desktop or Laptop | 12 | 48.0% |
| Smartphone | 16 | 64.0% |
| Tablet | 13 | 52.0% |
| No Computing Device | 8 | 32.0% |
| Total | 25 | 100.0% |
Internet Access in Jud
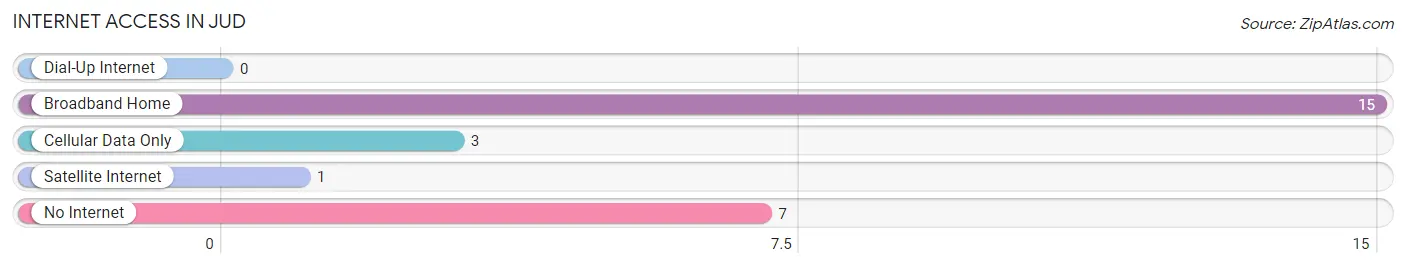
| Internet Type | # Households | % Households |
| Dial-Up Internet | 0 | 0.0% |
| Broadband Home | 15 | 60.0% |
| Cellular Data Only | 3 | 12.0% |
| Satellite Internet | 1 | 4.0% |
| No Internet | 7 | 28.0% |
| Total | 25 | 100.0% |
Jud Summary
History
North Dakota is a state located in the Midwestern and Great Plains regions of the United States. It is the 19th largest state by area, and the 4th least populous state. North Dakota was admitted to the Union on November 2, 1889, as the 39th state. The state was named after the Dakota Sioux Native American tribe, which inhabited the area at the time of statehood.
The first inhabitants of North Dakota were Paleo-Indians, who arrived in the area around 10,000 BC. The first permanent settlers were the Mandan, Hidatsa, and Arikara tribes, who established villages along the Missouri River in the late 1700s. The first Europeans to explore the area were French fur traders, who arrived in the late 1700s.
In the early 1800s, the United States acquired the area through the Louisiana Purchase. The area was then part of the Minnesota Territory until 1861, when it became part of the Dakota Territory. The Dakota Territory was divided into North and South Dakota in 1889, and North Dakota became a state in November of that year.
Geography
North Dakota is located in the northern Great Plains region of the United States. It is bordered by Minnesota to the east, South Dakota to the south, Montana to the west, and the Canadian provinces of Saskatchewan and Manitoba to the north.
The state has an area of 70,700 square miles, making it the 19th largest state in the country. The landscape of North Dakota is mostly flat, with rolling hills in the east and west. The highest point in the state is White Butte, which has an elevation of 3,506 feet.
The Missouri River is the longest river in the state, and is the primary source of water for the state. Other major rivers include the Red River, the Yellowstone River, and the Souris River. The state also has numerous lakes, including Lake Sakakawea, Lake Oahe, and Lake Audubon.
Economy
North Dakota has a diversified economy, with agriculture, energy, and tourism being the main industries. Agriculture is the largest sector of the state’s economy, accounting for about one-third of the state’s total economic output. The state is a major producer of wheat, barley, oats, corn, and soybeans.
The energy sector is also a major contributor to the state’s economy. North Dakota is the second-largest producer of oil in the United States, and is also a major producer of natural gas and coal.
Tourism is also an important part of the state’s economy. The state is home to numerous national parks, monuments, and historic sites, including Theodore Roosevelt National Park, Knife River Indian Villages National Historic Site, and Fort Union Trading Post National Historic Site.
Demographics
As of 2019, North Dakota had an estimated population of 762,062, making it the 4th least populous state in the country. The state has a population density of 10.8 people per square mile, making it the 48th most densely populated state.
The largest city in the state is Fargo, with an estimated population of 122,359. Other major cities include Bismarck (population 61,272), Grand Forks (population 54,844), and Minot (population 46,321).
The racial makeup of North Dakota is 87.2% White, 5.2% Native American, 2.9% Hispanic or Latino, 1.7% Asian, and 0.8% African American. The state also has a large population of German Americans, making up about 25% of the population. The median household income in the state is $58,906, and the median home value is $179,400.
Common Questions
What is Per Capita Income in Jud?
Per Capita income in Jud is $32,057.
What is the Median Family Income in Jud?
Median Family Income in Jud is $93,125.
What is the Median Household income in Jud?
Median Household Income in Jud is $69,583.
What is Inequality or Gini Index in Jud?
Inequality or Gini Index in Jud is 0.35.
What is the Total Population of Jud?
Total Population of Jud is 47.
What is the Total Male Population of Jud?
Total Male Population of Jud is 20.
What is the Total Female Population of Jud?
Total Female Population of Jud is 27.
What is the Ratio of Males per 100 Females in Jud?
There are 74.07 Males per 100 Females in Jud.
What is the Ratio of Females per 100 Males in Jud?
There are 135.00 Females per 100 Males in Jud.
What is the Median Population Age in Jud?
Median Population Age in Jud is 54.9 Years.
What is the Average Family Size in Jud
Average Family Size in Jud is 2.1 People.
What is the Average Household Size in Jud
Average Household Size in Jud is 1.7 People.
How Large is the Labor Force in Jud?
There are 21 People in the Labor Forcein in Jud.
What is the Percentage of People in the Labor Force in Jud?
50.0% of People are in the Labor Force in Jud.