Cities with the Highest Percentage of Population with a Degree in Social Sciences in North Dakota
RELATED REPORTS & OPTIONS
Social Sciences
North Dakota
Compare Cities
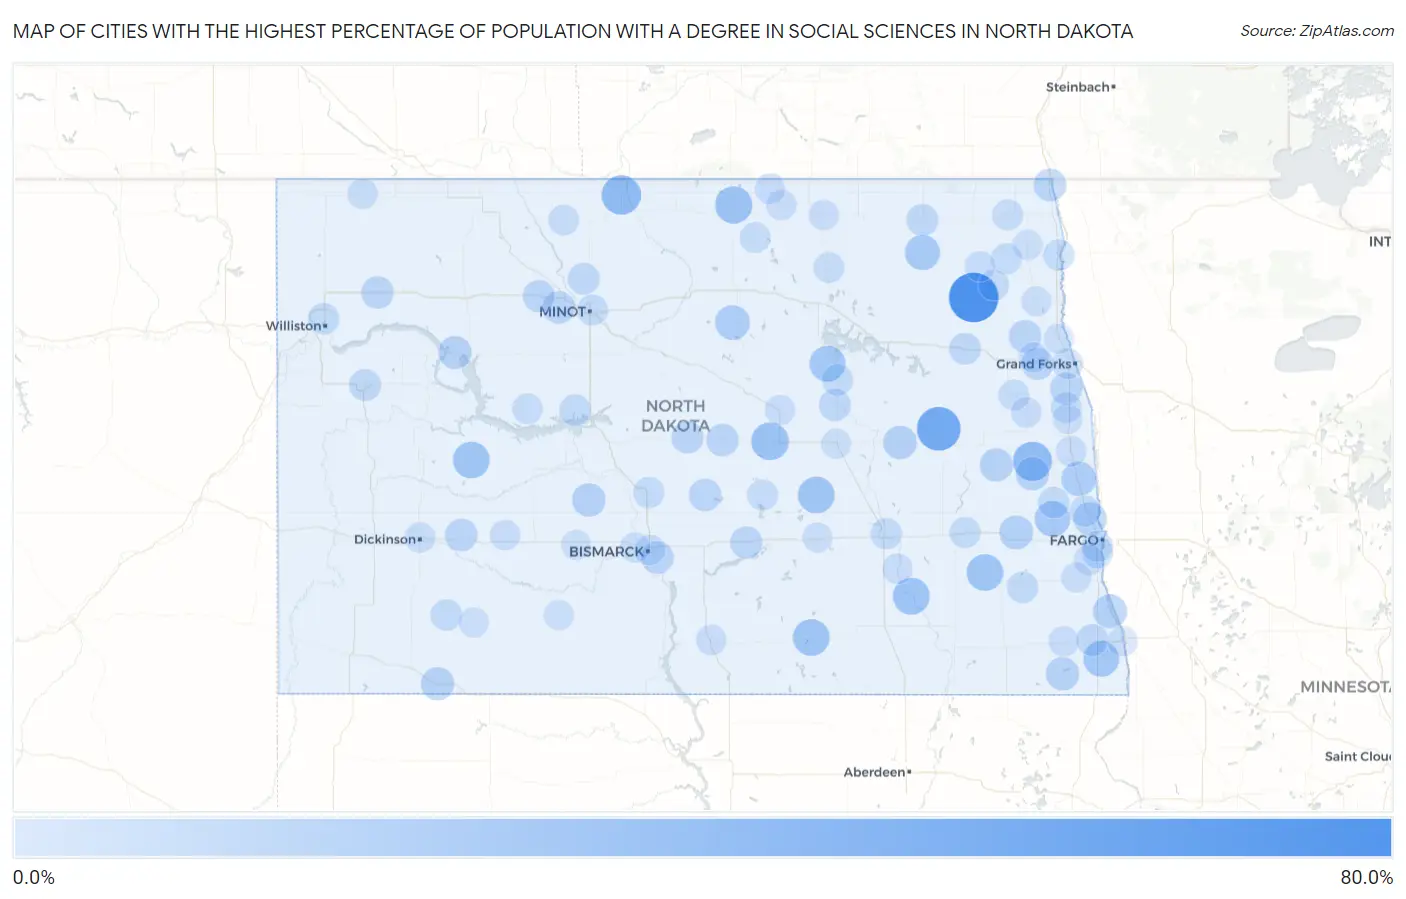
Map of Cities with the Highest Percentage of Population with a Degree in Social Sciences in North Dakota
0.0%
80.0%
Cities with the Highest Percentage of Population with a Degree in Social Sciences in North Dakota
| City | % Graduates | vs State | vs National | |
| 1. | Lankin | 71.4% | 4.3%(+67.1)#1 | 8.1%(+63.4)#80 |
| 2. | Jessie | 50.0% | 4.3%(+45.7)#2 | 8.1%(+41.9)#209 |
| 3. | Westhope | 34.1% | 4.3%(+29.8)#3 | 8.1%(+26.1)#418 |
| 4. | Clifford | 33.3% | 4.3%(+29.0)#4 | 8.1%(+25.3)#452 |
| 5. | Bowdon | 28.3% | 4.3%(+23.9)#5 | 8.1%(+20.2)#623 |
| 6. | East Dunseith | 27.3% | 4.3%(+22.9)#6 | 8.1%(+19.2)#663 |
| 7. | Dickey | 26.2% | 4.3%(+21.8)#7 | 8.1%(+18.1)#733 |
| 8. | Halliday | 25.0% | 4.3%(+20.7)#8 | 8.1%(+16.9)#803 |
| 9. | Lehr | 25.0% | 4.3%(+20.7)#9 | 8.1%(+16.9)#837 |
| 10. | Nome | 25.0% | 4.3%(+20.7)#10 | 8.1%(+16.9)#840 |
| 11. | Woodworth | 25.0% | 4.3%(+20.7)#11 | 8.1%(+16.9)#841 |
| 12. | Oberon | 22.2% | 4.3%(+17.9)#12 | 8.1%(+14.2)#1,051 |
| 13. | Great Bend | 22.2% | 4.3%(+17.9)#13 | 8.1%(+14.2)#1,052 |
| 14. | Amenia | 20.7% | 4.3%(+16.3)#14 | 8.1%(+12.6)#1,218 |
| 15. | Nekoma | 20.0% | 4.3%(+15.7)#15 | 8.1%(+11.9)#1,344 |
| 16. | Balta | 18.2% | 4.3%(+13.8)#16 | 8.1%(+10.1)#1,633 |
| 17. | Grandin | 17.6% | 4.3%(+13.3)#17 | 8.1%(+9.58)#1,719 |
| 18. | Trenton | 15.9% | 4.3%(+11.6)#18 | 8.1%(+7.87)#2,124 |
| 19. | Abercrombie | 15.6% | 4.3%(+11.3)#19 | 8.1%(+7.55)#2,204 |
| 20. | Buffalo | 15.4% | 4.3%(+11.0)#20 | 8.1%(+7.31)#2,289 |
| 21. | Glenfield | 14.3% | 4.3%(+9.94)#21 | 8.1%(+6.21)#2,677 |
| 22. | Center | 13.8% | 4.3%(+9.40)#22 | 8.1%(+5.68)#2,867 |
| 23. | Hettinger | 13.6% | 4.3%(+9.21)#23 | 8.1%(+5.49)#2,952 |
| 24. | Lidgerwood | 13.4% | 4.3%(+9.09)#24 | 8.1%(+5.36)#3,003 |
| 25. | Brooktree Park | 13.3% | 4.3%(+8.99)#25 | 8.1%(+5.26)#3,075 |
| 26. | Galesburg | 13.3% | 4.3%(+8.99)#26 | 8.1%(+5.26)#3,079 |
| 27. | Hope | 13.0% | 4.3%(+8.62)#27 | 8.1%(+4.89)#3,268 |
| 28. | New Town | 12.5% | 4.3%(+8.19)#28 | 8.1%(+4.46)#3,484 |
| 29. | Pembina | 11.1% | 4.3%(+6.77)#29 | 8.1%(+3.04)#4,433 |
| 30. | Gilby | 11.1% | 4.3%(+6.77)#30 | 8.1%(+3.04)#4,444 |
| 31. | Lincoln | 10.8% | 4.3%(+6.48)#31 | 8.1%(+2.75)#4,679 |
| 32. | Des Lacs | 10.7% | 4.3%(+6.37)#32 | 8.1%(+2.64)#4,800 |
| 33. | Taylor | 10.7% | 4.3%(+6.37)#33 | 8.1%(+2.64)#4,801 |
| 34. | Wing | 10.5% | 4.3%(+6.18)#34 | 8.1%(+2.46)#4,975 |
| 35. | Goodrich | 10.5% | 4.3%(+6.18)#35 | 8.1%(+2.46)#4,980 |
| 36. | Ray | 10.3% | 4.3%(+6.00)#36 | 8.1%(+2.27)#5,124 |
| 37. | Emerado | 10.0% | 4.3%(+5.65)#37 | 8.1%(+1.93)#5,451 |
| 38. | Steele | 9.7% | 4.3%(+5.38)#38 | 8.1%(+1.65)#5,752 |
| 39. | Thompson | 9.5% | 4.3%(+5.19)#39 | 8.1%(+1.47)#5,959 |
| 40. | Berthold | 9.5% | 4.3%(+5.11)#40 | 8.1%(+1.39)#6,045 |
| 41. | Mcclusky | 9.3% | 4.3%(+4.96)#41 | 8.1%(+1.23)#6,239 |
| 42. | New Rockford | 8.9% | 4.3%(+4.58)#42 | 8.1%(+0.857)#6,688 |
| 43. | Langdon | 8.6% | 4.3%(+4.23)#43 | 8.1%(+0.509)#7,130 |
| 44. | Minot Afb | 8.5% | 4.3%(+4.19)#44 | 8.1%(+0.468)#7,191 |
| 45. | Watford City | 8.4% | 4.3%(+4.09)#45 | 8.1%(+0.363)#7,309 |
| 46. | Mooreton | 8.3% | 4.3%(+3.99)#46 | 8.1%(+0.262)#7,462 |
| 47. | Petersburg | 8.3% | 4.3%(+3.99)#47 | 8.1%(+0.262)#7,465 |
| 48. | Williston | 7.5% | 4.3%(+3.12)#48 | 8.1%(-0.605)#8,806 |
| 49. | Arthur | 7.1% | 4.3%(+2.80)#49 | 8.1%(-0.928)#9,321 |
| 50. | Sheldon | 7.1% | 4.3%(+2.80)#50 | 8.1%(-0.928)#9,336 |
| 51. | Garrison | 7.0% | 4.3%(+2.70)#51 | 8.1%(-1.02)#9,481 |
| 52. | Regent | 6.9% | 4.3%(+2.55)#52 | 8.1%(-1.17)#9,725 |
| 53. | Jamestown | 6.5% | 4.3%(+2.20)#53 | 8.1%(-1.52)#10,295 |
| 54. | Sheyenne | 6.5% | 4.3%(+2.11)#54 | 8.1%(-1.62)#10,464 |
| 55. | Wilton | 6.4% | 4.3%(+2.08)#55 | 8.1%(-1.65)#10,511 |
| 56. | Argusville | 6.1% | 4.3%(+1.74)#56 | 8.1%(-1.98)#11,075 |
| 57. | Valley City | 5.8% | 4.3%(+1.46)#57 | 8.1%(-2.27)#11,590 |
| 58. | Frontier | 5.8% | 4.3%(+1.42)#58 | 8.1%(-2.30)#11,668 |
| 59. | Drayton | 5.8% | 4.3%(+1.41)#59 | 8.1%(-2.32)#11,685 |
| 60. | Minot | 5.7% | 4.3%(+1.38)#60 | 8.1%(-2.34)#11,723 |
| 61. | Hoople | 5.7% | 4.3%(+1.37)#61 | 8.1%(-2.36)#11,755 |
| 62. | Fargo | 5.5% | 4.3%(+1.20)#62 | 8.1%(-2.53)#12,053 |
| 63. | Cavalier | 5.3% | 4.3%(+0.935)#63 | 8.1%(-2.79)#12,508 |
| 64. | Rolette | 5.3% | 4.3%(+0.918)#64 | 8.1%(-2.81)#12,564 |
| 65. | Reynolds | 5.3% | 4.3%(+0.918)#65 | 8.1%(-2.81)#12,568 |
| 66. | Cando | 5.2% | 4.3%(+0.883)#66 | 8.1%(-2.84)#12,628 |
| 67. | Northwood | 5.2% | 4.3%(+0.875)#67 | 8.1%(-2.85)#12,642 |
| 68. | White Shield | 5.1% | 4.3%(+0.783)#68 | 8.1%(-2.94)#12,805 |
| 69. | Grand Forks | 4.7% | 4.3%(+0.379)#69 | 8.1%(-3.35)#13,498 |
| 70. | Park River | 4.7% | 4.3%(+0.371)#70 | 8.1%(-3.35)#13,511 |
| 71. | Mohall | 4.7% | 4.3%(+0.371)#71 | 8.1%(-3.35)#13,513 |
| 72. | Robinson | 4.5% | 4.3%(+0.200)#72 | 8.1%(-3.53)#13,825 |
| 73. | Linton | 4.3% | 4.3%(-0.039)#73 | 8.1%(-3.76)#14,253 |
| 74. | Hebron | 4.2% | 4.3%(-0.179)#74 | 8.1%(-3.90)#14,488 |
| 75. | Edinburg | 4.1% | 4.3%(-0.264)#75 | 8.1%(-3.99)#14,635 |
| 76. | Rolla | 4.0% | 4.3%(-0.346)#76 | 8.1%(-4.07)#14,755 |
| 77. | St John | 4.0% | 4.3%(-0.346)#77 | 8.1%(-4.07)#14,770 |
| 78. | Hillsboro | 4.0% | 4.3%(-0.365)#78 | 8.1%(-4.09)#14,798 |
| 79. | Grand Forks Afb | 3.9% | 4.3%(-0.409)#79 | 8.1%(-4.13)#14,860 |
| 80. | Hatton | 3.9% | 4.3%(-0.462)#80 | 8.1%(-4.19)#14,960 |
| 81. | Wyndmere | 3.9% | 4.3%(-0.470)#81 | 8.1%(-4.20)#14,970 |
| 82. | Bismarck | 3.8% | 4.3%(-0.505)#82 | 8.1%(-4.23)#15,036 |
| 83. | Horace | 3.8% | 4.3%(-0.529)#83 | 8.1%(-4.25)#15,076 |
| 84. | Dickinson | 3.8% | 4.3%(-0.587)#84 | 8.1%(-4.31)#15,183 |
| 85. | Rocklake | 3.7% | 4.3%(-0.642)#85 | 8.1%(-4.37)#15,304 |
| 86. | Montpelier | 3.7% | 4.3%(-0.642)#86 | 8.1%(-4.37)#15,305 |
| 87. | Crosby | 3.6% | 4.3%(-0.709)#87 | 8.1%(-4.43)#15,396 |
| 88. | Fessenden | 3.5% | 4.3%(-0.837)#88 | 8.1%(-4.56)#15,627 |
| 89. | Kindred | 3.3% | 4.3%(-1.04)#89 | 8.1%(-4.76)#15,945 |
| 90. | New Salem | 3.3% | 4.3%(-1.07)#90 | 8.1%(-4.79)#16,000 |
| 91. | St Thomas | 3.2% | 4.3%(-1.12)#91 | 8.1%(-4.85)#16,088 |
| 92. | Carrington | 3.2% | 4.3%(-1.13)#92 | 8.1%(-4.85)#16,102 |
| 93. | Mott | 2.9% | 4.3%(-1.40)#93 | 8.1%(-5.13)#16,537 |
| 94. | Buxton | 2.9% | 4.3%(-1.40)#94 | 8.1%(-5.13)#16,540 |
| 95. | Medina | 2.9% | 4.3%(-1.40)#95 | 8.1%(-5.13)#16,546 |
| 96. | Wahpeton | 2.9% | 4.3%(-1.48)#96 | 8.1%(-5.21)#16,647 |
| 97. | Carson | 2.9% | 4.3%(-1.49)#97 | 8.1%(-5.21)#16,675 |
| 98. | Minto | 2.8% | 4.3%(-1.57)#98 | 8.1%(-5.29)#16,798 |
| 99. | Manvel | 2.8% | 4.3%(-1.57)#99 | 8.1%(-5.29)#16,804 |
| 100. | Mandan | 2.8% | 4.3%(-1.57)#100 | 8.1%(-5.30)#16,815 |
Common Questions
What are the Top 10 Cities with the Highest Percentage of Population with a Degree in Social Sciences in North Dakota?
Top 10 Cities with the Highest Percentage of Population with a Degree in Social Sciences in North Dakota are:
What city has the Highest Percentage of Population with a Degree in Social Sciences in North Dakota?
Lankin has the Highest Percentage of Population with a Degree in Social Sciences in North Dakota with 71.4%.
What is the Percentage of Population with a Degree in Social Sciences in the State of North Dakota?
Percentage of Population with a Degree in Social Sciences in North Dakota is 4.3%.
What is the Percentage of Population with a Degree in Social Sciences in the United States?
Percentage of Population with a Degree in Social Sciences in the United States is 8.1%.