Stanton, ND Map & Demographics
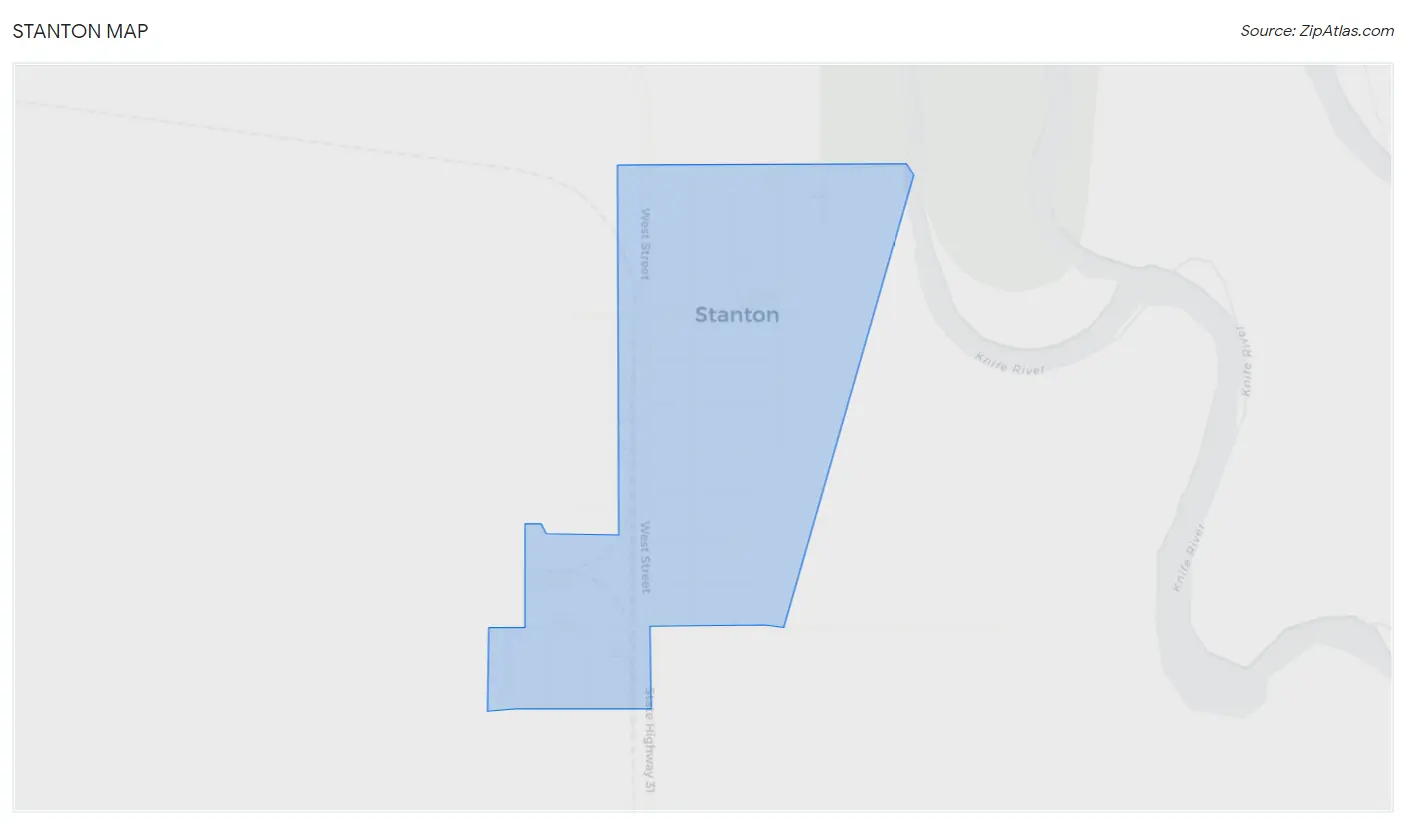
Stanton Map
Stanton Overview
$33,479
PER CAPITA INCOME
$56,042
AVG HOUSEHOLD INCOME
60.8%
WAGE / INCOME GAP [ % ]
39.2¢/ $1
WAGE / INCOME GAP [ $ ]
0.49
INEQUALITY / GINI INDEX
548
TOTAL POPULATION
265
MALE POPULATION
283
FEMALE POPULATION
93.64
MALES / 100 FEMALES
106.79
FEMALES / 100 MALES
39.0
MEDIAN AGE
3.3
AVG FAMILY SIZE
2.6
AVG HOUSEHOLD SIZE
226
LABOR FORCE [ PEOPLE ]
55.3%
PERCENT IN LABOR FORCE
2.7%
UNEMPLOYMENT RATE
Stanton Zip Codes
Stanton Area Codes
Income in Stanton
Income Overview in Stanton
| Characteristic | Number | Measure |
| Per Capita Income | 548 | $33,479 |
| Median Family Income | 123 | $0 |
| Mean Family Income | 123 | $89,329 |
| Median Household Income | 206 | $56,042 |
| Mean Household Income | 206 | $79,120 |
| Income Deficit | 123 | $0 |
| Wage / Income Gap (%) | 548 | 60.79% |
| Wage / Income Gap ($) | 548 | 39.21¢ per $1 |
| Gini / Inequality Index | 548 | 0.49 |
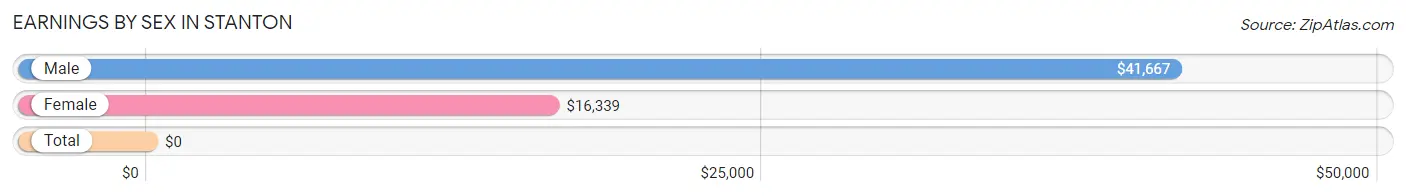
Earnings by Sex in Stanton
| Sex | Number | Average Earnings |
| Male | 106 (44.2%) | $41,667 |
| Female | 134 (55.8%) | $16,339 |
| Total | 240 (100.0%) | $0 |
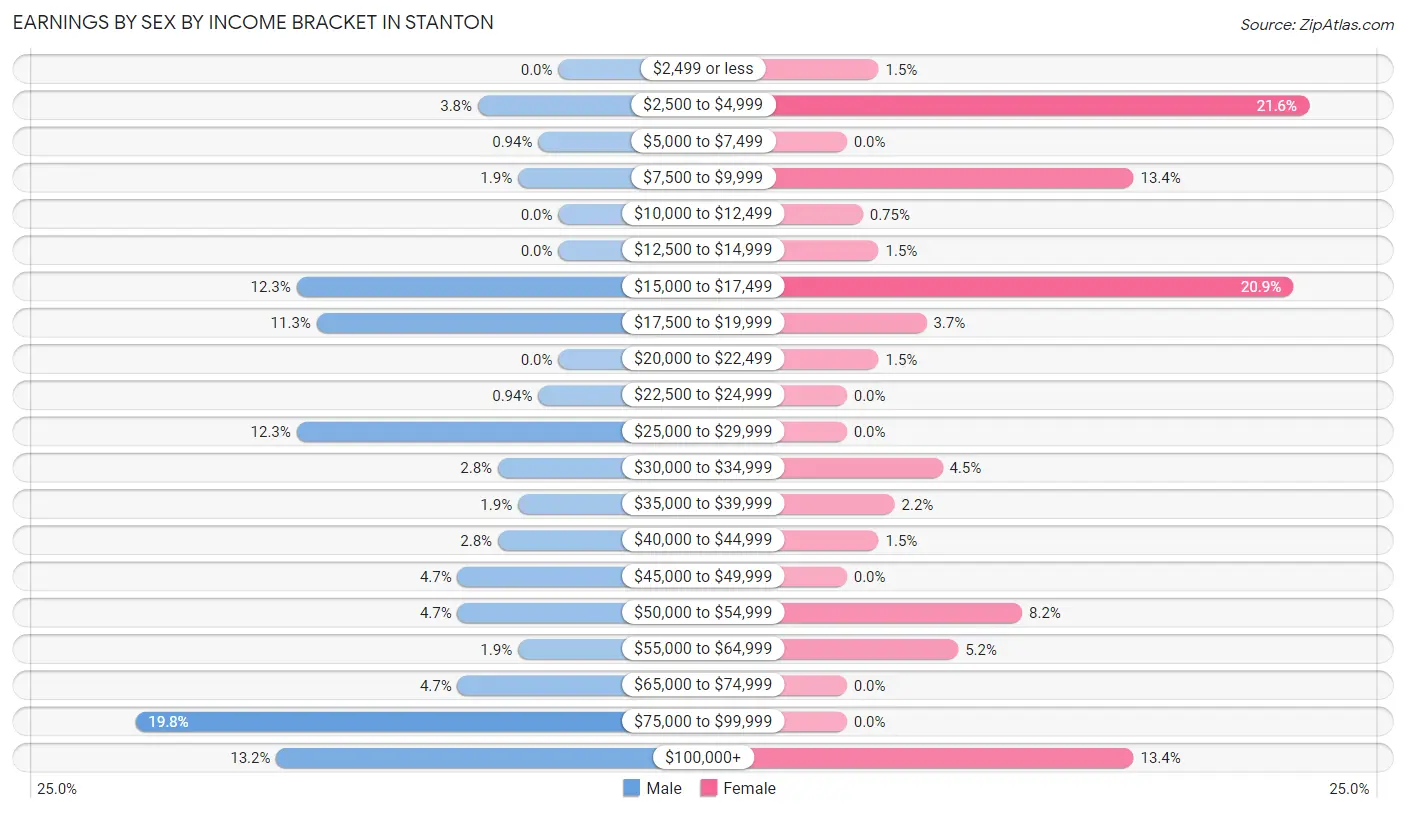
Earnings by Sex by Income Bracket in Stanton
The most common earnings brackets in Stanton are $75,000 to $99,999 for men (21 | 19.8%) and $2,500 to $4,999 for women (29 | 21.6%).
| Income | Male | Female |
| $2,499 or less | 0 (0.0%) | 2 (1.5%) |
| $2,500 to $4,999 | 4 (3.8%) | 29 (21.6%) |
| $5,000 to $7,499 | 1 (0.9%) | 0 (0.0%) |
| $7,500 to $9,999 | 2 (1.9%) | 18 (13.4%) |
| $10,000 to $12,499 | 0 (0.0%) | 1 (0.7%) |
| $12,500 to $14,999 | 0 (0.0%) | 2 (1.5%) |
| $15,000 to $17,499 | 13 (12.3%) | 28 (20.9%) |
| $17,500 to $19,999 | 12 (11.3%) | 5 (3.7%) |
| $20,000 to $22,499 | 0 (0.0%) | 2 (1.5%) |
| $22,500 to $24,999 | 1 (0.9%) | 0 (0.0%) |
| $25,000 to $29,999 | 13 (12.3%) | 0 (0.0%) |
| $30,000 to $34,999 | 3 (2.8%) | 6 (4.5%) |
| $35,000 to $39,999 | 2 (1.9%) | 3 (2.2%) |
| $40,000 to $44,999 | 3 (2.8%) | 2 (1.5%) |
| $45,000 to $49,999 | 5 (4.7%) | 0 (0.0%) |
| $50,000 to $54,999 | 5 (4.7%) | 11 (8.2%) |
| $55,000 to $64,999 | 2 (1.9%) | 7 (5.2%) |
| $65,000 to $74,999 | 5 (4.7%) | 0 (0.0%) |
| $75,000 to $99,999 | 21 (19.8%) | 0 (0.0%) |
| $100,000+ | 14 (13.2%) | 18 (13.4%) |
| Total | 106 (100.0%) | 134 (100.0%) |
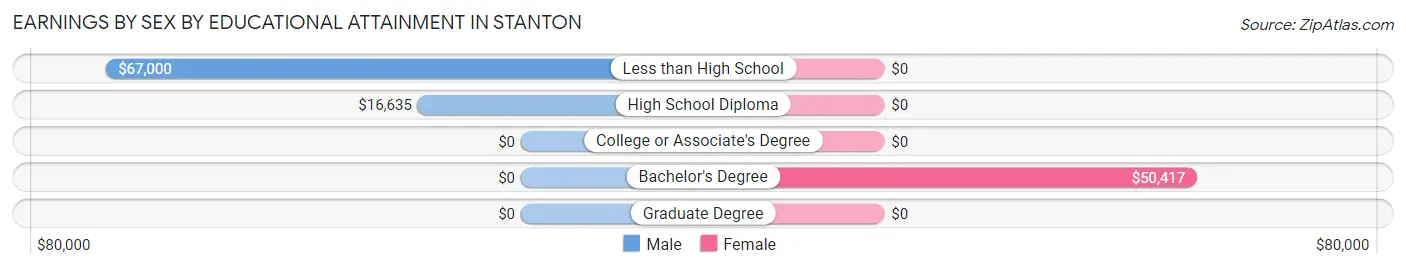
Earnings by Sex by Educational Attainment in Stanton
| Educational Attainment | Male Income | Female Income |
| Less than High School | $67,000 | $0 |
| High School Diploma | $16,635 | $0 |
| College or Associate's Degree | - | - |
| Bachelor's Degree | - | - |
| Graduate Degree | - | - |
| Total | $47,813 | $0 |
Family Income in Stanton
Family Income Brackets in Stanton
According to the Stanton family income data, there are 32 families falling into the $35,000 to $49,999 income range, which is the most common income bracket and makes up 26.0% of all families.
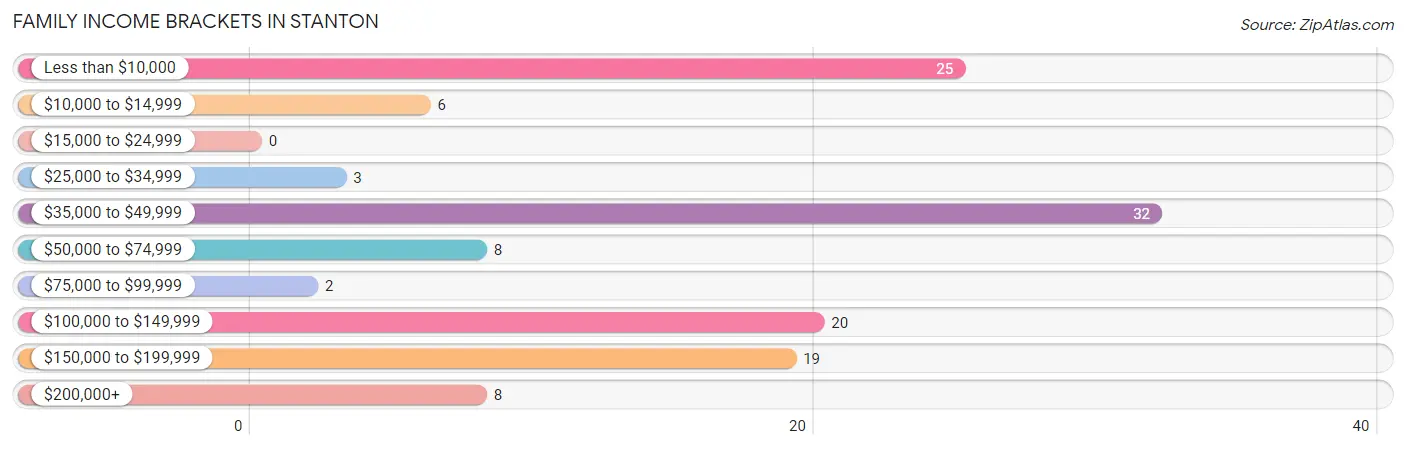
| Income Bracket | # Families | % Families |
| Less than $10,000 | 25 | 20.3% |
| $10,000 to $14,999 | 6 | 4.9% |
| $15,000 to $24,999 | 0 | 0.0% |
| $25,000 to $34,999 | 3 | 2.4% |
| $35,000 to $49,999 | 32 | 26.0% |
| $50,000 to $74,999 | 8 | 6.5% |
| $75,000 to $99,999 | 2 | 1.6% |
| $100,000 to $149,999 | 20 | 16.3% |
| $150,000 to $199,999 | 19 | 15.4% |
| $200,000+ | 8 | 6.5% |
Family Income by Famaliy Size in Stanton
4-person families (15 | 12.2%) account for the highest median family income in Stanton with $151,042 per family, while 4-person families (15 | 12.2%) have the highest median income of $37,760 per family member.
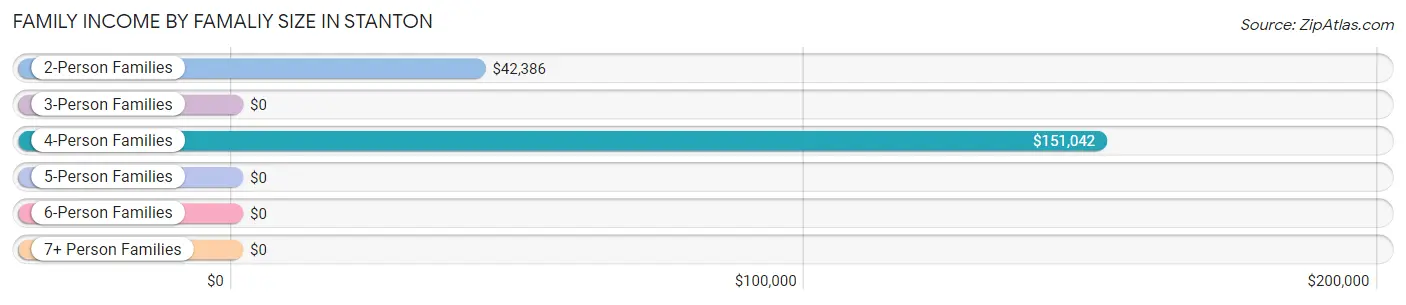
| Income Bracket | # Families | Median Income |
| 2-Person Families | 65 (52.8%) | $42,386 |
| 3-Person Families | 20 (16.3%) | $0 |
| 4-Person Families | 15 (12.2%) | $151,042 |
| 5-Person Families | 22 (17.9%) | $0 |
| 6-Person Families | 1 (0.8%) | $0 |
| 7+ Person Families | 0 (0.0%) | $0 |
| Total | 123 (100.0%) | $0 |
Family Income by Number of Earners in Stanton
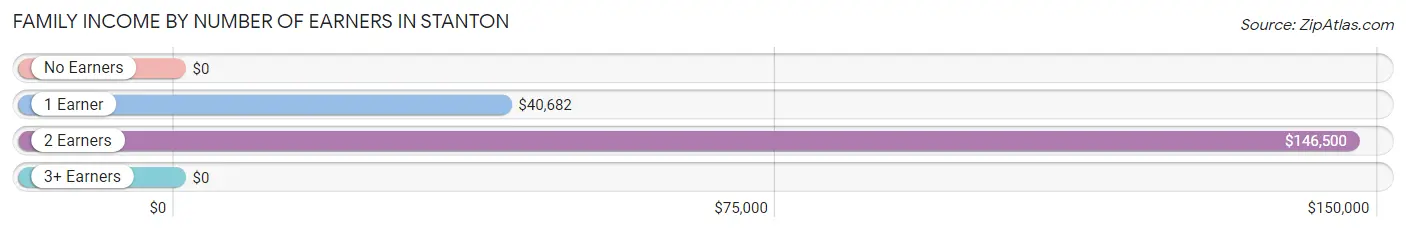
| Number of Earners | # Families | Median Income |
| No Earners | 29 (23.6%) | $0 |
| 1 Earner | 46 (37.4%) | $40,682 |
| 2 Earners | 48 (39.0%) | $146,500 |
| 3+ Earners | 0 (0.0%) | $0 |
| Total | 123 (100.0%) | $0 |
Household Income in Stanton
Household Income Brackets in Stanton
With 40 households falling in the category, the $50,000 to $74,999 income range is the most frequent in Stanton, accounting for 19.4% of all households. In contrast, only 6 households (2.9%) fall into the $10,000 to $14,999 income bracket, making it the least populous group.
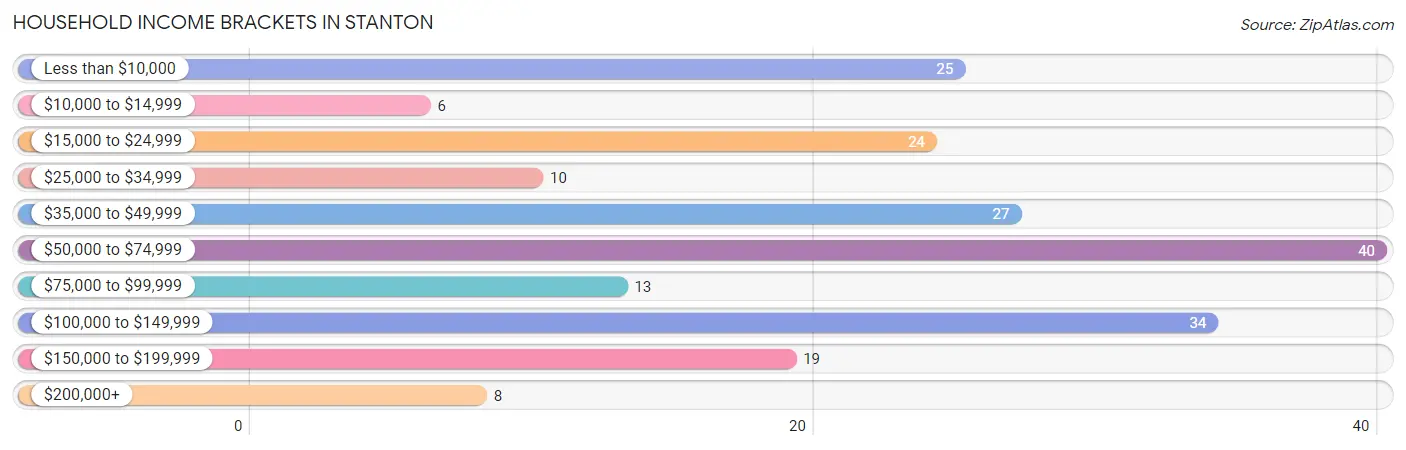
| Income Bracket | # Households | % Households |
| Less than $10,000 | 25 | 12.1% |
| $10,000 to $14,999 | 6 | 2.9% |
| $15,000 to $24,999 | 24 | 11.7% |
| $25,000 to $34,999 | 10 | 4.9% |
| $35,000 to $49,999 | 27 | 13.1% |
| $50,000 to $74,999 | 40 | 19.4% |
| $75,000 to $99,999 | 13 | 6.3% |
| $100,000 to $149,999 | 34 | 16.5% |
| $150,000 to $199,999 | 19 | 9.2% |
| $200,000+ | 8 | 3.9% |
Household Income by Householder Age in Stanton
The median household income in Stanton is $56,042, with the highest median household income of $51,250 found in the 65+ years age bracket for the primary householder. A total of 78 households (37.9%) fall into this category. Meanwhile, the 15 to 24 years age bracket for the primary householder has the lowest median household income of $0, with 1 households (0.5%) in this group.
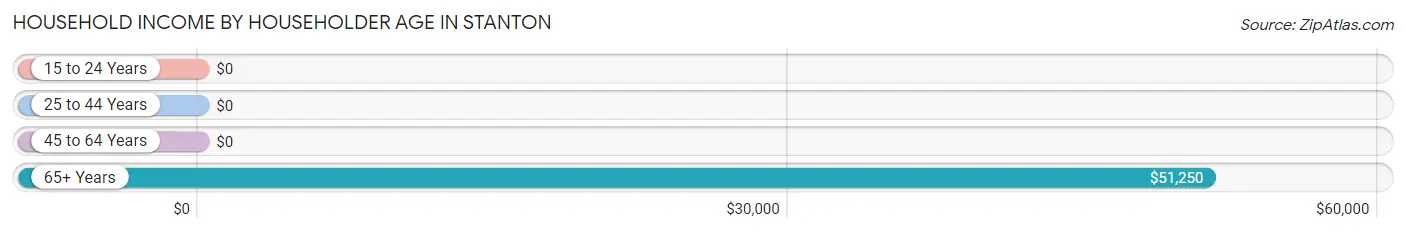
| Income Bracket | # Households | Median Income |
| 15 to 24 Years | 1 (0.5%) | $0 |
| 25 to 44 Years | 66 (32.0%) | $0 |
| 45 to 64 Years | 61 (29.6%) | $0 |
| 65+ Years | 78 (37.9%) | $51,250 |
| Total | 206 (100.0%) | $56,042 |
Poverty in Stanton
Income Below Poverty by Sex and Age in Stanton
With 11.9% poverty level for males and 17.1% for females among the residents of Stanton, 16 and 17 year old males and 6 to 11 year old females are the most vulnerable to poverty, with 17 males (100.0%) and 16 females (44.4%) in their respective age groups living below the poverty level.
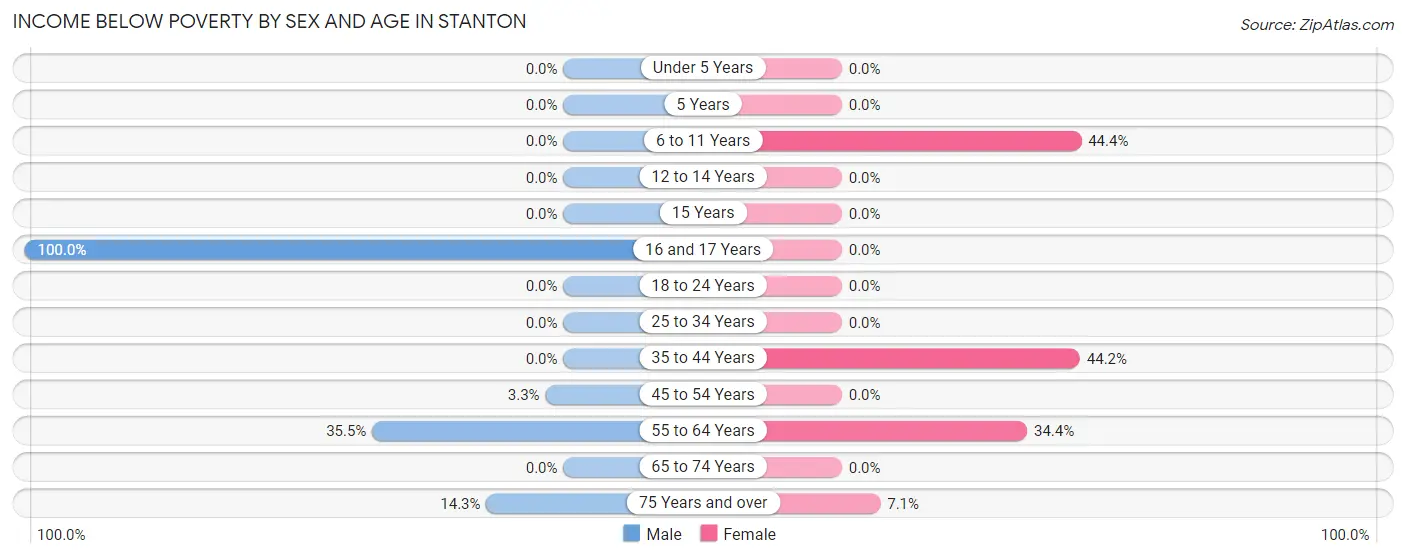
| Age Bracket | Male | Female |
| Under 5 Years | 0 (0.0%) | 0 (0.0%) |
| 5 Years | 0 (0.0%) | 0 (0.0%) |
| 6 to 11 Years | 0 (0.0%) | 16 (44.4%) |
| 12 to 14 Years | 0 (0.0%) | 0 (0.0%) |
| 15 Years | 0 (0.0%) | 0 (0.0%) |
| 16 and 17 Years | 17 (100.0%) | 0 (0.0%) |
| 18 to 24 Years | 0 (0.0%) | 0 (0.0%) |
| 25 to 34 Years | 0 (0.0%) | 0 (0.0%) |
| 35 to 44 Years | 0 (0.0%) | 19 (44.2%) |
| 45 to 54 Years | 1 (3.3%) | 0 (0.0%) |
| 55 to 64 Years | 11 (35.5%) | 11 (34.4%) |
| 65 to 74 Years | 0 (0.0%) | 0 (0.0%) |
| 75 Years and over | 1 (14.3%) | 2 (7.1%) |
| Total | 30 (11.9%) | 48 (17.1%) |
Income Above Poverty by Sex and Age in Stanton
According to the poverty statistics in Stanton, males aged under 5 years and females aged under 5 years are the age groups that are most secure financially, with 100.0% of males and 100.0% of females in these age groups living above the poverty line.
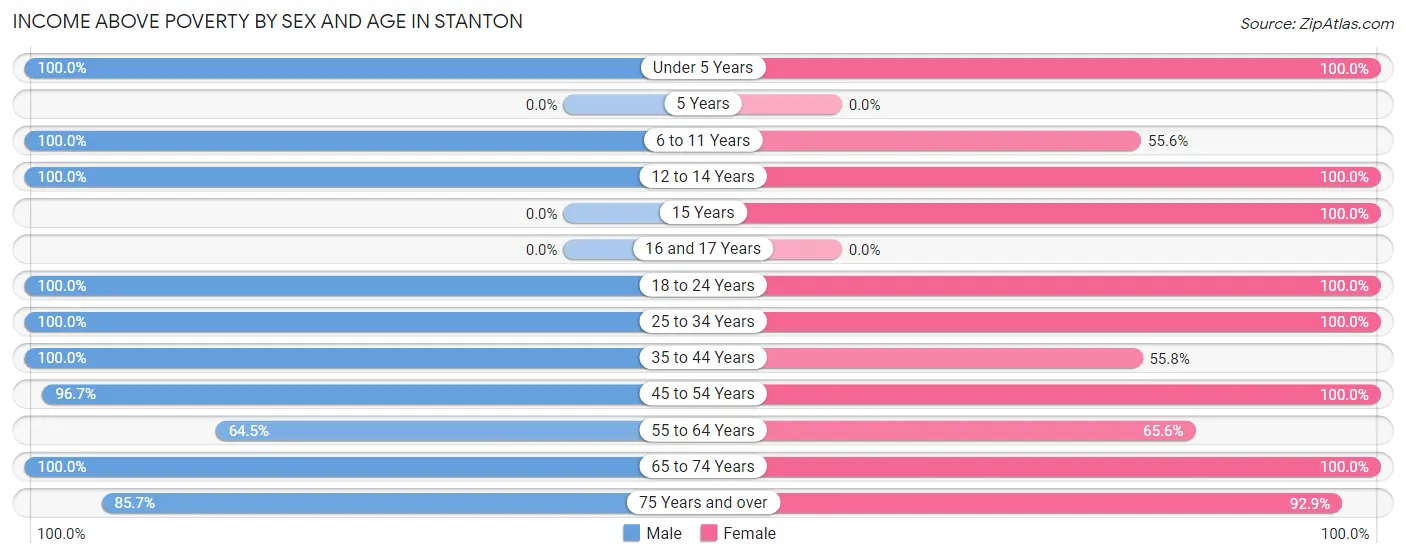
| Age Bracket | Male | Female |
| Under 5 Years | 37 (100.0%) | 4 (100.0%) |
| 5 Years | 0 (0.0%) | 0 (0.0%) |
| 6 to 11 Years | 28 (100.0%) | 20 (55.6%) |
| 12 to 14 Years | 11 (100.0%) | 13 (100.0%) |
| 15 Years | 0 (0.0%) | 10 (100.0%) |
| 16 and 17 Years | 0 (0.0%) | 0 (0.0%) |
| 18 to 24 Years | 3 (100.0%) | 25 (100.0%) |
| 25 to 34 Years | 13 (100.0%) | 39 (100.0%) |
| 35 to 44 Years | 31 (100.0%) | 24 (55.8%) |
| 45 to 54 Years | 29 (96.7%) | 17 (100.0%) |
| 55 to 64 Years | 20 (64.5%) | 21 (65.6%) |
| 65 to 74 Years | 44 (100.0%) | 33 (100.0%) |
| 75 Years and over | 6 (85.7%) | 26 (92.9%) |
| Total | 222 (88.1%) | 232 (82.9%) |
Income Below Poverty Among Married-Couple Families in Stanton
The poverty statistics for married-couple families in Stanton show that 12.9% or 12 of the total 93 families live below the poverty line. Families with no children have the highest poverty rate of 23.5%, comprising of 12 families. On the other hand, families with 1 or 2 children have the lowest poverty rate of 0.0%, which includes 0 families.
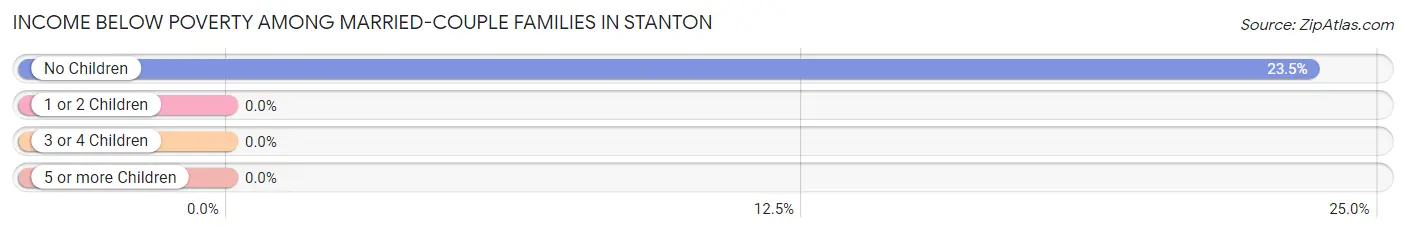
| Children | Above Poverty | Below Poverty |
| No Children | 39 (76.5%) | 12 (23.5%) |
| 1 or 2 Children | 33 (100.0%) | 0 (0.0%) |
| 3 or 4 Children | 9 (100.0%) | 0 (0.0%) |
| 5 or more Children | 0 (0.0%) | 0 (0.0%) |
| Total | 81 (87.1%) | 12 (12.9%) |
Income Below Poverty Among Single-Parent Households in Stanton
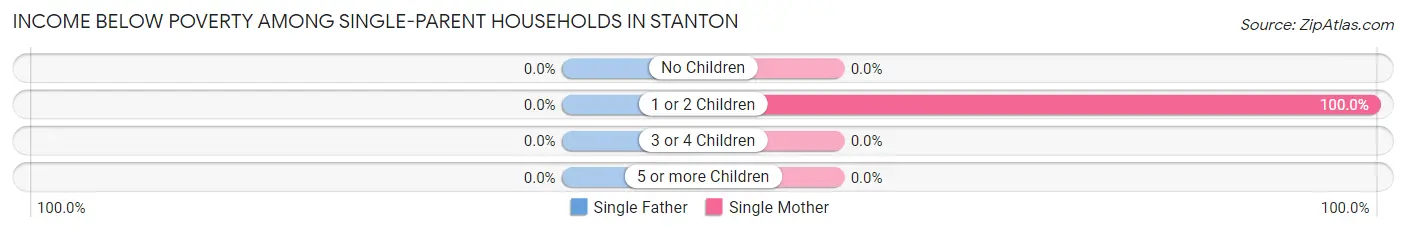
| Children | Single Father | Single Mother |
| No Children | 0 (0.0%) | 0 (0.0%) |
| 1 or 2 Children | 0 (0.0%) | 19 (100.0%) |
| 3 or 4 Children | 0 (0.0%) | 0 (0.0%) |
| 5 or more Children | 0 (0.0%) | 0 (0.0%) |
| Total | 0 (0.0%) | 19 (100.0%) |
Income Below Poverty Among Married-Couple vs Single-Parent Households in Stanton
The poverty data for Stanton shows that 12 of the married-couple family households (12.9%) and 19 of the single-parent households (63.3%) are living below the poverty level. Within the married-couple family households, those with no children have the highest poverty rate, with 12 households (23.5%) falling below the poverty line. Among the single-parent households, those with 1 or 2 children have the highest poverty rate, with 19 household (63.3%) living below poverty.
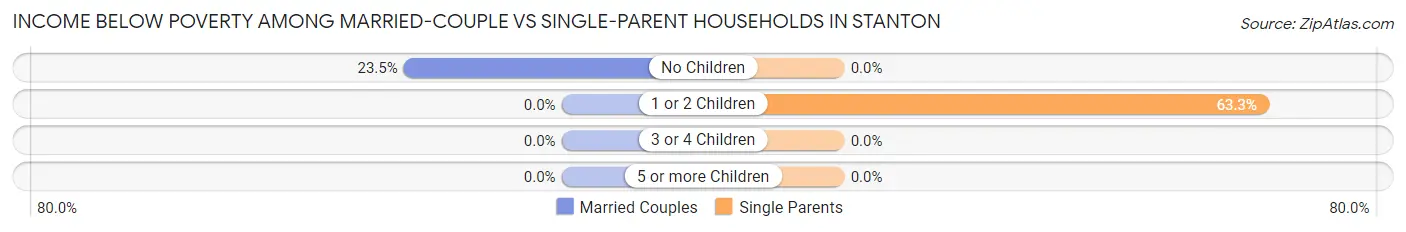
| Children | Married-Couple Families | Single-Parent Households |
| No Children | 12 (23.5%) | 0 (0.0%) |
| 1 or 2 Children | 0 (0.0%) | 19 (63.3%) |
| 3 or 4 Children | 0 (0.0%) | 0 (0.0%) |
| 5 or more Children | 0 (0.0%) | 0 (0.0%) |
| Total | 12 (12.9%) | 19 (63.3%) |
Race in Stanton
The most populous races in Stanton are White / Caucasian (531 | 96.9%), Hispanic or Latino (9 | 1.6%), and Two or more Races (9 | 1.6%).
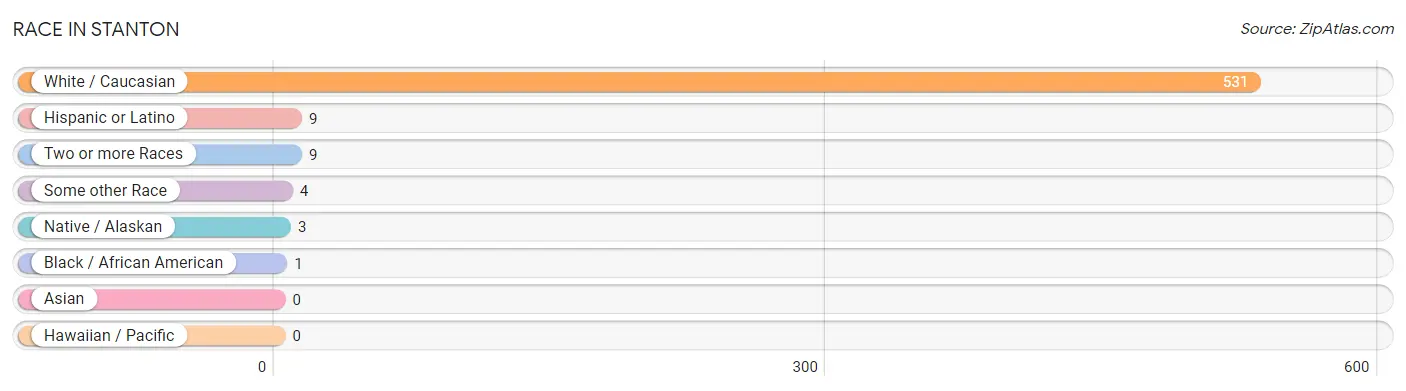
| Race | # Population | % Population |
| Asian | 0 | 0.0% |
| Black / African American | 1 | 0.2% |
| Hawaiian / Pacific | 0 | 0.0% |
| Hispanic or Latino | 9 | 1.6% |
| Native / Alaskan | 3 | 0.5% |
| White / Caucasian | 531 | 96.9% |
| Two or more Races | 9 | 1.6% |
| Some other Race | 4 | 0.7% |
| Total | 548 | 100.0% |
Ancestry in Stanton
The most populous ancestries reported in Stanton are German (261 | 47.6%), Norwegian (90 | 16.4%), English (25 | 4.6%), Russian (25 | 4.6%), and Polish (22 | 4.0%), together accounting for 77.2% of all Stanton residents.
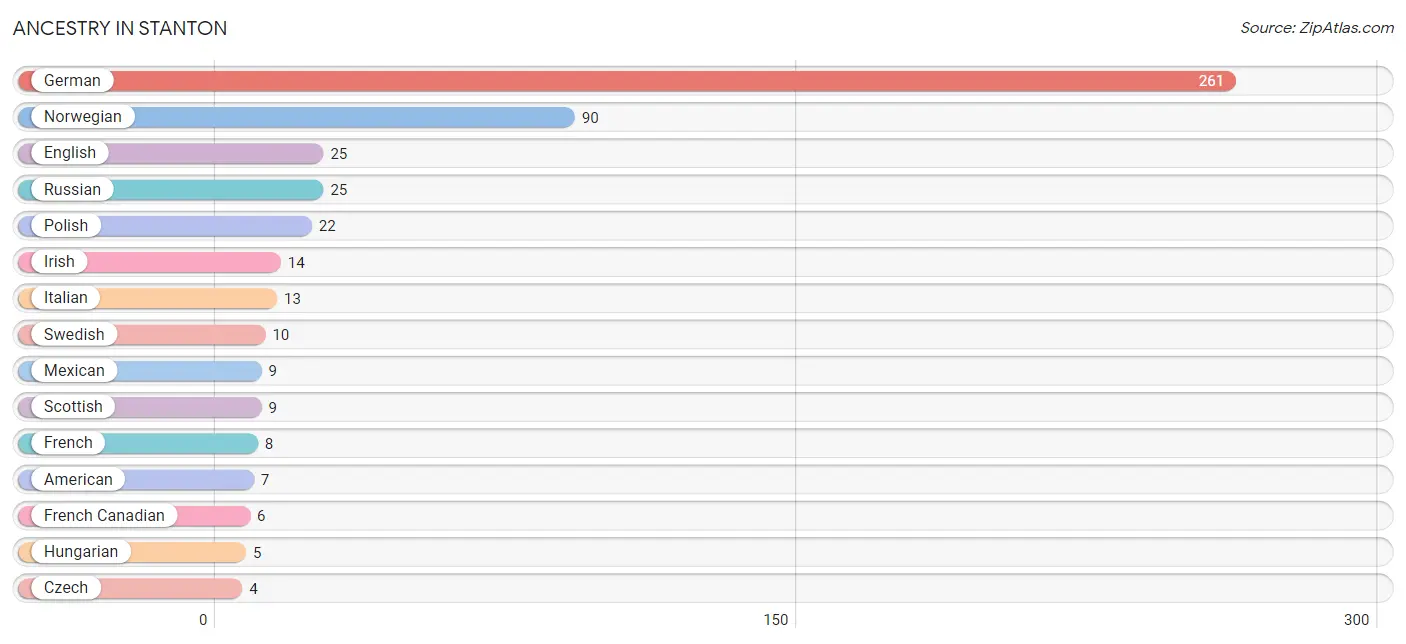
| Ancestry | # Population | % Population |
| American | 7 | 1.3% |
| Austrian | 1 | 0.2% |
| Chippewa | 2 | 0.4% |
| Czech | 4 | 0.7% |
| Dutch | 1 | 0.2% |
| English | 25 | 4.6% |
| French | 8 | 1.5% |
| French Canadian | 6 | 1.1% |
| German | 261 | 47.6% |
| Hungarian | 5 | 0.9% |
| Irish | 14 | 2.5% |
| Israeli | 1 | 0.2% |
| Italian | 13 | 2.4% |
| Mexican | 9 | 1.6% |
| Norwegian | 90 | 16.4% |
| Polish | 22 | 4.0% |
| Russian | 25 | 4.6% |
| Scottish | 9 | 1.6% |
| Sioux | 1 | 0.2% |
| Swedish | 10 | 1.8% |
| Ukrainian | 2 | 0.4% |
| Welsh | 2 | 0.4% | View All 22 Rows |
Immigrants in Stanton

| Immigration Origin | # Population | % Population | View All 0 Rows |
Sex and Age in Stanton
Sex and Age in Stanton
The most populous age groups in Stanton are Under 5 Years (37 | 14.0%) for men and 30 to 34 Years (39 | 13.8%) for women.
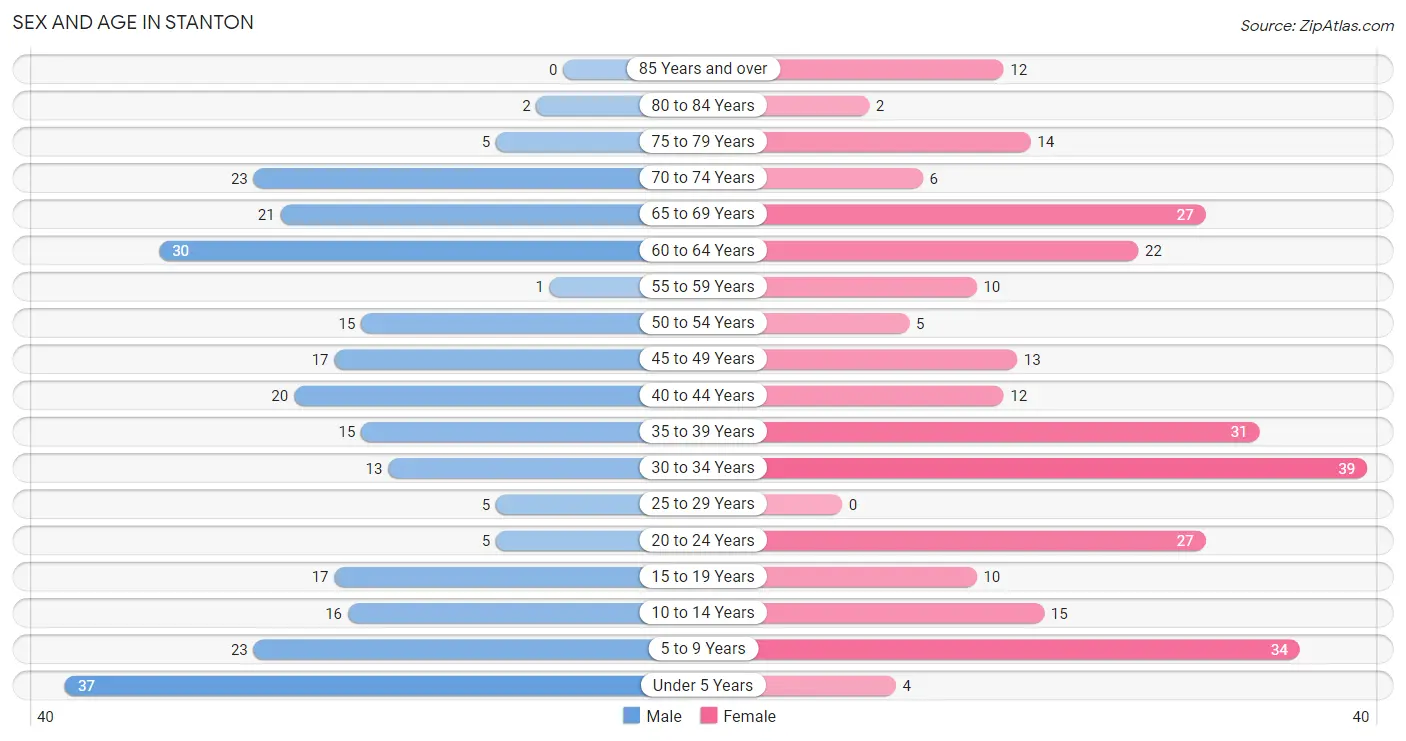
| Age Bracket | Male | Female |
| Under 5 Years | 37 (14.0%) | 4 (1.4%) |
| 5 to 9 Years | 23 (8.7%) | 34 (12.0%) |
| 10 to 14 Years | 16 (6.0%) | 15 (5.3%) |
| 15 to 19 Years | 17 (6.4%) | 10 (3.5%) |
| 20 to 24 Years | 5 (1.9%) | 27 (9.5%) |
| 25 to 29 Years | 5 (1.9%) | 0 (0.0%) |
| 30 to 34 Years | 13 (4.9%) | 39 (13.8%) |
| 35 to 39 Years | 15 (5.7%) | 31 (11.0%) |
| 40 to 44 Years | 20 (7.5%) | 12 (4.2%) |
| 45 to 49 Years | 17 (6.4%) | 13 (4.6%) |
| 50 to 54 Years | 15 (5.7%) | 5 (1.8%) |
| 55 to 59 Years | 1 (0.4%) | 10 (3.5%) |
| 60 to 64 Years | 30 (11.3%) | 22 (7.8%) |
| 65 to 69 Years | 21 (7.9%) | 27 (9.5%) |
| 70 to 74 Years | 23 (8.7%) | 6 (2.1%) |
| 75 to 79 Years | 5 (1.9%) | 14 (5.0%) |
| 80 to 84 Years | 2 (0.7%) | 2 (0.7%) |
| 85 Years and over | 0 (0.0%) | 12 (4.2%) |
| Total | 265 (100.0%) | 283 (100.0%) |
Families and Households in Stanton
Median Family Size in Stanton
The median family size in Stanton is 3.33 persons per family, with single male/father families (11 | 8.9%) accounting for the largest median family size of 3.82 persons per family. On the other hand, single female/mother families (19 | 15.4%) represent the smallest median family size with 2.74 persons per family.
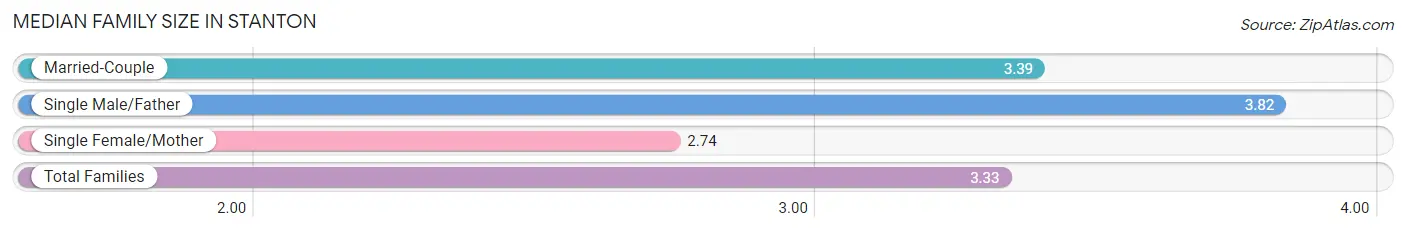
| Family Type | # Families | Family Size |
| Married-Couple | 93 (75.6%) | 3.39 |
| Single Male/Father | 11 (8.9%) | 3.82 |
| Single Female/Mother | 19 (15.4%) | 2.74 |
| Total Families | 123 (100.0%) | 3.33 |
Median Household Size in Stanton
The median household size in Stanton is 2.58 persons per household, with single male/father households (11 | 5.3%) accounting for the largest median household size of 6 persons per household. non-family households (83 | 40.3%) represent the smallest median household size with 1.19 persons per household.
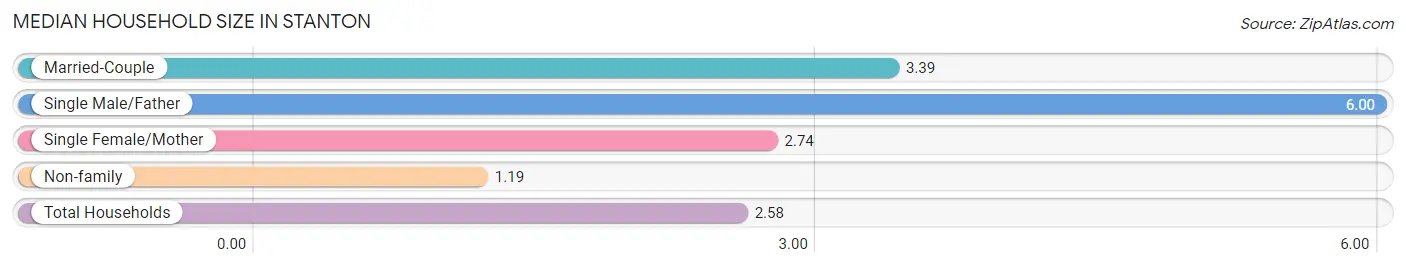
| Household Type | # Households | Household Size |
| Married-Couple | 93 (45.2%) | 3.39 |
| Single Male/Father | 11 (5.3%) | 6.00 |
| Single Female/Mother | 19 (9.2%) | 2.74 |
| Non-family | 83 (40.3%) | 1.19 |
| Total Households | 206 (100.0%) | 2.58 |
Household Size by Marriage Status in Stanton
Out of a total of 206 households in Stanton, 123 (59.7%) are family households, while 83 (40.3%) are nonfamily households. The most numerous type of family households are 2-person households, comprising 54, and the most common type of nonfamily households are 1-person households, comprising 65.
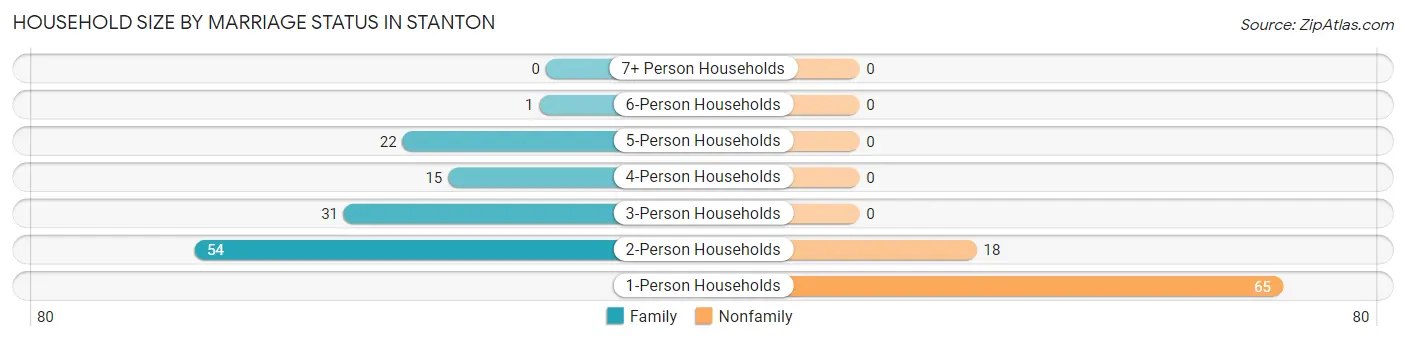
| Household Size | Family Households | Nonfamily Households |
| 1-Person Households | - | 65 (31.6%) |
| 2-Person Households | 54 (26.2%) | 18 (8.7%) |
| 3-Person Households | 31 (15.0%) | 0 (0.0%) |
| 4-Person Households | 15 (7.3%) | 0 (0.0%) |
| 5-Person Households | 22 (10.7%) | 0 (0.0%) |
| 6-Person Households | 1 (0.5%) | 0 (0.0%) |
| 7+ Person Households | 0 (0.0%) | 0 (0.0%) |
| Total | 123 (59.7%) | 83 (40.3%) |
Female Fertility in Stanton
Fertility by Age in Stanton
Average fertility rate in Stanton is 8.0 births per 1,000 women. Women in the age bracket of 20 to 34 years have the highest fertility rate with 15.0 births per 1,000 women. Women in the age bracket of 20 to 34 years acount for 100.0% of all women with births.
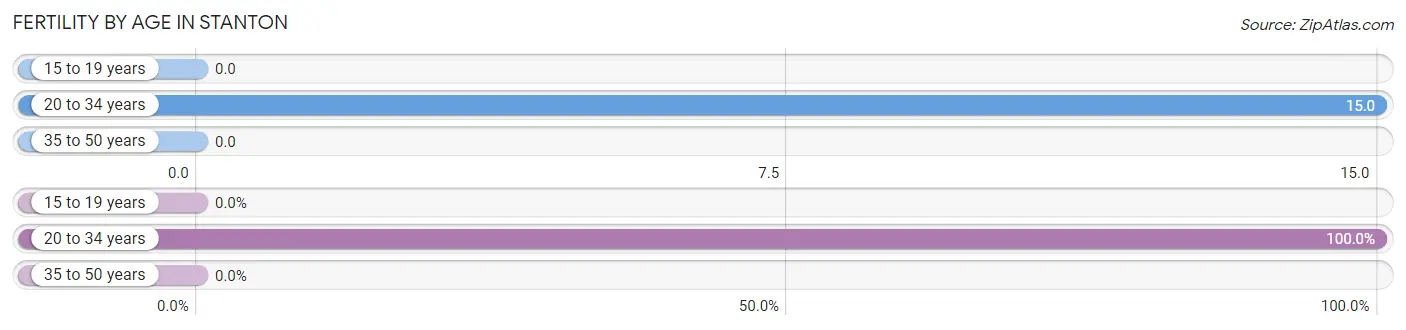
| Age Bracket | Women with Births | Births / 1,000 Women |
| 15 to 19 years | 0 (0.0%) | 0.0 |
| 20 to 34 years | 1 (100.0%) | 15.0 |
| 35 to 50 years | 0 (0.0%) | 0.0 |
| Total | 1 (100.0%) | 8.0 |
Fertility by Age by Marriage Status in Stanton
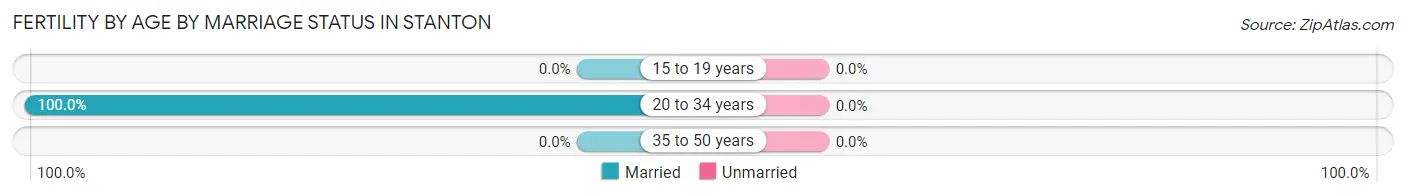
| Age Bracket | Married | Unmarried |
| 15 to 19 years | 0 (0.0%) | 0 (0.0%) |
| 20 to 34 years | 1 (100.0%) | 0 (0.0%) |
| 35 to 50 years | 0 (0.0%) | 0 (0.0%) |
| Total | 1 (100.0%) | 0 (0.0%) |
Fertility by Education in Stanton
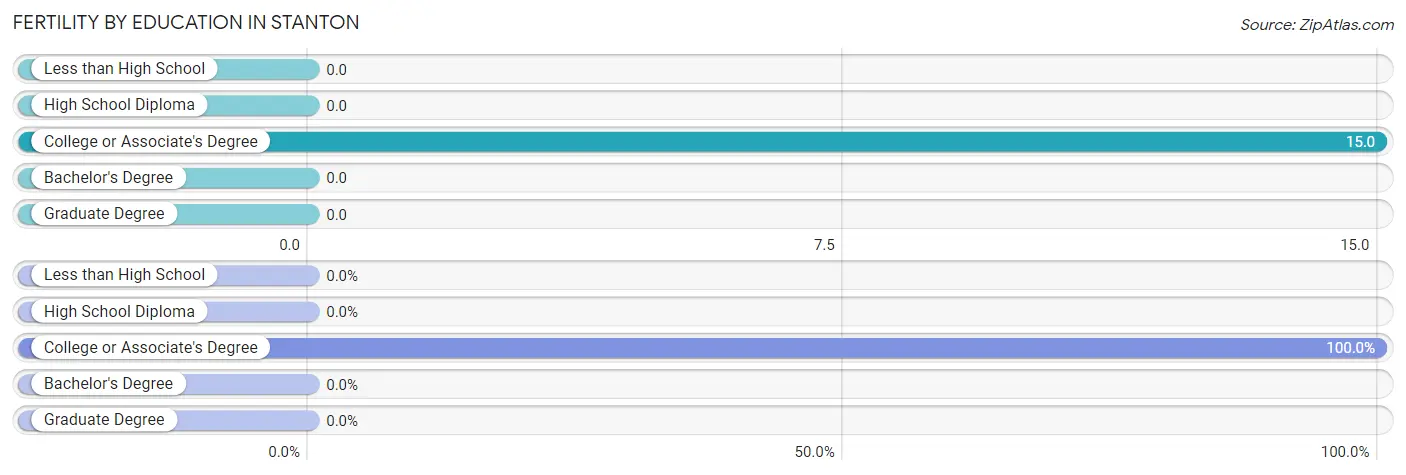
| Educational Attainment | Women with Births | Births / 1,000 Women |
| Less than High School | 0 (0.0%) | 0.0 |
| High School Diploma | 0 (0.0%) | 0.0 |
| College or Associate's Degree | 1 (100.0%) | 15.0 |
| Bachelor's Degree | 0 (0.0%) | 0.0 |
| Graduate Degree | 0 (0.0%) | 0.0 |
| Total | 1 (100.0%) | 8.0 |
Fertility by Education by Marriage Status in Stanton
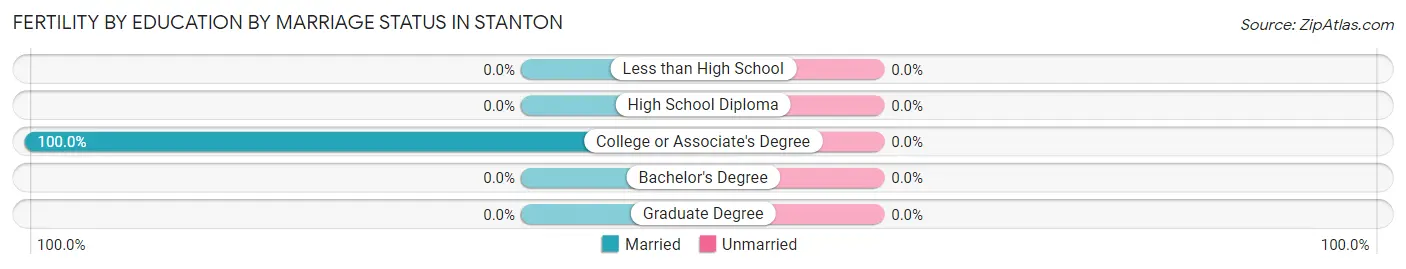
| Educational Attainment | Married | Unmarried |
| Less than High School | 0 (0.0%) | 0 (0.0%) |
| High School Diploma | 0 (0.0%) | 0 (0.0%) |
| College or Associate's Degree | 1 (100.0%) | 0 (0.0%) |
| Bachelor's Degree | 0 (0.0%) | 0 (0.0%) |
| Graduate Degree | 0 (0.0%) | 0 (0.0%) |
| Total | 1 (100.0%) | 0 (0.0%) |
Employment Characteristics in Stanton
Employment by Class of Employer in Stanton
Among the 220 employed individuals in Stanton, private company employees (145 | 65.9%), not-for-profit organizations (44 | 20.0%), and local government employees (16 | 7.3%) make up the most common classes of employment.
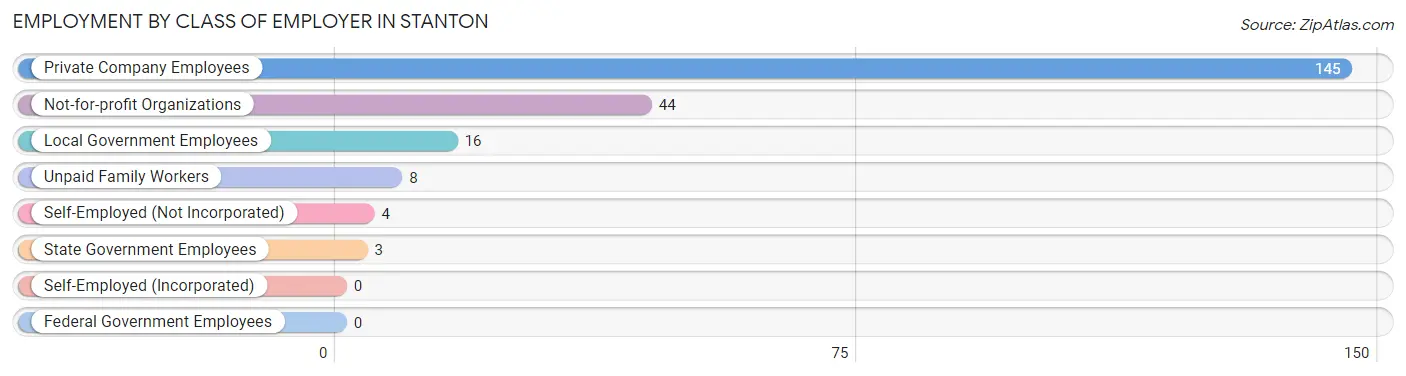
| Employer Class | # Employees | % Employees |
| Private Company Employees | 145 | 65.9% |
| Self-Employed (Incorporated) | 0 | 0.0% |
| Self-Employed (Not Incorporated) | 4 | 1.8% |
| Not-for-profit Organizations | 44 | 20.0% |
| Local Government Employees | 16 | 7.3% |
| State Government Employees | 3 | 1.4% |
| Federal Government Employees | 0 | 0.0% |
| Unpaid Family Workers | 8 | 3.6% |
| Total | 220 | 100.0% |
Employment Status by Age in Stanton
According to the labor force statistics for Stanton, out of the total population over 16 years of age (409), 55.3% or 226 individuals are in the labor force, with 2.7% or 6 of them unemployed. The age group with the highest labor force participation rate is 55 to 59 years, with 100.0% or 11 individuals in the labor force. Within the labor force, the 45 to 54 years age range has the highest percentage of unemployed individuals, with 6.7% or 3 of them being unemployed.
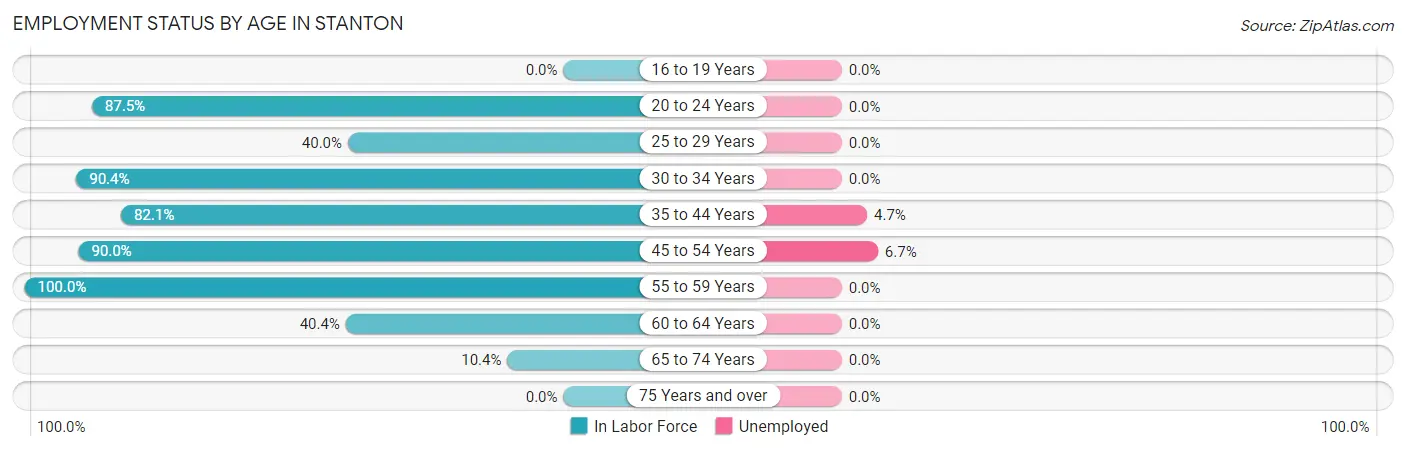
| Age Bracket | In Labor Force | Unemployed |
| 16 to 19 Years | 0 (0.0%) | 0 (0.0%) |
| 20 to 24 Years | 28 (87.5%) | 0 (0.0%) |
| 25 to 29 Years | 2 (40.0%) | 0 (0.0%) |
| 30 to 34 Years | 47 (90.4%) | 0 (0.0%) |
| 35 to 44 Years | 64 (82.1%) | 3 (4.7%) |
| 45 to 54 Years | 45 (90.0%) | 3 (6.7%) |
| 55 to 59 Years | 11 (100.0%) | 0 (0.0%) |
| 60 to 64 Years | 21 (40.4%) | 0 (0.0%) |
| 65 to 74 Years | 8 (10.4%) | 0 (0.0%) |
| 75 Years and over | 0 (0.0%) | 0 (0.0%) |
| Total | 226 (55.3%) | 6 (2.7%) |
Employment Status by Educational Attainment in Stanton
According to labor force statistics for Stanton, 76.6% of individuals (190) out of the total population between 25 and 64 years of age (248) are in the labor force, with 3.2% or 6 of them being unemployed. The group with the highest labor force participation rate are those with the educational attainment of college / associate degree, with 92.5% or 136 individuals in the labor force. Within the labor force, individuals with high school diploma education have the highest percentage of unemployment, with 6.7% or 2 of them being unemployed.
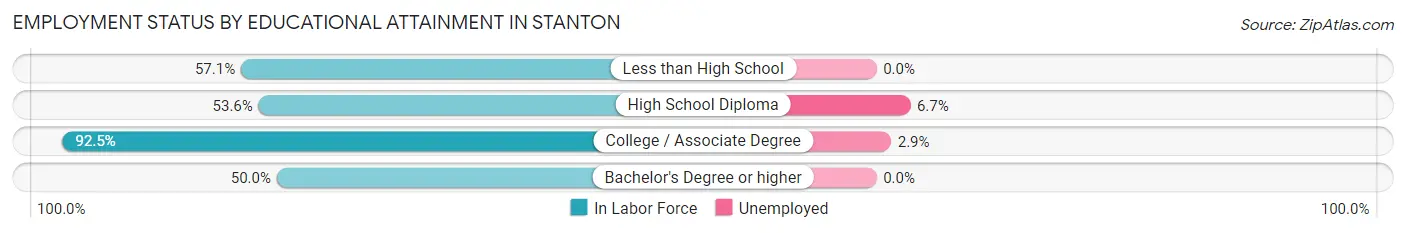
| Educational Attainment | In Labor Force | Unemployed |
| Less than High School | 12 (57.1%) | 0 (0.0%) |
| High School Diploma | 30 (53.6%) | 4 (6.7%) |
| College / Associate Degree | 136 (92.5%) | 4 (2.9%) |
| Bachelor's Degree or higher | 12 (50.0%) | 0 (0.0%) |
| Total | 190 (76.6%) | 8 (3.2%) |
Employment Occupations by Sex in Stanton
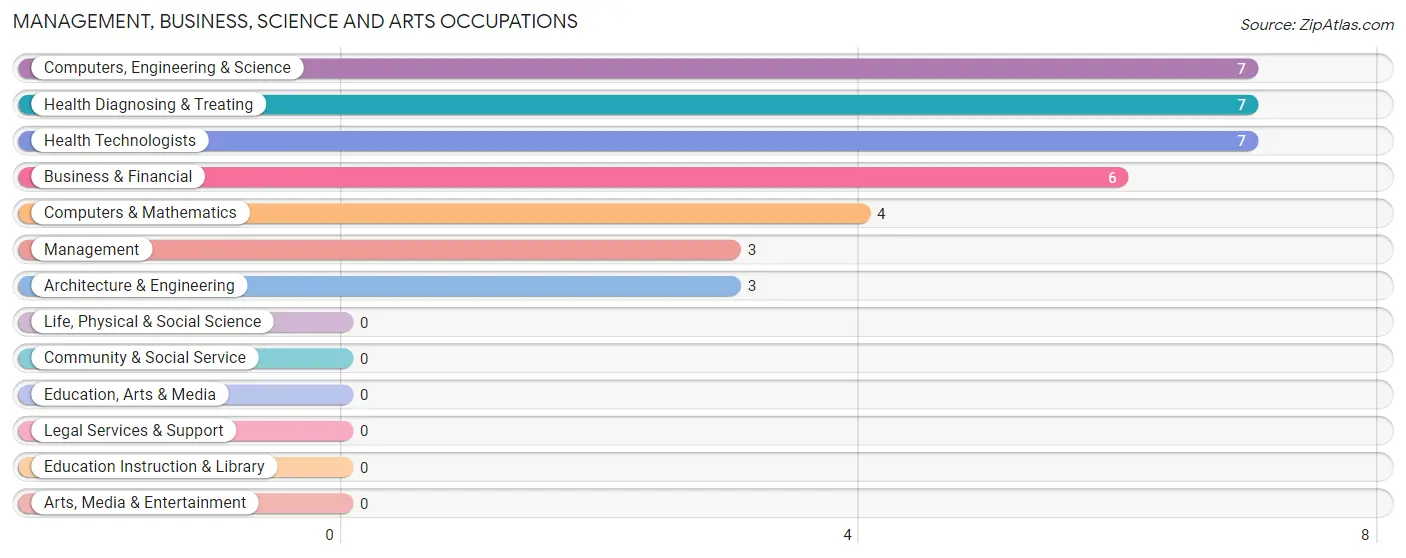
Management, Business, Science and Arts Occupations
The most common Management, Business, Science and Arts occupations in Stanton are Computers, Engineering & Science (7 | 3.2%), Health Diagnosing & Treating (7 | 3.2%), Health Technologists (7 | 3.2%), Business & Financial (6 | 2.7%), and Computers & Mathematics (4 | 1.8%).
Management, Business, Science and Arts Occupations by Sex
Within the Management, Business, Science and Arts occupations in Stanton, the most male-oriented occupations are Architecture & Engineering (100.0%), Computers, Engineering & Science (42.9%), and Management (33.3%), while the most female-oriented occupations are Business & Financial (100.0%), Computers & Mathematics (100.0%), and Health Diagnosing & Treating (71.4%).
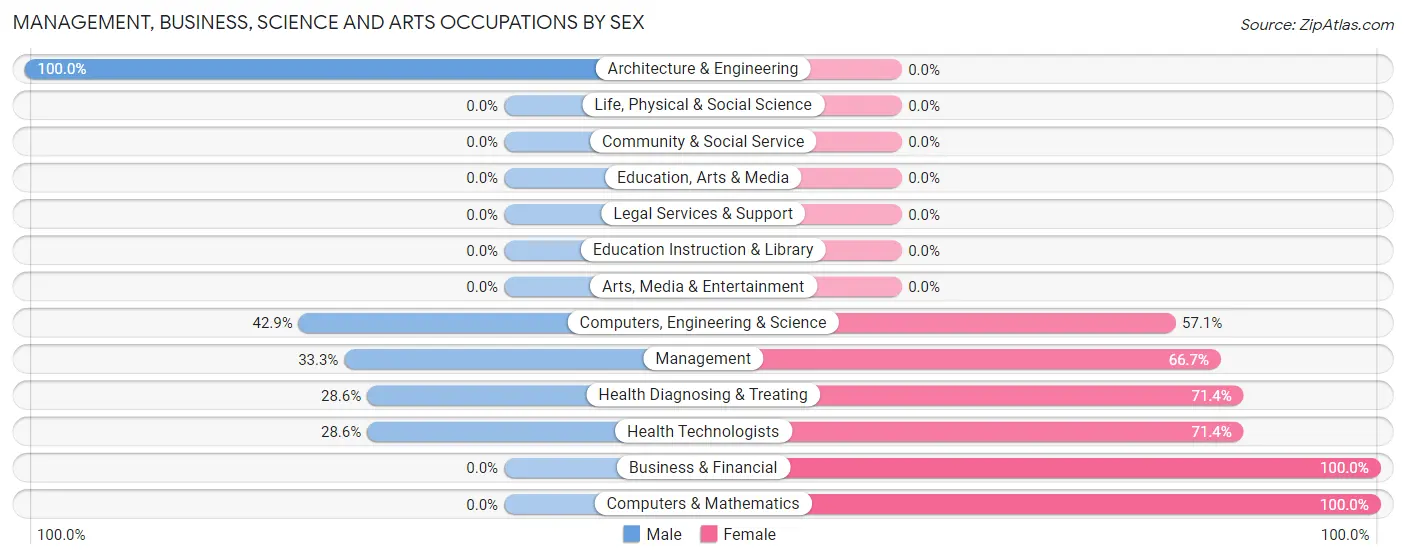
| Occupation | Male | Female |
| Management | 1 (33.3%) | 2 (66.7%) |
| Business & Financial | 0 (0.0%) | 6 (100.0%) |
| Computers, Engineering & Science | 3 (42.9%) | 4 (57.1%) |
| Computers & Mathematics | 0 (0.0%) | 4 (100.0%) |
| Architecture & Engineering | 3 (100.0%) | 0 (0.0%) |
| Life, Physical & Social Science | 0 (0.0%) | 0 (0.0%) |
| Community & Social Service | 0 (0.0%) | 0 (0.0%) |
| Education, Arts & Media | 0 (0.0%) | 0 (0.0%) |
| Legal Services & Support | 0 (0.0%) | 0 (0.0%) |
| Education Instruction & Library | 0 (0.0%) | 0 (0.0%) |
| Arts, Media & Entertainment | 0 (0.0%) | 0 (0.0%) |
| Health Diagnosing & Treating | 2 (28.6%) | 5 (71.4%) |
| Health Technologists | 2 (28.6%) | 5 (71.4%) |
| Total (Category) | 6 (26.1%) | 17 (73.9%) |
| Total (Overall) | 94 (42.7%) | 126 (57.3%) |
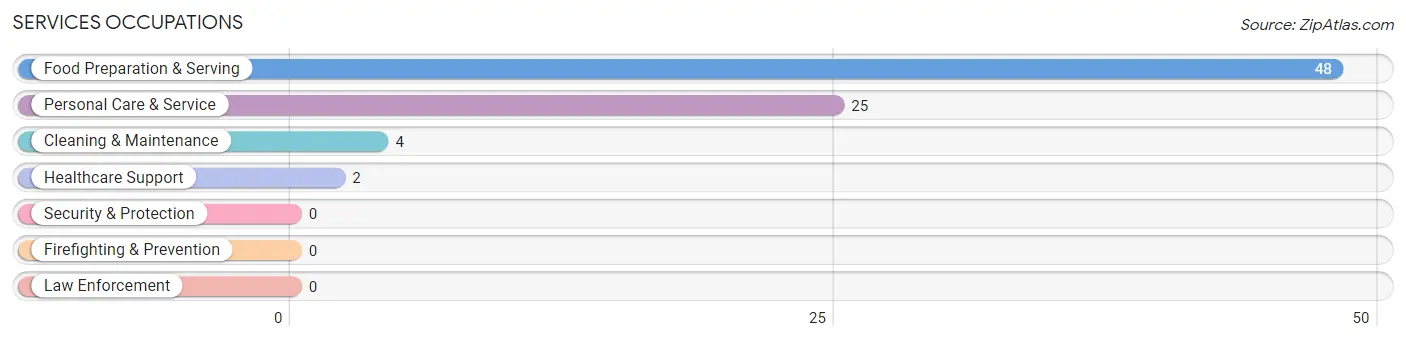
Services Occupations
The most common Services occupations in Stanton are Food Preparation & Serving (48 | 21.8%), Personal Care & Service (25 | 11.4%), Cleaning & Maintenance (4 | 1.8%), and Healthcare Support (2 | 0.9%).
Services Occupations by Sex
Within the Services occupations in Stanton, the most male-oriented occupations are Healthcare Support (100.0%), Cleaning & Maintenance (75.0%), and Food Preparation & Serving (6.2%), while the most female-oriented occupations are Personal Care & Service (100.0%), Food Preparation & Serving (93.8%), and Cleaning & Maintenance (25.0%).
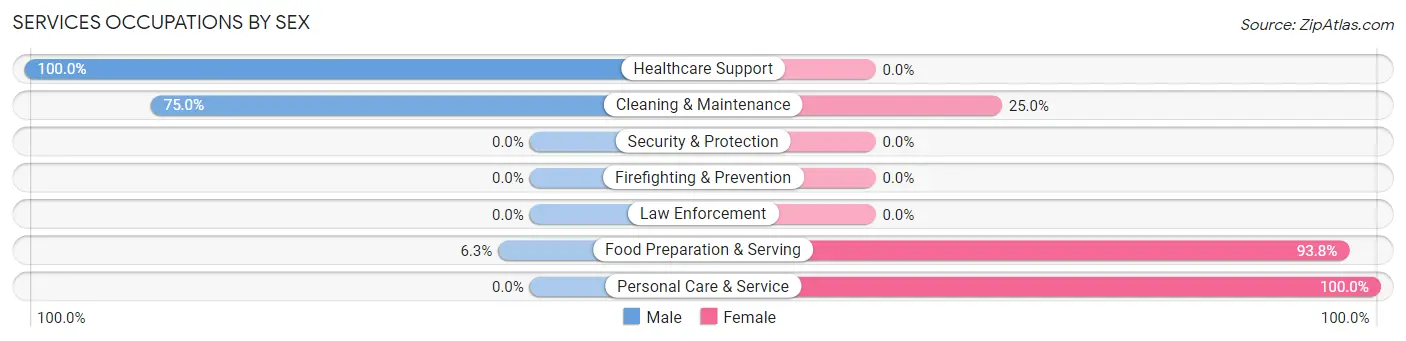
| Occupation | Male | Female |
| Healthcare Support | 2 (100.0%) | 0 (0.0%) |
| Security & Protection | 0 (0.0%) | 0 (0.0%) |
| Firefighting & Prevention | 0 (0.0%) | 0 (0.0%) |
| Law Enforcement | 0 (0.0%) | 0 (0.0%) |
| Food Preparation & Serving | 3 (6.2%) | 45 (93.8%) |
| Cleaning & Maintenance | 3 (75.0%) | 1 (25.0%) |
| Personal Care & Service | 0 (0.0%) | 25 (100.0%) |
| Total (Category) | 8 (10.1%) | 71 (89.9%) |
| Total (Overall) | 94 (42.7%) | 126 (57.3%) |
Sales and Office Occupations
The most common Sales and Office occupations in Stanton are Office & Administration (16 | 7.3%), and Sales & Related (6 | 2.7%).
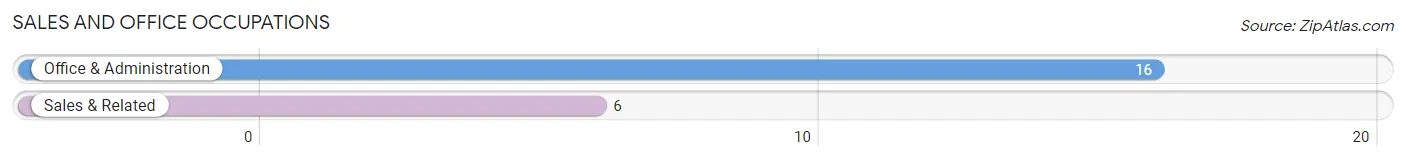
Sales and Office Occupations by Sex
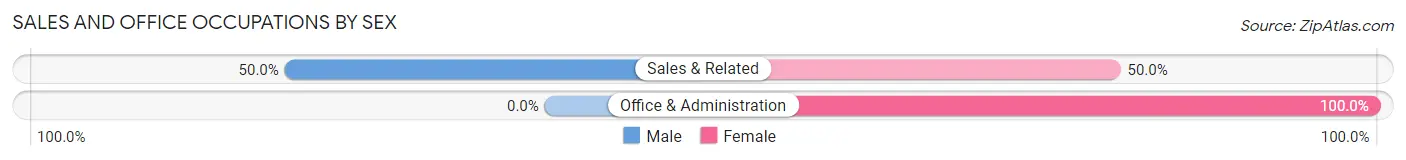
| Occupation | Male | Female |
| Sales & Related | 3 (50.0%) | 3 (50.0%) |
| Office & Administration | 0 (0.0%) | 16 (100.0%) |
| Total (Category) | 3 (13.6%) | 19 (86.4%) |
| Total (Overall) | 94 (42.7%) | 126 (57.3%) |
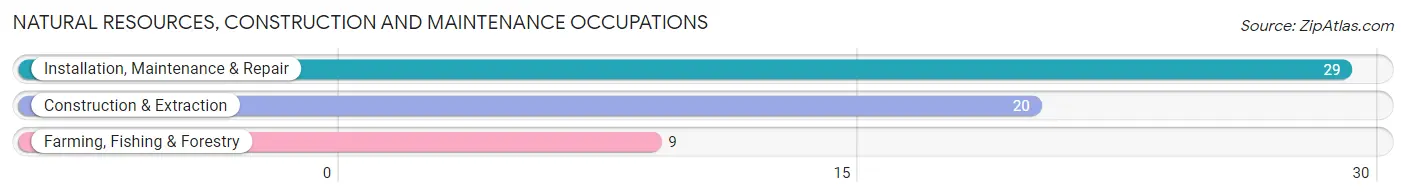
Natural Resources, Construction and Maintenance Occupations
The most common Natural Resources, Construction and Maintenance occupations in Stanton are Installation, Maintenance & Repair (29 | 13.2%), Construction & Extraction (20 | 9.1%), and Farming, Fishing & Forestry (9 | 4.1%).
Natural Resources, Construction and Maintenance Occupations by Sex
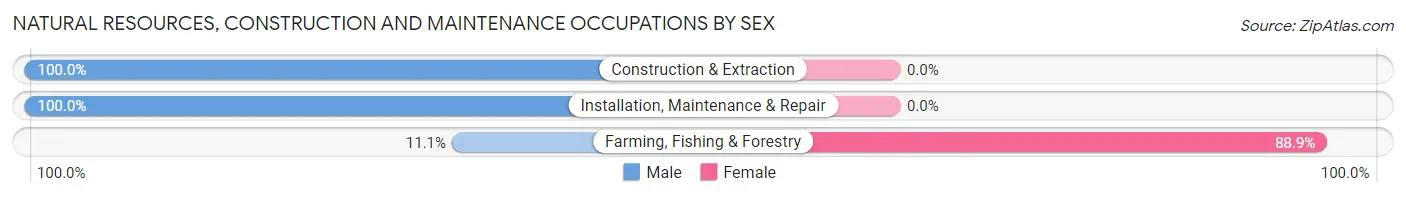
| Occupation | Male | Female |
| Farming, Fishing & Forestry | 1 (11.1%) | 8 (88.9%) |
| Construction & Extraction | 20 (100.0%) | 0 (0.0%) |
| Installation, Maintenance & Repair | 29 (100.0%) | 0 (0.0%) |
| Total (Category) | 50 (86.2%) | 8 (13.8%) |
| Total (Overall) | 94 (42.7%) | 126 (57.3%) |
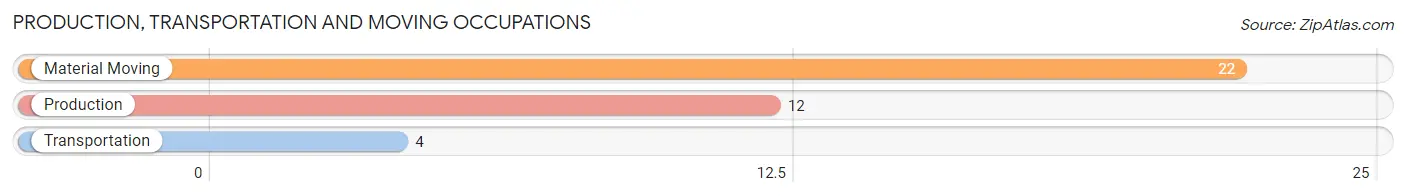
Production, Transportation and Moving Occupations
The most common Production, Transportation and Moving occupations in Stanton are Material Moving (22 | 10.0%), Production (12 | 5.4%), and Transportation (4 | 1.8%).
Production, Transportation and Moving Occupations by Sex

| Occupation | Male | Female |
| Production | 11 (91.7%) | 1 (8.3%) |
| Transportation | 4 (100.0%) | 0 (0.0%) |
| Material Moving | 12 (54.5%) | 10 (45.5%) |
| Total (Category) | 27 (71.1%) | 11 (28.9%) |
| Total (Overall) | 94 (42.7%) | 126 (57.3%) |
Employment Industries by Sex in Stanton
Employment Industries in Stanton
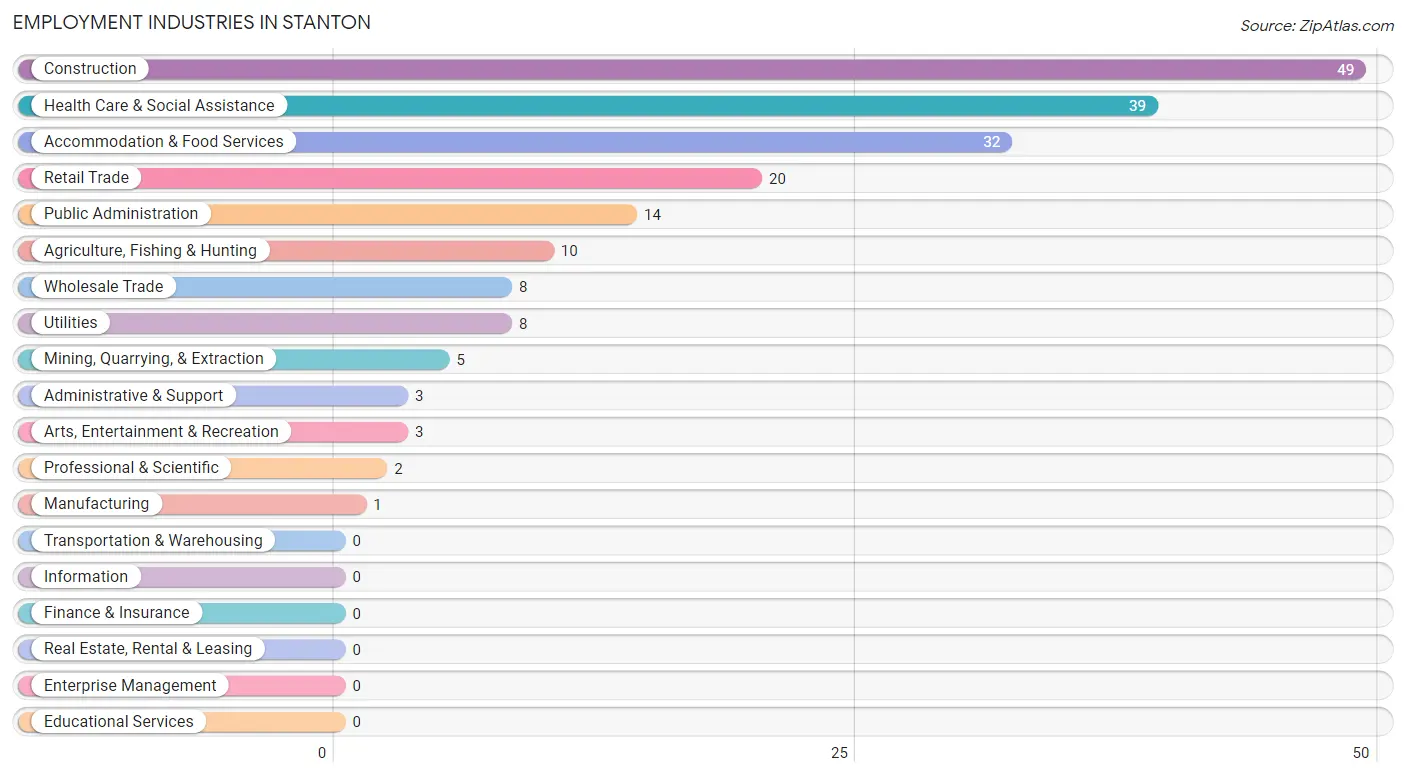
The major employment industries in Stanton include Construction (49 | 22.3%), Health Care & Social Assistance (39 | 17.7%), Accommodation & Food Services (32 | 14.5%), Retail Trade (20 | 9.1%), and Public Administration (14 | 6.4%).
Employment Industries by Sex in Stanton
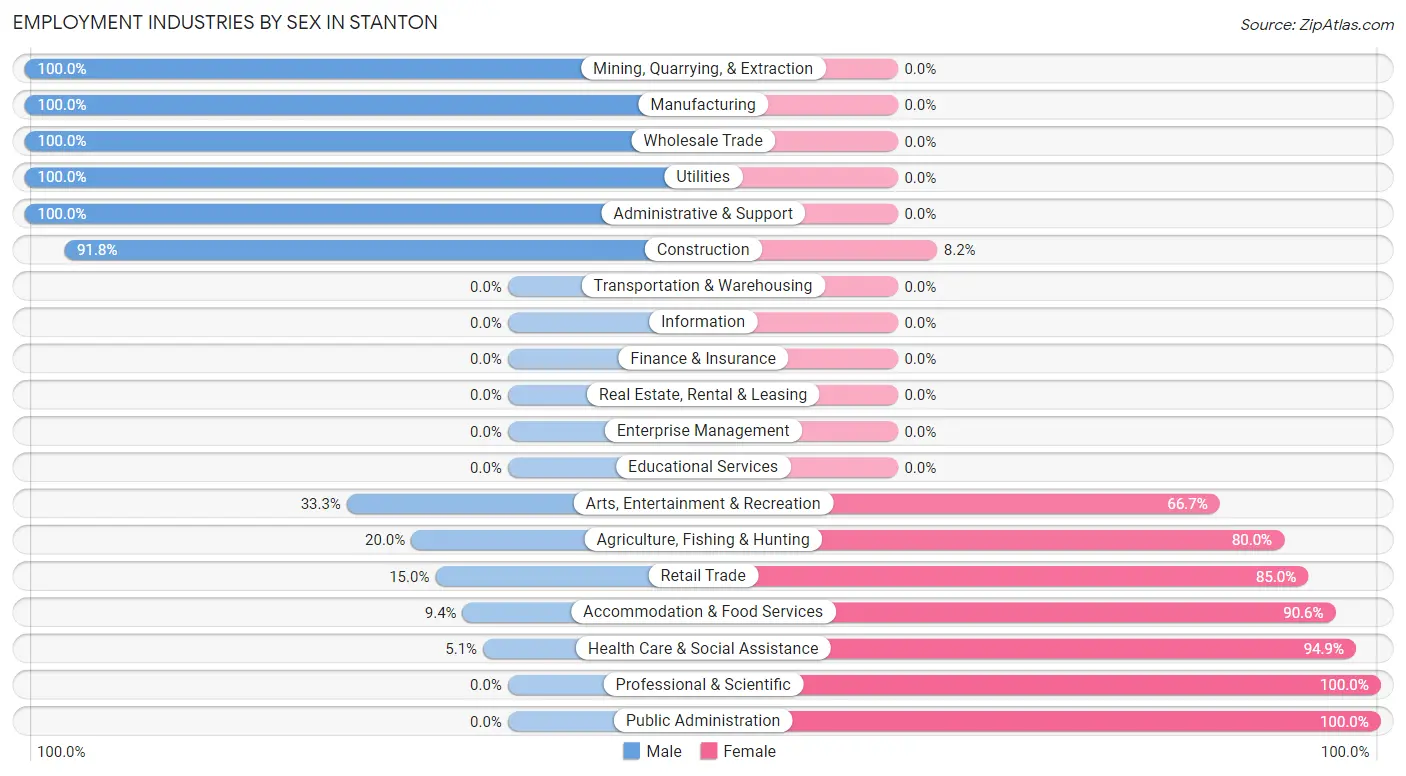
The Stanton industries that see more men than women are Mining, Quarrying, & Extraction (100.0%), Manufacturing (100.0%), and Wholesale Trade (100.0%), whereas the industries that tend to have a higher number of women are Professional & Scientific (100.0%), Public Administration (100.0%), and Health Care & Social Assistance (94.9%).
| Industry | Male | Female |
| Agriculture, Fishing & Hunting | 2 (20.0%) | 8 (80.0%) |
| Mining, Quarrying, & Extraction | 5 (100.0%) | 0 (0.0%) |
| Construction | 45 (91.8%) | 4 (8.2%) |
| Manufacturing | 1 (100.0%) | 0 (0.0%) |
| Wholesale Trade | 8 (100.0%) | 0 (0.0%) |
| Retail Trade | 3 (15.0%) | 17 (85.0%) |
| Transportation & Warehousing | 0 (0.0%) | 0 (0.0%) |
| Utilities | 8 (100.0%) | 0 (0.0%) |
| Information | 0 (0.0%) | 0 (0.0%) |
| Finance & Insurance | 0 (0.0%) | 0 (0.0%) |
| Real Estate, Rental & Leasing | 0 (0.0%) | 0 (0.0%) |
| Professional & Scientific | 0 (0.0%) | 2 (100.0%) |
| Enterprise Management | 0 (0.0%) | 0 (0.0%) |
| Administrative & Support | 3 (100.0%) | 0 (0.0%) |
| Educational Services | 0 (0.0%) | 0 (0.0%) |
| Health Care & Social Assistance | 2 (5.1%) | 37 (94.9%) |
| Arts, Entertainment & Recreation | 1 (33.3%) | 2 (66.7%) |
| Accommodation & Food Services | 3 (9.4%) | 29 (90.6%) |
| Public Administration | 0 (0.0%) | 14 (100.0%) |
| Total | 94 (42.7%) | 126 (57.3%) |
Education in Stanton
School Enrollment in Stanton
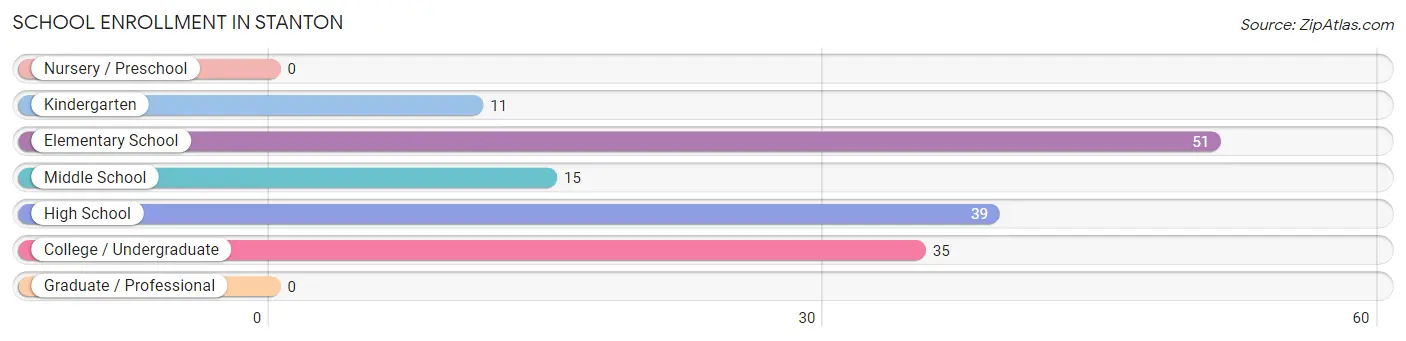
The most common levels of schooling among the 151 students in Stanton are elementary school (51 | 33.8%), high school (39 | 25.8%), and college / undergraduate (35 | 23.2%).
| School Level | # Students | % Students |
| Nursery / Preschool | 0 | 0.0% |
| Kindergarten | 11 | 7.3% |
| Elementary School | 51 | 33.8% |
| Middle School | 15 | 9.9% |
| High School | 39 | 25.8% |
| College / Undergraduate | 35 | 23.2% |
| Graduate / Professional | 0 | 0.0% |
| Total | 151 | 100.0% |
School Enrollment by Age by Funding Source in Stanton
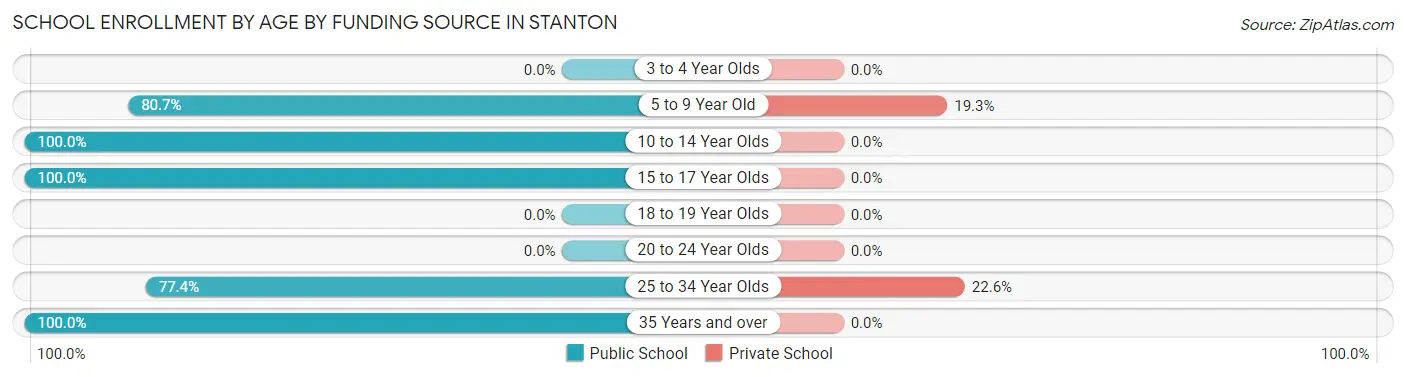
Out of a total of 151 students who are enrolled in schools in Stanton, 18 (11.9%) attend a private institution, while the remaining 133 (88.1%) are enrolled in public schools. The age group of 25 to 34 year olds has the highest likelihood of being enrolled in private schools, with 7 (22.6% in the age bracket) enrolled. Conversely, the age group of 10 to 14 year olds has the lowest likelihood of being enrolled in a private school, with 31 (100.0% in the age bracket) attending a public institution.
| Age Bracket | Public School | Private School |
| 3 to 4 Year Olds | 0 (0.0%) | 0 (0.0%) |
| 5 to 9 Year Old | 46 (80.7%) | 11 (19.3%) |
| 10 to 14 Year Olds | 31 (100.0%) | 0 (0.0%) |
| 15 to 17 Year Olds | 27 (100.0%) | 0 (0.0%) |
| 18 to 19 Year Olds | 0 (0.0%) | 0 (0.0%) |
| 20 to 24 Year Olds | 0 (0.0%) | 0 (0.0%) |
| 25 to 34 Year Olds | 24 (77.4%) | 7 (22.6%) |
| 35 Years and over | 5 (100.0%) | 0 (0.0%) |
| Total | 133 (88.1%) | 18 (11.9%) |
Educational Attainment by Field of Study in Stanton
Arts & humanities (10 | 28.6%), science & technology (9 | 25.7%), business (4 | 11.4%), visual & performing arts (4 | 11.4%), and engineering (3 | 8.6%) are the most common fields of study among 35 individuals in Stanton who have obtained a bachelor's degree or higher.
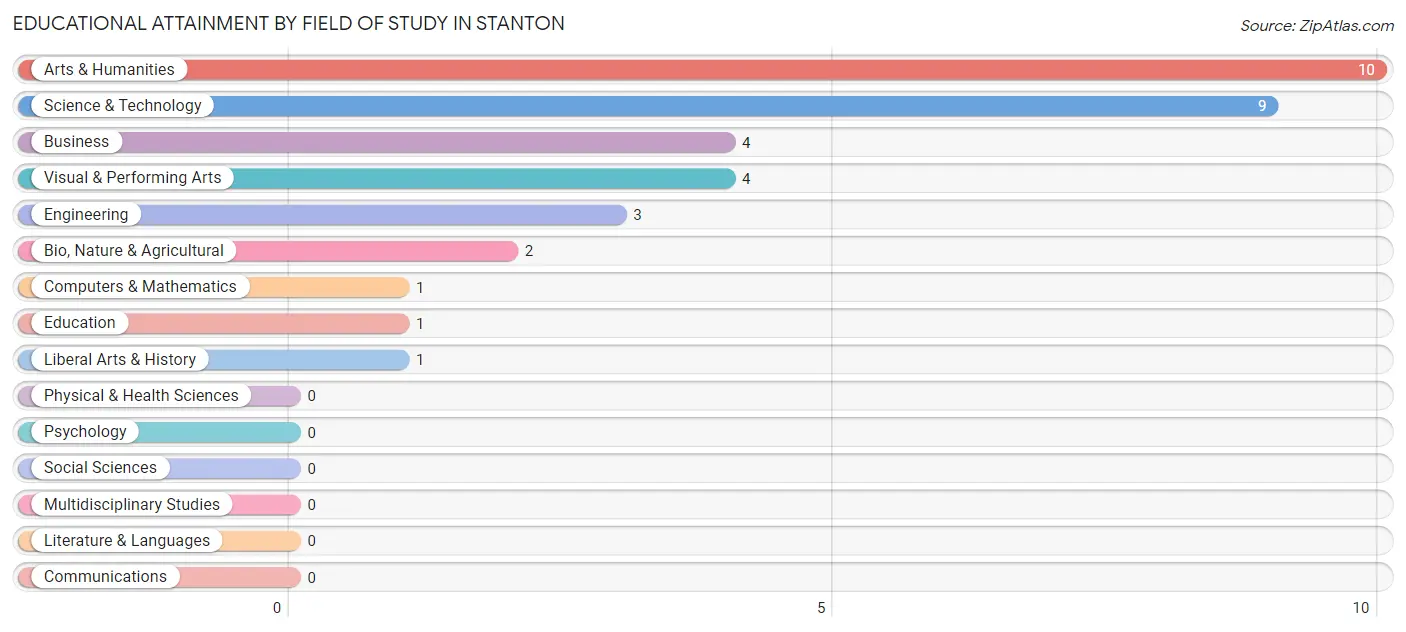
| Field of Study | # Graduates | % Graduates |
| Computers & Mathematics | 1 | 2.9% |
| Bio, Nature & Agricultural | 2 | 5.7% |
| Physical & Health Sciences | 0 | 0.0% |
| Psychology | 0 | 0.0% |
| Social Sciences | 0 | 0.0% |
| Engineering | 3 | 8.6% |
| Multidisciplinary Studies | 0 | 0.0% |
| Science & Technology | 9 | 25.7% |
| Business | 4 | 11.4% |
| Education | 1 | 2.9% |
| Literature & Languages | 0 | 0.0% |
| Liberal Arts & History | 1 | 2.9% |
| Visual & Performing Arts | 4 | 11.4% |
| Communications | 0 | 0.0% |
| Arts & Humanities | 10 | 28.6% |
| Total | 35 | 100.0% |
Transportation & Commute in Stanton
Vehicle Availability by Sex in Stanton
The most prevalent vehicle ownership categories in Stanton are males with 3 vehicles (26, accounting for 27.7%) and females with 3 vehicles (38, making up 20.6%).
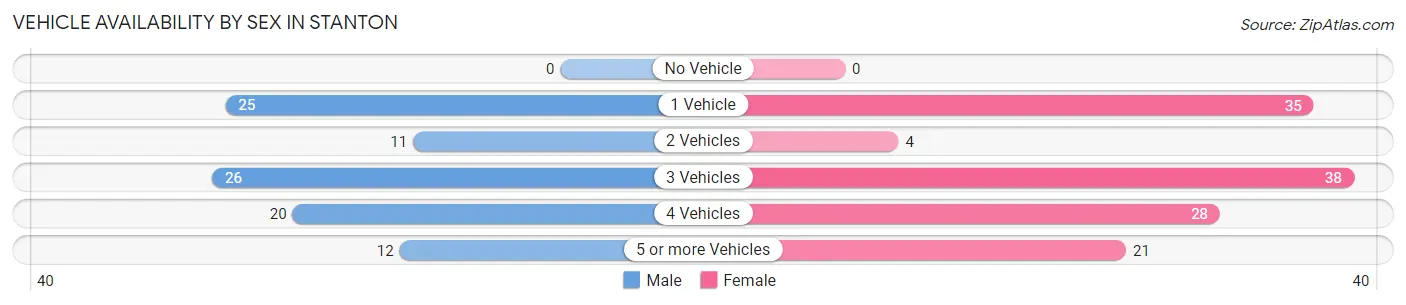
| Vehicles Available | Male | Female |
| No Vehicle | 0 (0.0%) | 0 (0.0%) |
| 1 Vehicle | 25 (26.6%) | 35 (27.8%) |
| 2 Vehicles | 11 (11.7%) | 4 (3.2%) |
| 3 Vehicles | 26 (27.7%) | 38 (30.2%) |
| 4 Vehicles | 20 (21.3%) | 28 (22.2%) |
| 5 or more Vehicles | 12 (12.8%) | 21 (16.7%) |
| Total | 94 (100.0%) | 126 (100.0%) |
Commute Time in Stanton
The most frequently occuring commute durations in Stanton are 15 to 19 minutes (50 commuters, 28.2%), less than 5 minutes (28 commuters, 15.8%), and 90 or more minutes (18 commuters, 10.2%).
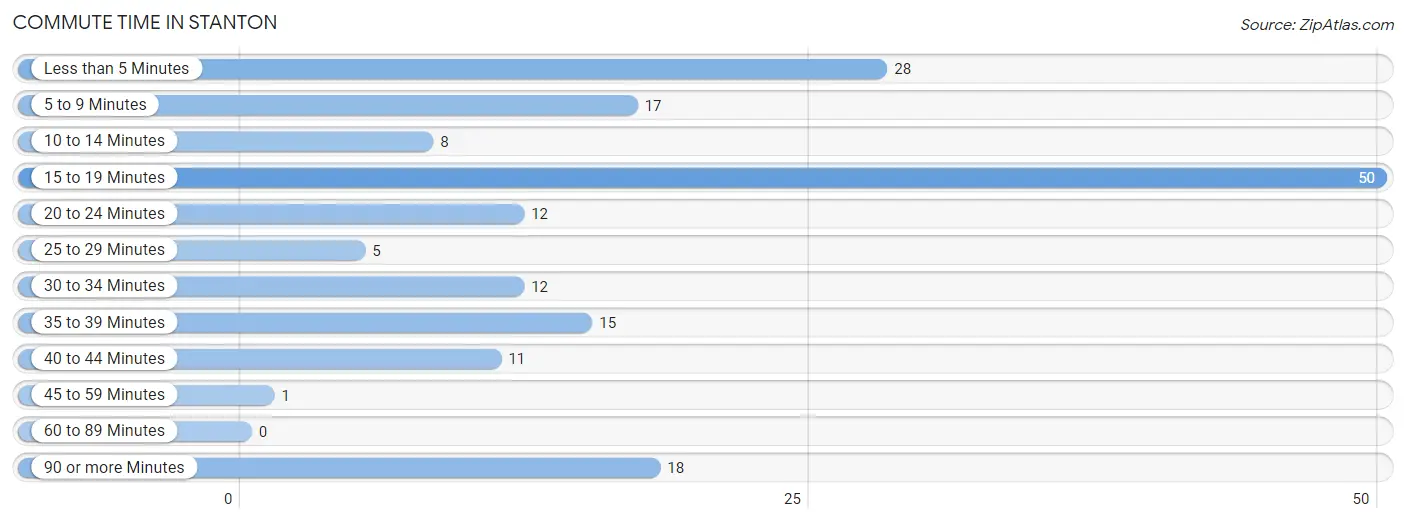
| Commute Time | # Commuters | % Commuters |
| Less than 5 Minutes | 28 | 15.8% |
| 5 to 9 Minutes | 17 | 9.6% |
| 10 to 14 Minutes | 8 | 4.5% |
| 15 to 19 Minutes | 50 | 28.2% |
| 20 to 24 Minutes | 12 | 6.8% |
| 25 to 29 Minutes | 5 | 2.8% |
| 30 to 34 Minutes | 12 | 6.8% |
| 35 to 39 Minutes | 15 | 8.5% |
| 40 to 44 Minutes | 11 | 6.2% |
| 45 to 59 Minutes | 1 | 0.6% |
| 60 to 89 Minutes | 0 | 0.0% |
| 90 or more Minutes | 18 | 10.2% |
Commute Time by Sex in Stanton
The most common commute times in Stanton are less than 5 minutes (19 commuters, 24.0%) for males and 15 to 19 minutes (50 commuters, 51.0%) for females.
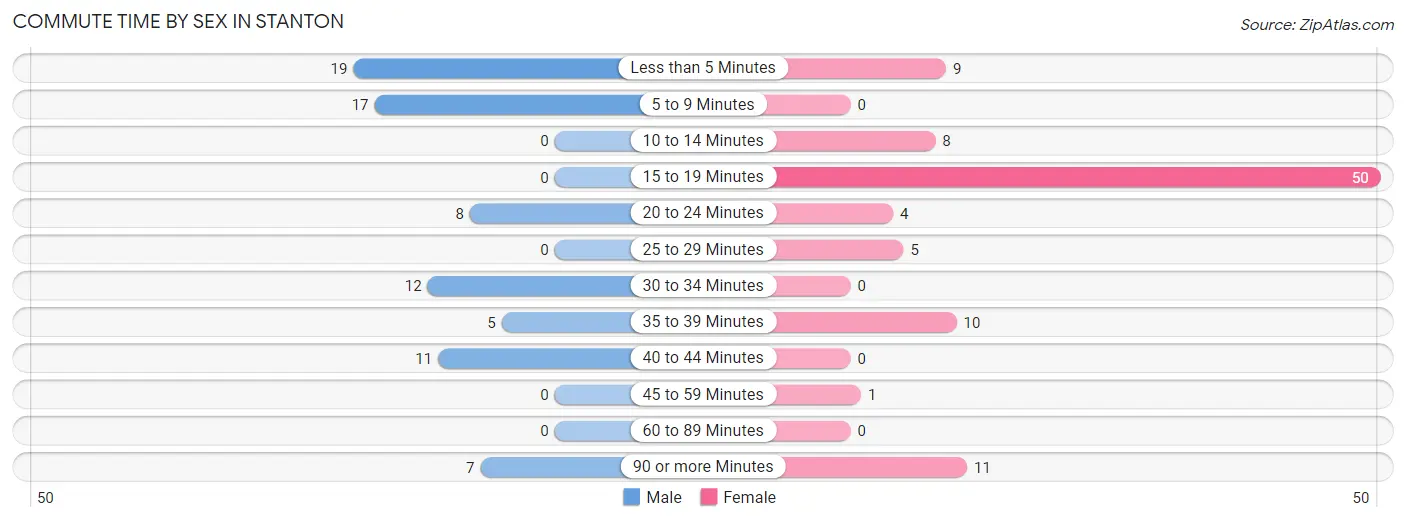
| Commute Time | Male | Female |
| Less than 5 Minutes | 19 (24.0%) | 9 (9.2%) |
| 5 to 9 Minutes | 17 (21.5%) | 0 (0.0%) |
| 10 to 14 Minutes | 0 (0.0%) | 8 (8.2%) |
| 15 to 19 Minutes | 0 (0.0%) | 50 (51.0%) |
| 20 to 24 Minutes | 8 (10.1%) | 4 (4.1%) |
| 25 to 29 Minutes | 0 (0.0%) | 5 (5.1%) |
| 30 to 34 Minutes | 12 (15.2%) | 0 (0.0%) |
| 35 to 39 Minutes | 5 (6.3%) | 10 (10.2%) |
| 40 to 44 Minutes | 11 (13.9%) | 0 (0.0%) |
| 45 to 59 Minutes | 0 (0.0%) | 1 (1.0%) |
| 60 to 89 Minutes | 0 (0.0%) | 0 (0.0%) |
| 90 or more Minutes | 7 (8.9%) | 11 (11.2%) |
Time of Departure to Work by Sex in Stanton
The most frequent times of departure to work in Stanton are 6:00 AM to 6:29 AM (26, 32.9%) for males and 7:30 AM to 7:59 AM (24, 24.5%) for females.
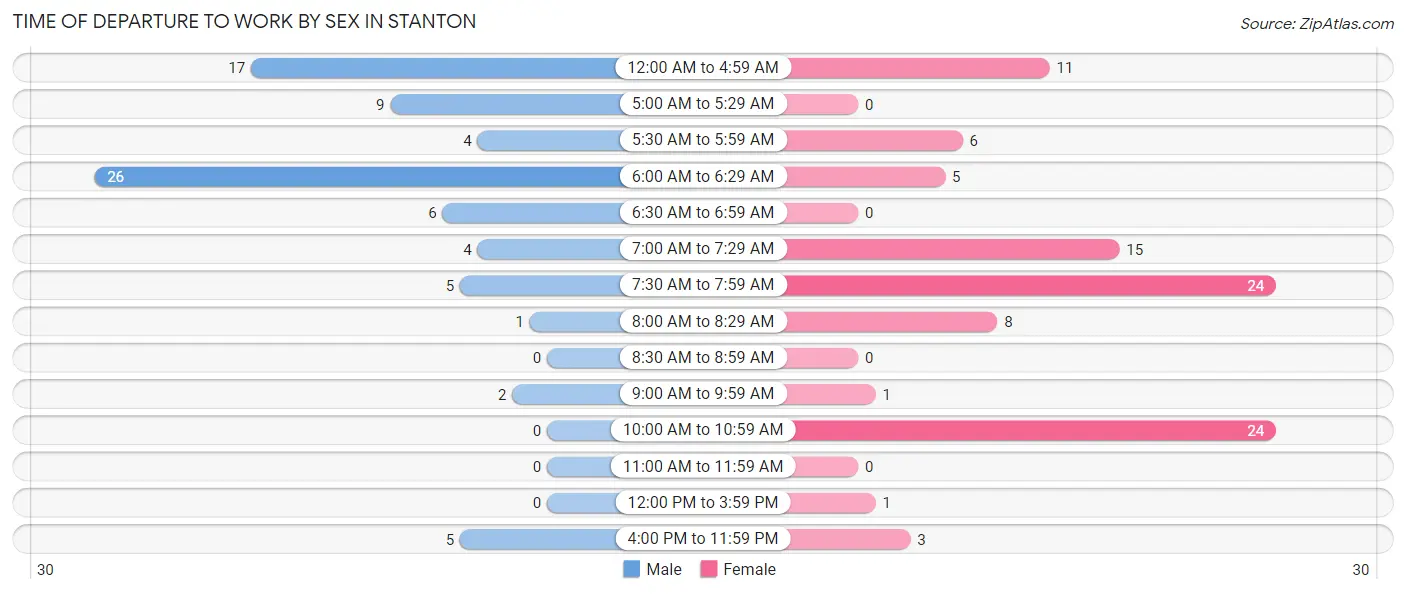
| Time of Departure | Male | Female |
| 12:00 AM to 4:59 AM | 17 (21.5%) | 11 (11.2%) |
| 5:00 AM to 5:29 AM | 9 (11.4%) | 0 (0.0%) |
| 5:30 AM to 5:59 AM | 4 (5.1%) | 6 (6.1%) |
| 6:00 AM to 6:29 AM | 26 (32.9%) | 5 (5.1%) |
| 6:30 AM to 6:59 AM | 6 (7.6%) | 0 (0.0%) |
| 7:00 AM to 7:29 AM | 4 (5.1%) | 15 (15.3%) |
| 7:30 AM to 7:59 AM | 5 (6.3%) | 24 (24.5%) |
| 8:00 AM to 8:29 AM | 1 (1.3%) | 8 (8.2%) |
| 8:30 AM to 8:59 AM | 0 (0.0%) | 0 (0.0%) |
| 9:00 AM to 9:59 AM | 2 (2.5%) | 1 (1.0%) |
| 10:00 AM to 10:59 AM | 0 (0.0%) | 24 (24.5%) |
| 11:00 AM to 11:59 AM | 0 (0.0%) | 0 (0.0%) |
| 12:00 PM to 3:59 PM | 0 (0.0%) | 1 (1.0%) |
| 4:00 PM to 11:59 PM | 5 (6.3%) | 3 (3.1%) |
| Total | 79 (100.0%) | 98 (100.0%) |
Housing Occupancy in Stanton
Occupancy by Ownership in Stanton
Of the total 206 dwellings in Stanton, owner-occupied units account for 182 (88.3%), while renter-occupied units make up 24 (11.7%).
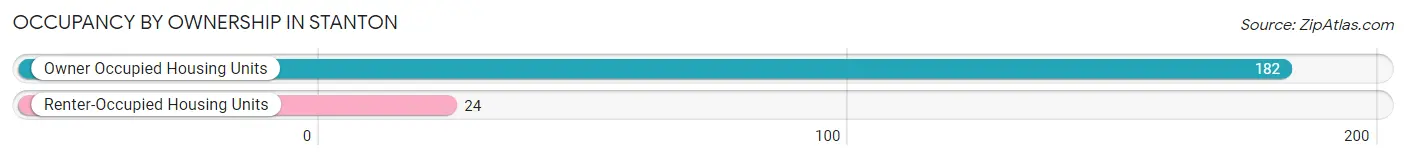
| Occupancy | # Housing Units | % Housing Units |
| Owner Occupied Housing Units | 182 | 88.3% |
| Renter-Occupied Housing Units | 24 | 11.7% |
| Total Occupied Housing Units | 206 | 100.0% |
Occupancy by Household Size in Stanton
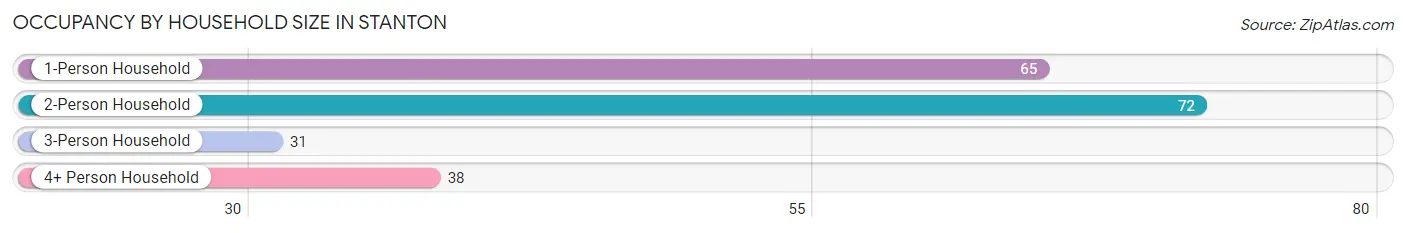
| Household Size | # Housing Units | % Housing Units |
| 1-Person Household | 65 | 31.6% |
| 2-Person Household | 72 | 34.9% |
| 3-Person Household | 31 | 15.0% |
| 4+ Person Household | 38 | 18.4% |
| Total Housing Units | 206 | 100.0% |
Occupancy by Ownership by Household Size in Stanton
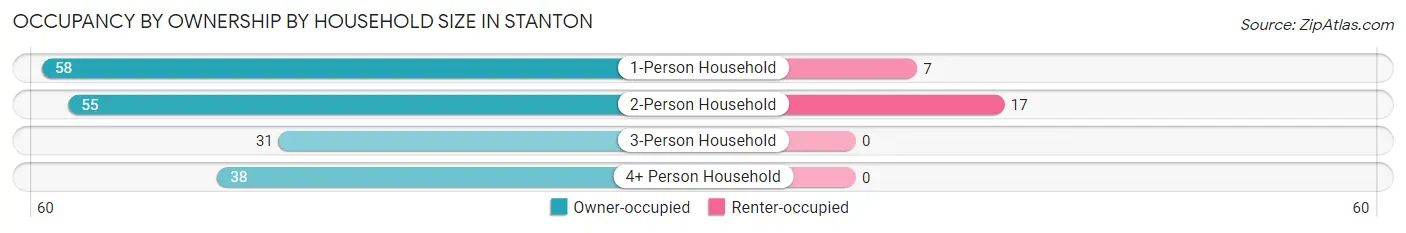
| Household Size | Owner-occupied | Renter-occupied |
| 1-Person Household | 58 (89.2%) | 7 (10.8%) |
| 2-Person Household | 55 (76.4%) | 17 (23.6%) |
| 3-Person Household | 31 (100.0%) | 0 (0.0%) |
| 4+ Person Household | 38 (100.0%) | 0 (0.0%) |
| Total Housing Units | 182 (88.3%) | 24 (11.7%) |
Occupancy by Educational Attainment in Stanton
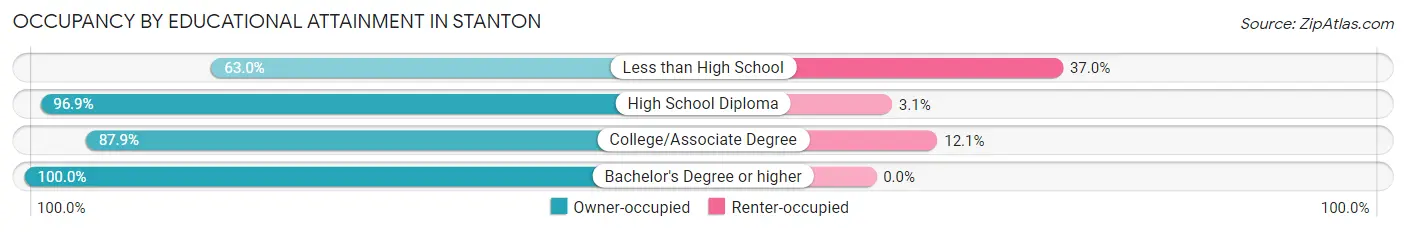
| Household Size | Owner-occupied | Renter-occupied |
| Less than High School | 17 (63.0%) | 10 (37.0%) |
| High School Diploma | 62 (96.9%) | 2 (3.1%) |
| College/Associate Degree | 87 (87.9%) | 12 (12.1%) |
| Bachelor's Degree or higher | 16 (100.0%) | 0 (0.0%) |
Occupancy by Age of Householder in Stanton
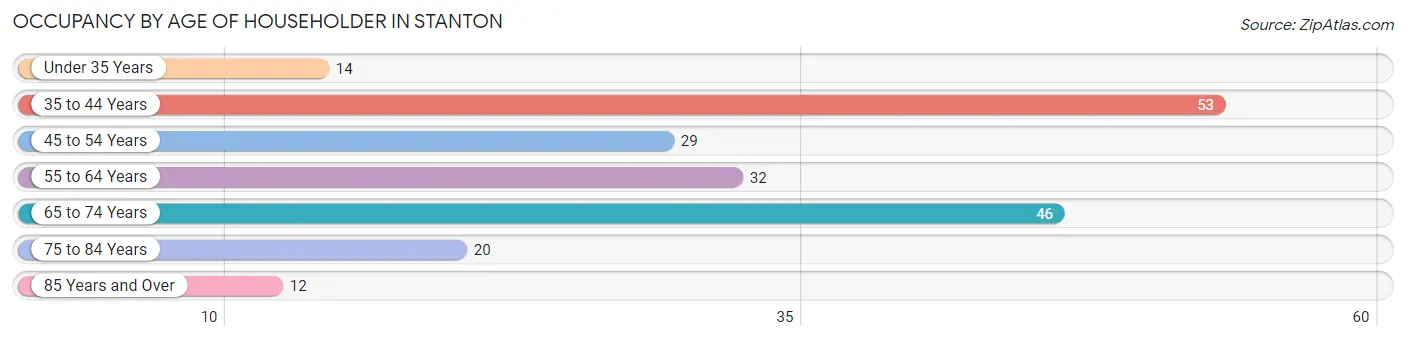
| Age Bracket | # Households | % Households |
| Under 35 Years | 14 | 6.8% |
| 35 to 44 Years | 53 | 25.7% |
| 45 to 54 Years | 29 | 14.1% |
| 55 to 64 Years | 32 | 15.5% |
| 65 to 74 Years | 46 | 22.3% |
| 75 to 84 Years | 20 | 9.7% |
| 85 Years and Over | 12 | 5.8% |
| Total | 206 | 100.0% |
Housing Finances in Stanton
Median Income by Occupancy in Stanton
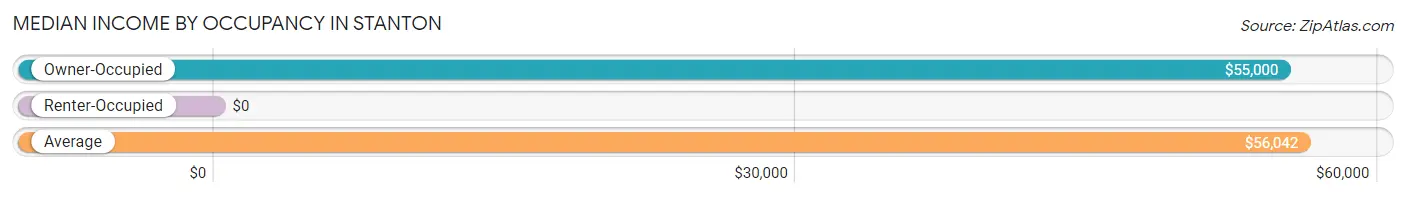
| Occupancy Type | # Households | Median Income |
| Owner-Occupied | 182 (88.3%) | $55,000 |
| Renter-Occupied | 24 (11.7%) | $0 |
| Average | 206 (100.0%) | $56,042 |
Occupancy by Householder Income Bracket in Stanton
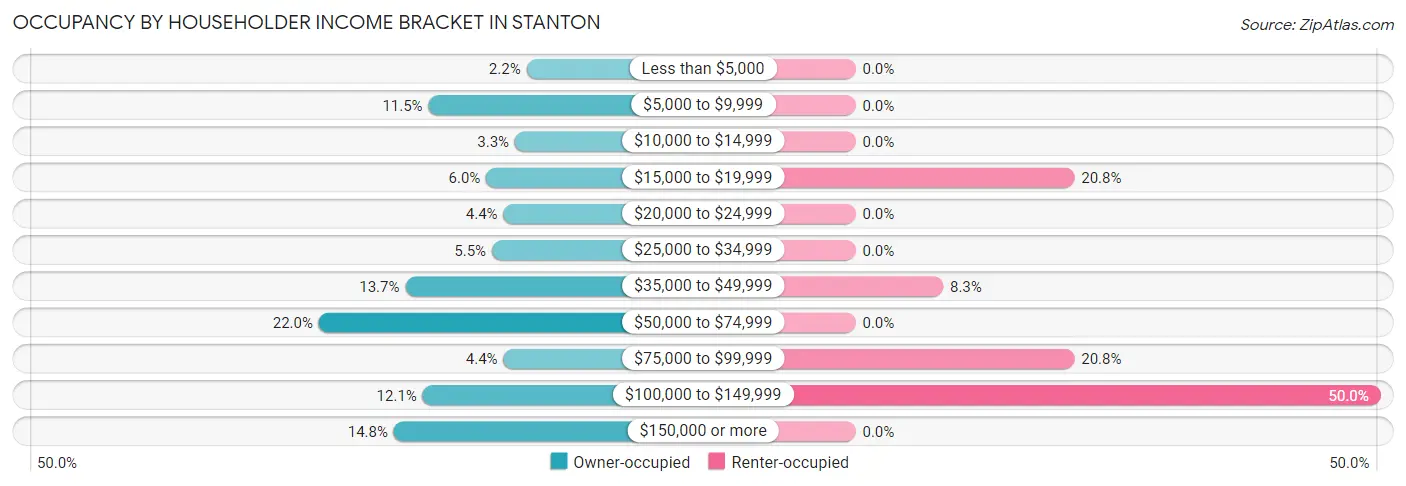
| Income Bracket | Owner-occupied | Renter-occupied |
| Less than $5,000 | 4 (2.2%) | 0 (0.0%) |
| $5,000 to $9,999 | 21 (11.5%) | 0 (0.0%) |
| $10,000 to $14,999 | 6 (3.3%) | 0 (0.0%) |
| $15,000 to $19,999 | 11 (6.0%) | 5 (20.8%) |
| $20,000 to $24,999 | 8 (4.4%) | 0 (0.0%) |
| $25,000 to $34,999 | 10 (5.5%) | 0 (0.0%) |
| $35,000 to $49,999 | 25 (13.7%) | 2 (8.3%) |
| $50,000 to $74,999 | 40 (22.0%) | 0 (0.0%) |
| $75,000 to $99,999 | 8 (4.4%) | 5 (20.8%) |
| $100,000 to $149,999 | 22 (12.1%) | 12 (50.0%) |
| $150,000 or more | 27 (14.8%) | 0 (0.0%) |
| Total | 182 (100.0%) | 24 (100.0%) |
Monthly Housing Cost Tiers in Stanton
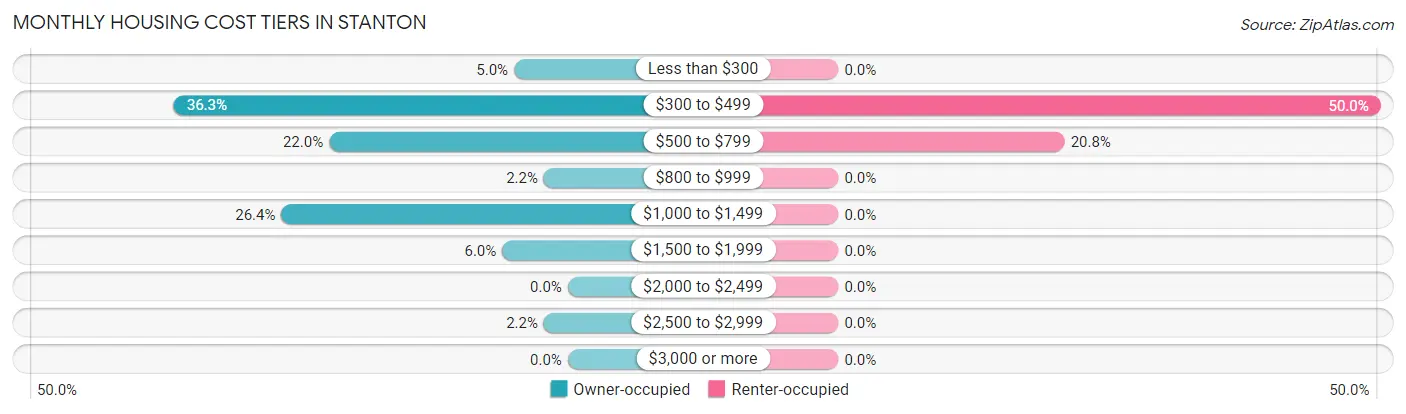
| Monthly Cost | Owner-occupied | Renter-occupied |
| Less than $300 | 9 (5.0%) | 0 (0.0%) |
| $300 to $499 | 66 (36.3%) | 12 (50.0%) |
| $500 to $799 | 40 (22.0%) | 5 (20.8%) |
| $800 to $999 | 4 (2.2%) | 0 (0.0%) |
| $1,000 to $1,499 | 48 (26.4%) | 0 (0.0%) |
| $1,500 to $1,999 | 11 (6.0%) | 0 (0.0%) |
| $2,000 to $2,499 | 0 (0.0%) | 0 (0.0%) |
| $2,500 to $2,999 | 4 (2.2%) | 0 (0.0%) |
| $3,000 or more | 0 (0.0%) | 0 (0.0%) |
| Total | 182 (100.0%) | 24 (100.0%) |
Physical Housing Characteristics in Stanton
Housing Structures in Stanton
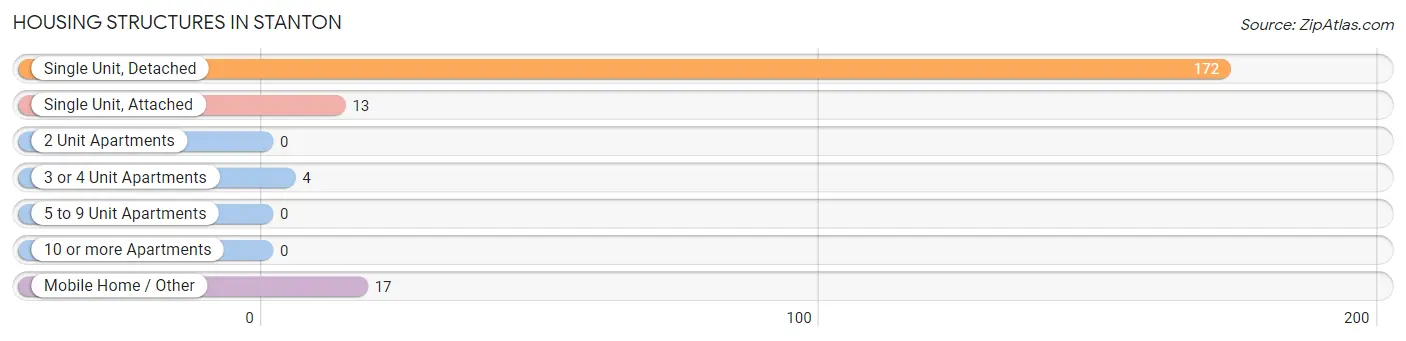
| Structure Type | # Housing Units | % Housing Units |
| Single Unit, Detached | 172 | 83.5% |
| Single Unit, Attached | 13 | 6.3% |
| 2 Unit Apartments | 0 | 0.0% |
| 3 or 4 Unit Apartments | 4 | 1.9% |
| 5 to 9 Unit Apartments | 0 | 0.0% |
| 10 or more Apartments | 0 | 0.0% |
| Mobile Home / Other | 17 | 8.3% |
| Total | 206 | 100.0% |
Housing Structures by Occupancy in Stanton
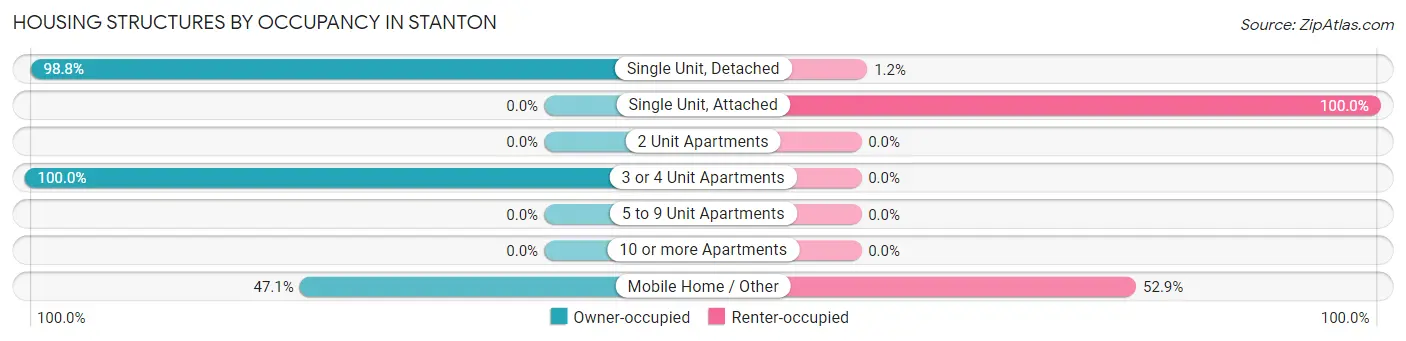
| Structure Type | Owner-occupied | Renter-occupied |
| Single Unit, Detached | 170 (98.8%) | 2 (1.2%) |
| Single Unit, Attached | 0 (0.0%) | 13 (100.0%) |
| 2 Unit Apartments | 0 (0.0%) | 0 (0.0%) |
| 3 or 4 Unit Apartments | 4 (100.0%) | 0 (0.0%) |
| 5 to 9 Unit Apartments | 0 (0.0%) | 0 (0.0%) |
| 10 or more Apartments | 0 (0.0%) | 0 (0.0%) |
| Mobile Home / Other | 8 (47.1%) | 9 (52.9%) |
| Total | 182 (88.3%) | 24 (11.7%) |
Housing Structures by Number of Rooms in Stanton
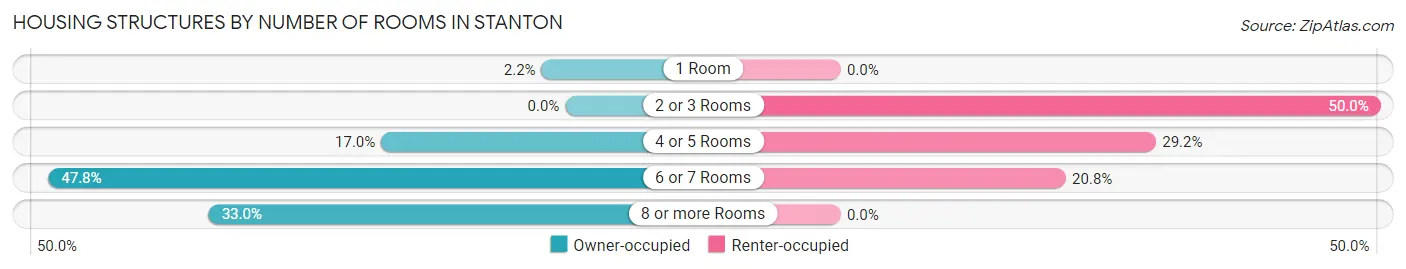
| Number of Rooms | Owner-occupied | Renter-occupied |
| 1 Room | 4 (2.2%) | 0 (0.0%) |
| 2 or 3 Rooms | 0 (0.0%) | 12 (50.0%) |
| 4 or 5 Rooms | 31 (17.0%) | 7 (29.2%) |
| 6 or 7 Rooms | 87 (47.8%) | 5 (20.8%) |
| 8 or more Rooms | 60 (33.0%) | 0 (0.0%) |
| Total | 182 (100.0%) | 24 (100.0%) |
Housing Structure by Heating Type in Stanton
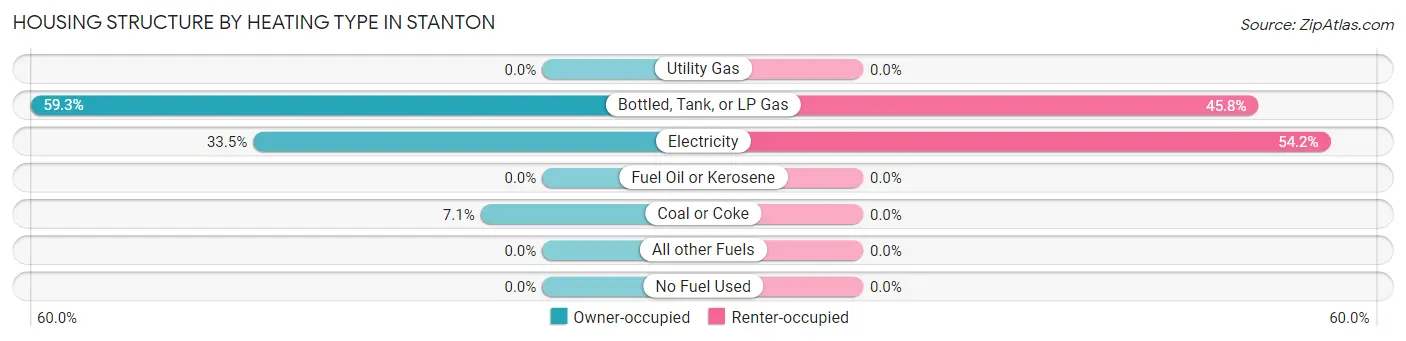
| Heating Type | Owner-occupied | Renter-occupied |
| Utility Gas | 0 (0.0%) | 0 (0.0%) |
| Bottled, Tank, or LP Gas | 108 (59.3%) | 11 (45.8%) |
| Electricity | 61 (33.5%) | 13 (54.2%) |
| Fuel Oil or Kerosene | 0 (0.0%) | 0 (0.0%) |
| Coal or Coke | 13 (7.1%) | 0 (0.0%) |
| All other Fuels | 0 (0.0%) | 0 (0.0%) |
| No Fuel Used | 0 (0.0%) | 0 (0.0%) |
| Total | 182 (100.0%) | 24 (100.0%) |
Household Vehicle Usage in Stanton
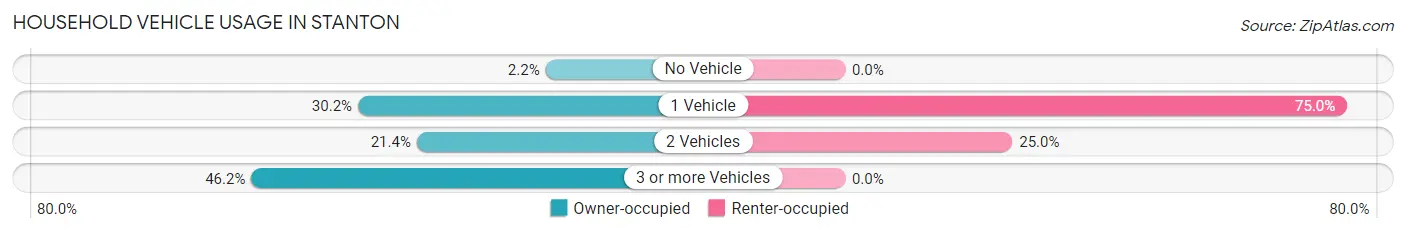
| Vehicles per Household | Owner-occupied | Renter-occupied |
| No Vehicle | 4 (2.2%) | 0 (0.0%) |
| 1 Vehicle | 55 (30.2%) | 18 (75.0%) |
| 2 Vehicles | 39 (21.4%) | 6 (25.0%) |
| 3 or more Vehicles | 84 (46.2%) | 0 (0.0%) |
| Total | 182 (100.0%) | 24 (100.0%) |
Real Estate & Mortgages in Stanton
Real Estate and Mortgage Overview in Stanton
| Characteristic | Without Mortgage | With Mortgage |
| Housing Units | 131 | 51 |
| Median Property Value | $101,700 | $137,500 |
| Median Household Income | $38,942 | $19 |
| Monthly Housing Costs | $481 | $0 |
| Real Estate Taxes | $838 | $0 |
Property Value by Mortgage Status in Stanton
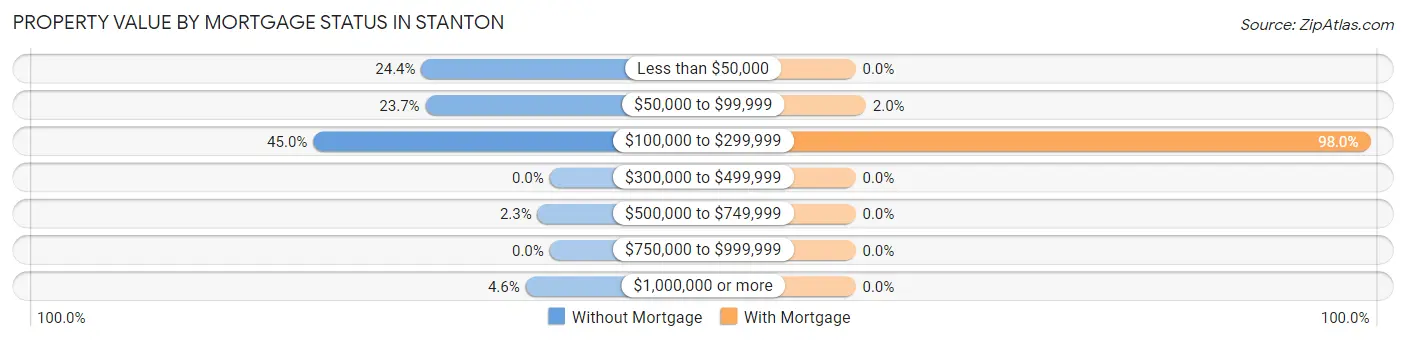
| Property Value | Without Mortgage | With Mortgage |
| Less than $50,000 | 32 (24.4%) | 0 (0.0%) |
| $50,000 to $99,999 | 31 (23.7%) | 1 (2.0%) |
| $100,000 to $299,999 | 59 (45.0%) | 50 (98.0%) |
| $300,000 to $499,999 | 0 (0.0%) | 0 (0.0%) |
| $500,000 to $749,999 | 3 (2.3%) | 0 (0.0%) |
| $750,000 to $999,999 | 0 (0.0%) | 0 (0.0%) |
| $1,000,000 or more | 6 (4.6%) | 0 (0.0%) |
| Total | 131 (100.0%) | 51 (100.0%) |
Household Income by Mortgage Status in Stanton
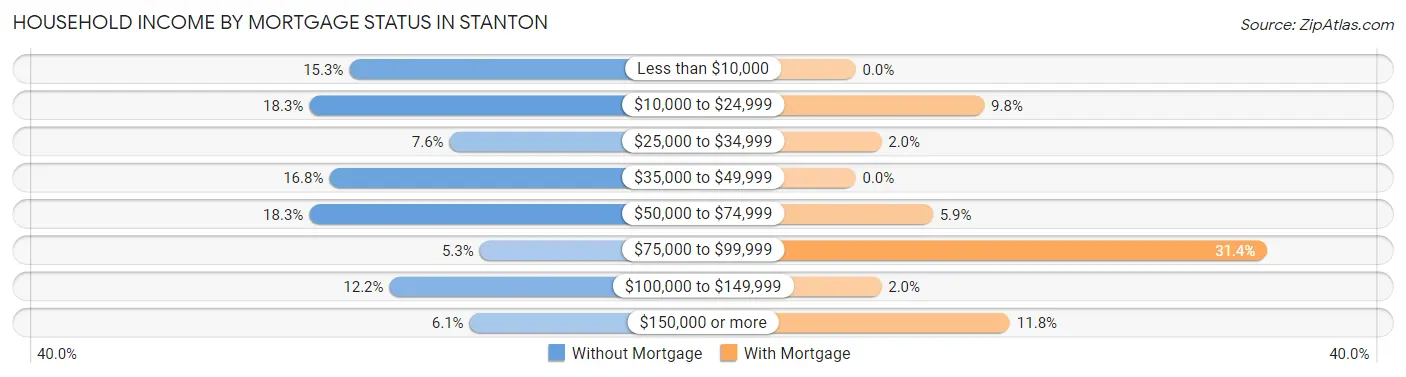
| Household Income | Without Mortgage | With Mortgage |
| Less than $10,000 | 20 (15.3%) | 0 (0.0%) |
| $10,000 to $24,999 | 24 (18.3%) | 5 (9.8%) |
| $25,000 to $34,999 | 10 (7.6%) | 1 (2.0%) |
| $35,000 to $49,999 | 22 (16.8%) | 0 (0.0%) |
| $50,000 to $74,999 | 24 (18.3%) | 3 (5.9%) |
| $75,000 to $99,999 | 7 (5.3%) | 16 (31.4%) |
| $100,000 to $149,999 | 16 (12.2%) | 1 (2.0%) |
| $150,000 or more | 8 (6.1%) | 6 (11.8%) |
| Total | 131 (100.0%) | 51 (100.0%) |
Property Value to Household Income Ratio in Stanton
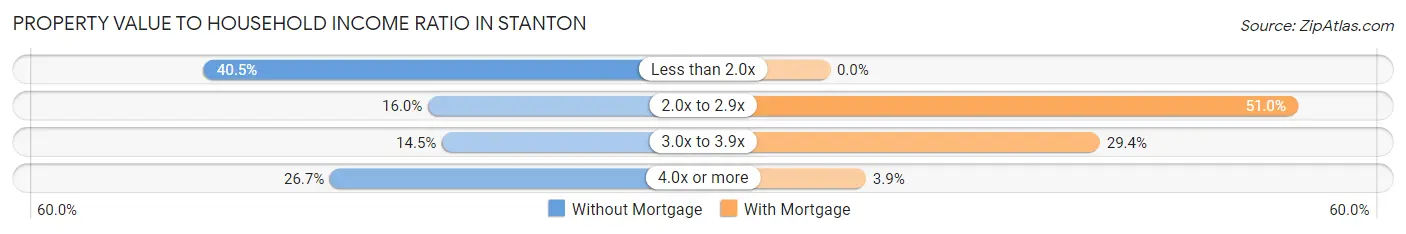
| Value-to-Income Ratio | Without Mortgage | With Mortgage |
| Less than 2.0x | 53 (40.5%) | 0 (0.0%) |
| 2.0x to 2.9x | 21 (16.0%) | 26 (51.0%) |
| 3.0x to 3.9x | 19 (14.5%) | 15 (29.4%) |
| 4.0x or more | 35 (26.7%) | 2 (3.9%) |
| Total | 131 (100.0%) | 51 (100.0%) |
Real Estate Taxes by Mortgage Status in Stanton
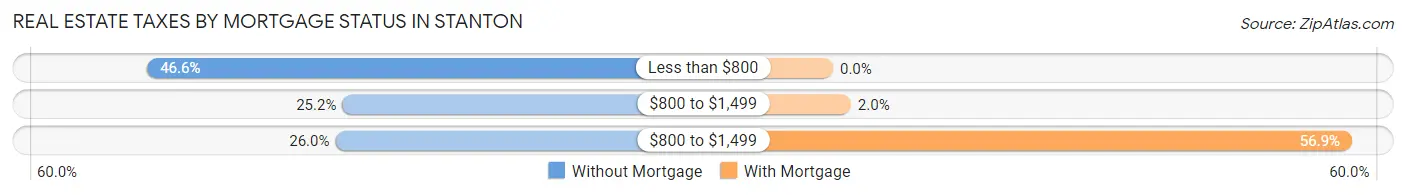
| Property Taxes | Without Mortgage | With Mortgage |
| Less than $800 | 61 (46.6%) | 0 (0.0%) |
| $800 to $1,499 | 33 (25.2%) | 1 (2.0%) |
| $800 to $1,499 | 34 (26.0%) | 29 (56.9%) |
| Total | 131 (100.0%) | 51 (100.0%) |
Health & Disability in Stanton
Health Insurance Coverage by Age in Stanton
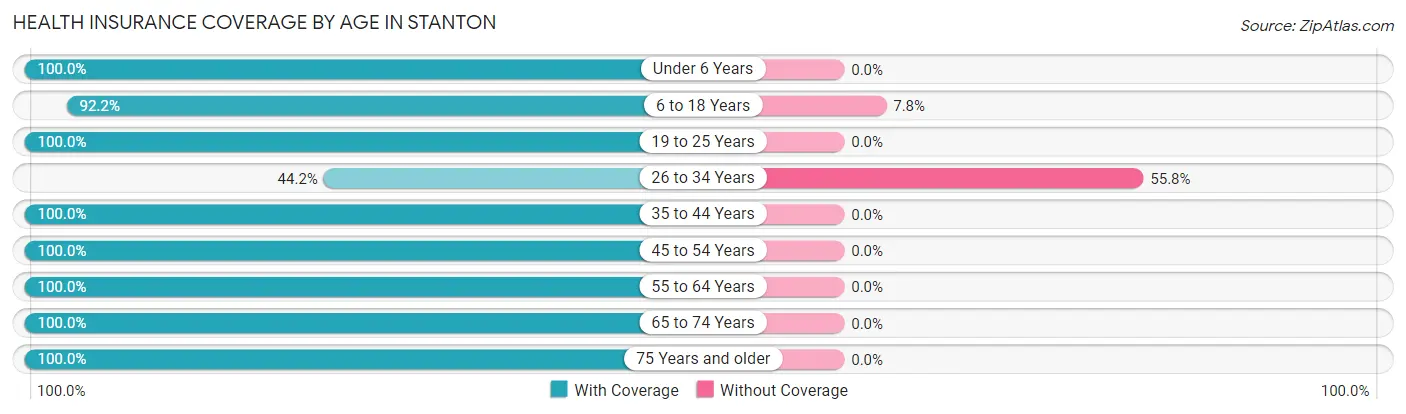
| Age Bracket | With Coverage | Without Coverage |
| Under 6 Years | 41 (100.0%) | 0 (0.0%) |
| 6 to 18 Years | 106 (92.2%) | 9 (7.8%) |
| 19 to 25 Years | 28 (100.0%) | 0 (0.0%) |
| 26 to 34 Years | 23 (44.2%) | 29 (55.8%) |
| 35 to 44 Years | 74 (100.0%) | 0 (0.0%) |
| 45 to 54 Years | 47 (100.0%) | 0 (0.0%) |
| 55 to 64 Years | 63 (100.0%) | 0 (0.0%) |
| 65 to 74 Years | 77 (100.0%) | 0 (0.0%) |
| 75 Years and older | 35 (100.0%) | 0 (0.0%) |
| Total | 494 (92.9%) | 38 (7.1%) |
Health Insurance Coverage by Citizenship Status in Stanton
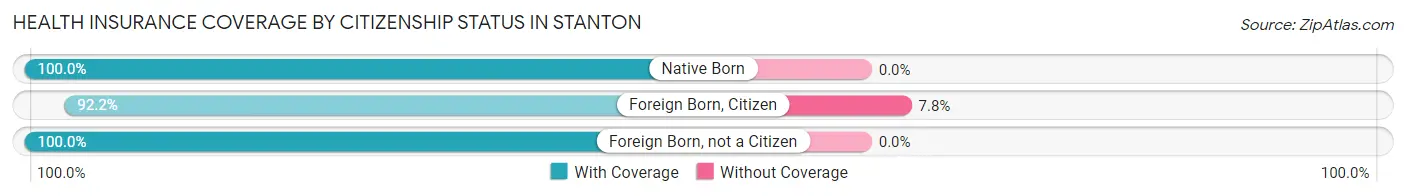
| Citizenship Status | With Coverage | Without Coverage |
| Native Born | 41 (100.0%) | 0 (0.0%) |
| Foreign Born, Citizen | 106 (92.2%) | 9 (7.8%) |
| Foreign Born, not a Citizen | 28 (100.0%) | 0 (0.0%) |
Health Insurance Coverage by Household Income in Stanton
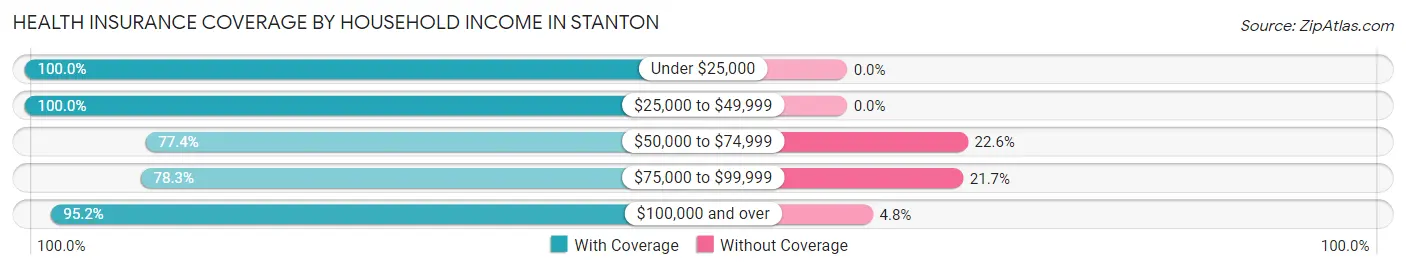
| Household Income | With Coverage | Without Coverage |
| Under $25,000 | 102 (100.0%) | 0 (0.0%) |
| $25,000 to $49,999 | 115 (100.0%) | 0 (0.0%) |
| $50,000 to $74,999 | 82 (77.4%) | 24 (22.6%) |
| $75,000 to $99,999 | 18 (78.3%) | 5 (21.7%) |
| $100,000 and over | 177 (95.2%) | 9 (4.8%) |
Public vs Private Health Insurance Coverage by Age in Stanton
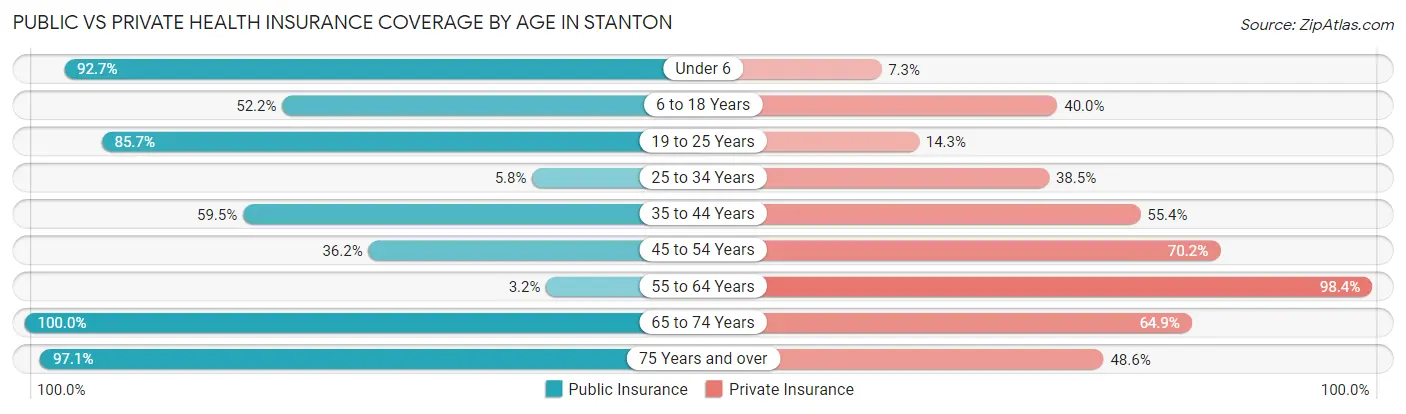
| Age Bracket | Public Insurance | Private Insurance |
| Under 6 | 38 (92.7%) | 3 (7.3%) |
| 6 to 18 Years | 60 (52.2%) | 46 (40.0%) |
| 19 to 25 Years | 24 (85.7%) | 4 (14.3%) |
| 25 to 34 Years | 3 (5.8%) | 20 (38.5%) |
| 35 to 44 Years | 44 (59.5%) | 41 (55.4%) |
| 45 to 54 Years | 17 (36.2%) | 33 (70.2%) |
| 55 to 64 Years | 2 (3.2%) | 62 (98.4%) |
| 65 to 74 Years | 77 (100.0%) | 50 (64.9%) |
| 75 Years and over | 34 (97.1%) | 17 (48.6%) |
| Total | 299 (56.2%) | 276 (51.9%) |
Disability Status by Sex by Age in Stanton
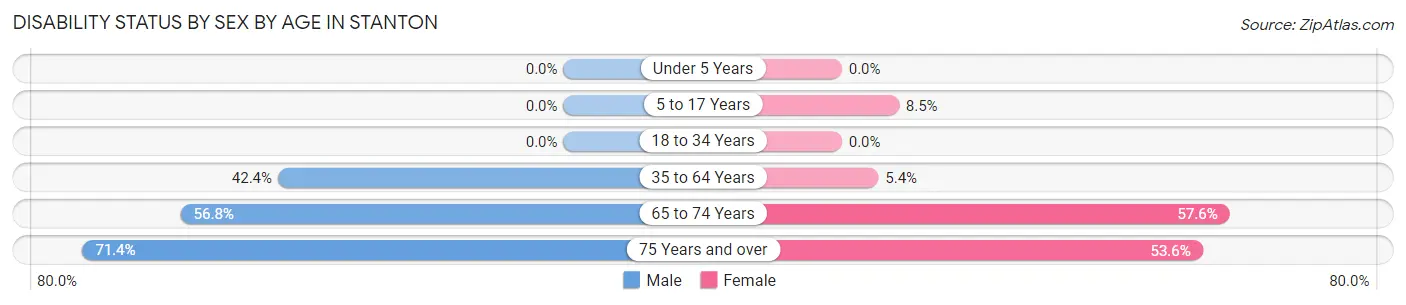
| Age Bracket | Male | Female |
| Under 5 Years | 0 (0.0%) | 0 (0.0%) |
| 5 to 17 Years | 0 (0.0%) | 5 (8.5%) |
| 18 to 34 Years | 0 (0.0%) | 0 (0.0%) |
| 35 to 64 Years | 39 (42.4%) | 5 (5.4%) |
| 65 to 74 Years | 25 (56.8%) | 19 (57.6%) |
| 75 Years and over | 5 (71.4%) | 15 (53.6%) |
Disability Class by Sex by Age in Stanton
Disability Class: Hearing Difficulty
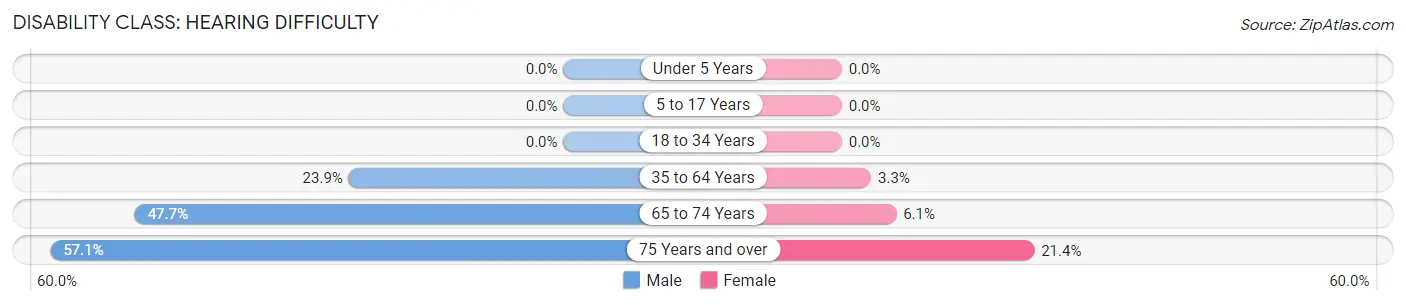
| Age Bracket | Male | Female |
| Under 5 Years | 0 (0.0%) | 0 (0.0%) |
| 5 to 17 Years | 0 (0.0%) | 0 (0.0%) |
| 18 to 34 Years | 0 (0.0%) | 0 (0.0%) |
| 35 to 64 Years | 22 (23.9%) | 3 (3.3%) |
| 65 to 74 Years | 21 (47.7%) | 2 (6.1%) |
| 75 Years and over | 4 (57.1%) | 6 (21.4%) |
Disability Class: Vision Difficulty
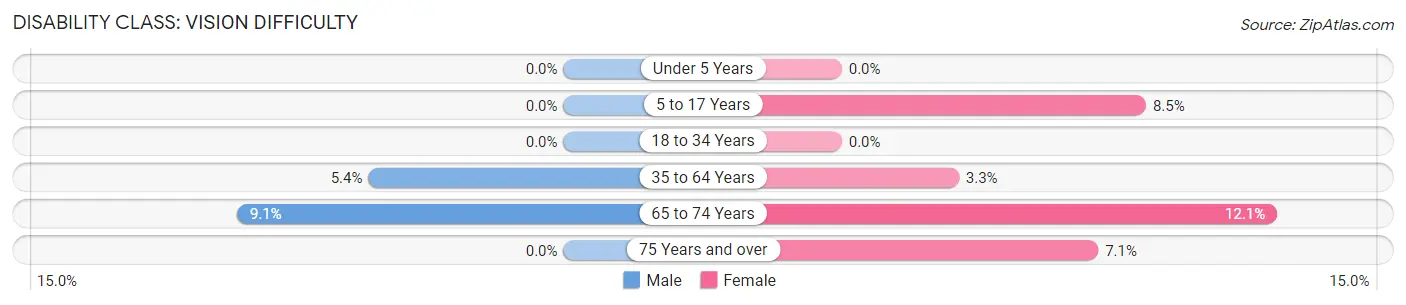
| Age Bracket | Male | Female |
| Under 5 Years | 0 (0.0%) | 0 (0.0%) |
| 5 to 17 Years | 0 (0.0%) | 5 (8.5%) |
| 18 to 34 Years | 0 (0.0%) | 0 (0.0%) |
| 35 to 64 Years | 5 (5.4%) | 3 (3.3%) |
| 65 to 74 Years | 4 (9.1%) | 4 (12.1%) |
| 75 Years and over | 0 (0.0%) | 2 (7.1%) |
Disability Class: Cognitive Difficulty
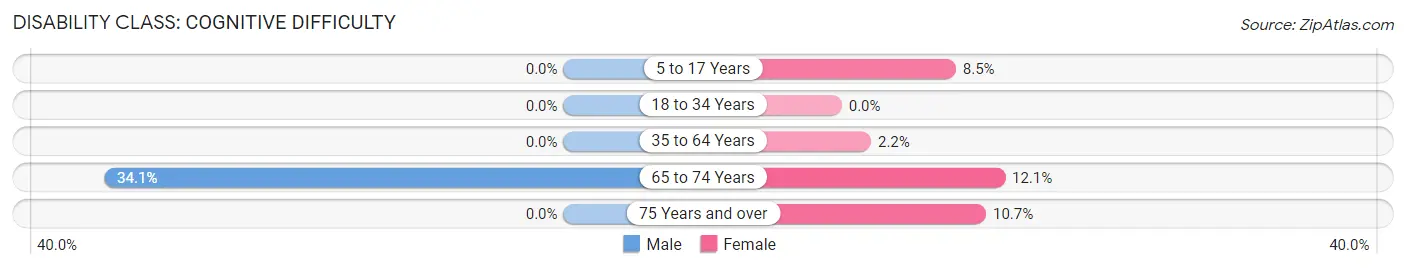
| Age Bracket | Male | Female |
| 5 to 17 Years | 0 (0.0%) | 5 (8.5%) |
| 18 to 34 Years | 0 (0.0%) | 0 (0.0%) |
| 35 to 64 Years | 0 (0.0%) | 2 (2.2%) |
| 65 to 74 Years | 15 (34.1%) | 4 (12.1%) |
| 75 Years and over | 0 (0.0%) | 3 (10.7%) |
Disability Class: Ambulatory Difficulty
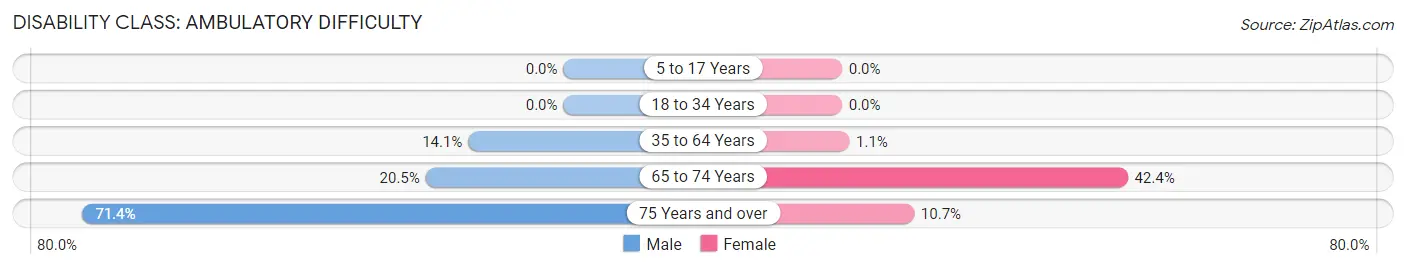
| Age Bracket | Male | Female |
| 5 to 17 Years | 0 (0.0%) | 0 (0.0%) |
| 18 to 34 Years | 0 (0.0%) | 0 (0.0%) |
| 35 to 64 Years | 13 (14.1%) | 1 (1.1%) |
| 65 to 74 Years | 9 (20.4%) | 14 (42.4%) |
| 75 Years and over | 5 (71.4%) | 3 (10.7%) |
Disability Class: Self-Care Difficulty
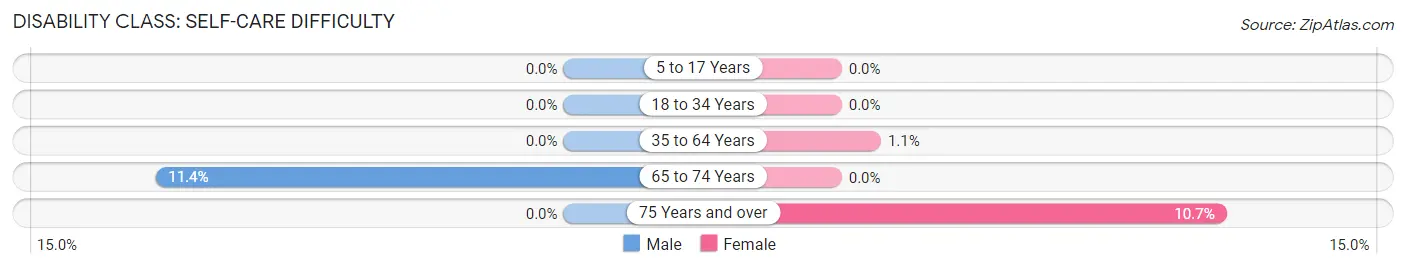
| Age Bracket | Male | Female |
| 5 to 17 Years | 0 (0.0%) | 0 (0.0%) |
| 18 to 34 Years | 0 (0.0%) | 0 (0.0%) |
| 35 to 64 Years | 0 (0.0%) | 1 (1.1%) |
| 65 to 74 Years | 5 (11.4%) | 0 (0.0%) |
| 75 Years and over | 0 (0.0%) | 3 (10.7%) |
Technology Access in Stanton
Computing Device Access in Stanton
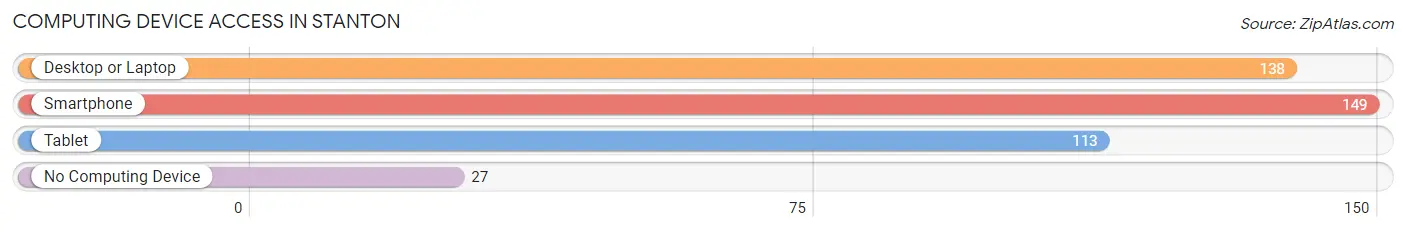
| Device Type | # Households | % Households |
| Desktop or Laptop | 138 | 67.0% |
| Smartphone | 149 | 72.3% |
| Tablet | 113 | 54.8% |
| No Computing Device | 27 | 13.1% |
| Total | 206 | 100.0% |
Internet Access in Stanton
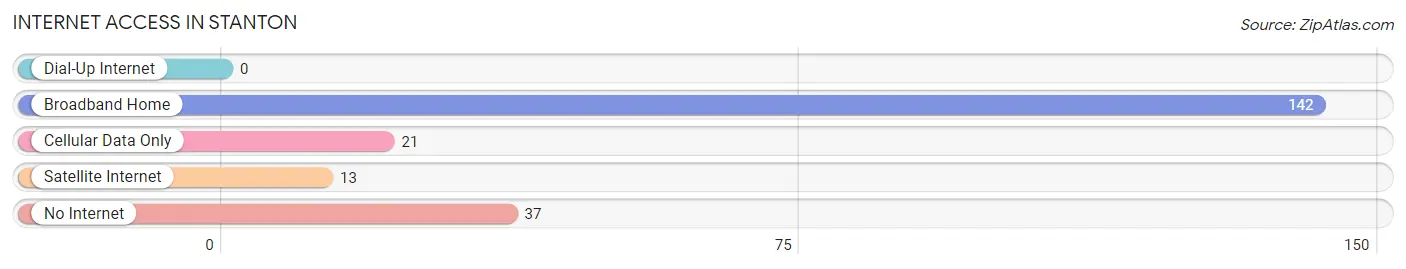
| Internet Type | # Households | % Households |
| Dial-Up Internet | 0 | 0.0% |
| Broadband Home | 142 | 68.9% |
| Cellular Data Only | 21 | 10.2% |
| Satellite Internet | 13 | 6.3% |
| No Internet | 37 | 18.0% |
| Total | 206 | 100.0% |
Stanton Summary
Stanton is a small city located in the state of North Dakota, United States. It is situated in the southwestern part of the state, in the county of Mercer. The city has a population of approximately 1,000 people, and is the county seat of Mercer County.
Geography
Stanton is located in the southwestern part of North Dakota, in the county of Mercer. It is situated at an elevation of 1,845 feet (562 meters) above sea level. The city is located on the banks of the Missouri River, and is surrounded by rolling hills and prairies. The climate in Stanton is semi-arid, with hot summers and cold winters.
Economy
Stanton’s economy is largely based on agriculture and tourism. The city is home to several farms, which produce a variety of crops, including wheat, corn, soybeans, and sunflowers. The city also has a number of small businesses, including restaurants, retail stores, and service providers. Tourism is also an important part of the local economy, with visitors coming to the area to enjoy the natural beauty of the area, as well as to take part in outdoor activities such as fishing, hunting, and camping.
Demographics
As of the 2010 census, the population of Stanton was 1,000 people. The racial makeup of the city was 97.2% White, 0.3% African American, 0.2% Native American, 0.2% Asian, 0.1% Pacific Islander, 0.7% from other races, and 1.3% from two or more races. Hispanic or Latino of any race were 1.3% of the population.
The median income for a household in Stanton was $37,500, and the median income for a family was $45,000. The per capita income for the city was $18,000. About 11.2% of families and 14.2% of the population were below the poverty line, including 18.2% of those under age 18 and 8.3% of those age 65 or over.
History
Stanton was founded in 1883, when the Northern Pacific Railroad was built through the area. The city was named after the railroad’s president, William Stanton. The city quickly grew, and by the early 1900s, it had become a major agricultural center. In the 1950s, the city began to decline, as many of its residents moved away in search of better economic opportunities. However, in recent years, the city has seen a resurgence, with new businesses and residents moving to the area.
Conclusion
Stanton is a small city located in the southwestern part of North Dakota. It has a population of approximately 1,000 people, and is the county seat of Mercer County. The city’s economy is largely based on agriculture and tourism, and its population is predominantly White. Stanton has a long history, having been founded in 1883, and has seen a resurgence in recent years, with new businesses and residents moving to the area.
Common Questions
What is Per Capita Income in Stanton?
Per Capita income in Stanton is $33,479.
What is the Median Household income in Stanton?
Median Household Income in Stanton is $56,042.
What is Income or Wage Gap in Stanton?
Income or Wage Gap in Stanton is 60.8%.
Women in Stanton earn 39.2 cents for every dollar earned by a man.
What is Inequality or Gini Index in Stanton?
Inequality or Gini Index in Stanton is 0.49.
What is the Total Population of Stanton?
Total Population of Stanton is 548.
What is the Total Male Population of Stanton?
Total Male Population of Stanton is 265.
What is the Total Female Population of Stanton?
Total Female Population of Stanton is 283.
What is the Ratio of Males per 100 Females in Stanton?
There are 93.64 Males per 100 Females in Stanton.
What is the Ratio of Females per 100 Males in Stanton?
There are 106.79 Females per 100 Males in Stanton.
What is the Median Population Age in Stanton?
Median Population Age in Stanton is 39.0 Years.
What is the Average Family Size in Stanton
Average Family Size in Stanton is 3.3 People.
What is the Average Household Size in Stanton
Average Household Size in Stanton is 2.6 People.
How Large is the Labor Force in Stanton?
There are 226 People in the Labor Forcein in Stanton.
What is the Percentage of People in the Labor Force in Stanton?
55.3% of People are in the Labor Force in Stanton.
What is the Unemployment Rate in Stanton?
Unemployment Rate in Stanton is 2.7%.