Osnabrock, ND Map & Demographics
Osnabrock Map
Osnabrock Overview
$33,659
PER CAPITA INCOME
$35,430
AVG HOUSEHOLD INCOME
0.52
INEQUALITY / GINI INDEX
175
TOTAL POPULATION
65
MALE POPULATION
110
FEMALE POPULATION
59.09
MALES / 100 FEMALES
169.23
FEMALES / 100 MALES
71.8
MEDIAN AGE
2.8
AVG FAMILY SIZE
1.4
AVG HOUSEHOLD SIZE
49
LABOR FORCE [ PEOPLE ]
31.0%
PERCENT IN LABOR FORCE
2.0%
UNEMPLOYMENT RATE
Osnabrock Zip Codes
Osnabrock Area Codes
Income in Osnabrock
Income Overview in Osnabrock
| Characteristic | Number | Measure |
| Per Capita Income | 175 | $33,659 |
| Median Family Income | 18 | $0 |
| Mean Family Income | 18 | $114,539 |
| Median Household Income | 97 | $35,430 |
| Mean Household Income | 97 | $47,985 |
| Income Deficit | 18 | $0 |
| Wage / Income Gap (%) | 175 | 0.00% |
| Wage / Income Gap ($) | 175 | 100.00¢ per $1 |
| Gini / Inequality Index | 175 | 0.52 |
Earnings by Sex in Osnabrock
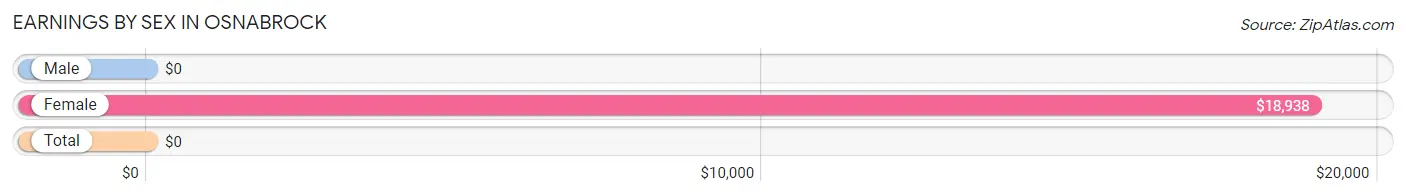
| Sex | Number | Average Earnings |
| Male | 17 (34.0%) | $0 |
| Female | 33 (66.0%) | $18,938 |
| Total | 50 (100.0%) | $0 |
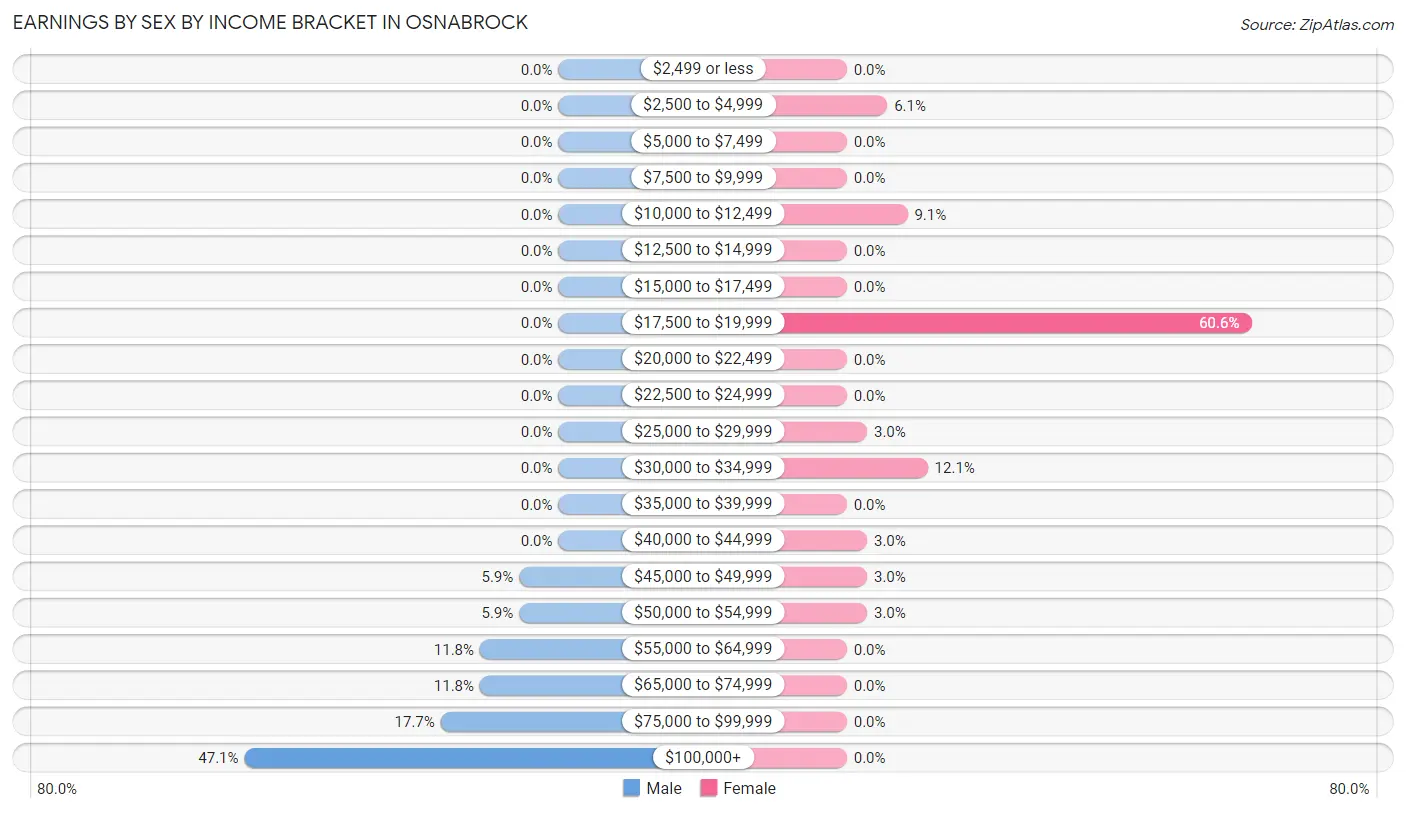
Earnings by Sex by Income Bracket in Osnabrock
The most common earnings brackets in Osnabrock are $100,000+ for men (8 | 47.1%) and $17,500 to $19,999 for women (20 | 60.6%).
| Income | Male | Female |
| $2,499 or less | 0 (0.0%) | 0 (0.0%) |
| $2,500 to $4,999 | 0 (0.0%) | 2 (6.1%) |
| $5,000 to $7,499 | 0 (0.0%) | 0 (0.0%) |
| $7,500 to $9,999 | 0 (0.0%) | 0 (0.0%) |
| $10,000 to $12,499 | 0 (0.0%) | 3 (9.1%) |
| $12,500 to $14,999 | 0 (0.0%) | 0 (0.0%) |
| $15,000 to $17,499 | 0 (0.0%) | 0 (0.0%) |
| $17,500 to $19,999 | 0 (0.0%) | 20 (60.6%) |
| $20,000 to $22,499 | 0 (0.0%) | 0 (0.0%) |
| $22,500 to $24,999 | 0 (0.0%) | 0 (0.0%) |
| $25,000 to $29,999 | 0 (0.0%) | 1 (3.0%) |
| $30,000 to $34,999 | 0 (0.0%) | 4 (12.1%) |
| $35,000 to $39,999 | 0 (0.0%) | 0 (0.0%) |
| $40,000 to $44,999 | 0 (0.0%) | 1 (3.0%) |
| $45,000 to $49,999 | 1 (5.9%) | 1 (3.0%) |
| $50,000 to $54,999 | 1 (5.9%) | 1 (3.0%) |
| $55,000 to $64,999 | 2 (11.8%) | 0 (0.0%) |
| $65,000 to $74,999 | 2 (11.8%) | 0 (0.0%) |
| $75,000 to $99,999 | 3 (17.6%) | 0 (0.0%) |
| $100,000+ | 8 (47.1%) | 0 (0.0%) |
| Total | 17 (100.0%) | 33 (100.0%) |
Earnings by Sex by Educational Attainment in Osnabrock
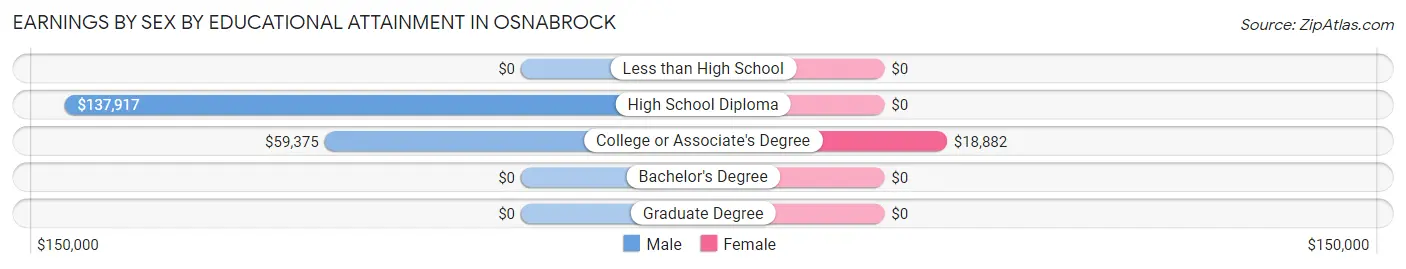
| Educational Attainment | Male Income | Female Income |
| Less than High School | - | - |
| High School Diploma | $137,917 | $0 |
| College or Associate's Degree | $59,375 | $18,882 |
| Bachelor's Degree | - | - |
| Graduate Degree | - | - |
| Total | - | - |
Family Income in Osnabrock
Family Income Brackets in Osnabrock
According to the Osnabrock family income data, there are 5 families falling into the $200,000+ income range, which is the most common income bracket and makes up 27.8% of all families.
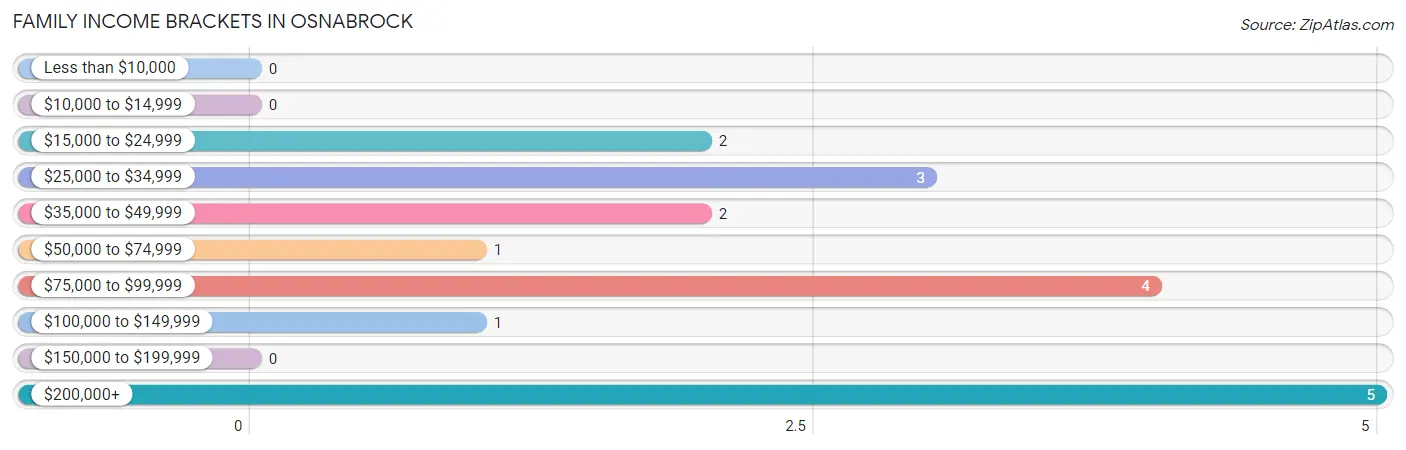
| Income Bracket | # Families | % Families |
| Less than $10,000 | 0 | 0.0% |
| $10,000 to $14,999 | 0 | 0.0% |
| $15,000 to $24,999 | 2 | 11.1% |
| $25,000 to $34,999 | 3 | 16.7% |
| $35,000 to $49,999 | 2 | 11.1% |
| $50,000 to $74,999 | 1 | 5.6% |
| $75,000 to $99,999 | 4 | 22.2% |
| $100,000 to $149,999 | 1 | 5.6% |
| $150,000 to $199,999 | 0 | 0.0% |
| $200,000+ | 5 | 27.8% |
Family Income by Famaliy Size in Osnabrock
2-person families (12 | 66.7%) account for the highest median family income in Osnabrock with $43,750 per family, while 2-person families (12 | 66.7%) have the highest median income of $21,875 per family member.
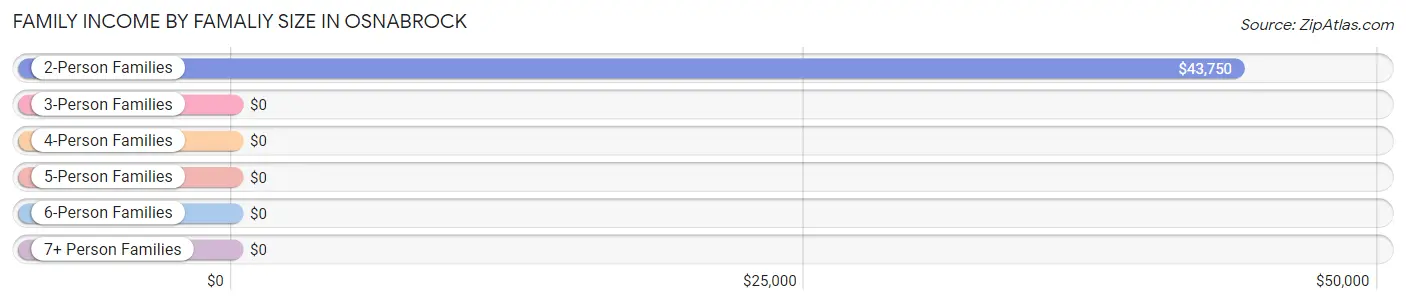
| Income Bracket | # Families | Median Income |
| 2-Person Families | 12 (66.7%) | $43,750 |
| 3-Person Families | 0 (0.0%) | $0 |
| 4-Person Families | 6 (33.3%) | $0 |
| 5-Person Families | 0 (0.0%) | $0 |
| 6-Person Families | 0 (0.0%) | $0 |
| 7+ Person Families | 0 (0.0%) | $0 |
| Total | 18 (100.0%) | $0 |
Family Income by Number of Earners in Osnabrock
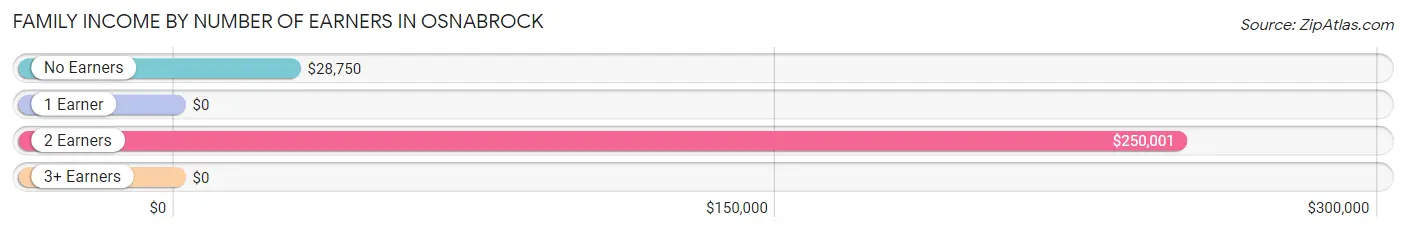
| Number of Earners | # Families | Median Income |
| No Earners | 8 (44.4%) | $28,750 |
| 1 Earner | 1 (5.6%) | $0 |
| 2 Earners | 9 (50.0%) | $250,001 |
| 3+ Earners | 0 (0.0%) | $0 |
| Total | 18 (100.0%) | $0 |
Household Income in Osnabrock
Household Income Brackets in Osnabrock
With 35 households falling in the category, the $35,000 to $49,999 income range is the most frequent in Osnabrock, accounting for 36.1% of all households.
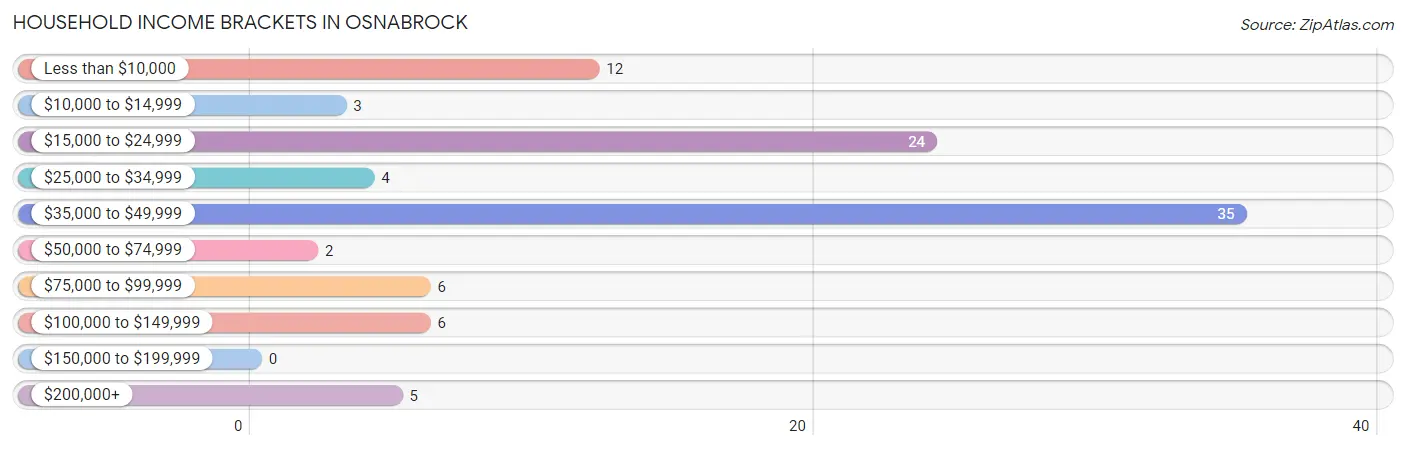
| Income Bracket | # Households | % Households |
| Less than $10,000 | 12 | 12.4% |
| $10,000 to $14,999 | 3 | 3.1% |
| $15,000 to $24,999 | 24 | 24.7% |
| $25,000 to $34,999 | 4 | 4.1% |
| $35,000 to $49,999 | 35 | 36.1% |
| $50,000 to $74,999 | 2 | 2.1% |
| $75,000 to $99,999 | 6 | 6.2% |
| $100,000 to $149,999 | 6 | 6.2% |
| $150,000 to $199,999 | 0 | 0.0% |
| $200,000+ | 5 | 5.2% |
Household Income by Householder Age in Osnabrock
The median household income in Osnabrock is $35,430, with the highest median household income of $250,001 found in the 25 to 44 years age bracket for the primary householder. A total of 8 households (8.3%) fall into this category. Meanwhile, the 15 to 24 years age bracket for the primary householder has the lowest median household income of $0, with 1 households (1.0%) in this group.
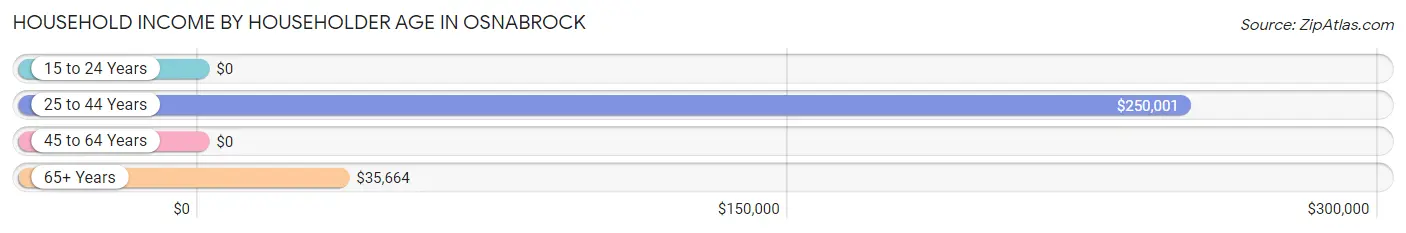
| Income Bracket | # Households | Median Income |
| 15 to 24 Years | 1 (1.0%) | $0 |
| 25 to 44 Years | 8 (8.3%) | $250,001 |
| 45 to 64 Years | 31 (32.0%) | $0 |
| 65+ Years | 57 (58.8%) | $35,664 |
| Total | 97 (100.0%) | $35,430 |
Poverty in Osnabrock
Income Below Poverty by Sex and Age in Osnabrock
With 8.1% poverty level for males and 16.2% for females among the residents of Osnabrock, 55 to 64 year old males and 45 to 54 year old females are the most vulnerable to poverty, with 3 males (30.0%) and 3 females (100.0%) in their respective age groups living below the poverty level.
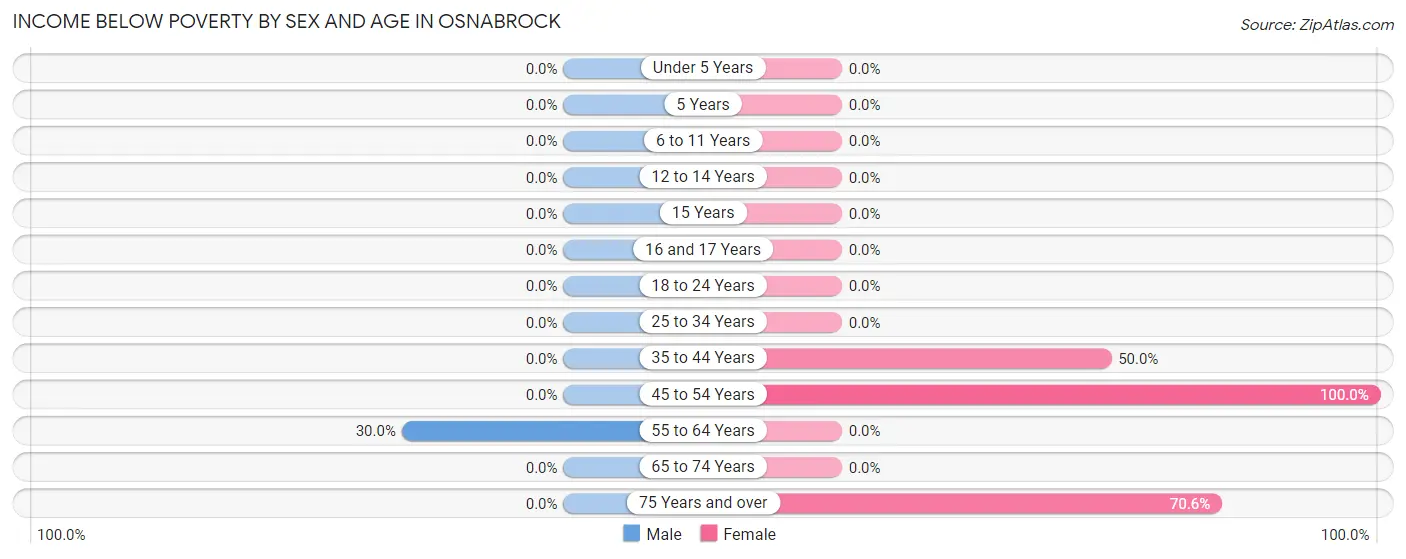
| Age Bracket | Male | Female |
| Under 5 Years | 0 (0.0%) | 0 (0.0%) |
| 5 Years | 0 (0.0%) | 0 (0.0%) |
| 6 to 11 Years | 0 (0.0%) | 0 (0.0%) |
| 12 to 14 Years | 0 (0.0%) | 0 (0.0%) |
| 15 Years | 0 (0.0%) | 0 (0.0%) |
| 16 and 17 Years | 0 (0.0%) | 0 (0.0%) |
| 18 to 24 Years | 0 (0.0%) | 0 (0.0%) |
| 25 to 34 Years | 0 (0.0%) | 0 (0.0%) |
| 35 to 44 Years | 0 (0.0%) | 1 (50.0%) |
| 45 to 54 Years | 0 (0.0%) | 3 (100.0%) |
| 55 to 64 Years | 3 (30.0%) | 0 (0.0%) |
| 65 to 74 Years | 0 (0.0%) | 0 (0.0%) |
| 75 Years and over | 0 (0.0%) | 12 (70.6%) |
| Total | 3 (8.1%) | 16 (16.2%) |
Income Above Poverty by Sex and Age in Osnabrock
According to the poverty statistics in Osnabrock, males aged under 5 years and females aged 6 to 11 years are the age groups that are most secure financially, with 100.0% of males and 100.0% of females in these age groups living above the poverty line.
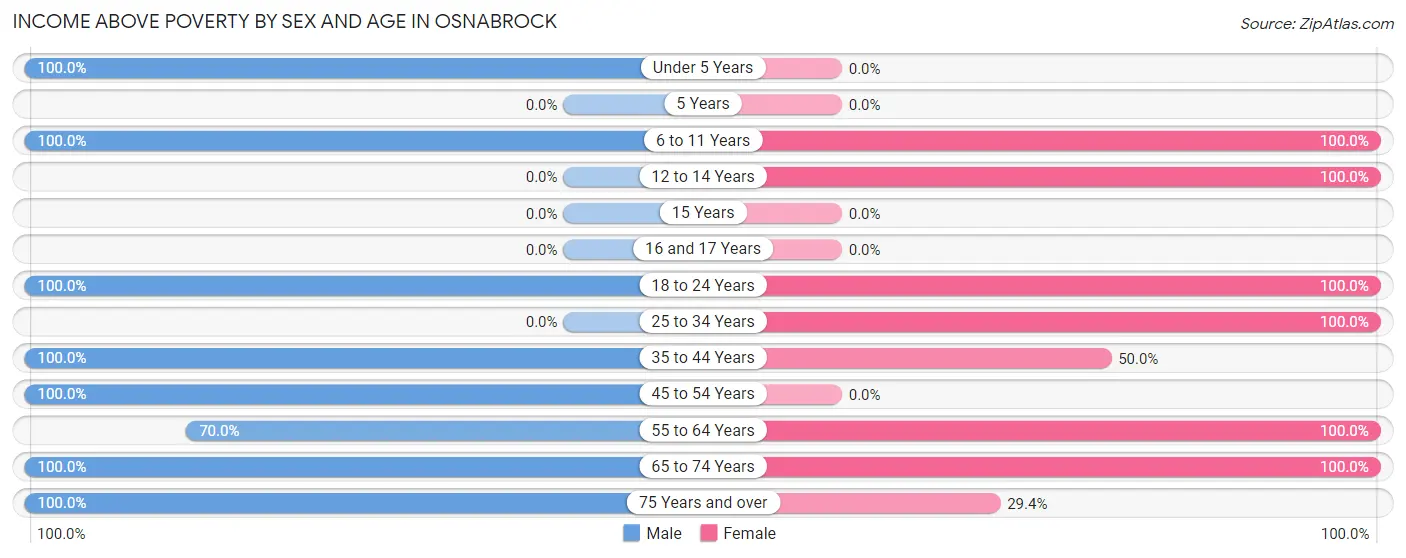
| Age Bracket | Male | Female |
| Under 5 Years | 1 (100.0%) | 0 (0.0%) |
| 5 Years | 0 (0.0%) | 0 (0.0%) |
| 6 to 11 Years | 1 (100.0%) | 5 (100.0%) |
| 12 to 14 Years | 0 (0.0%) | 5 (100.0%) |
| 15 Years | 0 (0.0%) | 0 (0.0%) |
| 16 and 17 Years | 0 (0.0%) | 0 (0.0%) |
| 18 to 24 Years | 1 (100.0%) | 1 (100.0%) |
| 25 to 34 Years | 0 (0.0%) | 4 (100.0%) |
| 35 to 44 Years | 7 (100.0%) | 1 (50.0%) |
| 45 to 54 Years | 3 (100.0%) | 0 (0.0%) |
| 55 to 64 Years | 7 (70.0%) | 23 (100.0%) |
| 65 to 74 Years | 9 (100.0%) | 39 (100.0%) |
| 75 Years and over | 5 (100.0%) | 5 (29.4%) |
| Total | 34 (91.9%) | 83 (83.8%) |
Income Below Poverty Among Married-Couple Families in Osnabrock
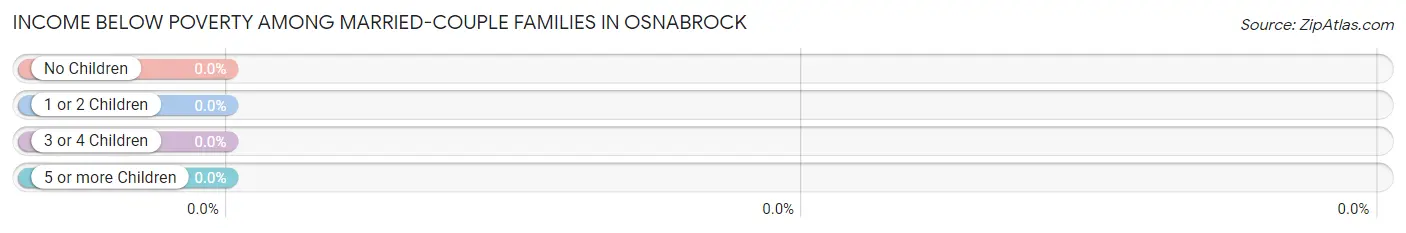
| Children | Above Poverty | Below Poverty |
| No Children | 12 (100.0%) | 0 (0.0%) |
| 1 or 2 Children | 6 (100.0%) | 0 (0.0%) |
| 3 or 4 Children | 0 (0.0%) | 0 (0.0%) |
| 5 or more Children | 0 (0.0%) | 0 (0.0%) |
| Total | 18 (100.0%) | 0 (0.0%) |
Income Below Poverty Among Single-Parent Households in Osnabrock
| Children | Single Father | Single Mother |
| No Children | 0 (0.0%) | 0 (0.0%) |
| 1 or 2 Children | 0 (0.0%) | 0 (0.0%) |
| 3 or 4 Children | 0 (0.0%) | 0 (0.0%) |
| 5 or more Children | 0 (0.0%) | 0 (0.0%) |
| Total | 0 (0.0%) | 0 (0.0%) |
Income Below Poverty Among Married-Couple vs Single-Parent Households in Osnabrock
| Children | Married-Couple Families | Single-Parent Households |
| No Children | 0 (0.0%) | 0 (0.0%) |
| 1 or 2 Children | 0 (0.0%) | 0 (0.0%) |
| 3 or 4 Children | 0 (0.0%) | 0 (0.0%) |
| 5 or more Children | 0 (0.0%) | 0 (0.0%) |
| Total | 0 (0.0%) | 0 (0.0%) |
Race in Osnabrock
The most populous races in Osnabrock are White / Caucasian (120 | 68.6%), Some other Race (36 | 20.6%), and Hispanic or Latino (32 | 18.3%).
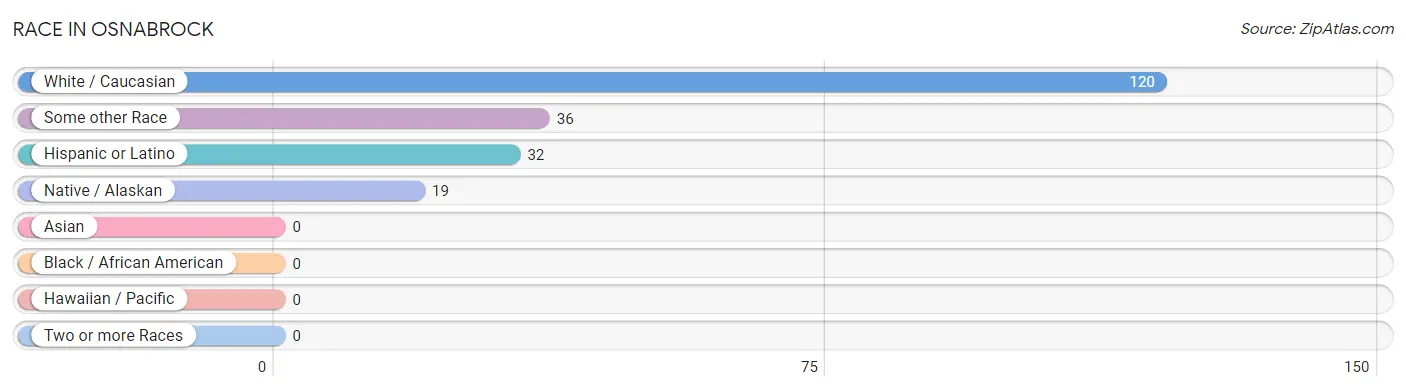
| Race | # Population | % Population |
| Asian | 0 | 0.0% |
| Black / African American | 0 | 0.0% |
| Hawaiian / Pacific | 0 | 0.0% |
| Hispanic or Latino | 32 | 18.3% |
| Native / Alaskan | 19 | 10.9% |
| White / Caucasian | 120 | 68.6% |
| Two or more Races | 0 | 0.0% |
| Some other Race | 36 | 20.6% |
| Total | 175 | 100.0% |
Ancestry in Osnabrock
The most populous ancestries reported in Osnabrock are Norwegian (43 | 24.6%), Central American (32 | 18.3%), German (32 | 18.3%), Panamanian (32 | 18.3%), and American (13 | 7.4%), together accounting for 86.9% of all Osnabrock residents.
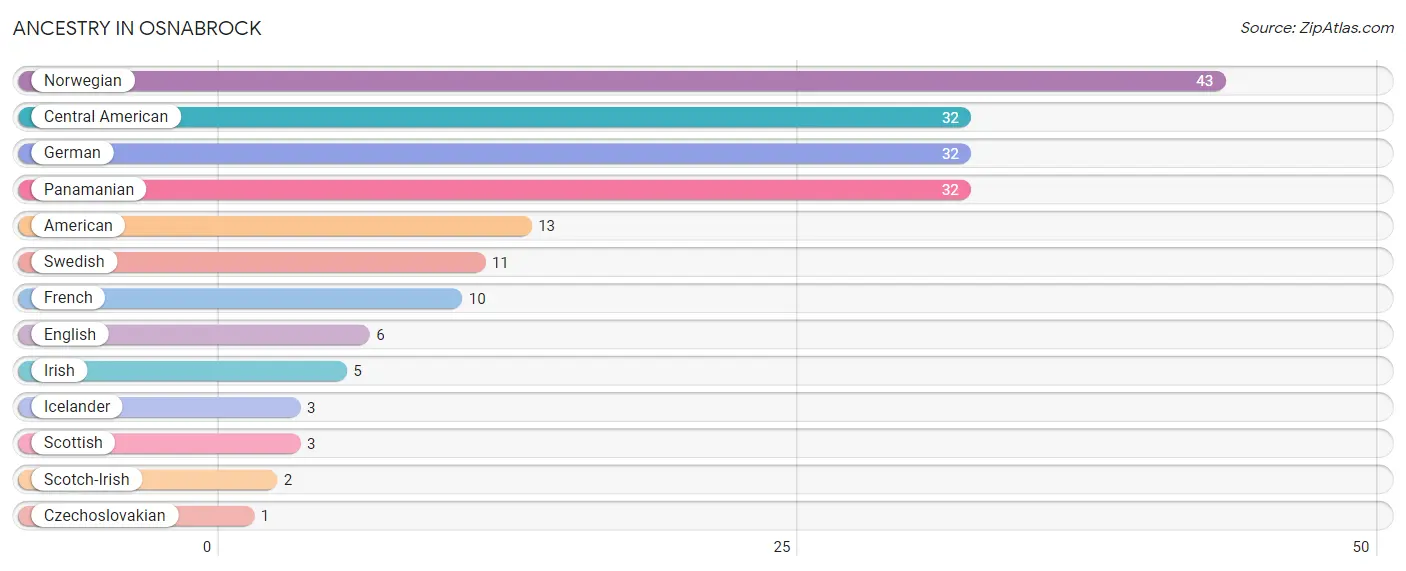
| Ancestry | # Population | % Population |
| American | 13 | 7.4% |
| Central American | 32 | 18.3% |
| Czechoslovakian | 1 | 0.6% |
| English | 6 | 3.4% |
| French | 10 | 5.7% |
| German | 32 | 18.3% |
| Icelander | 3 | 1.7% |
| Irish | 5 | 2.9% |
| Norwegian | 43 | 24.6% |
| Panamanian | 32 | 18.3% |
| Scotch-Irish | 2 | 1.1% |
| Scottish | 3 | 1.7% |
| Swedish | 11 | 6.3% | View All 13 Rows |
Immigrants in Osnabrock
The most numerous immigrant groups reported in Osnabrock came from Central America (32 | 18.3%), Latin America (32 | 18.3%), and Panama (32 | 18.3%), together accounting for 54.9% of all Osnabrock residents.
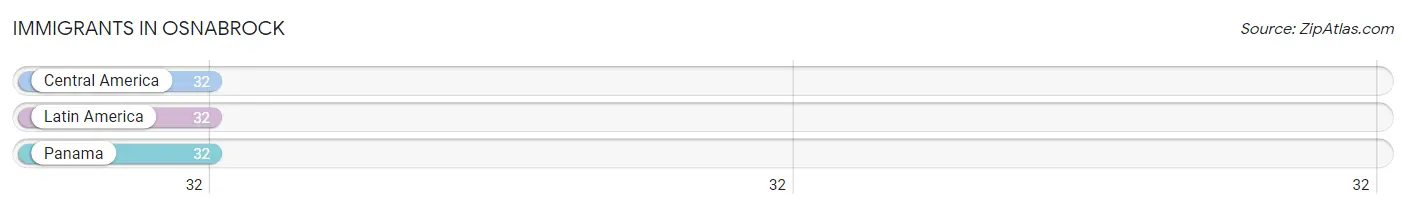
| Immigration Origin | # Population | % Population |
| Central America | 32 | 18.3% |
| Latin America | 32 | 18.3% |
| Panama | 32 | 18.3% | View All 3 Rows |
Sex and Age in Osnabrock
Sex and Age in Osnabrock
The most populous age groups in Osnabrock are 65 to 69 Years (13 | 20.0%) for men and 70 to 74 Years (38 | 34.5%) for women.
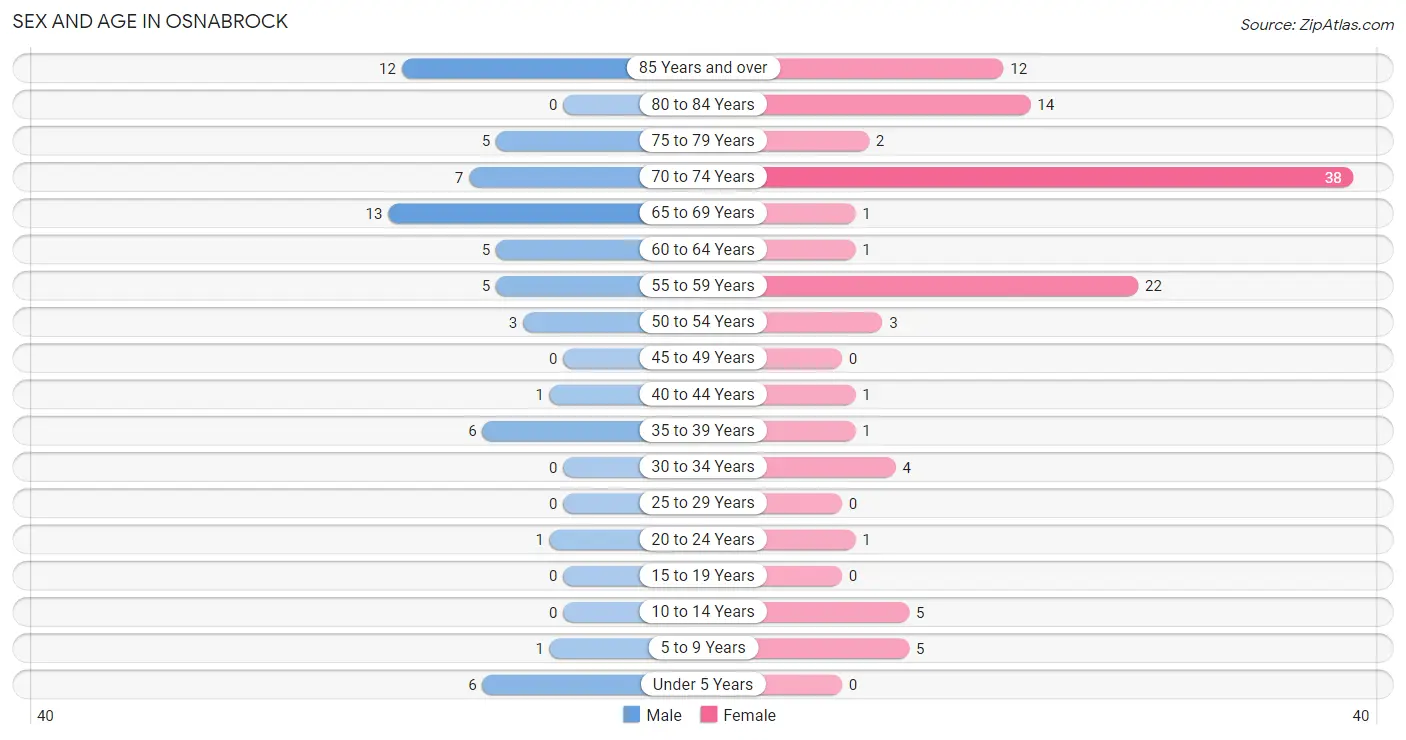
| Age Bracket | Male | Female |
| Under 5 Years | 6 (9.2%) | 0 (0.0%) |
| 5 to 9 Years | 1 (1.5%) | 5 (4.5%) |
| 10 to 14 Years | 0 (0.0%) | 5 (4.5%) |
| 15 to 19 Years | 0 (0.0%) | 0 (0.0%) |
| 20 to 24 Years | 1 (1.5%) | 1 (0.9%) |
| 25 to 29 Years | 0 (0.0%) | 0 (0.0%) |
| 30 to 34 Years | 0 (0.0%) | 4 (3.6%) |
| 35 to 39 Years | 6 (9.2%) | 1 (0.9%) |
| 40 to 44 Years | 1 (1.5%) | 1 (0.9%) |
| 45 to 49 Years | 0 (0.0%) | 0 (0.0%) |
| 50 to 54 Years | 3 (4.6%) | 3 (2.7%) |
| 55 to 59 Years | 5 (7.7%) | 22 (20.0%) |
| 60 to 64 Years | 5 (7.7%) | 1 (0.9%) |
| 65 to 69 Years | 13 (20.0%) | 1 (0.9%) |
| 70 to 74 Years | 7 (10.8%) | 38 (34.5%) |
| 75 to 79 Years | 5 (7.7%) | 2 (1.8%) |
| 80 to 84 Years | 0 (0.0%) | 14 (12.7%) |
| 85 Years and over | 12 (18.5%) | 12 (10.9%) |
| Total | 65 (100.0%) | 110 (100.0%) |
Families and Households in Osnabrock
Median Family Size in Osnabrock
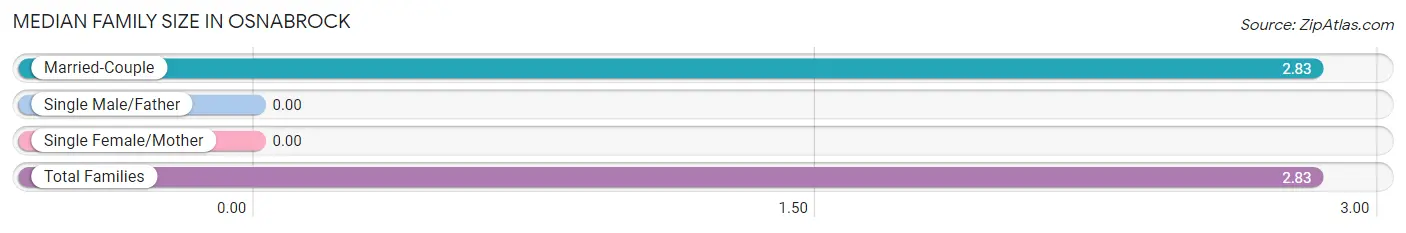
| Family Type | # Families | Family Size |
| Married-Couple | 18 (100.0%) | 2.83 |
| Single Male/Father | 0 (0.0%) | - |
| Single Female/Mother | 0 (0.0%) | - |
| Total Families | 18 (100.0%) | 2.83 |
Median Household Size in Osnabrock
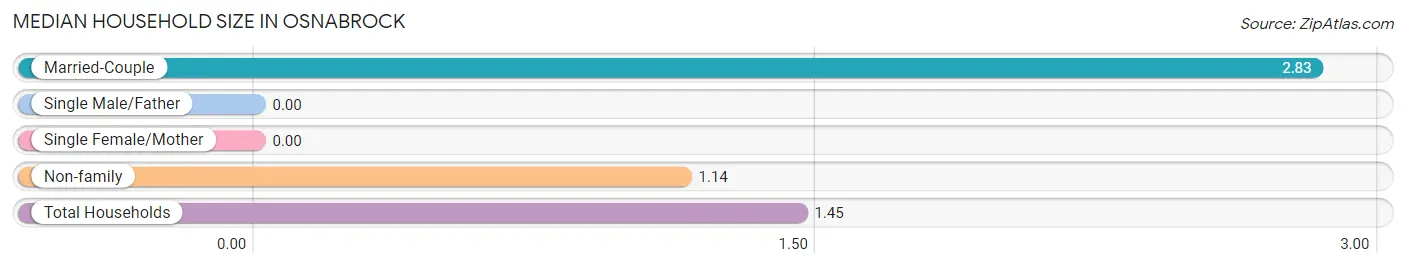
| Household Type | # Households | Household Size |
| Married-Couple | 18 (18.6%) | 2.83 |
| Single Male/Father | 0 (0.0%) | - |
| Single Female/Mother | 0 (0.0%) | - |
| Non-family | 79 (81.4%) | 1.14 |
| Total Households | 97 (100.0%) | 1.45 |
Household Size by Marriage Status in Osnabrock
Out of a total of 97 households in Osnabrock, 18 (18.6%) are family households, while 79 (81.4%) are nonfamily households. The most numerous type of family households are 2-person households, comprising 12, and the most common type of nonfamily households are 1-person households, comprising 76.
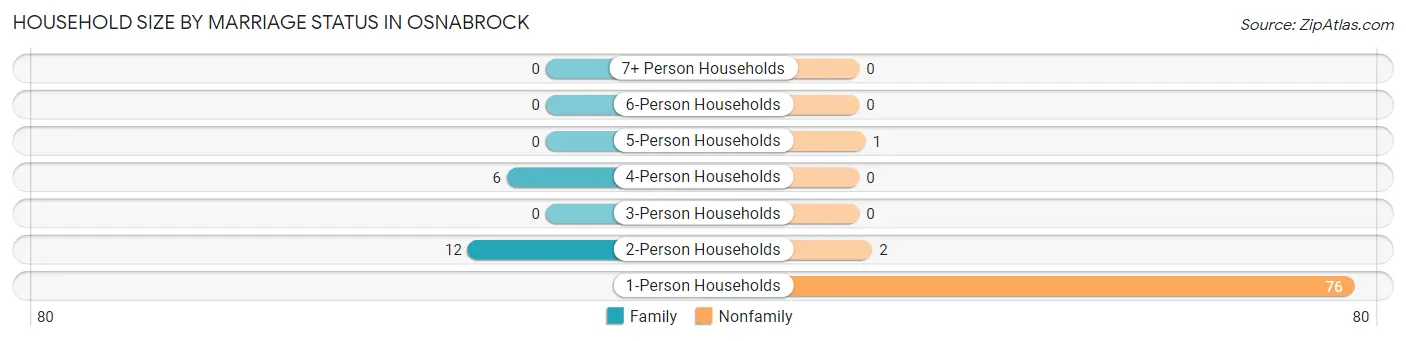
| Household Size | Family Households | Nonfamily Households |
| 1-Person Households | - | 76 (78.3%) |
| 2-Person Households | 12 (12.4%) | 2 (2.1%) |
| 3-Person Households | 0 (0.0%) | 0 (0.0%) |
| 4-Person Households | 6 (6.2%) | 0 (0.0%) |
| 5-Person Households | 0 (0.0%) | 1 (1.0%) |
| 6-Person Households | 0 (0.0%) | 0 (0.0%) |
| 7+ Person Households | 0 (0.0%) | 0 (0.0%) |
| Total | 18 (18.6%) | 79 (81.4%) |
Female Fertility in Osnabrock
Fertility by Age in Osnabrock
| Age Bracket | Women with Births | Births / 1,000 Women |
| 15 to 19 years | 0 (0.0%) | 0.0 |
| 20 to 34 years | 0 (0.0%) | 0.0 |
| 35 to 50 years | 0 (0.0%) | 0.0 |
| Total | 0 (0.0%) | 0.0 |
Fertility by Age by Marriage Status in Osnabrock
| Age Bracket | Married | Unmarried |
| 15 to 19 years | 0 (0.0%) | 0 (0.0%) |
| 20 to 34 years | 0 (0.0%) | 0 (0.0%) |
| 35 to 50 years | 0 (0.0%) | 0 (0.0%) |
| Total | 0 (0.0%) | 0 (0.0%) |
Fertility by Education in Osnabrock
| Educational Attainment | Women with Births | Births / 1,000 Women |
| Less than High School | 0 (0.0%) | 0.0 |
| High School Diploma | 0 (0.0%) | 0.0 |
| College or Associate's Degree | 0 (0.0%) | 0.0 |
| Bachelor's Degree | 0 (0.0%) | 0.0 |
| Graduate Degree | 0 (0.0%) | 0.0 |
| Total | 0 (0.0%) | 0.0 |
Fertility by Education by Marriage Status in Osnabrock
| Educational Attainment | Married | Unmarried |
| Less than High School | 0 (0.0%) | 0 (0.0%) |
| High School Diploma | 0 (0.0%) | 0 (0.0%) |
| College or Associate's Degree | 0 (0.0%) | 0 (0.0%) |
| Bachelor's Degree | 0 (0.0%) | 0 (0.0%) |
| Graduate Degree | 0 (0.0%) | 0 (0.0%) |
| Total | 0 (0.0%) | 0 (0.0%) |
Employment Characteristics in Osnabrock
Employment by Class of Employer in Osnabrock
Among the 48 employed individuals in Osnabrock, private company employees (30 | 62.5%), self-employed (not incorporated) (12 | 25.0%), and unpaid family workers (3 | 6.2%) make up the most common classes of employment.
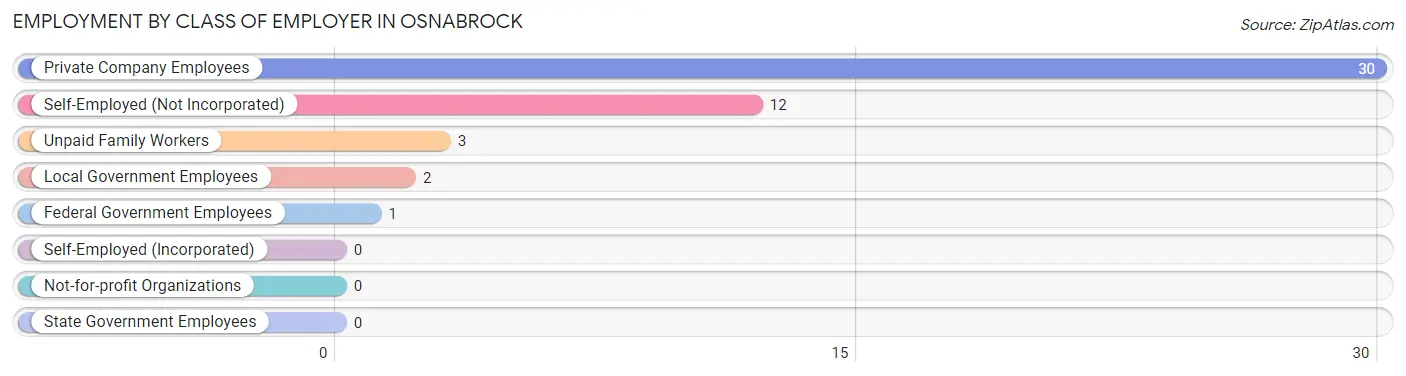
| Employer Class | # Employees | % Employees |
| Private Company Employees | 30 | 62.5% |
| Self-Employed (Incorporated) | 0 | 0.0% |
| Self-Employed (Not Incorporated) | 12 | 25.0% |
| Not-for-profit Organizations | 0 | 0.0% |
| Local Government Employees | 2 | 4.2% |
| State Government Employees | 0 | 0.0% |
| Federal Government Employees | 1 | 2.1% |
| Unpaid Family Workers | 3 | 6.2% |
| Total | 48 | 100.0% |
Employment Status by Age in Osnabrock
According to the labor force statistics for Osnabrock, out of the total population over 16 years of age (158), 31.0% or 49 individuals are in the labor force, with 2.0% or 1 of them unemployed. The age group with the highest labor force participation rate is 20 to 24 years, with 100.0% or 2 individuals in the labor force. Within the labor force, the 60 to 64 years age range has the highest percentage of unemployed individuals, with 33.3% or 1 of them being unemployed.
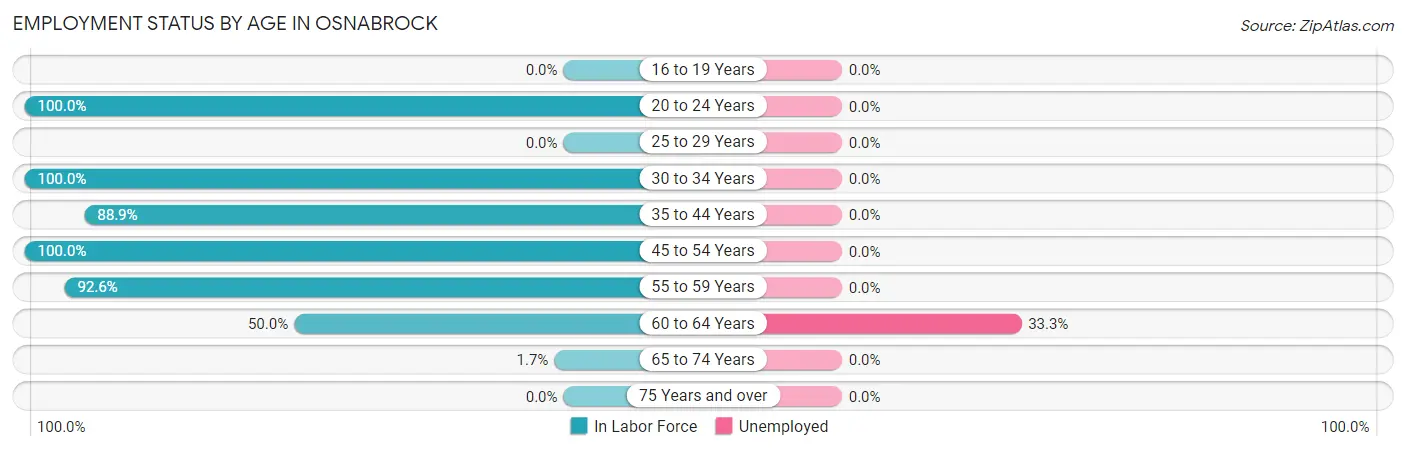
| Age Bracket | In Labor Force | Unemployed |
| 16 to 19 Years | 0 (0.0%) | 0 (0.0%) |
| 20 to 24 Years | 2 (100.0%) | 0 (0.0%) |
| 25 to 29 Years | 0 (0.0%) | 0 (0.0%) |
| 30 to 34 Years | 4 (100.0%) | 0 (0.0%) |
| 35 to 44 Years | 8 (88.9%) | 0 (0.0%) |
| 45 to 54 Years | 6 (100.0%) | 0 (0.0%) |
| 55 to 59 Years | 25 (92.6%) | 0 (0.0%) |
| 60 to 64 Years | 3 (50.0%) | 1 (33.3%) |
| 65 to 74 Years | 1 (1.7%) | 0 (0.0%) |
| 75 Years and over | 0 (0.0%) | 0 (0.0%) |
| Total | 49 (31.0%) | 1 (2.0%) |
Employment Status by Educational Attainment in Osnabrock
According to labor force statistics for Osnabrock, 88.5% of individuals (46) out of the total population between 25 and 64 years of age (52) are in the labor force, with 2.2% or 1 of them being unemployed. The group with the highest labor force participation rate are those with the educational attainment of less than high school, with 100.0% or 1 individuals in the labor force. Within the labor force, individuals with college / associate degree education have the highest percentage of unemployment, with 2.8% or 1 of them being unemployed.
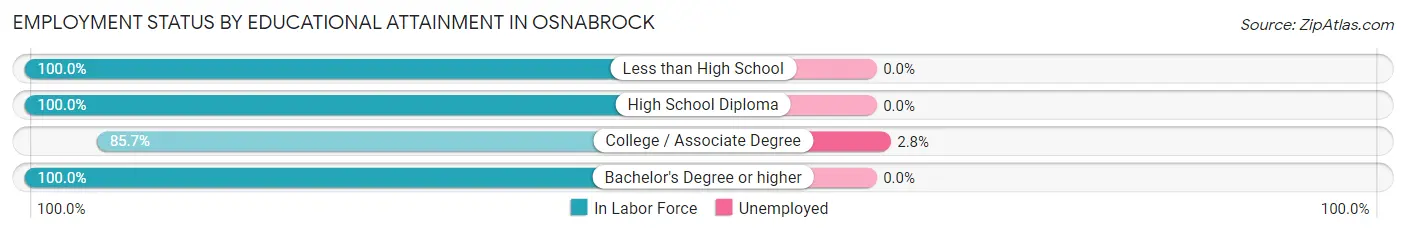
| Educational Attainment | In Labor Force | Unemployed |
| Less than High School | 1 (100.0%) | 0 (0.0%) |
| High School Diploma | 4 (100.0%) | 0 (0.0%) |
| College / Associate Degree | 36 (85.7%) | 1 (2.8%) |
| Bachelor's Degree or higher | 5 (100.0%) | 0 (0.0%) |
| Total | 46 (88.5%) | 1 (2.2%) |
Employment Occupations by Sex in Osnabrock
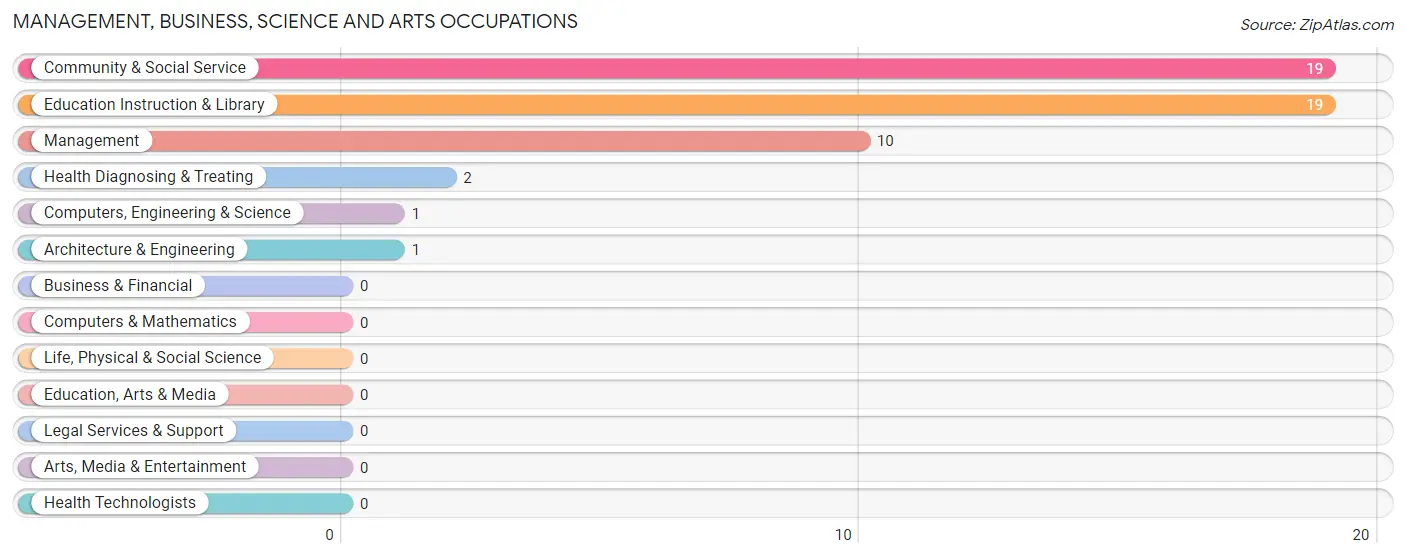
Management, Business, Science and Arts Occupations
The most common Management, Business, Science and Arts occupations in Osnabrock are Community & Social Service (19 | 39.6%), Education Instruction & Library (19 | 39.6%), Management (10 | 20.8%), Health Diagnosing & Treating (2 | 4.2%), and Computers, Engineering & Science (1 | 2.1%).
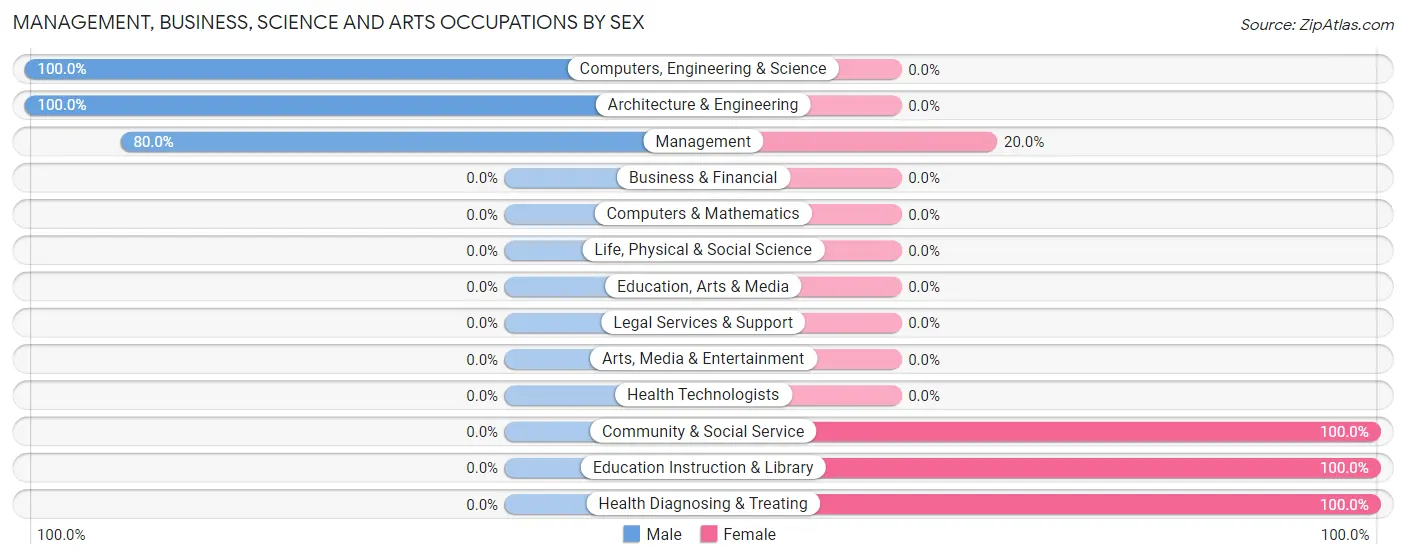
Management, Business, Science and Arts Occupations by Sex
Within the Management, Business, Science and Arts occupations in Osnabrock, the most male-oriented occupations are Computers, Engineering & Science (100.0%), Architecture & Engineering (100.0%), and Management (80.0%), while the most female-oriented occupations are Community & Social Service (100.0%), Education Instruction & Library (100.0%), and Health Diagnosing & Treating (100.0%).
| Occupation | Male | Female |
| Management | 8 (80.0%) | 2 (20.0%) |
| Business & Financial | 0 (0.0%) | 0 (0.0%) |
| Computers, Engineering & Science | 1 (100.0%) | 0 (0.0%) |
| Computers & Mathematics | 0 (0.0%) | 0 (0.0%) |
| Architecture & Engineering | 1 (100.0%) | 0 (0.0%) |
| Life, Physical & Social Science | 0 (0.0%) | 0 (0.0%) |
| Community & Social Service | 0 (0.0%) | 19 (100.0%) |
| Education, Arts & Media | 0 (0.0%) | 0 (0.0%) |
| Legal Services & Support | 0 (0.0%) | 0 (0.0%) |
| Education Instruction & Library | 0 (0.0%) | 19 (100.0%) |
| Arts, Media & Entertainment | 0 (0.0%) | 0 (0.0%) |
| Health Diagnosing & Treating | 0 (0.0%) | 2 (100.0%) |
| Health Technologists | 0 (0.0%) | 0 (0.0%) |
| Total (Category) | 9 (28.1%) | 23 (71.9%) |
| Total (Overall) | 17 (35.4%) | 31 (64.6%) |
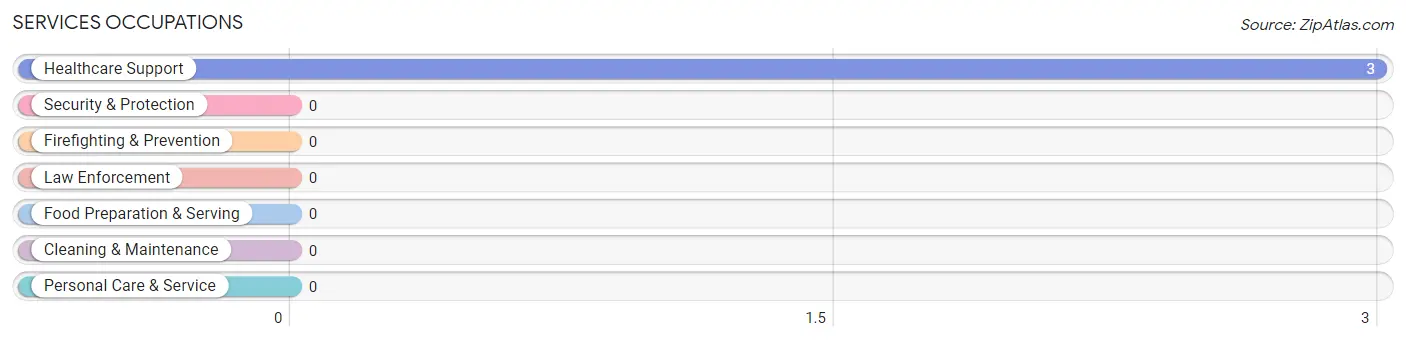
Services Occupations
The most common Services occupations in Osnabrock are , and Healthcare Support (3 | 6.2%).
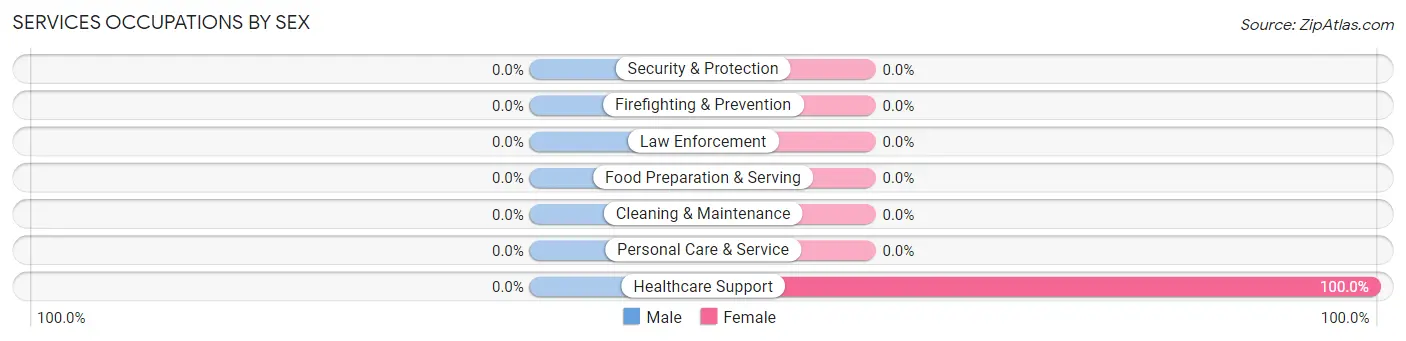
Services Occupations by Sex
| Occupation | Male | Female |
| Healthcare Support | 0 (0.0%) | 3 (100.0%) |
| Security & Protection | 0 (0.0%) | 0 (0.0%) |
| Firefighting & Prevention | 0 (0.0%) | 0 (0.0%) |
| Law Enforcement | 0 (0.0%) | 0 (0.0%) |
| Food Preparation & Serving | 0 (0.0%) | 0 (0.0%) |
| Cleaning & Maintenance | 0 (0.0%) | 0 (0.0%) |
| Personal Care & Service | 0 (0.0%) | 0 (0.0%) |
| Total (Category) | 0 (0.0%) | 3 (100.0%) |
| Total (Overall) | 17 (35.4%) | 31 (64.6%) |
Sales and Office Occupations
The most common Sales and Office occupations in Osnabrock are Sales & Related (4 | 8.3%), and Office & Administration (1 | 2.1%).

Sales and Office Occupations by Sex

| Occupation | Male | Female |
| Sales & Related | 0 (0.0%) | 4 (100.0%) |
| Office & Administration | 0 (0.0%) | 1 (100.0%) |
| Total (Category) | 0 (0.0%) | 5 (100.0%) |
| Total (Overall) | 17 (35.4%) | 31 (64.6%) |
Natural Resources, Construction and Maintenance Occupations
The most common Natural Resources, Construction and Maintenance occupations in Osnabrock are Farming, Fishing & Forestry (1 | 2.1%), Construction & Extraction (1 | 2.1%), and Installation, Maintenance & Repair (1 | 2.1%).

Natural Resources, Construction and Maintenance Occupations by Sex

| Occupation | Male | Female |
| Farming, Fishing & Forestry | 1 (100.0%) | 0 (0.0%) |
| Construction & Extraction | 1 (100.0%) | 0 (0.0%) |
| Installation, Maintenance & Repair | 1 (100.0%) | 0 (0.0%) |
| Total (Category) | 3 (100.0%) | 0 (0.0%) |
| Total (Overall) | 17 (35.4%) | 31 (64.6%) |
Production, Transportation and Moving Occupations
The most common Production, Transportation and Moving occupations in Osnabrock are Transportation (3 | 6.2%), and Material Moving (2 | 4.2%).
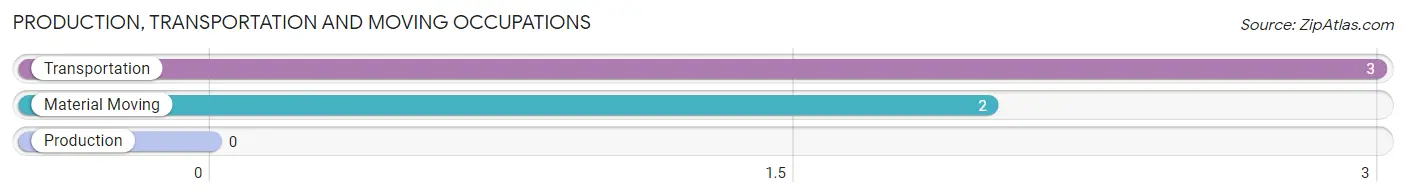
Production, Transportation and Moving Occupations by Sex
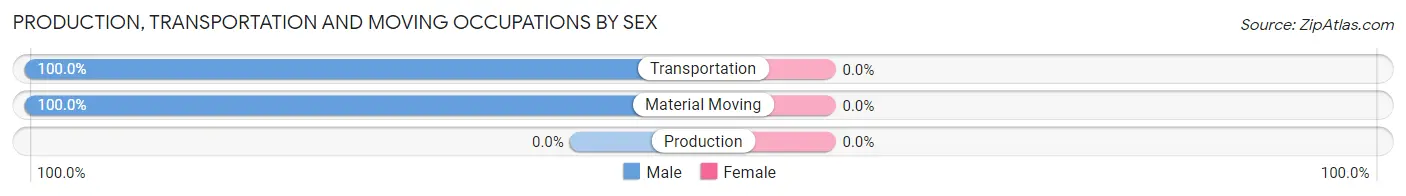
| Occupation | Male | Female |
| Production | 0 (0.0%) | 0 (0.0%) |
| Transportation | 3 (100.0%) | 0 (0.0%) |
| Material Moving | 2 (100.0%) | 0 (0.0%) |
| Total (Category) | 5 (100.0%) | 0 (0.0%) |
| Total (Overall) | 17 (35.4%) | 31 (64.6%) |
Employment Industries by Sex in Osnabrock
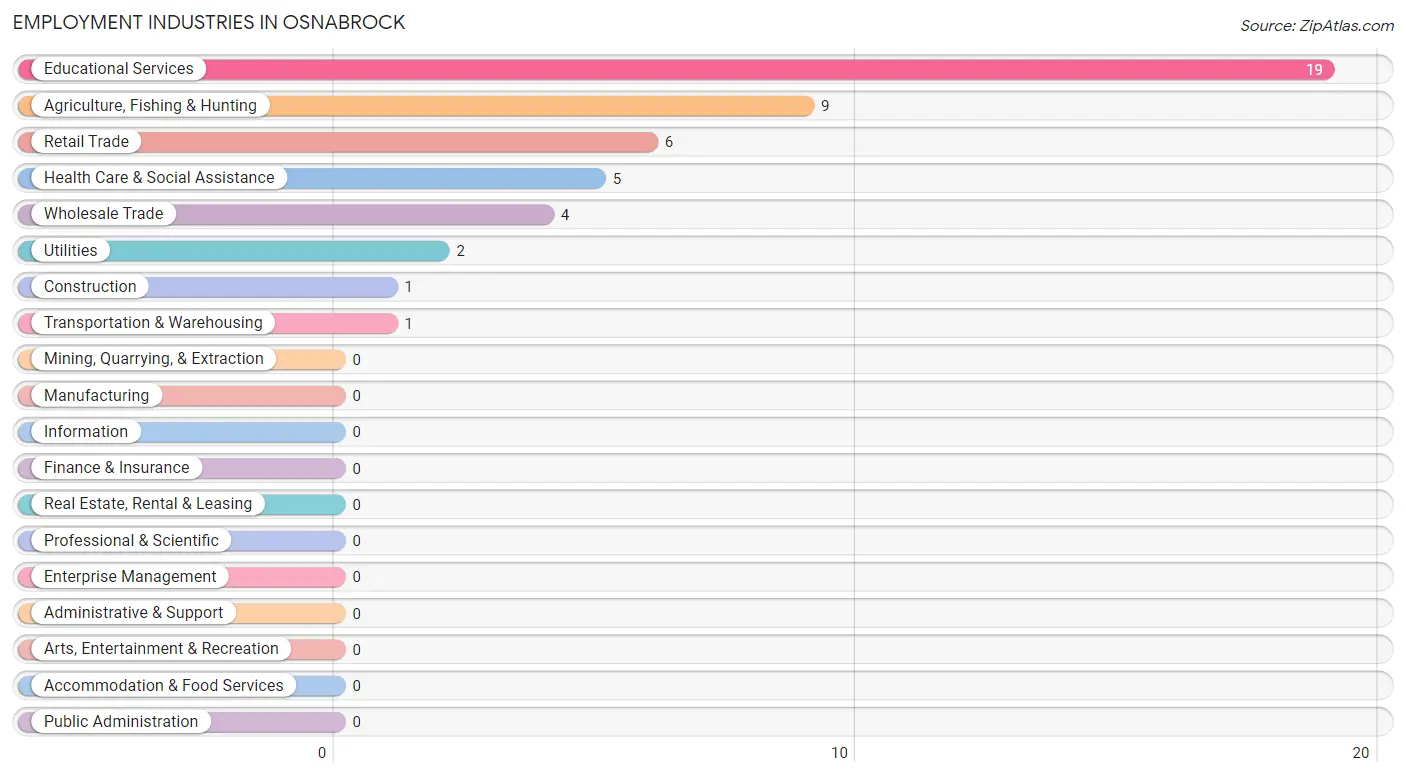
Employment Industries in Osnabrock
The major employment industries in Osnabrock include Educational Services (19 | 39.6%), Agriculture, Fishing & Hunting (9 | 18.8%), Retail Trade (6 | 12.5%), Health Care & Social Assistance (5 | 10.4%), and Wholesale Trade (4 | 8.3%).
Employment Industries by Sex in Osnabrock
The Osnabrock industries that see more men than women are Agriculture, Fishing & Hunting (100.0%), Construction (100.0%), and Wholesale Trade (100.0%), whereas the industries that tend to have a higher number of women are Transportation & Warehousing (100.0%), Utilities (100.0%), and Educational Services (100.0%).
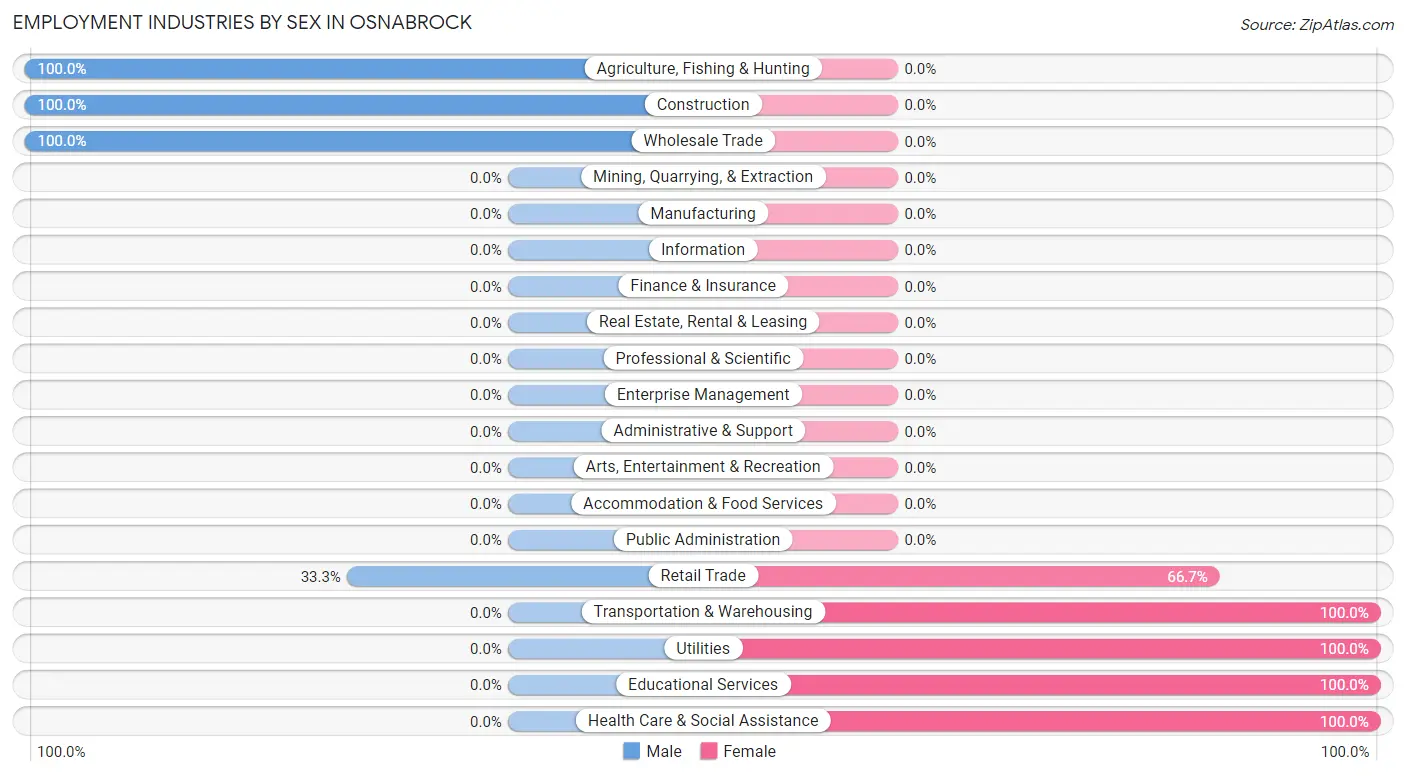
| Industry | Male | Female |
| Agriculture, Fishing & Hunting | 9 (100.0%) | 0 (0.0%) |
| Mining, Quarrying, & Extraction | 0 (0.0%) | 0 (0.0%) |
| Construction | 1 (100.0%) | 0 (0.0%) |
| Manufacturing | 0 (0.0%) | 0 (0.0%) |
| Wholesale Trade | 4 (100.0%) | 0 (0.0%) |
| Retail Trade | 2 (33.3%) | 4 (66.7%) |
| Transportation & Warehousing | 0 (0.0%) | 1 (100.0%) |
| Utilities | 0 (0.0%) | 2 (100.0%) |
| Information | 0 (0.0%) | 0 (0.0%) |
| Finance & Insurance | 0 (0.0%) | 0 (0.0%) |
| Real Estate, Rental & Leasing | 0 (0.0%) | 0 (0.0%) |
| Professional & Scientific | 0 (0.0%) | 0 (0.0%) |
| Enterprise Management | 0 (0.0%) | 0 (0.0%) |
| Administrative & Support | 0 (0.0%) | 0 (0.0%) |
| Educational Services | 0 (0.0%) | 19 (100.0%) |
| Health Care & Social Assistance | 0 (0.0%) | 5 (100.0%) |
| Arts, Entertainment & Recreation | 0 (0.0%) | 0 (0.0%) |
| Accommodation & Food Services | 0 (0.0%) | 0 (0.0%) |
| Public Administration | 0 (0.0%) | 0 (0.0%) |
| Total | 17 (35.4%) | 31 (64.6%) |
Education in Osnabrock
School Enrollment in Osnabrock
The most common levels of schooling among the 11 students in Osnabrock are elementary school (6 | 54.5%), and middle school (5 | 45.5%).
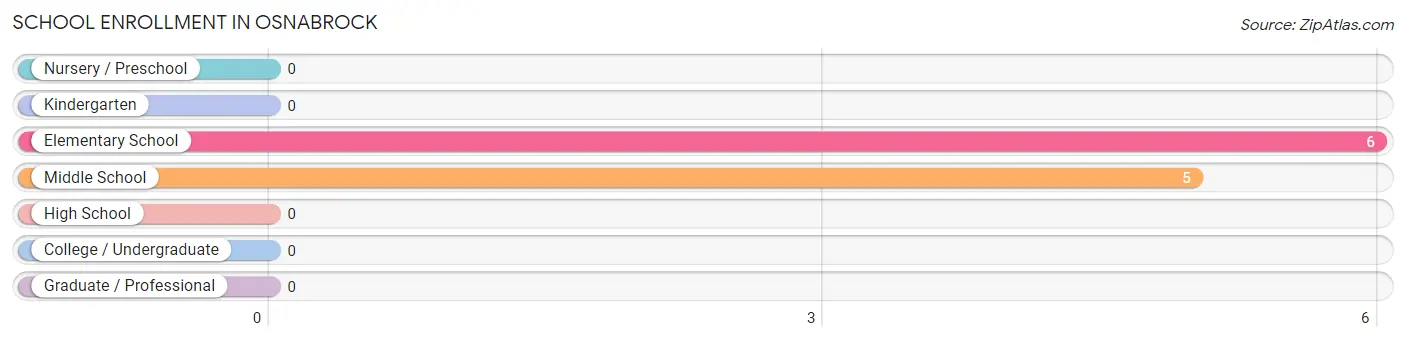
| School Level | # Students | % Students |
| Nursery / Preschool | 0 | 0.0% |
| Kindergarten | 0 | 0.0% |
| Elementary School | 6 | 54.5% |
| Middle School | 5 | 45.5% |
| High School | 0 | 0.0% |
| College / Undergraduate | 0 | 0.0% |
| Graduate / Professional | 0 | 0.0% |
| Total | 11 | 100.0% |
School Enrollment by Age by Funding Source in Osnabrock
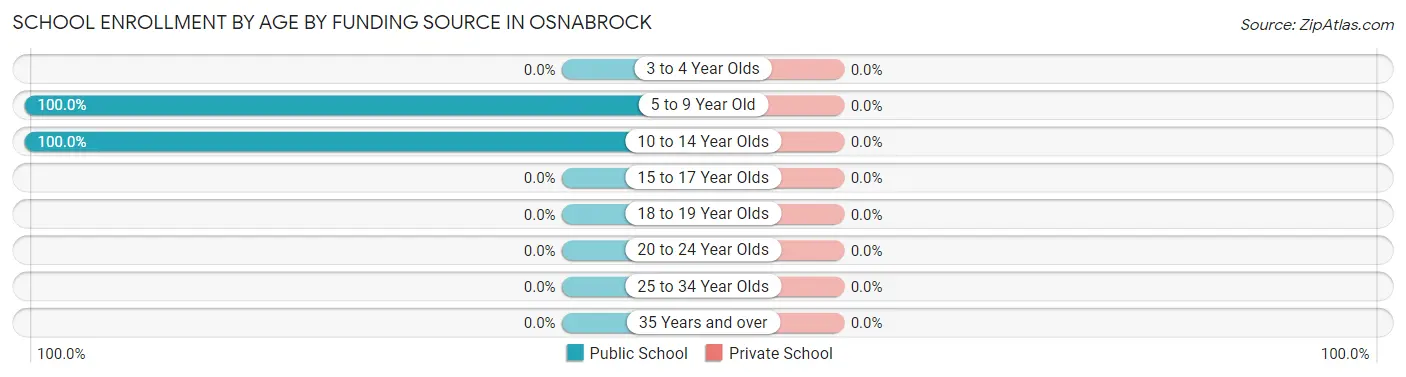
| Age Bracket | Public School | Private School |
| 3 to 4 Year Olds | 0 (0.0%) | 0 (0.0%) |
| 5 to 9 Year Old | 6 (100.0%) | 0 (0.0%) |
| 10 to 14 Year Olds | 5 (100.0%) | 0 (0.0%) |
| 15 to 17 Year Olds | 0 (0.0%) | 0 (0.0%) |
| 18 to 19 Year Olds | 0 (0.0%) | 0 (0.0%) |
| 20 to 24 Year Olds | 0 (0.0%) | 0 (0.0%) |
| 25 to 34 Year Olds | 0 (0.0%) | 0 (0.0%) |
| 35 Years and over | 0 (0.0%) | 0 (0.0%) |
| Total | 11 (100.0%) | 0 (0.0%) |
Educational Attainment by Field of Study in Osnabrock
, and engineering (5 | 100.0%) are the most common fields of study among 5 individuals in Osnabrock who have obtained a bachelor's degree or higher.
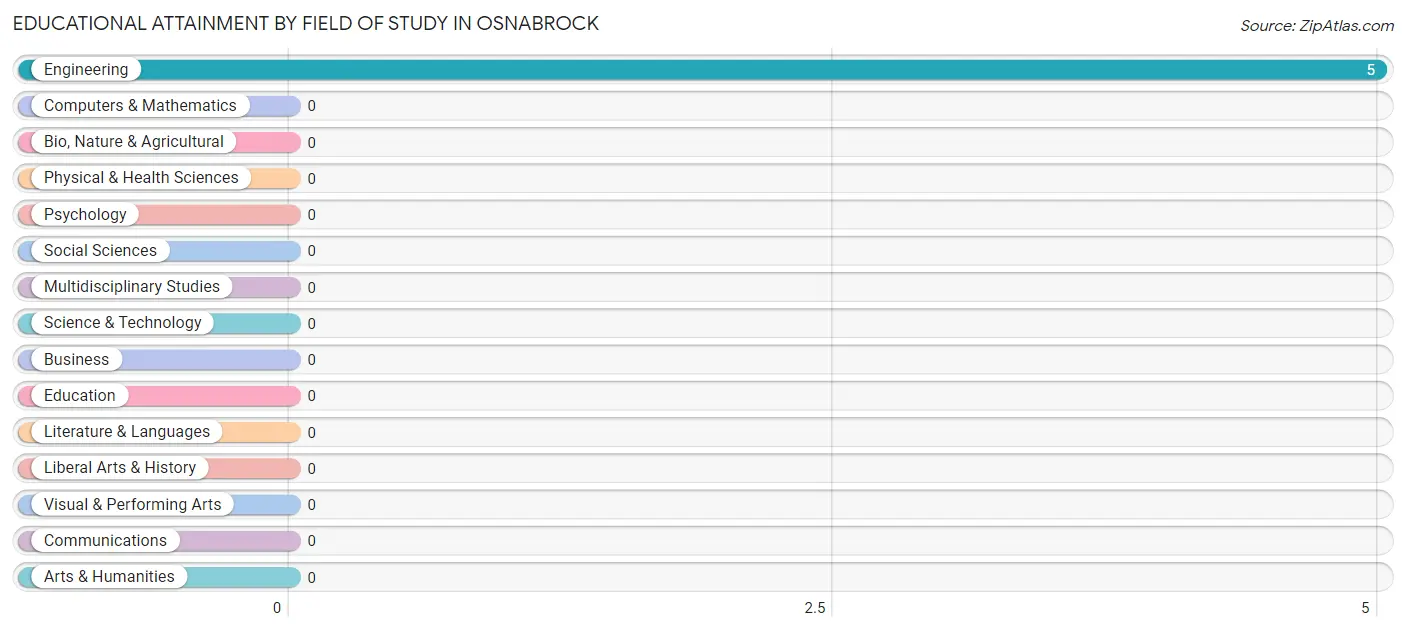
| Field of Study | # Graduates | % Graduates |
| Computers & Mathematics | 0 | 0.0% |
| Bio, Nature & Agricultural | 0 | 0.0% |
| Physical & Health Sciences | 0 | 0.0% |
| Psychology | 0 | 0.0% |
| Social Sciences | 0 | 0.0% |
| Engineering | 5 | 100.0% |
| Multidisciplinary Studies | 0 | 0.0% |
| Science & Technology | 0 | 0.0% |
| Business | 0 | 0.0% |
| Education | 0 | 0.0% |
| Literature & Languages | 0 | 0.0% |
| Liberal Arts & History | 0 | 0.0% |
| Visual & Performing Arts | 0 | 0.0% |
| Communications | 0 | 0.0% |
| Arts & Humanities | 0 | 0.0% |
| Total | 5 | 100.0% |
Transportation & Commute in Osnabrock
Vehicle Availability by Sex in Osnabrock
The most prevalent vehicle ownership categories in Osnabrock are males with 4 vehicles (6, accounting for 35.3%) and females with 4 vehicles (5, making up 19.4%).
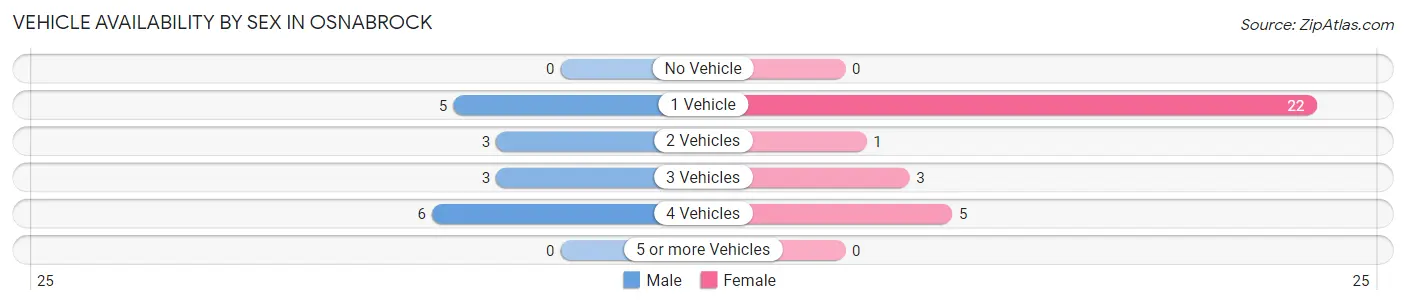
| Vehicles Available | Male | Female |
| No Vehicle | 0 (0.0%) | 0 (0.0%) |
| 1 Vehicle | 5 (29.4%) | 22 (71.0%) |
| 2 Vehicles | 3 (17.6%) | 1 (3.2%) |
| 3 Vehicles | 3 (17.6%) | 3 (9.7%) |
| 4 Vehicles | 6 (35.3%) | 5 (16.1%) |
| 5 or more Vehicles | 0 (0.0%) | 0 (0.0%) |
| Total | 17 (100.0%) | 31 (100.0%) |
Commute Time in Osnabrock
The most frequently occuring commute durations in Osnabrock are 10 to 14 minutes (20 commuters, 43.5%), 5 to 9 minutes (10 commuters, 21.7%), and 15 to 19 minutes (8 commuters, 17.4%).
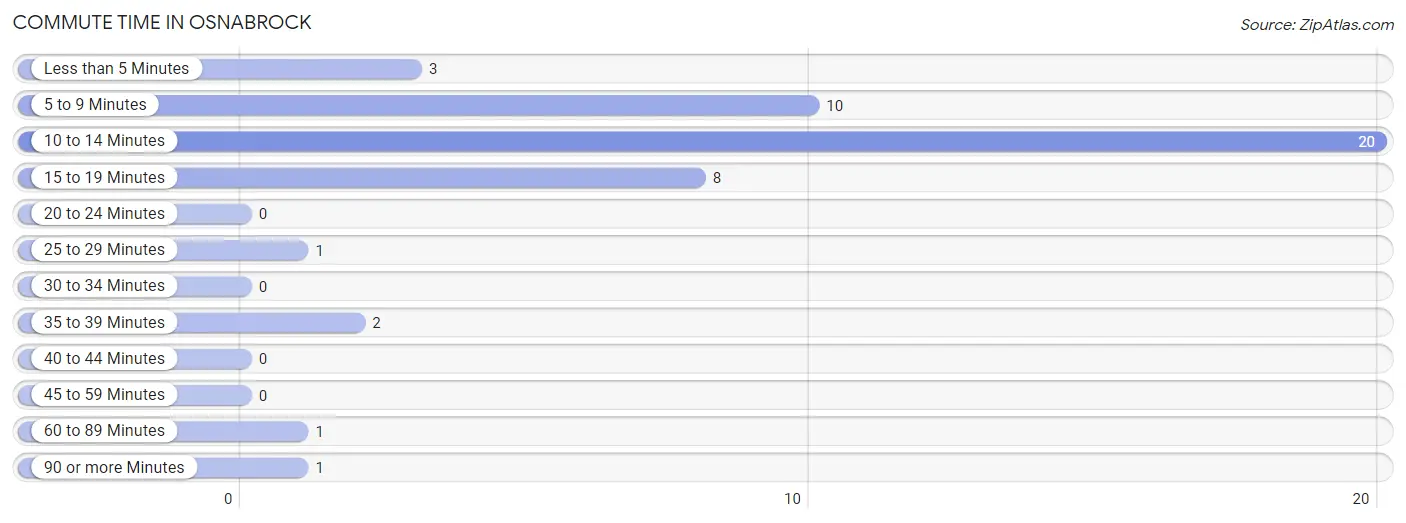
| Commute Time | # Commuters | % Commuters |
| Less than 5 Minutes | 3 | 6.5% |
| 5 to 9 Minutes | 10 | 21.7% |
| 10 to 14 Minutes | 20 | 43.5% |
| 15 to 19 Minutes | 8 | 17.4% |
| 20 to 24 Minutes | 0 | 0.0% |
| 25 to 29 Minutes | 1 | 2.2% |
| 30 to 34 Minutes | 0 | 0.0% |
| 35 to 39 Minutes | 2 | 4.3% |
| 40 to 44 Minutes | 0 | 0.0% |
| 45 to 59 Minutes | 0 | 0.0% |
| 60 to 89 Minutes | 1 | 2.2% |
| 90 or more Minutes | 1 | 2.2% |
Commute Time by Sex in Osnabrock
The most common commute times in Osnabrock are 15 to 19 minutes (8 commuters, 47.1%) for males and 10 to 14 minutes (19 commuters, 65.5%) for females.
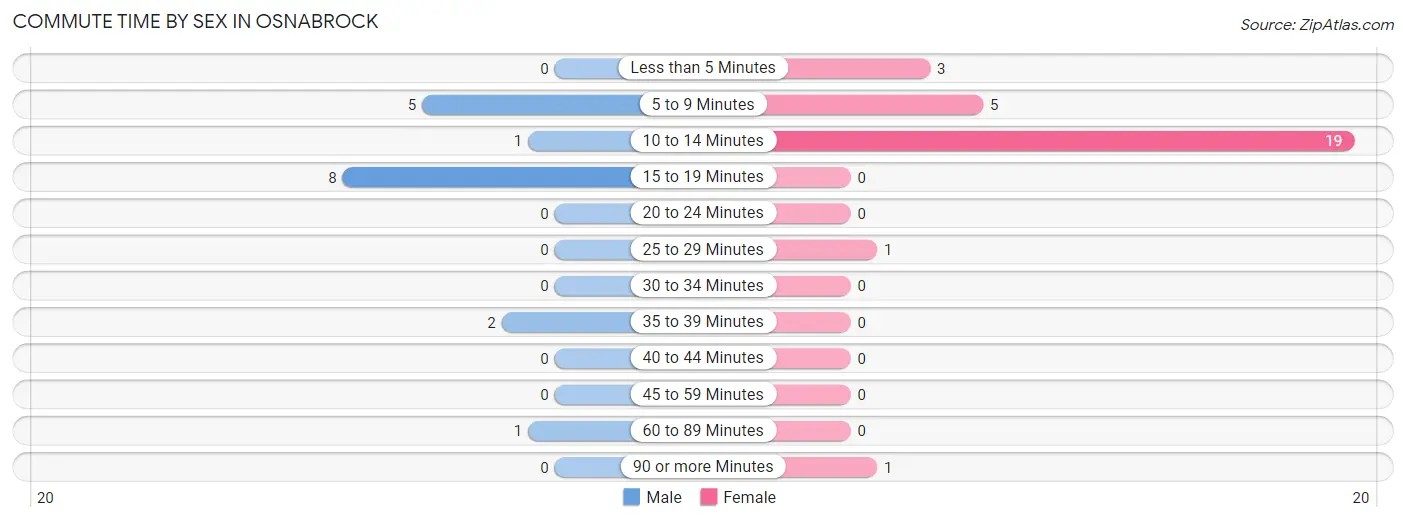
| Commute Time | Male | Female |
| Less than 5 Minutes | 0 (0.0%) | 3 (10.3%) |
| 5 to 9 Minutes | 5 (29.4%) | 5 (17.2%) |
| 10 to 14 Minutes | 1 (5.9%) | 19 (65.5%) |
| 15 to 19 Minutes | 8 (47.1%) | 0 (0.0%) |
| 20 to 24 Minutes | 0 (0.0%) | 0 (0.0%) |
| 25 to 29 Minutes | 0 (0.0%) | 1 (3.5%) |
| 30 to 34 Minutes | 0 (0.0%) | 0 (0.0%) |
| 35 to 39 Minutes | 2 (11.8%) | 0 (0.0%) |
| 40 to 44 Minutes | 0 (0.0%) | 0 (0.0%) |
| 45 to 59 Minutes | 0 (0.0%) | 0 (0.0%) |
| 60 to 89 Minutes | 1 (5.9%) | 0 (0.0%) |
| 90 or more Minutes | 0 (0.0%) | 1 (3.5%) |
Time of Departure to Work by Sex in Osnabrock
The most frequent times of departure to work in Osnabrock are 6:30 AM to 6:59 AM (7, 41.2%) for males and 7:30 AM to 7:59 AM (20, 69.0%) for females.
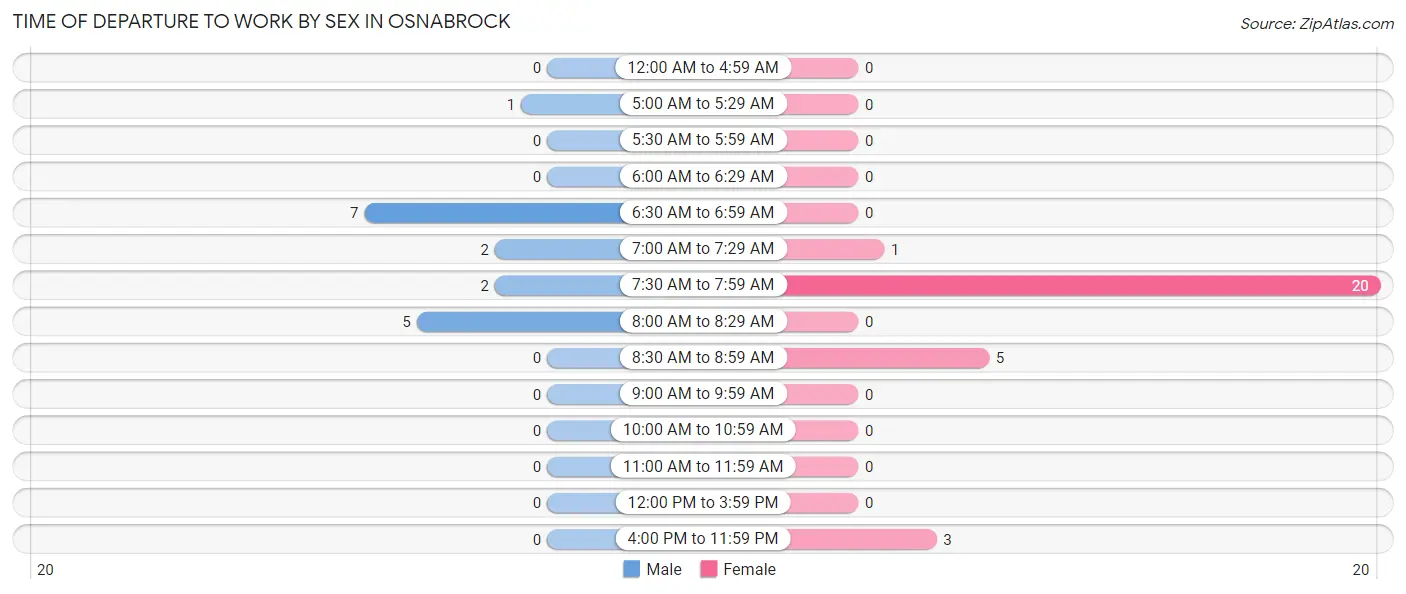
| Time of Departure | Male | Female |
| 12:00 AM to 4:59 AM | 0 (0.0%) | 0 (0.0%) |
| 5:00 AM to 5:29 AM | 1 (5.9%) | 0 (0.0%) |
| 5:30 AM to 5:59 AM | 0 (0.0%) | 0 (0.0%) |
| 6:00 AM to 6:29 AM | 0 (0.0%) | 0 (0.0%) |
| 6:30 AM to 6:59 AM | 7 (41.2%) | 0 (0.0%) |
| 7:00 AM to 7:29 AM | 2 (11.8%) | 1 (3.5%) |
| 7:30 AM to 7:59 AM | 2 (11.8%) | 20 (69.0%) |
| 8:00 AM to 8:29 AM | 5 (29.4%) | 0 (0.0%) |
| 8:30 AM to 8:59 AM | 0 (0.0%) | 5 (17.2%) |
| 9:00 AM to 9:59 AM | 0 (0.0%) | 0 (0.0%) |
| 10:00 AM to 10:59 AM | 0 (0.0%) | 0 (0.0%) |
| 11:00 AM to 11:59 AM | 0 (0.0%) | 0 (0.0%) |
| 12:00 PM to 3:59 PM | 0 (0.0%) | 0 (0.0%) |
| 4:00 PM to 11:59 PM | 0 (0.0%) | 3 (10.3%) |
| Total | 17 (100.0%) | 29 (100.0%) |
Housing Occupancy in Osnabrock
Occupancy by Ownership in Osnabrock
Of the total 97 dwellings in Osnabrock, owner-occupied units account for 71 (73.2%), while renter-occupied units make up 26 (26.8%).
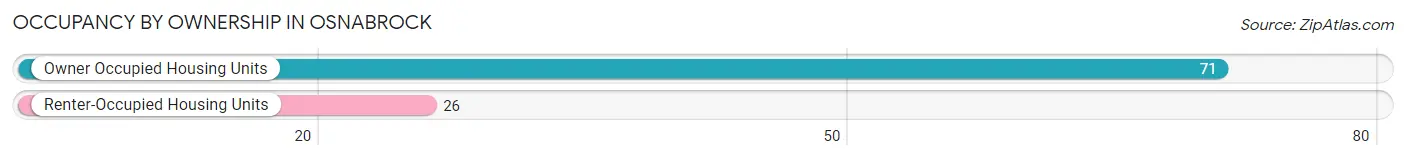
| Occupancy | # Housing Units | % Housing Units |
| Owner Occupied Housing Units | 71 | 73.2% |
| Renter-Occupied Housing Units | 26 | 26.8% |
| Total Occupied Housing Units | 97 | 100.0% |
Occupancy by Household Size in Osnabrock
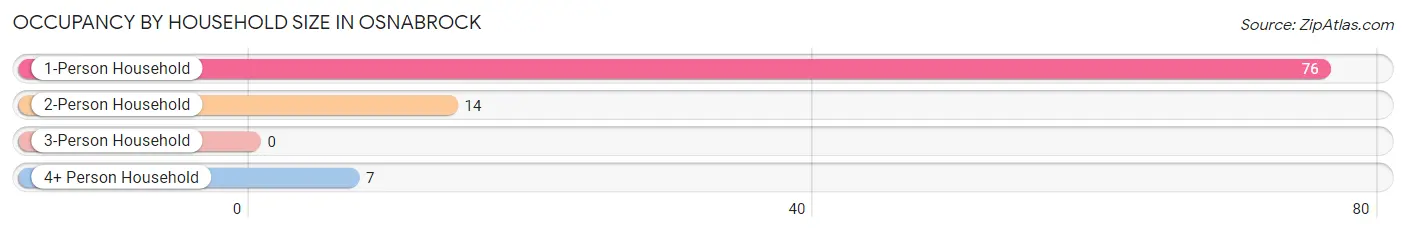
| Household Size | # Housing Units | % Housing Units |
| 1-Person Household | 76 | 78.3% |
| 2-Person Household | 14 | 14.4% |
| 3-Person Household | 0 | 0.0% |
| 4+ Person Household | 7 | 7.2% |
| Total Housing Units | 97 | 100.0% |
Occupancy by Ownership by Household Size in Osnabrock
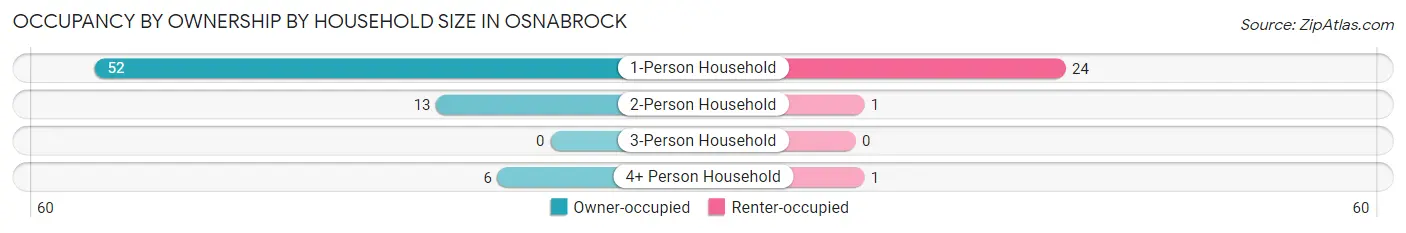
| Household Size | Owner-occupied | Renter-occupied |
| 1-Person Household | 52 (68.4%) | 24 (31.6%) |
| 2-Person Household | 13 (92.9%) | 1 (7.1%) |
| 3-Person Household | 0 (0.0%) | 0 (0.0%) |
| 4+ Person Household | 6 (85.7%) | 1 (14.3%) |
| Total Housing Units | 71 (73.2%) | 26 (26.8%) |
Occupancy by Educational Attainment in Osnabrock
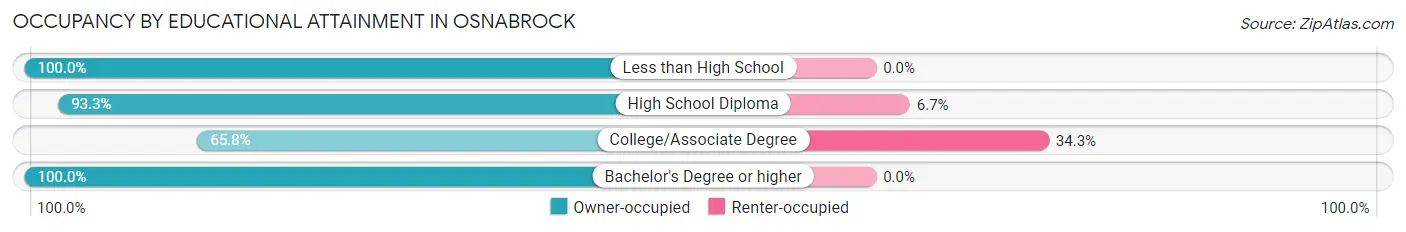
| Household Size | Owner-occupied | Renter-occupied |
| Less than High School | 3 (100.0%) | 0 (0.0%) |
| High School Diploma | 14 (93.3%) | 1 (6.7%) |
| College/Associate Degree | 48 (65.7%) | 25 (34.3%) |
| Bachelor's Degree or higher | 6 (100.0%) | 0 (0.0%) |
Occupancy by Age of Householder in Osnabrock
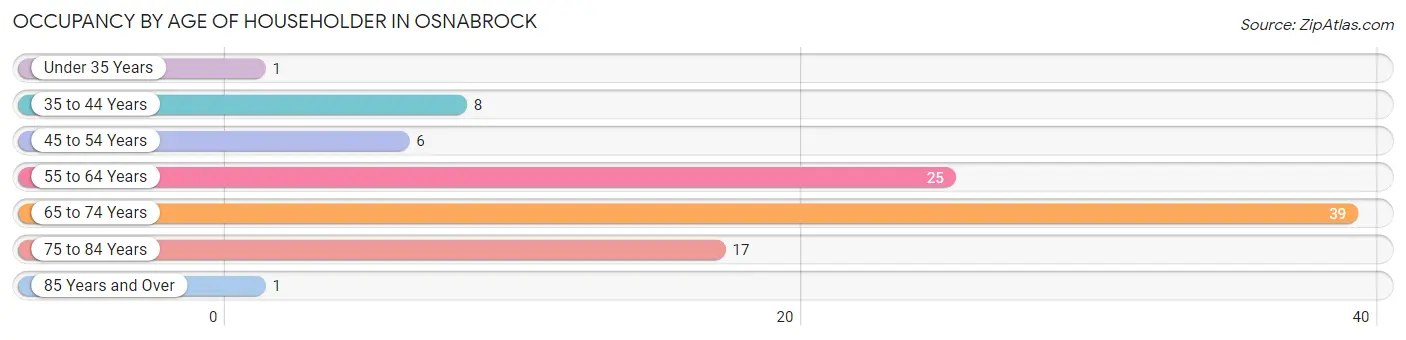
| Age Bracket | # Households | % Households |
| Under 35 Years | 1 | 1.0% |
| 35 to 44 Years | 8 | 8.3% |
| 45 to 54 Years | 6 | 6.2% |
| 55 to 64 Years | 25 | 25.8% |
| 65 to 74 Years | 39 | 40.2% |
| 75 to 84 Years | 17 | 17.5% |
| 85 Years and Over | 1 | 1.0% |
| Total | 97 | 100.0% |
Housing Finances in Osnabrock
Median Income by Occupancy in Osnabrock
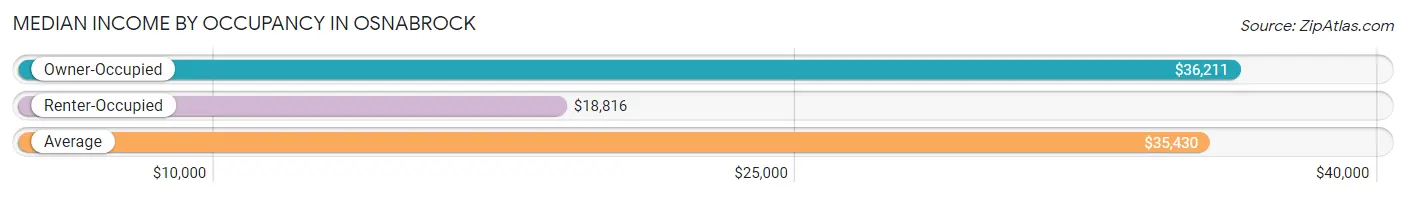
| Occupancy Type | # Households | Median Income |
| Owner-Occupied | 71 (73.2%) | $36,211 |
| Renter-Occupied | 26 (26.8%) | $18,816 |
| Average | 97 (100.0%) | $35,430 |
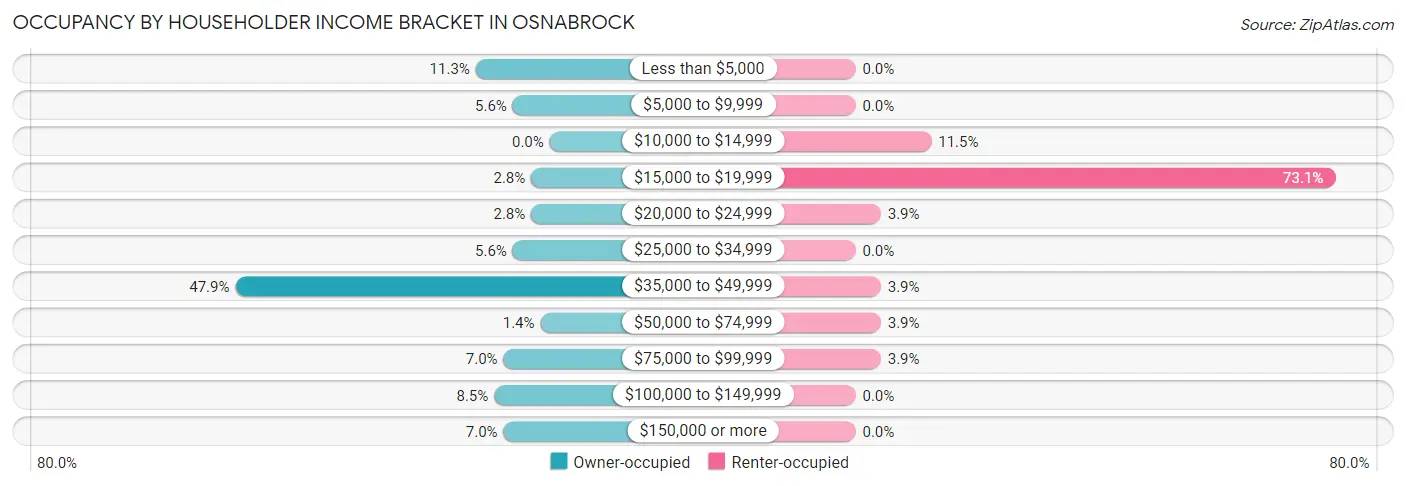
Occupancy by Householder Income Bracket in Osnabrock
| Income Bracket | Owner-occupied | Renter-occupied |
| Less than $5,000 | 8 (11.3%) | 0 (0.0%) |
| $5,000 to $9,999 | 4 (5.6%) | 0 (0.0%) |
| $10,000 to $14,999 | 0 (0.0%) | 3 (11.5%) |
| $15,000 to $19,999 | 2 (2.8%) | 19 (73.1%) |
| $20,000 to $24,999 | 2 (2.8%) | 1 (3.8%) |
| $25,000 to $34,999 | 4 (5.6%) | 0 (0.0%) |
| $35,000 to $49,999 | 34 (47.9%) | 1 (3.8%) |
| $50,000 to $74,999 | 1 (1.4%) | 1 (3.8%) |
| $75,000 to $99,999 | 5 (7.0%) | 1 (3.8%) |
| $100,000 to $149,999 | 6 (8.5%) | 0 (0.0%) |
| $150,000 or more | 5 (7.0%) | 0 (0.0%) |
| Total | 71 (100.0%) | 26 (100.0%) |
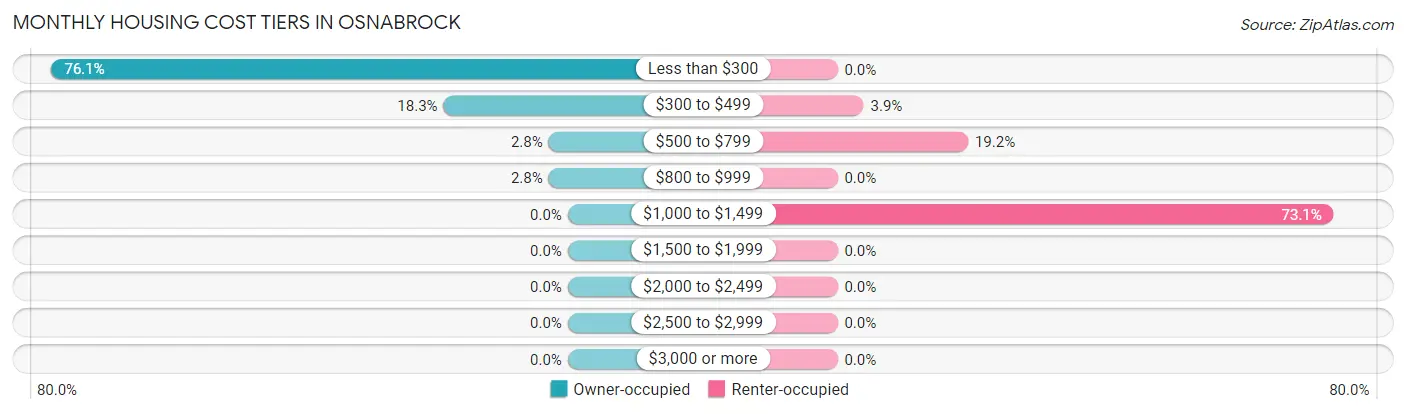
Monthly Housing Cost Tiers in Osnabrock
| Monthly Cost | Owner-occupied | Renter-occupied |
| Less than $300 | 54 (76.1%) | 0 (0.0%) |
| $300 to $499 | 13 (18.3%) | 1 (3.8%) |
| $500 to $799 | 2 (2.8%) | 5 (19.2%) |
| $800 to $999 | 2 (2.8%) | 0 (0.0%) |
| $1,000 to $1,499 | 0 (0.0%) | 19 (73.1%) |
| $1,500 to $1,999 | 0 (0.0%) | 0 (0.0%) |
| $2,000 to $2,499 | 0 (0.0%) | 0 (0.0%) |
| $2,500 to $2,999 | 0 (0.0%) | 0 (0.0%) |
| $3,000 or more | 0 (0.0%) | 0 (0.0%) |
| Total | 71 (100.0%) | 26 (100.0%) |
Physical Housing Characteristics in Osnabrock
Housing Structures in Osnabrock
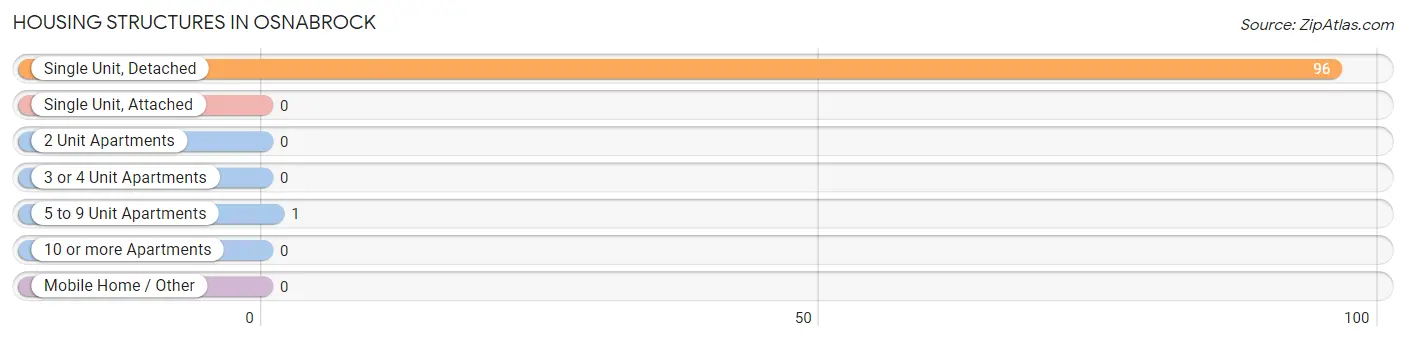
| Structure Type | # Housing Units | % Housing Units |
| Single Unit, Detached | 96 | 99.0% |
| Single Unit, Attached | 0 | 0.0% |
| 2 Unit Apartments | 0 | 0.0% |
| 3 or 4 Unit Apartments | 0 | 0.0% |
| 5 to 9 Unit Apartments | 1 | 1.0% |
| 10 or more Apartments | 0 | 0.0% |
| Mobile Home / Other | 0 | 0.0% |
| Total | 97 | 100.0% |
Housing Structures by Occupancy in Osnabrock
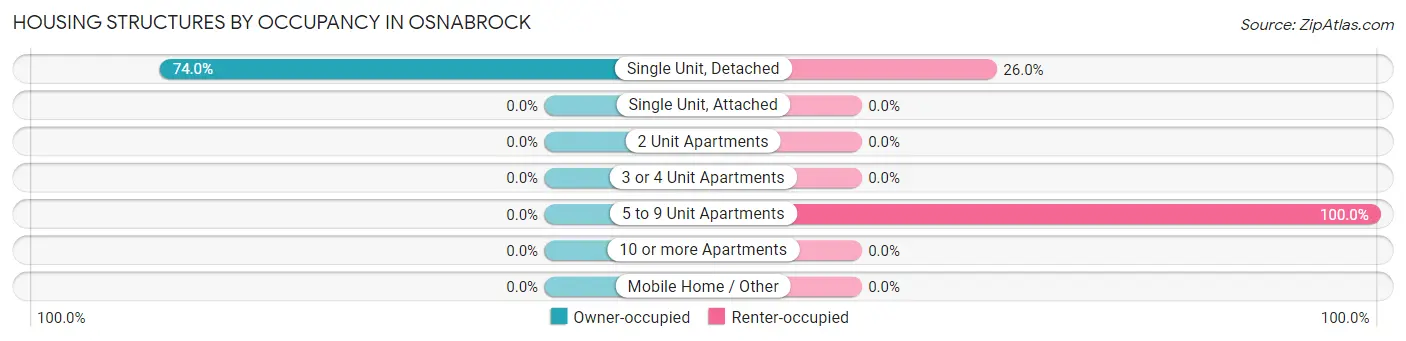
| Structure Type | Owner-occupied | Renter-occupied |
| Single Unit, Detached | 71 (74.0%) | 25 (26.0%) |
| Single Unit, Attached | 0 (0.0%) | 0 (0.0%) |
| 2 Unit Apartments | 0 (0.0%) | 0 (0.0%) |
| 3 or 4 Unit Apartments | 0 (0.0%) | 0 (0.0%) |
| 5 to 9 Unit Apartments | 0 (0.0%) | 1 (100.0%) |
| 10 or more Apartments | 0 (0.0%) | 0 (0.0%) |
| Mobile Home / Other | 0 (0.0%) | 0 (0.0%) |
| Total | 71 (73.2%) | 26 (26.8%) |
Housing Structures by Number of Rooms in Osnabrock
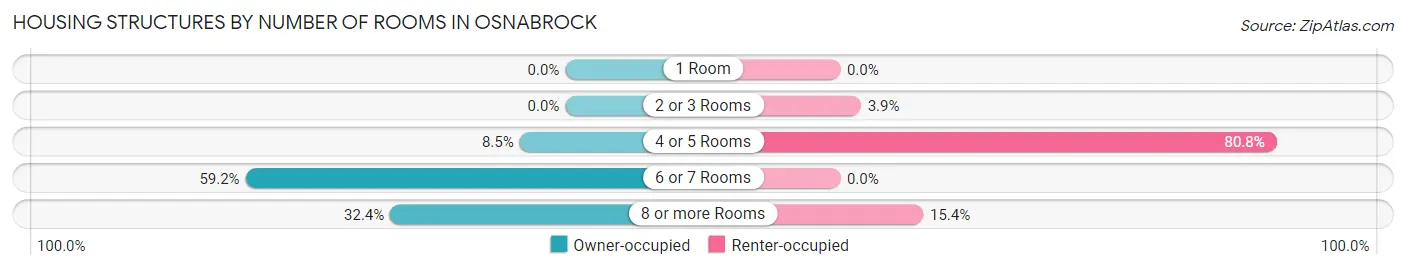
| Number of Rooms | Owner-occupied | Renter-occupied |
| 1 Room | 0 (0.0%) | 0 (0.0%) |
| 2 or 3 Rooms | 0 (0.0%) | 1 (3.8%) |
| 4 or 5 Rooms | 6 (8.5%) | 21 (80.8%) |
| 6 or 7 Rooms | 42 (59.2%) | 0 (0.0%) |
| 8 or more Rooms | 23 (32.4%) | 4 (15.4%) |
| Total | 71 (100.0%) | 26 (100.0%) |
Housing Structure by Heating Type in Osnabrock
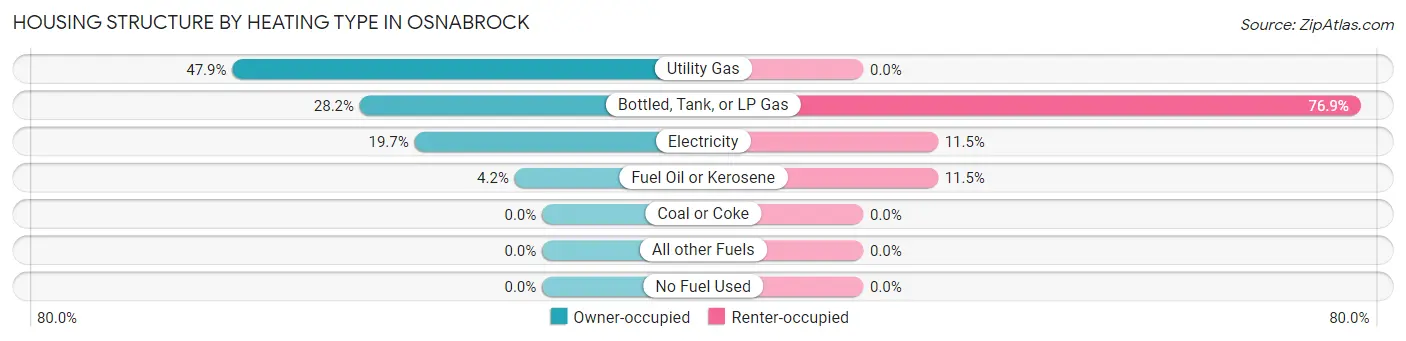
| Heating Type | Owner-occupied | Renter-occupied |
| Utility Gas | 34 (47.9%) | 0 (0.0%) |
| Bottled, Tank, or LP Gas | 20 (28.2%) | 20 (76.9%) |
| Electricity | 14 (19.7%) | 3 (11.5%) |
| Fuel Oil or Kerosene | 3 (4.2%) | 3 (11.5%) |
| Coal or Coke | 0 (0.0%) | 0 (0.0%) |
| All other Fuels | 0 (0.0%) | 0 (0.0%) |
| No Fuel Used | 0 (0.0%) | 0 (0.0%) |
| Total | 71 (100.0%) | 26 (100.0%) |
Household Vehicle Usage in Osnabrock
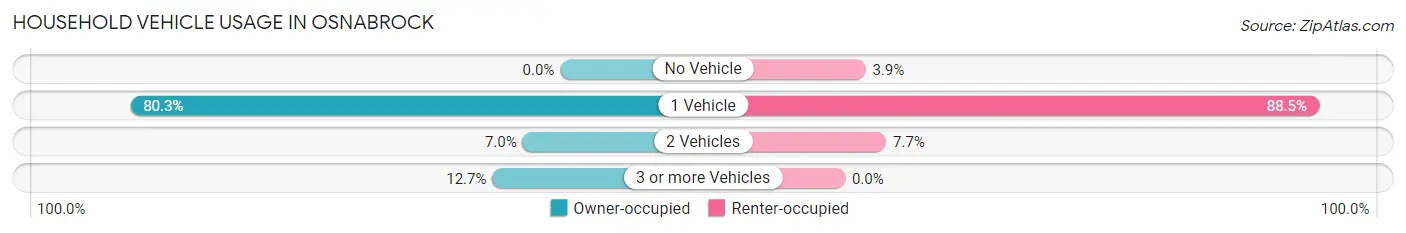
| Vehicles per Household | Owner-occupied | Renter-occupied |
| No Vehicle | 0 (0.0%) | 1 (3.8%) |
| 1 Vehicle | 57 (80.3%) | 23 (88.5%) |
| 2 Vehicles | 5 (7.0%) | 2 (7.7%) |
| 3 or more Vehicles | 9 (12.7%) | 0 (0.0%) |
| Total | 71 (100.0%) | 26 (100.0%) |
Real Estate & Mortgages in Osnabrock
Real Estate and Mortgage Overview in Osnabrock
| Characteristic | Without Mortgage | With Mortgage |
| Housing Units | 71 | 0 |
| Median Property Value | $72,000 | $0 |
| Median Household Income | $36,211 | $0 |
| Monthly Housing Costs | $251 | $0 |
| Real Estate Taxes | $862 | $0 |
Property Value by Mortgage Status in Osnabrock
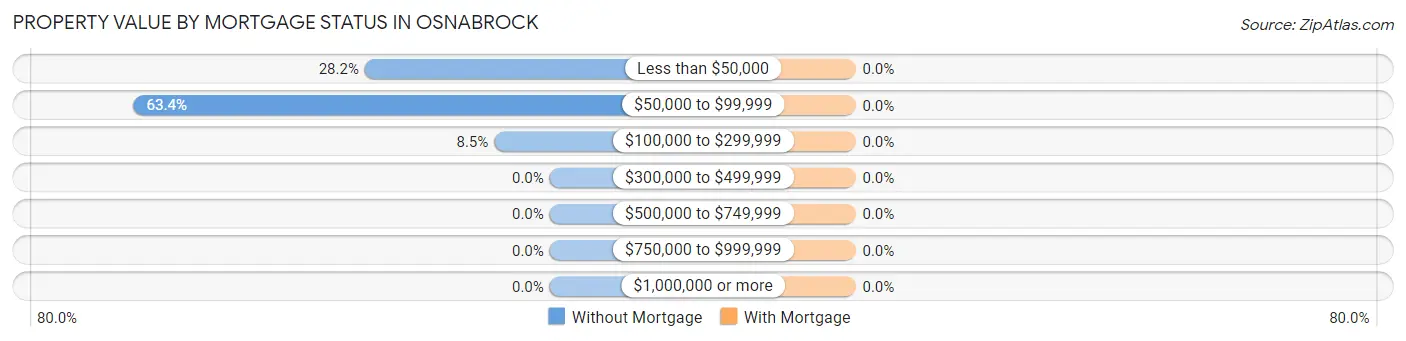
| Property Value | Without Mortgage | With Mortgage |
| Less than $50,000 | 20 (28.2%) | 0 (0.0%) |
| $50,000 to $99,999 | 45 (63.4%) | 0 (0.0%) |
| $100,000 to $299,999 | 6 (8.5%) | 0 (0.0%) |
| $300,000 to $499,999 | 0 (0.0%) | 0 (0.0%) |
| $500,000 to $749,999 | 0 (0.0%) | 0 (0.0%) |
| $750,000 to $999,999 | 0 (0.0%) | 0 (0.0%) |
| $1,000,000 or more | 0 (0.0%) | 0 (0.0%) |
| Total | 71 (100.0%) | 0 (0.0%) |
Household Income by Mortgage Status in Osnabrock
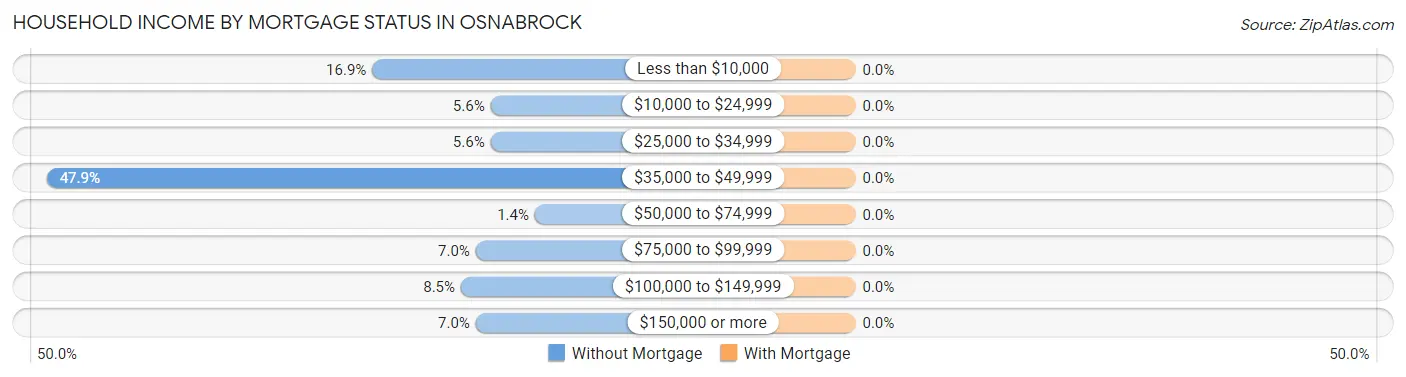
| Household Income | Without Mortgage | With Mortgage |
| Less than $10,000 | 12 (16.9%) | 0 (0.0%) |
| $10,000 to $24,999 | 4 (5.6%) | 0 (0.0%) |
| $25,000 to $34,999 | 4 (5.6%) | 0 (0.0%) |
| $35,000 to $49,999 | 34 (47.9%) | 0 (0.0%) |
| $50,000 to $74,999 | 1 (1.4%) | 0 (0.0%) |
| $75,000 to $99,999 | 5 (7.0%) | 0 (0.0%) |
| $100,000 to $149,999 | 6 (8.5%) | 0 (0.0%) |
| $150,000 or more | 5 (7.0%) | 0 (0.0%) |
| Total | 71 (100.0%) | 0 (0.0%) |
Property Value to Household Income Ratio in Osnabrock
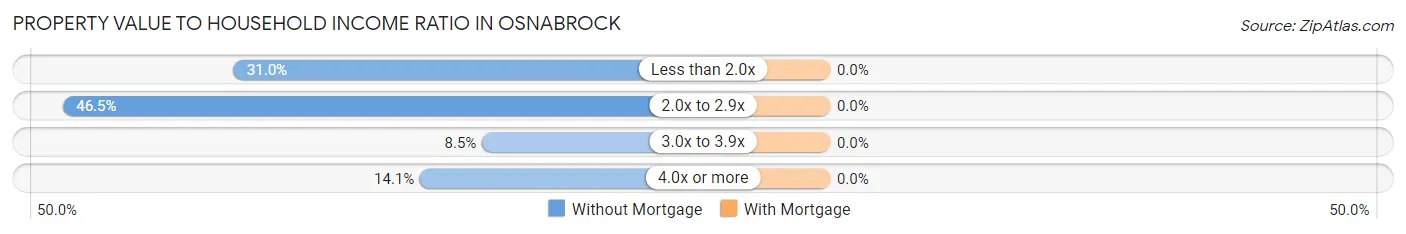
| Value-to-Income Ratio | Without Mortgage | With Mortgage |
| Less than 2.0x | 22 (31.0%) | 0 (0.0%) |
| 2.0x to 2.9x | 33 (46.5%) | 0 (0.0%) |
| 3.0x to 3.9x | 6 (8.5%) | 0 (0.0%) |
| 4.0x or more | 10 (14.1%) | 0 (0.0%) |
| Total | 71 (100.0%) | 0 (0.0%) |
Real Estate Taxes by Mortgage Status in Osnabrock
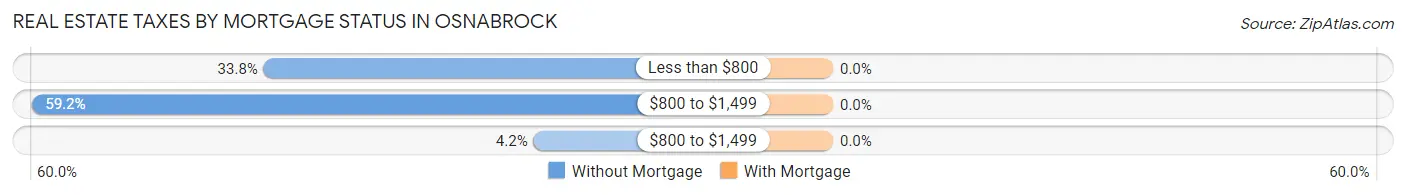
| Property Taxes | Without Mortgage | With Mortgage |
| Less than $800 | 24 (33.8%) | 0 (0.0%) |
| $800 to $1,499 | 42 (59.2%) | 0 (0.0%) |
| $800 to $1,499 | 3 (4.2%) | 0 (0.0%) |
| Total | 71 (100.0%) | 0 (0.0%) |
Health & Disability in Osnabrock
Health Insurance Coverage by Age in Osnabrock
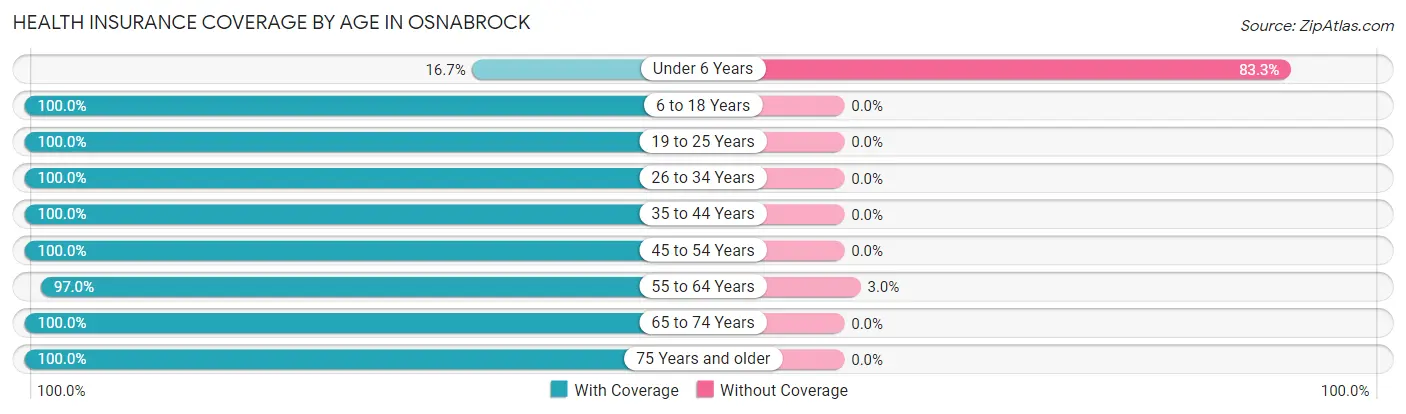
| Age Bracket | With Coverage | Without Coverage |
| Under 6 Years | 1 (16.7%) | 5 (83.3%) |
| 6 to 18 Years | 11 (100.0%) | 0 (0.0%) |
| 19 to 25 Years | 2 (100.0%) | 0 (0.0%) |
| 26 to 34 Years | 4 (100.0%) | 0 (0.0%) |
| 35 to 44 Years | 9 (100.0%) | 0 (0.0%) |
| 45 to 54 Years | 6 (100.0%) | 0 (0.0%) |
| 55 to 64 Years | 32 (97.0%) | 1 (3.0%) |
| 65 to 74 Years | 48 (100.0%) | 0 (0.0%) |
| 75 Years and older | 22 (100.0%) | 0 (0.0%) |
| Total | 135 (95.7%) | 6 (4.3%) |
Health Insurance Coverage by Citizenship Status in Osnabrock

| Citizenship Status | With Coverage | Without Coverage |
| Native Born | 1 (16.7%) | 5 (83.3%) |
| Foreign Born, Citizen | 11 (100.0%) | 0 (0.0%) |
| Foreign Born, not a Citizen | 2 (100.0%) | 0 (0.0%) |
Health Insurance Coverage by Household Income in Osnabrock
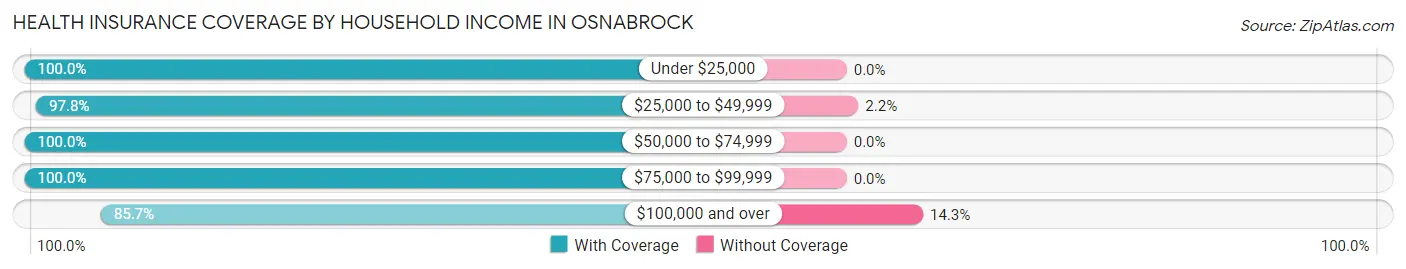
| Household Income | With Coverage | Without Coverage |
| Under $25,000 | 41 (100.0%) | 0 (0.0%) |
| $25,000 to $49,999 | 45 (97.8%) | 1 (2.2%) |
| $50,000 to $74,999 | 5 (100.0%) | 0 (0.0%) |
| $75,000 to $99,999 | 14 (100.0%) | 0 (0.0%) |
| $100,000 and over | 30 (85.7%) | 5 (14.3%) |
Public vs Private Health Insurance Coverage by Age in Osnabrock
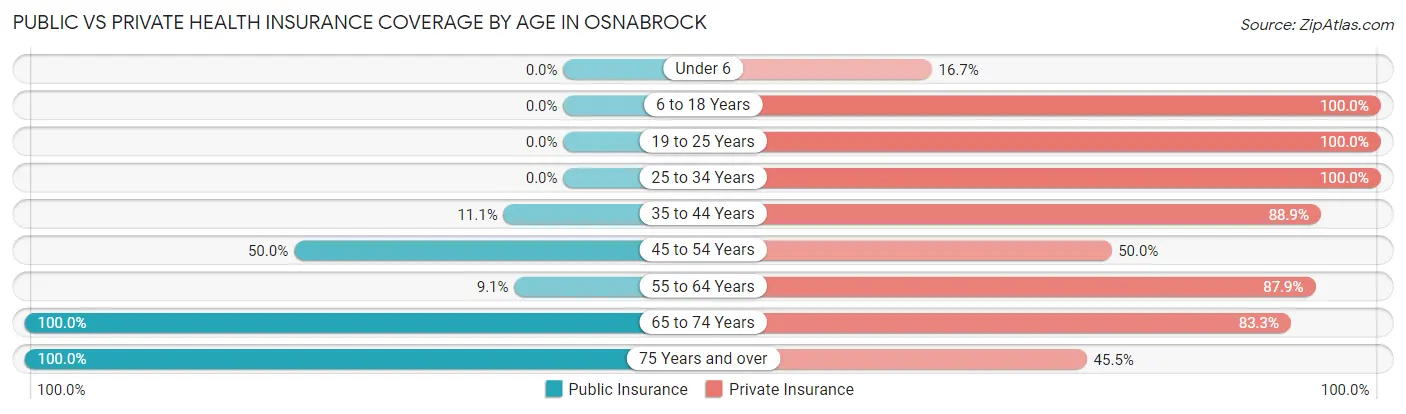
| Age Bracket | Public Insurance | Private Insurance |
| Under 6 | 0 (0.0%) | 1 (16.7%) |
| 6 to 18 Years | 0 (0.0%) | 11 (100.0%) |
| 19 to 25 Years | 0 (0.0%) | 2 (100.0%) |
| 25 to 34 Years | 0 (0.0%) | 4 (100.0%) |
| 35 to 44 Years | 1 (11.1%) | 8 (88.9%) |
| 45 to 54 Years | 3 (50.0%) | 3 (50.0%) |
| 55 to 64 Years | 3 (9.1%) | 29 (87.9%) |
| 65 to 74 Years | 48 (100.0%) | 40 (83.3%) |
| 75 Years and over | 22 (100.0%) | 10 (45.5%) |
| Total | 77 (54.6%) | 108 (76.6%) |
Disability Status by Sex by Age in Osnabrock
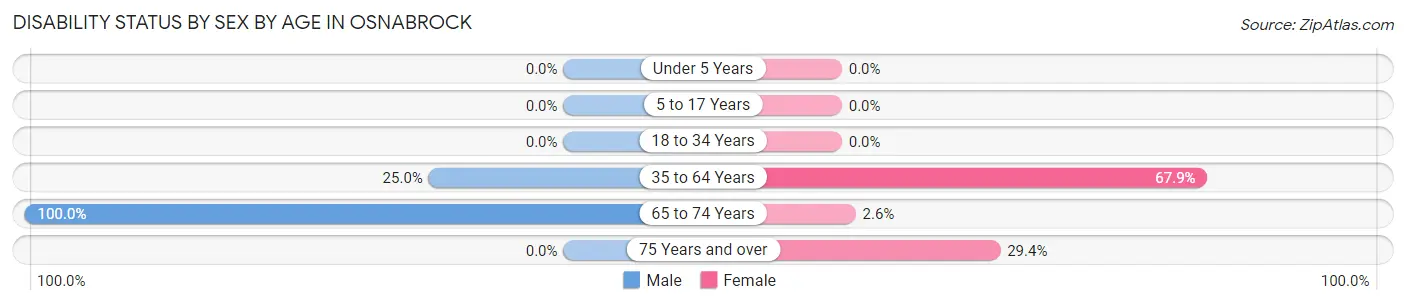
| Age Bracket | Male | Female |
| Under 5 Years | 0 (0.0%) | 0 (0.0%) |
| 5 to 17 Years | 0 (0.0%) | 0 (0.0%) |
| 18 to 34 Years | 0 (0.0%) | 0 (0.0%) |
| 35 to 64 Years | 5 (25.0%) | 19 (67.9%) |
| 65 to 74 Years | 9 (100.0%) | 1 (2.6%) |
| 75 Years and over | 0 (0.0%) | 5 (29.4%) |
Disability Class by Sex by Age in Osnabrock
Disability Class: Hearing Difficulty
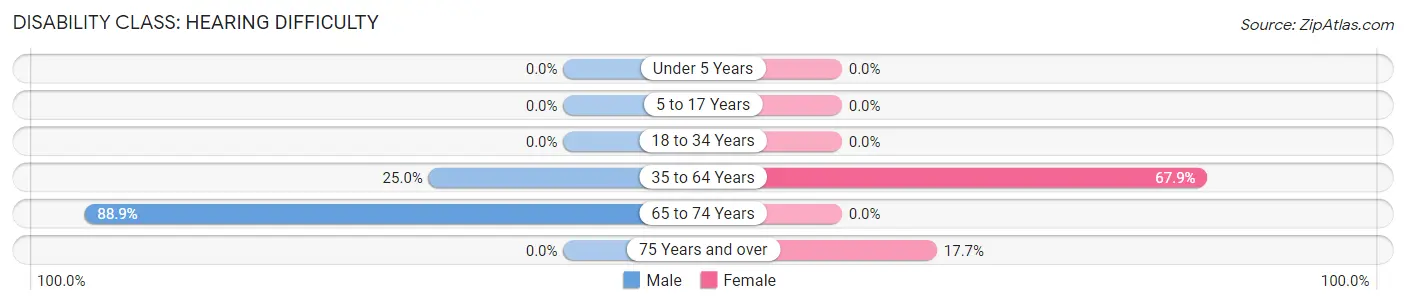
| Age Bracket | Male | Female |
| Under 5 Years | 0 (0.0%) | 0 (0.0%) |
| 5 to 17 Years | 0 (0.0%) | 0 (0.0%) |
| 18 to 34 Years | 0 (0.0%) | 0 (0.0%) |
| 35 to 64 Years | 5 (25.0%) | 19 (67.9%) |
| 65 to 74 Years | 8 (88.9%) | 0 (0.0%) |
| 75 Years and over | 0 (0.0%) | 3 (17.6%) |
Disability Class: Vision Difficulty
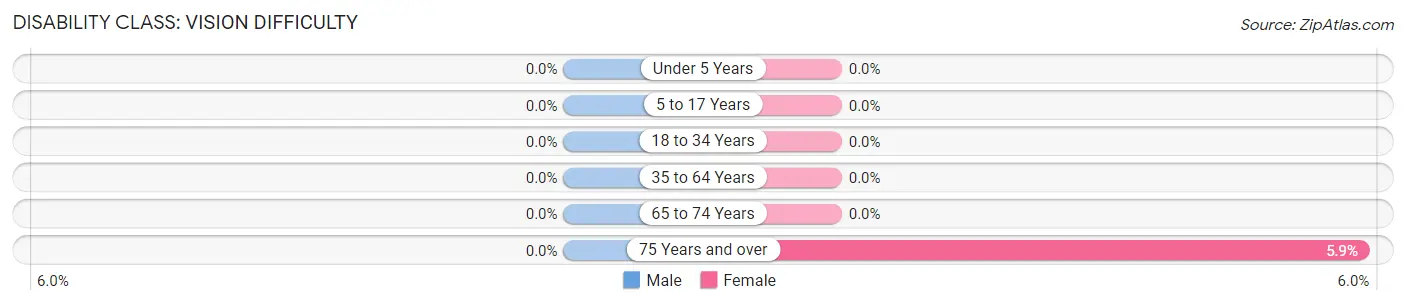
| Age Bracket | Male | Female |
| Under 5 Years | 0 (0.0%) | 0 (0.0%) |
| 5 to 17 Years | 0 (0.0%) | 0 (0.0%) |
| 18 to 34 Years | 0 (0.0%) | 0 (0.0%) |
| 35 to 64 Years | 0 (0.0%) | 0 (0.0%) |
| 65 to 74 Years | 0 (0.0%) | 0 (0.0%) |
| 75 Years and over | 0 (0.0%) | 1 (5.9%) |
Disability Class: Cognitive Difficulty
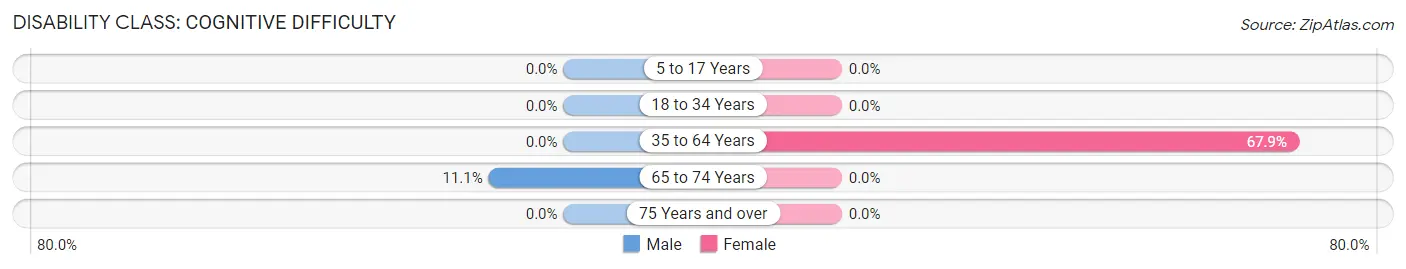
| Age Bracket | Male | Female |
| 5 to 17 Years | 0 (0.0%) | 0 (0.0%) |
| 18 to 34 Years | 0 (0.0%) | 0 (0.0%) |
| 35 to 64 Years | 0 (0.0%) | 19 (67.9%) |
| 65 to 74 Years | 1 (11.1%) | 0 (0.0%) |
| 75 Years and over | 0 (0.0%) | 0 (0.0%) |
Disability Class: Ambulatory Difficulty
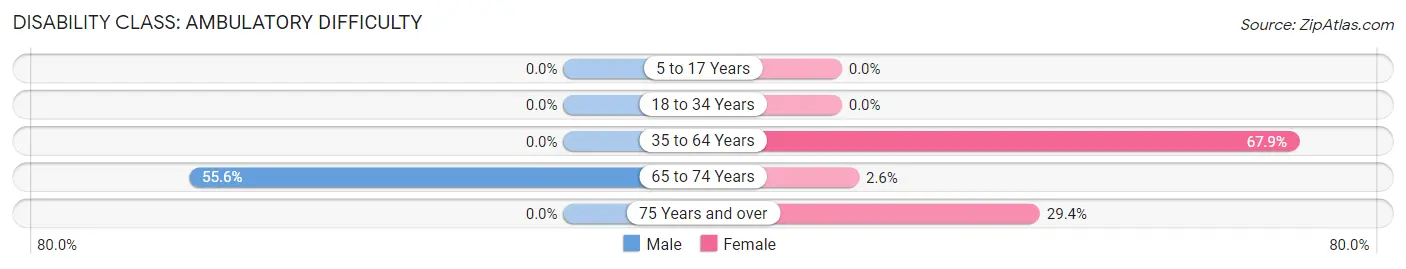
| Age Bracket | Male | Female |
| 5 to 17 Years | 0 (0.0%) | 0 (0.0%) |
| 18 to 34 Years | 0 (0.0%) | 0 (0.0%) |
| 35 to 64 Years | 0 (0.0%) | 19 (67.9%) |
| 65 to 74 Years | 5 (55.6%) | 1 (2.6%) |
| 75 Years and over | 0 (0.0%) | 5 (29.4%) |
Disability Class: Self-Care Difficulty

| Age Bracket | Male | Female |
| 5 to 17 Years | 0 (0.0%) | 0 (0.0%) |
| 18 to 34 Years | 0 (0.0%) | 0 (0.0%) |
| 35 to 64 Years | 0 (0.0%) | 0 (0.0%) |
| 65 to 74 Years | 0 (0.0%) | 0 (0.0%) |
| 75 Years and over | 0 (0.0%) | 0 (0.0%) |
Technology Access in Osnabrock
Computing Device Access in Osnabrock
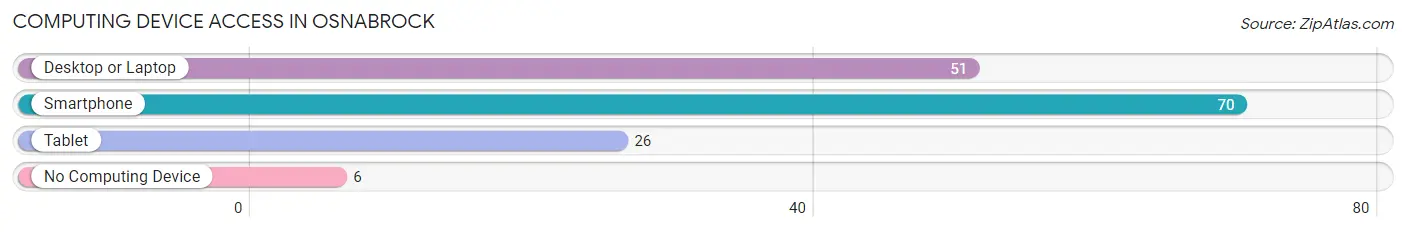
| Device Type | # Households | % Households |
| Desktop or Laptop | 51 | 52.6% |
| Smartphone | 70 | 72.2% |
| Tablet | 26 | 26.8% |
| No Computing Device | 6 | 6.2% |
| Total | 97 | 100.0% |
Internet Access in Osnabrock
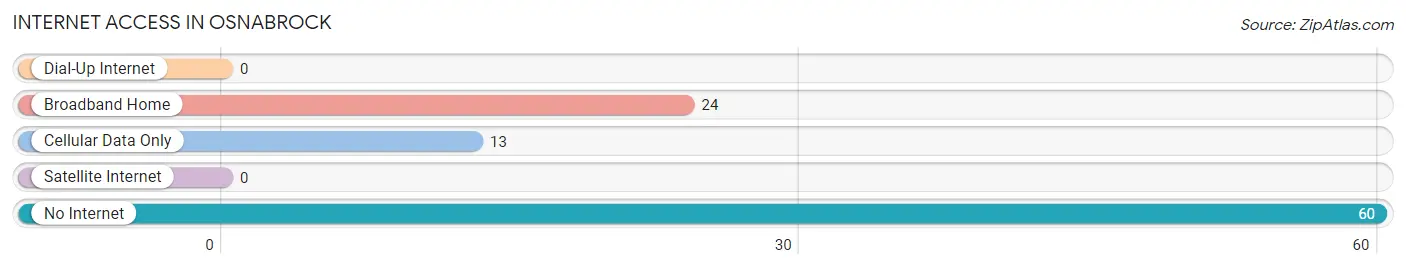
| Internet Type | # Households | % Households |
| Dial-Up Internet | 0 | 0.0% |
| Broadband Home | 24 | 24.7% |
| Cellular Data Only | 13 | 13.4% |
| Satellite Internet | 0 | 0.0% |
| No Internet | 60 | 61.9% |
| Total | 97 | 100.0% |
Osnabrock Summary
Osnabrock is a small town located in the northeastern corner of North Dakota, United States. It is situated in the Red River Valley, a region of the Great Plains. The town is located in the county of Cavalier, and is part of the Grand Forks metropolitan area. The population of Osnabrock was estimated to be around 200 people in 2020.
History
Osnabrock was founded in 1883 by German immigrants who had come to the area to farm. The town was named after the city of Osnabrück in Germany. The first settlers were mostly farmers, but the town soon became a trading center for the surrounding area. The first post office was established in 1884, and the first school was built in 1885.
The town grew steadily throughout the late 19th and early 20th centuries, and by the 1920s it had become a thriving community. The Great Depression hit the town hard, however, and many of the businesses closed. The population declined steadily until the 1950s, when the town began to experience a resurgence.
Geography
Osnabrock is located in the Red River Valley, a region of the Great Plains. The town is situated on the banks of the Red River, which forms the border between North Dakota and Minnesota. The town is surrounded by rolling hills and farmland, and is located about 25 miles north of Grand Forks.
The climate in Osnabrock is continental, with cold winters and hot summers. The average annual temperature is around 45°F, and the average annual precipitation is around 20 inches.
Economy
The economy of Osnabrock is largely based on agriculture. The town is surrounded by farmland, and many of the residents are involved in farming or related activities. The town also has a few small businesses, including a grocery store, a hardware store, and a few restaurants.
Demographics
As of the 2020 census, the population of Osnabrock was estimated to be around 200 people. The racial makeup of the town was 97.5% White, 0.5% Native American, 0.5% Asian, and 1.5% from other races. The median household income was $45,000, and the median home value was $125,000.
Conclusion
Osnabrock is a small town located in the northeastern corner of North Dakota. It was founded in 1883 by German immigrants, and has since become a thriving agricultural community. The town has a population of around 200 people, and the economy is largely based on farming and related activities. The town is surrounded by rolling hills and farmland, and is located about 25 miles north of Grand Forks.
Common Questions
What is Per Capita Income in Osnabrock?
Per Capita income in Osnabrock is $33,659.
What is the Median Household income in Osnabrock?
Median Household Income in Osnabrock is $35,430.
What is Inequality or Gini Index in Osnabrock?
Inequality or Gini Index in Osnabrock is 0.52.
What is the Total Population of Osnabrock?
Total Population of Osnabrock is 175.
What is the Total Male Population of Osnabrock?
Total Male Population of Osnabrock is 65.
What is the Total Female Population of Osnabrock?
Total Female Population of Osnabrock is 110.
What is the Ratio of Males per 100 Females in Osnabrock?
There are 59.09 Males per 100 Females in Osnabrock.
What is the Ratio of Females per 100 Males in Osnabrock?
There are 169.23 Females per 100 Males in Osnabrock.
What is the Median Population Age in Osnabrock?
Median Population Age in Osnabrock is 71.8 Years.
What is the Average Family Size in Osnabrock
Average Family Size in Osnabrock is 2.8 People.
What is the Average Household Size in Osnabrock
Average Household Size in Osnabrock is 1.4 People.
How Large is the Labor Force in Osnabrock?
There are 49 People in the Labor Forcein in Osnabrock.
What is the Percentage of People in the Labor Force in Osnabrock?
31.0% of People are in the Labor Force in Osnabrock.
What is the Unemployment Rate in Osnabrock?
Unemployment Rate in Osnabrock is 2.0%.