Drake, ND Map & Demographics
Drake Map
Drake Overview
$31,387
PER CAPITA INCOME
$79,583
AVG FAMILY INCOME
$43,750
AVG HOUSEHOLD INCOME
44.9%
WAGE / INCOME GAP [ % ]
55.1¢/ $1
WAGE / INCOME GAP [ $ ]
0.50
INEQUALITY / GINI INDEX
297
TOTAL POPULATION
173
MALE POPULATION
124
FEMALE POPULATION
139.52
MALES / 100 FEMALES
71.68
FEMALES / 100 MALES
40.9
MEDIAN AGE
3.1
AVG FAMILY SIZE
2.1
AVG HOUSEHOLD SIZE
128
LABOR FORCE [ PEOPLE ]
55.4%
PERCENT IN LABOR FORCE
15.6%
UNEMPLOYMENT RATE
Drake Zip Codes
Drake Area Codes
Income in Drake
Income Overview in Drake
Per Capita Income in Drake is $31,387, while median incomes of families and households are $79,583 and $43,750 respectively.
| Characteristic | Number | Measure |
| Per Capita Income | 297 | $31,387 |
| Median Family Income | 69 | $79,583 |
| Mean Family Income | 69 | $69,023 |
| Median Household Income | 141 | $43,750 |
| Mean Household Income | 141 | $62,206 |
| Income Deficit | 69 | $0 |
| Wage / Income Gap (%) | 297 | 44.86% |
| Wage / Income Gap ($) | 297 | 55.14¢ per $1 |
| Gini / Inequality Index | 297 | 0.50 |
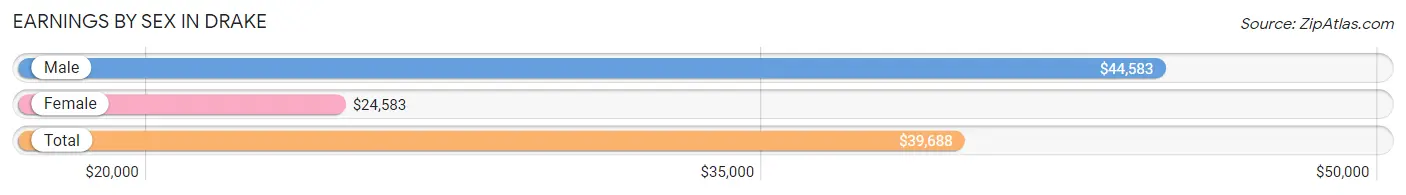
Earnings by Sex in Drake
Average Earnings in Drake are $39,688, $44,583 for men and $24,583 for women, a difference of 44.9%.
| Sex | Number | Average Earnings |
| Male | 97 (69.3%) | $44,583 |
| Female | 43 (30.7%) | $24,583 |
| Total | 140 (100.0%) | $39,688 |
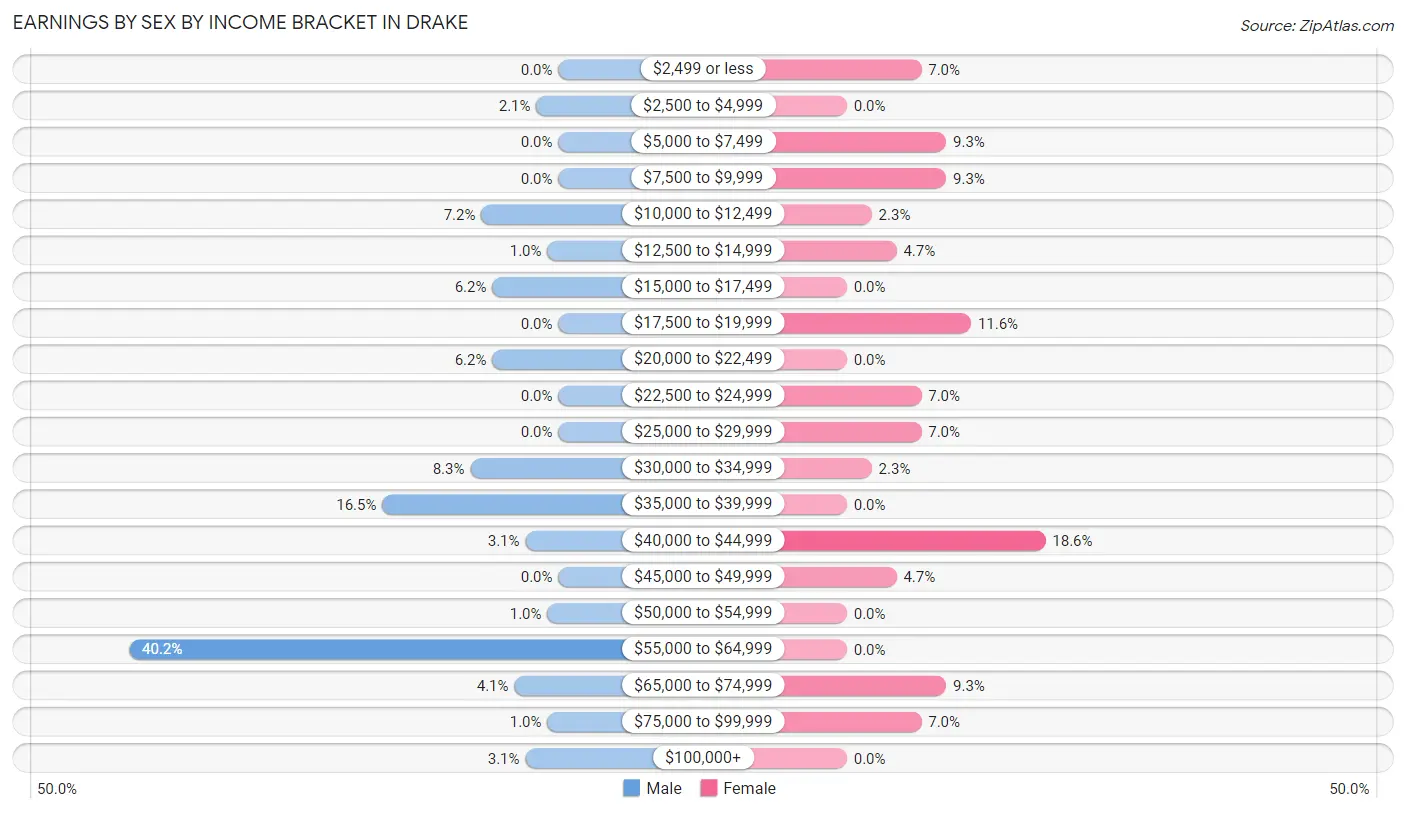
Earnings by Sex by Income Bracket in Drake
The most common earnings brackets in Drake are $55,000 to $64,999 for men (39 | 40.2%) and $40,000 to $44,999 for women (8 | 18.6%).
| Income | Male | Female |
| $2,499 or less | 0 (0.0%) | 3 (7.0%) |
| $2,500 to $4,999 | 2 (2.1%) | 0 (0.0%) |
| $5,000 to $7,499 | 0 (0.0%) | 4 (9.3%) |
| $7,500 to $9,999 | 0 (0.0%) | 4 (9.3%) |
| $10,000 to $12,499 | 7 (7.2%) | 1 (2.3%) |
| $12,500 to $14,999 | 1 (1.0%) | 2 (4.6%) |
| $15,000 to $17,499 | 6 (6.2%) | 0 (0.0%) |
| $17,500 to $19,999 | 0 (0.0%) | 5 (11.6%) |
| $20,000 to $22,499 | 6 (6.2%) | 0 (0.0%) |
| $22,500 to $24,999 | 0 (0.0%) | 3 (7.0%) |
| $25,000 to $29,999 | 0 (0.0%) | 3 (7.0%) |
| $30,000 to $34,999 | 8 (8.3%) | 1 (2.3%) |
| $35,000 to $39,999 | 16 (16.5%) | 0 (0.0%) |
| $40,000 to $44,999 | 3 (3.1%) | 8 (18.6%) |
| $45,000 to $49,999 | 0 (0.0%) | 2 (4.6%) |
| $50,000 to $54,999 | 1 (1.0%) | 0 (0.0%) |
| $55,000 to $64,999 | 39 (40.2%) | 0 (0.0%) |
| $65,000 to $74,999 | 4 (4.1%) | 4 (9.3%) |
| $75,000 to $99,999 | 1 (1.0%) | 3 (7.0%) |
| $100,000+ | 3 (3.1%) | 0 (0.0%) |
| Total | 97 (100.0%) | 43 (100.0%) |
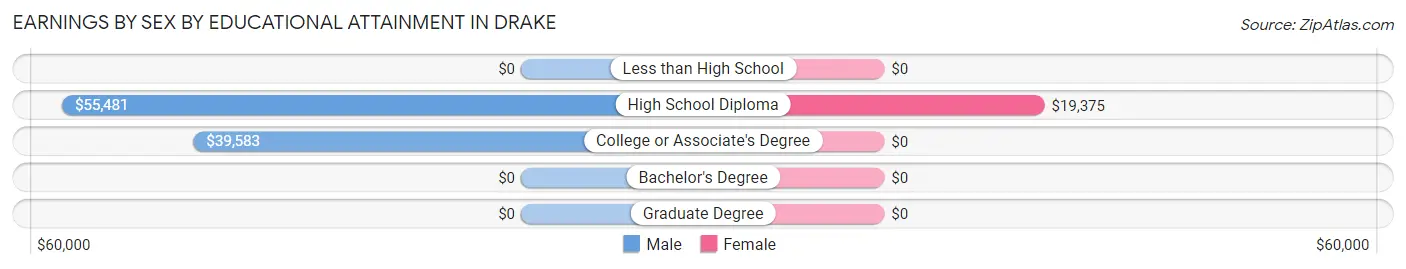
Earnings by Sex by Educational Attainment in Drake
Average earnings in Drake are $42,917 for men and $25,000 for women, a difference of 41.7%. Men with an educational attainment of high school diploma enjoy the highest average annual earnings of $55,481, while those with college or associate's degree education earn the least with $39,583. Women with an educational attainment of high school diploma earn the most with the average annual earnings of $19,375, while those with high school diploma education have the smallest earnings of $19,375.
| Educational Attainment | Male Income | Female Income |
| Less than High School | - | - |
| High School Diploma | $55,481 | $19,375 |
| College or Associate's Degree | $39,583 | $0 |
| Bachelor's Degree | - | - |
| Graduate Degree | - | - |
| Total | $42,917 | $25,000 |
Family Income in Drake
Family Income Brackets in Drake
According to the Drake family income data, there are 19 families falling into the $75,000 to $99,999 income range, which is the most common income bracket and makes up 27.5% of all families.
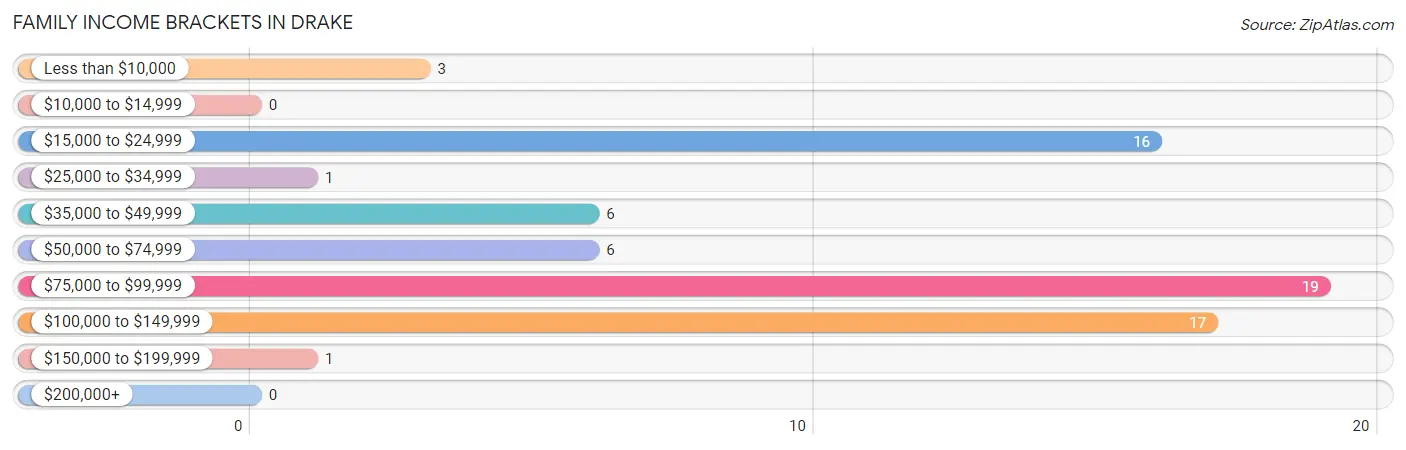
| Income Bracket | # Families | % Families |
| Less than $10,000 | 3 | 4.3% |
| $10,000 to $14,999 | 0 | 0.0% |
| $15,000 to $24,999 | 16 | 23.2% |
| $25,000 to $34,999 | 1 | 1.4% |
| $35,000 to $49,999 | 6 | 8.7% |
| $50,000 to $74,999 | 6 | 8.7% |
| $75,000 to $99,999 | 19 | 27.5% |
| $100,000 to $149,999 | 17 | 24.6% |
| $150,000 to $199,999 | 1 | 1.4% |
| $200,000+ | 0 | 0.0% |
Family Income by Famaliy Size in Drake
4-person families (14 | 20.3%) account for the highest median family income in Drake with $101,429 per family, while 2-person families (41 | 59.4%) have the highest median income of $42,812 per family member.
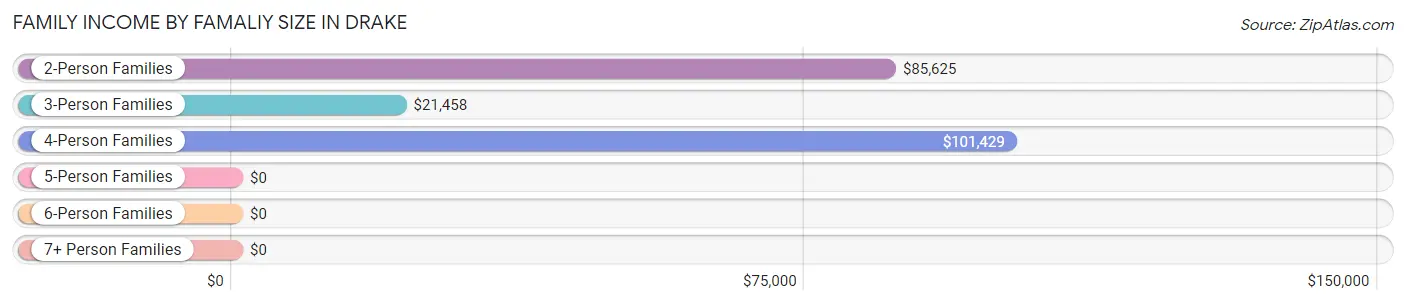
| Income Bracket | # Families | Median Income |
| 2-Person Families | 41 (59.4%) | $85,625 |
| 3-Person Families | 9 (13.0%) | $21,458 |
| 4-Person Families | 14 (20.3%) | $101,429 |
| 5-Person Families | 0 (0.0%) | $0 |
| 6-Person Families | 3 (4.3%) | $0 |
| 7+ Person Families | 2 (2.9%) | $0 |
| Total | 69 (100.0%) | $79,583 |
Family Income by Number of Earners in Drake
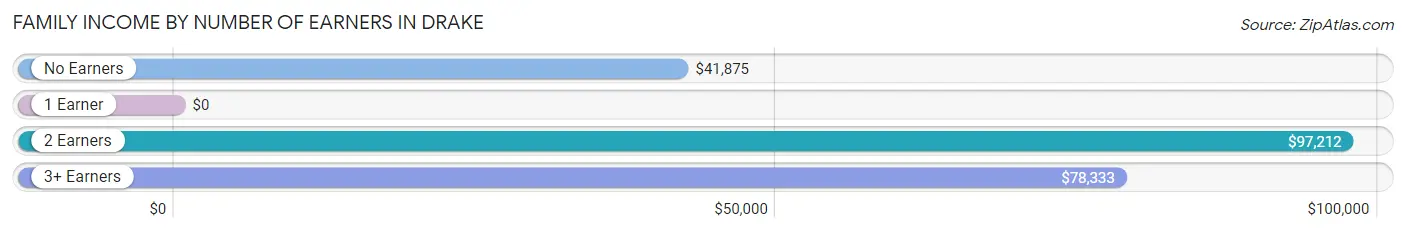
| Number of Earners | # Families | Median Income |
| No Earners | 13 (18.8%) | $41,875 |
| 1 Earner | 21 (30.4%) | $0 |
| 2 Earners | 29 (42.0%) | $97,212 |
| 3+ Earners | 6 (8.7%) | $78,333 |
| Total | 69 (100.0%) | $79,583 |
Household Income in Drake
Household Income Brackets in Drake
With 36 households falling in the category, the $15,000 to $24,999 income range is the most frequent in Drake, accounting for 25.5% of all households. In contrast, only 1 households (0.7%) fall into the $150,000 to $199,999 income bracket, making it the least populous group.
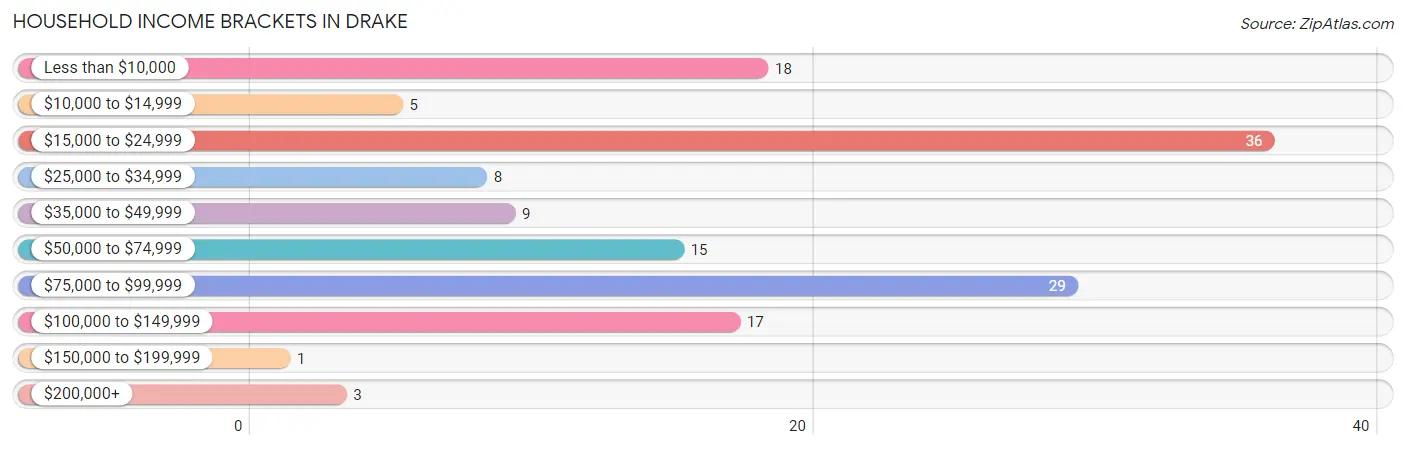
| Income Bracket | # Households | % Households |
| Less than $10,000 | 18 | 12.8% |
| $10,000 to $14,999 | 5 | 3.5% |
| $15,000 to $24,999 | 36 | 25.5% |
| $25,000 to $34,999 | 8 | 5.7% |
| $35,000 to $49,999 | 9 | 6.4% |
| $50,000 to $74,999 | 15 | 10.6% |
| $75,000 to $99,999 | 29 | 20.6% |
| $100,000 to $149,999 | 17 | 12.1% |
| $150,000 to $199,999 | 1 | 0.7% |
| $200,000+ | 3 | 2.1% |
Household Income by Householder Age in Drake
The median household income in Drake is $43,750, with the highest median household income of $95,192 found in the 45 to 64 years age bracket for the primary householder. A total of 46 households (32.6%) fall into this category. Meanwhile, the 15 to 24 years age bracket for the primary householder has the lowest median household income of $2,499, with 11 households (7.8%) in this group.
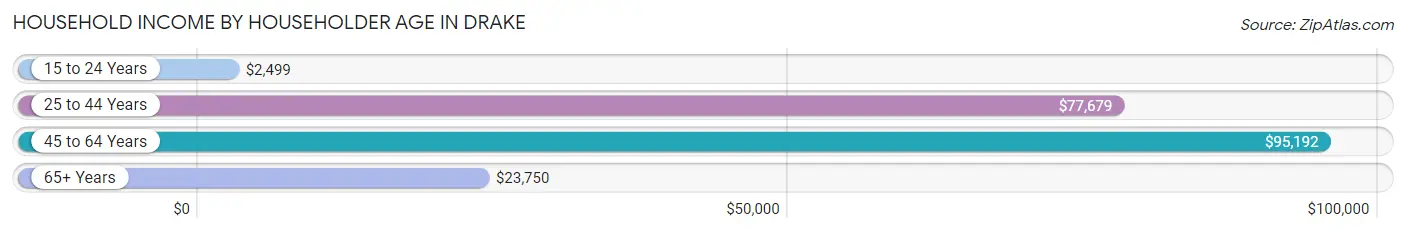
| Income Bracket | # Households | Median Income |
| 15 to 24 Years | 11 (7.8%) | $2,499 |
| 25 to 44 Years | 31 (22.0%) | $77,679 |
| 45 to 64 Years | 46 (32.6%) | $95,192 |
| 65+ Years | 53 (37.6%) | $23,750 |
| Total | 141 (100.0%) | $43,750 |
Poverty in Drake
Income Below Poverty by Sex and Age in Drake
With 26.0% poverty level for males and 27.4% for females among the residents of Drake, 5 year old males and under 5 year old females are the most vulnerable to poverty, with 2 males (100.0%) and 11 females (100.0%) in their respective age groups living below the poverty level.
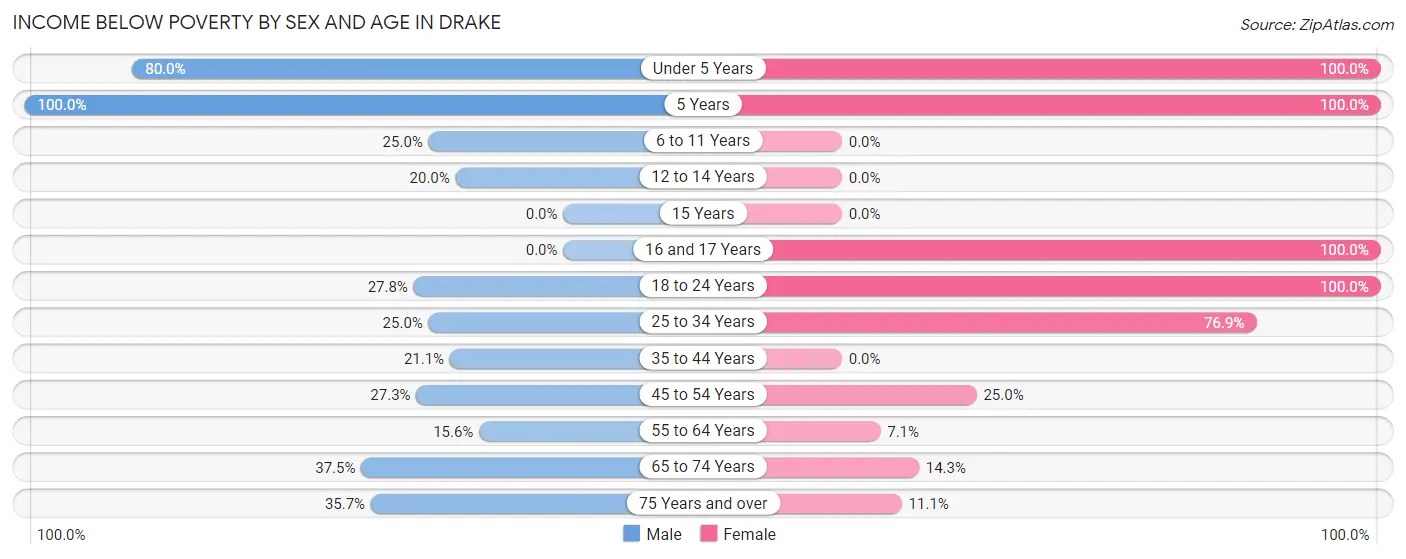
| Age Bracket | Male | Female |
| Under 5 Years | 4 (80.0%) | 11 (100.0%) |
| 5 Years | 2 (100.0%) | 2 (100.0%) |
| 6 to 11 Years | 4 (25.0%) | 0 (0.0%) |
| 12 to 14 Years | 2 (20.0%) | 0 (0.0%) |
| 15 Years | 0 (0.0%) | 0 (0.0%) |
| 16 and 17 Years | 0 (0.0%) | 3 (100.0%) |
| 18 to 24 Years | 5 (27.8%) | 1 (100.0%) |
| 25 to 34 Years | 8 (25.0%) | 10 (76.9%) |
| 35 to 44 Years | 4 (21.0%) | 0 (0.0%) |
| 45 to 54 Years | 3 (27.3%) | 1 (25.0%) |
| 55 to 64 Years | 5 (15.6%) | 1 (7.1%) |
| 65 to 74 Years | 3 (37.5%) | 2 (14.3%) |
| 75 Years and over | 5 (35.7%) | 3 (11.1%) |
| Total | 45 (26.0%) | 34 (27.4%) |
Income Above Poverty by Sex and Age in Drake
According to the poverty statistics in Drake, males aged 16 and 17 years and females aged 12 to 14 years are the age groups that are most secure financially, with 100.0% of males and 100.0% of females in these age groups living above the poverty line.
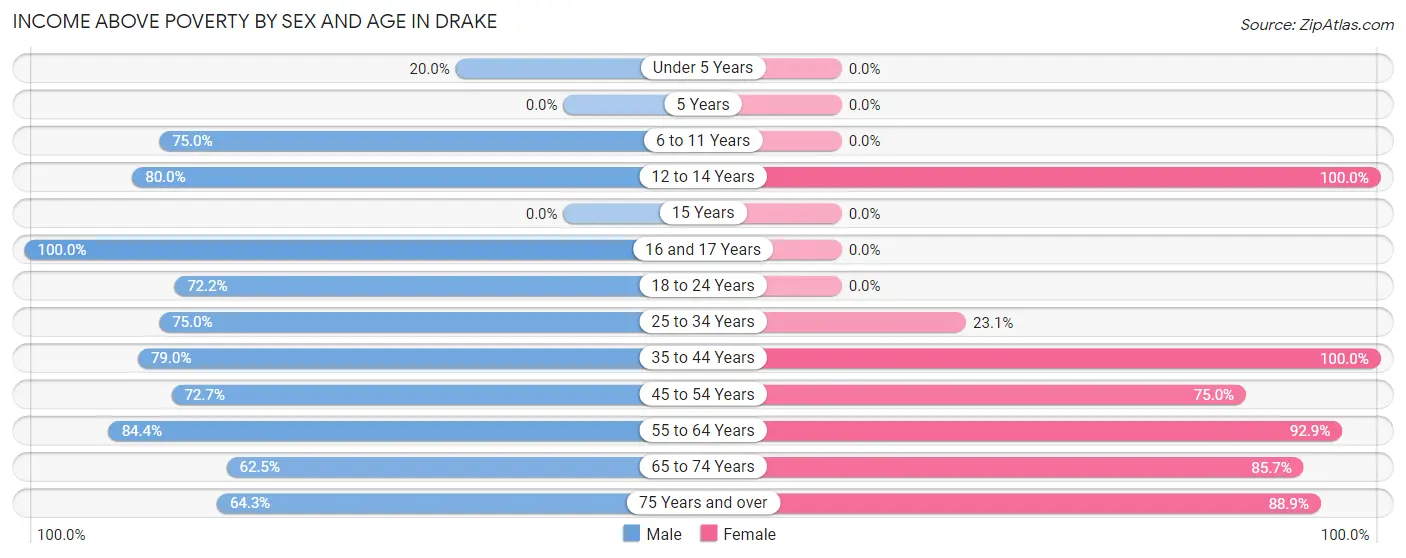
| Age Bracket | Male | Female |
| Under 5 Years | 1 (20.0%) | 0 (0.0%) |
| 5 Years | 0 (0.0%) | 0 (0.0%) |
| 6 to 11 Years | 12 (75.0%) | 0 (0.0%) |
| 12 to 14 Years | 8 (80.0%) | 20 (100.0%) |
| 15 Years | 0 (0.0%) | 0 (0.0%) |
| 16 and 17 Years | 6 (100.0%) | 0 (0.0%) |
| 18 to 24 Years | 13 (72.2%) | 0 (0.0%) |
| 25 to 34 Years | 24 (75.0%) | 3 (23.1%) |
| 35 to 44 Years | 15 (78.9%) | 15 (100.0%) |
| 45 to 54 Years | 8 (72.7%) | 3 (75.0%) |
| 55 to 64 Years | 27 (84.4%) | 13 (92.9%) |
| 65 to 74 Years | 5 (62.5%) | 12 (85.7%) |
| 75 Years and over | 9 (64.3%) | 24 (88.9%) |
| Total | 128 (74.0%) | 90 (72.6%) |
Income Below Poverty Among Married-Couple Families in Drake
The poverty statistics for married-couple families in Drake show that 26.2% or 11 of the total 42 families live below the poverty line. Families with 5 or more children have the highest poverty rate of 100.0%, comprising of 2 families. On the other hand, families with 3 or 4 children have the lowest poverty rate of 0.0%, which includes 0 families.
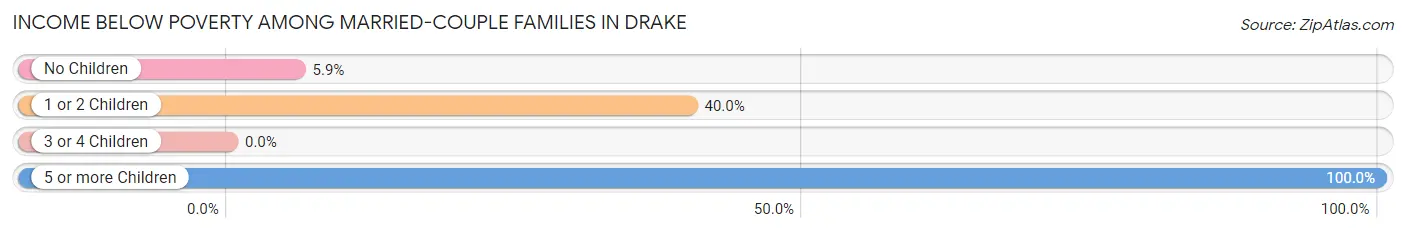
| Children | Above Poverty | Below Poverty |
| No Children | 16 (94.1%) | 1 (5.9%) |
| 1 or 2 Children | 12 (60.0%) | 8 (40.0%) |
| 3 or 4 Children | 3 (100.0%) | 0 (0.0%) |
| 5 or more Children | 0 (0.0%) | 2 (100.0%) |
| Total | 31 (73.8%) | 11 (26.2%) |
Income Below Poverty Among Single-Parent Households in Drake
According to the poverty data in Drake, 21.0% or 4 single-father households and 50.0% or 4 single-mother households are living below the poverty line. Among single-father households, those with 1 or 2 children have the highest poverty rate, with 2 households (100.0%) experiencing poverty. Likewise, among single-mother households, those with 1 or 2 children have the highest poverty rate, with 4 households (66.7%) falling below the poverty line.
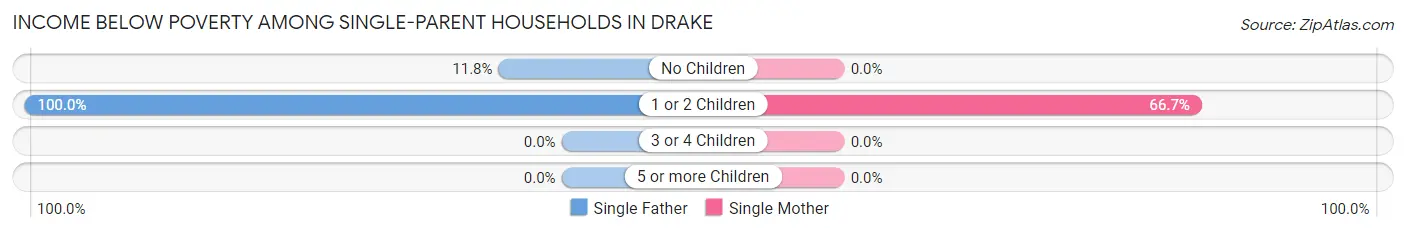
| Children | Single Father | Single Mother |
| No Children | 2 (11.8%) | 0 (0.0%) |
| 1 or 2 Children | 2 (100.0%) | 4 (66.7%) |
| 3 or 4 Children | 0 (0.0%) | 0 (0.0%) |
| 5 or more Children | 0 (0.0%) | 0 (0.0%) |
| Total | 4 (21.0%) | 4 (50.0%) |
Income Below Poverty Among Married-Couple vs Single-Parent Households in Drake
The poverty data for Drake shows that 11 of the married-couple family households (26.2%) and 8 of the single-parent households (29.6%) are living below the poverty level. Within the married-couple family households, those with 5 or more children have the highest poverty rate, with 2 households (100.0%) falling below the poverty line. Among the single-parent households, those with 1 or 2 children have the highest poverty rate, with 6 household (75.0%) living below poverty.
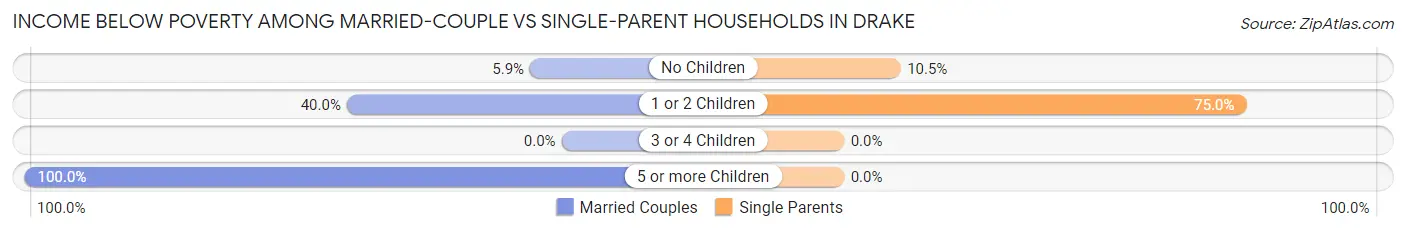
| Children | Married-Couple Families | Single-Parent Households |
| No Children | 1 (5.9%) | 2 (10.5%) |
| 1 or 2 Children | 8 (40.0%) | 6 (75.0%) |
| 3 or 4 Children | 0 (0.0%) | 0 (0.0%) |
| 5 or more Children | 2 (100.0%) | 0 (0.0%) |
| Total | 11 (26.2%) | 8 (29.6%) |
Race in Drake
The most populous races in Drake are White / Caucasian (295 | 99.3%), and Black / African American (2 | 0.7%).
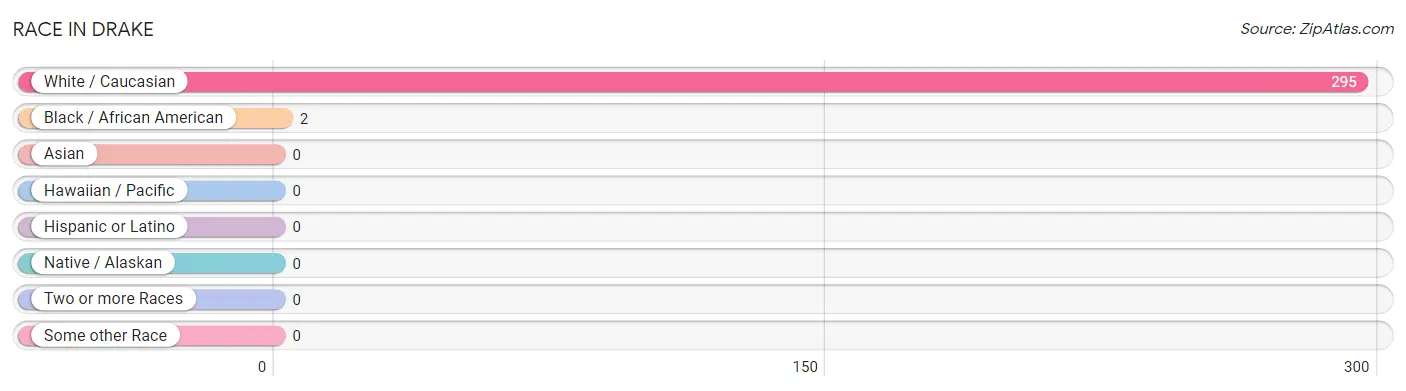
| Race | # Population | % Population |
| Asian | 0 | 0.0% |
| Black / African American | 2 | 0.7% |
| Hawaiian / Pacific | 0 | 0.0% |
| Hispanic or Latino | 0 | 0.0% |
| Native / Alaskan | 0 | 0.0% |
| White / Caucasian | 295 | 99.3% |
| Two or more Races | 0 | 0.0% |
| Some other Race | 0 | 0.0% |
| Total | 297 | 100.0% |
Ancestry in Drake
The most populous ancestries reported in Drake are German (197 | 66.3%), French (32 | 10.8%), Norwegian (31 | 10.4%), Scotch-Irish (19 | 6.4%), and English (10 | 3.4%), together accounting for 97.3% of all Drake residents.
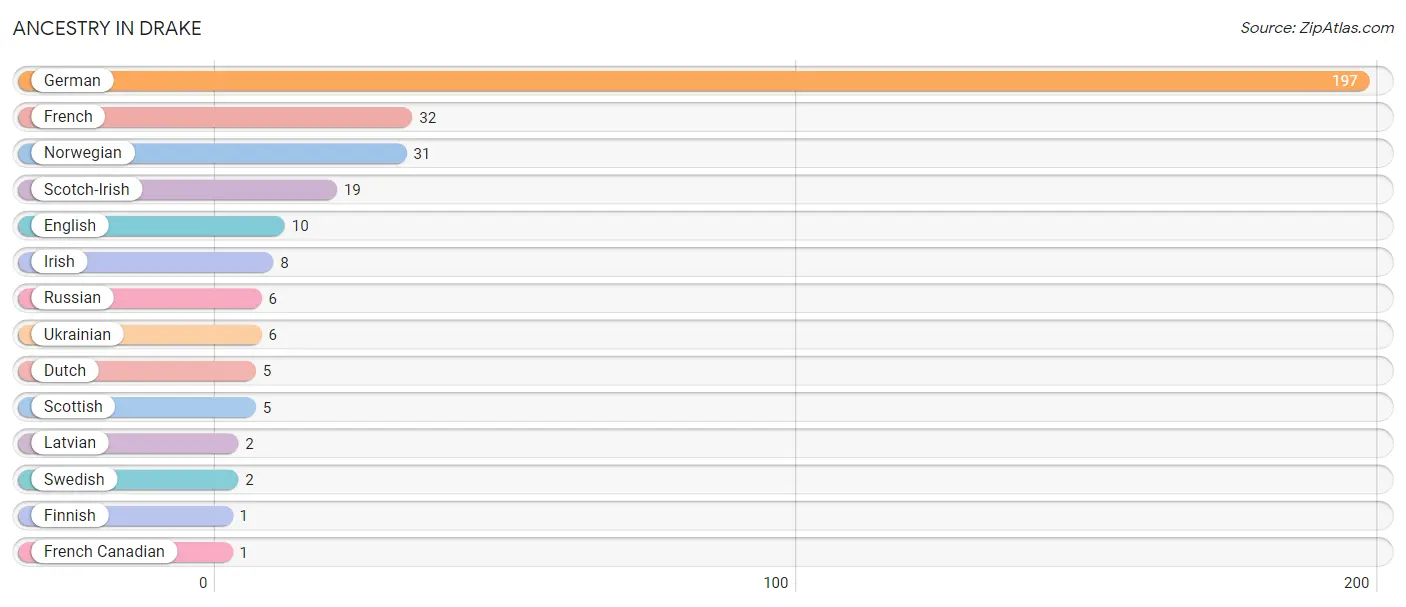
| Ancestry | # Population | % Population |
| Dutch | 5 | 1.7% |
| English | 10 | 3.4% |
| Finnish | 1 | 0.3% |
| French | 32 | 10.8% |
| French Canadian | 1 | 0.3% |
| German | 197 | 66.3% |
| Irish | 8 | 2.7% |
| Latvian | 2 | 0.7% |
| Norwegian | 31 | 10.4% |
| Russian | 6 | 2.0% |
| Scotch-Irish | 19 | 6.4% |
| Scottish | 5 | 1.7% |
| Swedish | 2 | 0.7% |
| Ukrainian | 6 | 2.0% | View All 14 Rows |
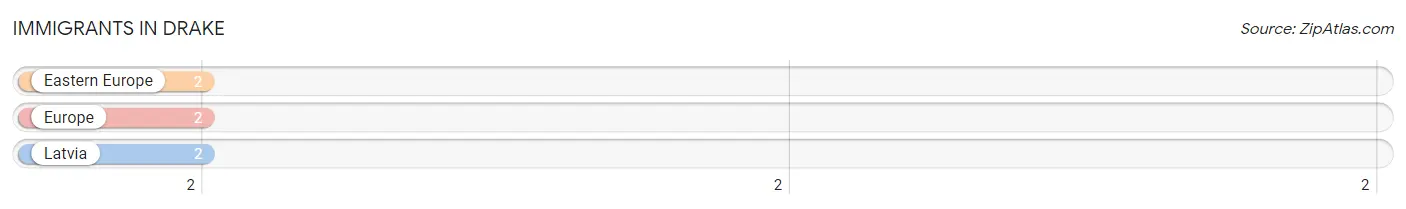
Immigrants in Drake
The most numerous immigrant groups reported in Drake came from Eastern Europe (2 | 0.7%), Europe (2 | 0.7%), and Latvia (2 | 0.7%), together accounting for 2.0% of all Drake residents.
| Immigration Origin | # Population | % Population |
| Eastern Europe | 2 | 0.7% |
| Europe | 2 | 0.7% |
| Latvia | 2 | 0.7% | View All 3 Rows |
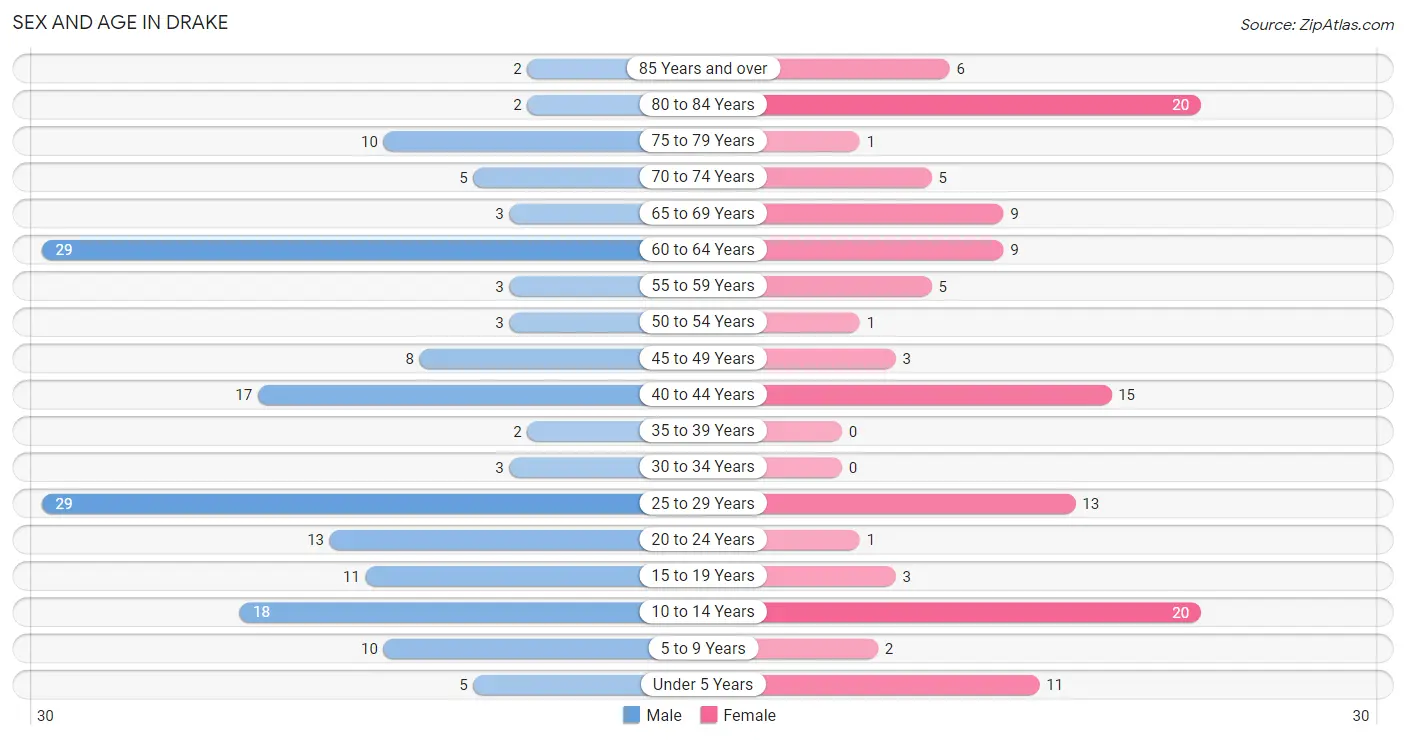
Sex and Age in Drake
Sex and Age in Drake
The most populous age groups in Drake are 25 to 29 Years (29 | 16.8%) for men and 10 to 14 Years (20 | 16.1%) for women.
| Age Bracket | Male | Female |
| Under 5 Years | 5 (2.9%) | 11 (8.9%) |
| 5 to 9 Years | 10 (5.8%) | 2 (1.6%) |
| 10 to 14 Years | 18 (10.4%) | 20 (16.1%) |
| 15 to 19 Years | 11 (6.4%) | 3 (2.4%) |
| 20 to 24 Years | 13 (7.5%) | 1 (0.8%) |
| 25 to 29 Years | 29 (16.8%) | 13 (10.5%) |
| 30 to 34 Years | 3 (1.7%) | 0 (0.0%) |
| 35 to 39 Years | 2 (1.2%) | 0 (0.0%) |
| 40 to 44 Years | 17 (9.8%) | 15 (12.1%) |
| 45 to 49 Years | 8 (4.6%) | 3 (2.4%) |
| 50 to 54 Years | 3 (1.7%) | 1 (0.8%) |
| 55 to 59 Years | 3 (1.7%) | 5 (4.0%) |
| 60 to 64 Years | 29 (16.8%) | 9 (7.3%) |
| 65 to 69 Years | 3 (1.7%) | 9 (7.3%) |
| 70 to 74 Years | 5 (2.9%) | 5 (4.0%) |
| 75 to 79 Years | 10 (5.8%) | 1 (0.8%) |
| 80 to 84 Years | 2 (1.2%) | 20 (16.1%) |
| 85 Years and over | 2 (1.2%) | 6 (4.8%) |
| Total | 173 (100.0%) | 124 (100.0%) |
Families and Households in Drake
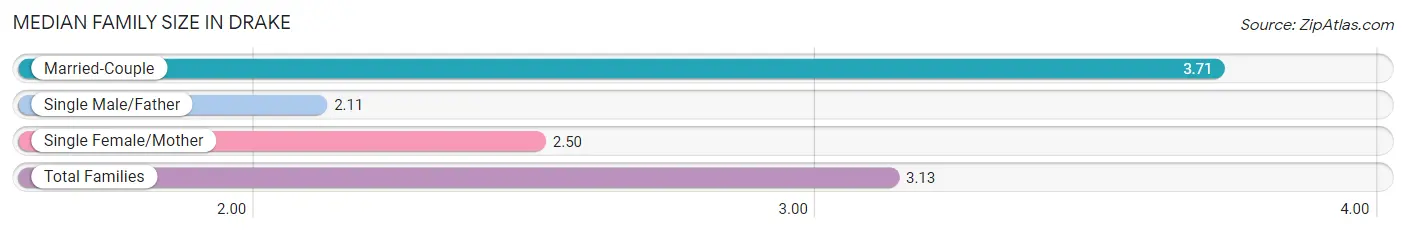
Median Family Size in Drake
The median family size in Drake is 3.13 persons per family, with married-couple families (42 | 60.9%) accounting for the largest median family size of 3.71 persons per family. On the other hand, single male/father families (19 | 27.5%) represent the smallest median family size with 2.11 persons per family.
| Family Type | # Families | Family Size |
| Married-Couple | 42 (60.9%) | 3.71 |
| Single Male/Father | 19 (27.5%) | 2.11 |
| Single Female/Mother | 8 (11.6%) | 2.50 |
| Total Families | 69 (100.0%) | 3.13 |
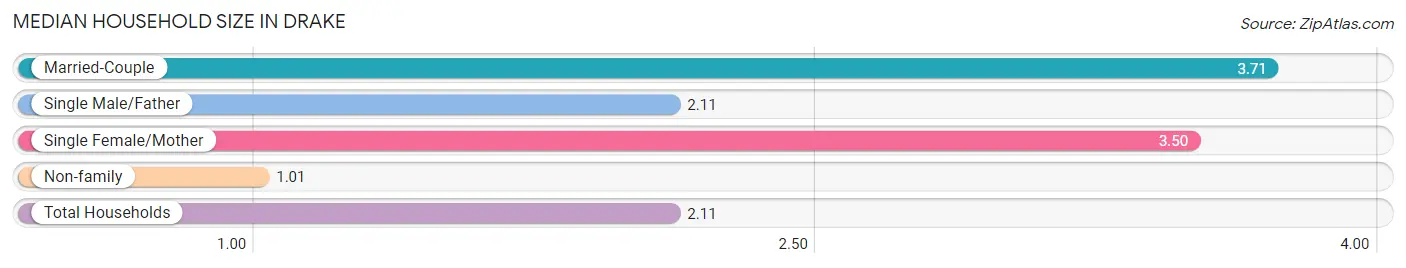
Median Household Size in Drake
The median household size in Drake is 2.11 persons per household, with married-couple households (42 | 29.8%) accounting for the largest median household size of 3.71 persons per household. non-family households (72 | 51.1%) represent the smallest median household size with 1.01 persons per household.
| Household Type | # Households | Household Size |
| Married-Couple | 42 (29.8%) | 3.71 |
| Single Male/Father | 19 (13.5%) | 2.11 |
| Single Female/Mother | 8 (5.7%) | 3.50 |
| Non-family | 72 (51.1%) | 1.01 |
| Total Households | 141 (100.0%) | 2.11 |
Household Size by Marriage Status in Drake
Out of a total of 141 households in Drake, 69 (48.9%) are family households, while 72 (51.1%) are nonfamily households. The most numerous type of family households are 2-person households, comprising 37, and the most common type of nonfamily households are 1-person households, comprising 70.
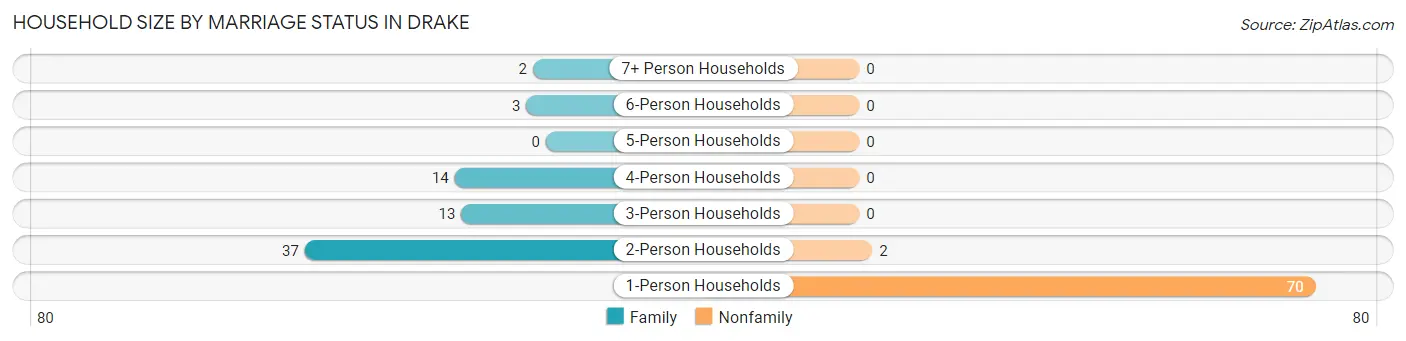
| Household Size | Family Households | Nonfamily Households |
| 1-Person Households | - | 70 (49.6%) |
| 2-Person Households | 37 (26.2%) | 2 (1.4%) |
| 3-Person Households | 13 (9.2%) | 0 (0.0%) |
| 4-Person Households | 14 (9.9%) | 0 (0.0%) |
| 5-Person Households | 0 (0.0%) | 0 (0.0%) |
| 6-Person Households | 3 (2.1%) | 0 (0.0%) |
| 7+ Person Households | 2 (1.4%) | 0 (0.0%) |
| Total | 69 (48.9%) | 72 (51.1%) |
Female Fertility in Drake
Fertility by Age in Drake
Average fertility rate in Drake is 257.0 births per 1,000 women. Women in the age bracket of 20 to 34 years have the highest fertility rate with 643.0 births per 1,000 women. Women in the age bracket of 20 to 34 years acount for 100.0% of all women with births.
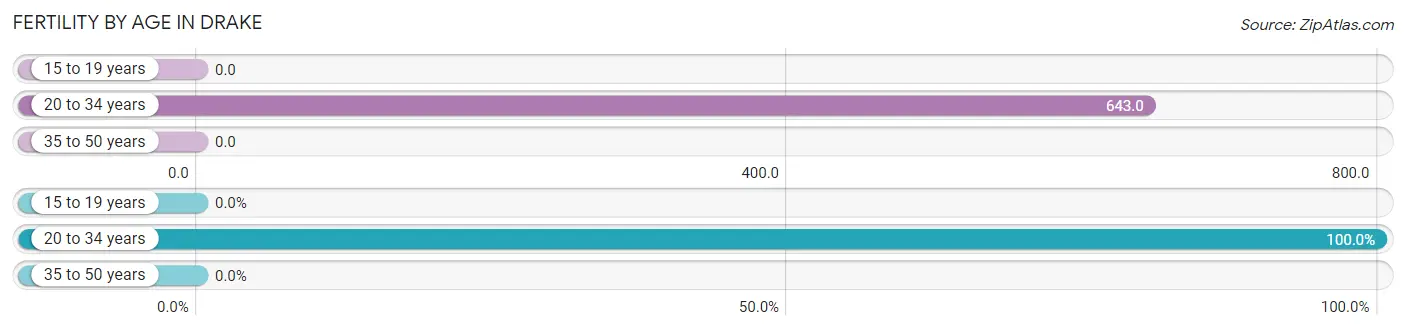
| Age Bracket | Women with Births | Births / 1,000 Women |
| 15 to 19 years | 0 (0.0%) | 0.0 |
| 20 to 34 years | 9 (100.0%) | 643.0 |
| 35 to 50 years | 0 (0.0%) | 0.0 |
| Total | 9 (100.0%) | 257.0 |
Fertility by Age by Marriage Status in Drake
55.6% of women with births (9) in Drake are married. The highest percentage of unmarried women with births falls into 20 to 34 years age bracket with 44.4% of them unmarried at the time of birth, while the lowest percentage of unmarried women with births belong to 20 to 34 years age bracket with 44.4% of them unmarried.
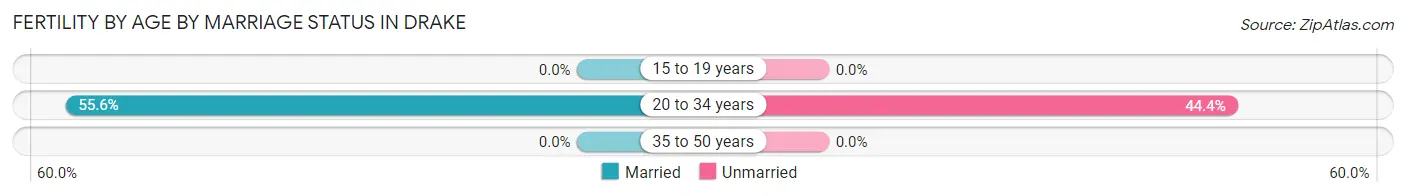
| Age Bracket | Married | Unmarried |
| 15 to 19 years | 0 (0.0%) | 0 (0.0%) |
| 20 to 34 years | 5 (55.6%) | 4 (44.4%) |
| 35 to 50 years | 0 (0.0%) | 0 (0.0%) |
| Total | 5 (55.6%) | 4 (44.4%) |
Fertility by Education in Drake
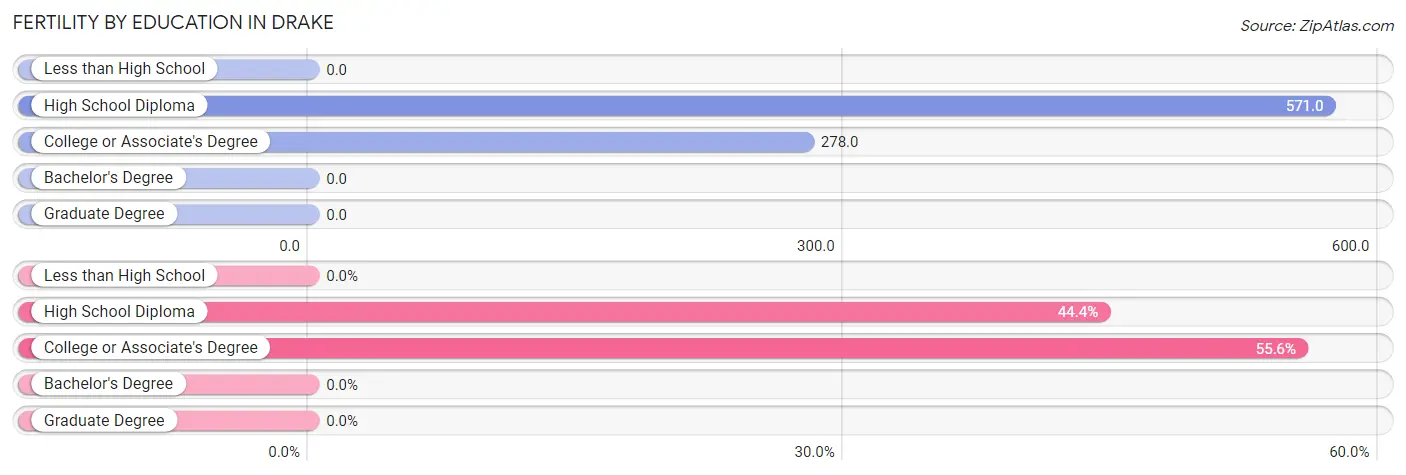
| Educational Attainment | Women with Births | Births / 1,000 Women |
| Less than High School | 0 (0.0%) | 0.0 |
| High School Diploma | 4 (44.4%) | 571.0 |
| College or Associate's Degree | 5 (55.6%) | 278.0 |
| Bachelor's Degree | 0 (0.0%) | 0.0 |
| Graduate Degree | 0 (0.0%) | 0.0 |
| Total | 9 (100.0%) | 257.0 |
Fertility by Education by Marriage Status in Drake
44.4% of women with births in Drake are unmarried. Women with the educational attainment of college or associate's degree are most likely to be married with 100.0% of them married at childbirth, while women with the educational attainment of high school diploma are least likely to be married with 100.0% of them unmarried at childbirth.
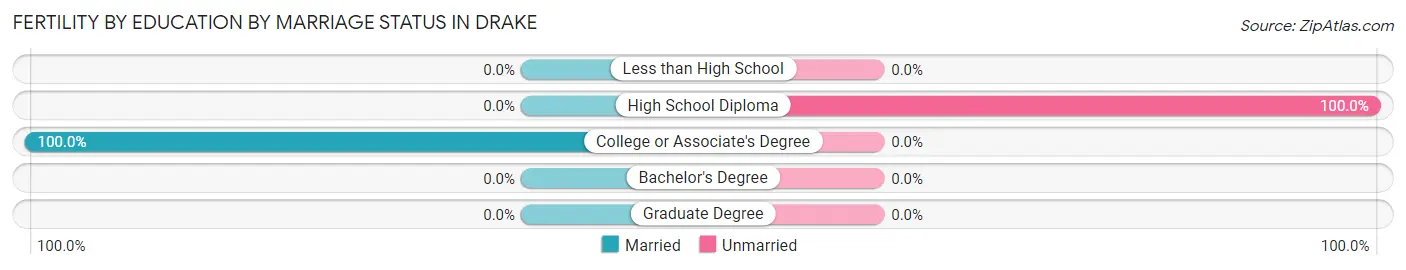
| Educational Attainment | Married | Unmarried |
| Less than High School | 0 (0.0%) | 0 (0.0%) |
| High School Diploma | 0 (0.0%) | 4 (100.0%) |
| College or Associate's Degree | 5 (100.0%) | 0 (0.0%) |
| Bachelor's Degree | 0 (0.0%) | 0 (0.0%) |
| Graduate Degree | 0 (0.0%) | 0 (0.0%) |
| Total | 5 (55.6%) | 4 (44.4%) |
Employment Characteristics in Drake
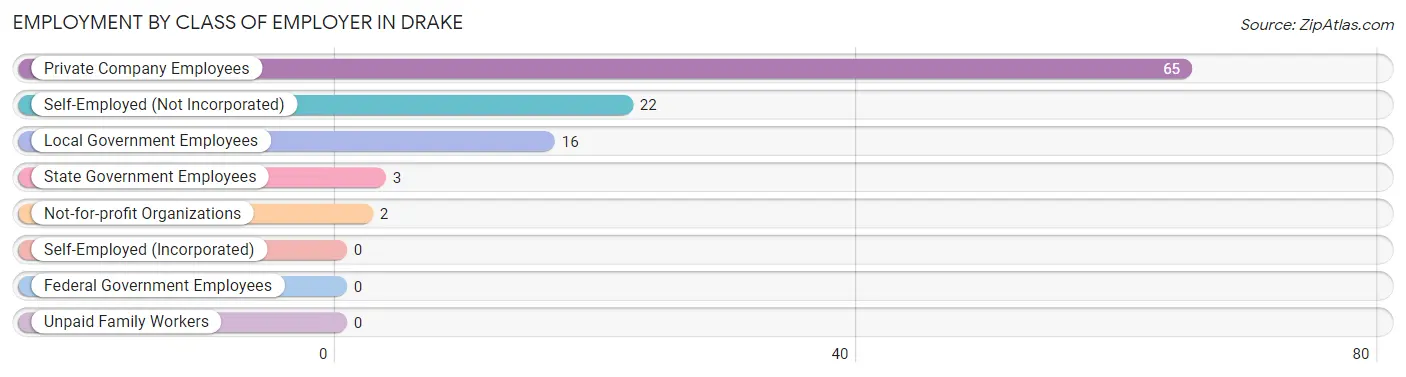
Employment by Class of Employer in Drake
Among the 108 employed individuals in Drake, private company employees (65 | 60.2%), self-employed (not incorporated) (22 | 20.4%), and local government employees (16 | 14.8%) make up the most common classes of employment.
| Employer Class | # Employees | % Employees |
| Private Company Employees | 65 | 60.2% |
| Self-Employed (Incorporated) | 0 | 0.0% |
| Self-Employed (Not Incorporated) | 22 | 20.4% |
| Not-for-profit Organizations | 2 | 1.8% |
| Local Government Employees | 16 | 14.8% |
| State Government Employees | 3 | 2.8% |
| Federal Government Employees | 0 | 0.0% |
| Unpaid Family Workers | 0 | 0.0% |
| Total | 108 | 100.0% |
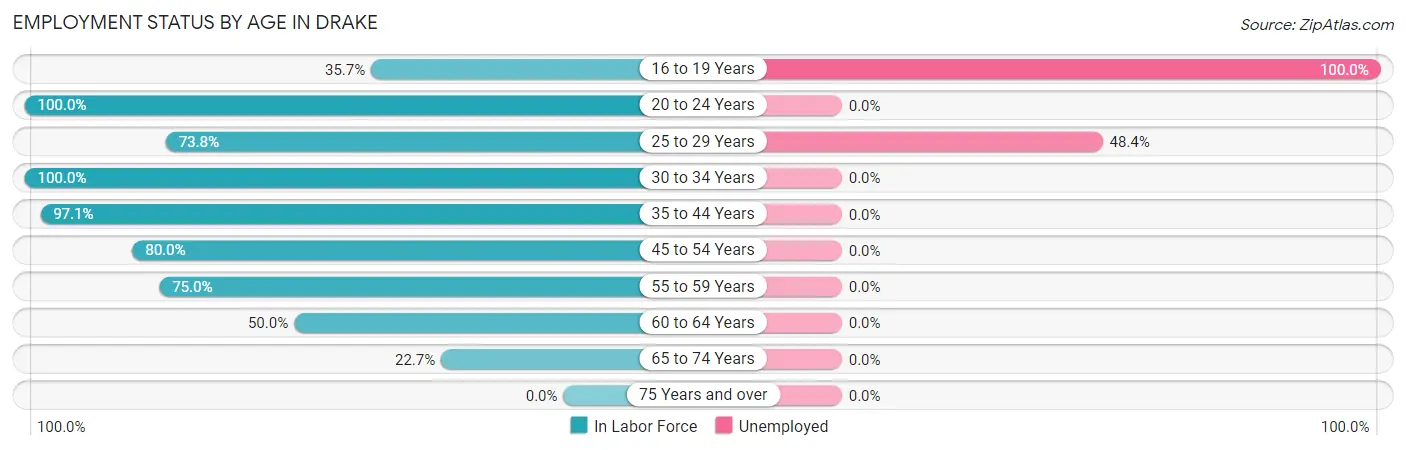
Employment Status by Age in Drake
According to the labor force statistics for Drake, out of the total population over 16 years of age (231), 55.4% or 128 individuals are in the labor force, with 15.6% or 20 of them unemployed. The age group with the highest labor force participation rate is 20 to 24 years, with 100.0% or 14 individuals in the labor force. Within the labor force, the 16 to 19 years age range has the highest percentage of unemployed individuals, with 100.0% or 5 of them being unemployed.
| Age Bracket | In Labor Force | Unemployed |
| 16 to 19 Years | 5 (35.7%) | 5 (100.0%) |
| 20 to 24 Years | 14 (100.0%) | 0 (0.0%) |
| 25 to 29 Years | 31 (73.8%) | 15 (48.4%) |
| 30 to 34 Years | 3 (100.0%) | 0 (0.0%) |
| 35 to 44 Years | 33 (97.1%) | 0 (0.0%) |
| 45 to 54 Years | 12 (80.0%) | 0 (0.0%) |
| 55 to 59 Years | 6 (75.0%) | 0 (0.0%) |
| 60 to 64 Years | 19 (50.0%) | 0 (0.0%) |
| 65 to 74 Years | 5 (22.7%) | 0 (0.0%) |
| 75 Years and over | 0 (0.0%) | 0 (0.0%) |
| Total | 128 (55.4%) | 20 (15.6%) |
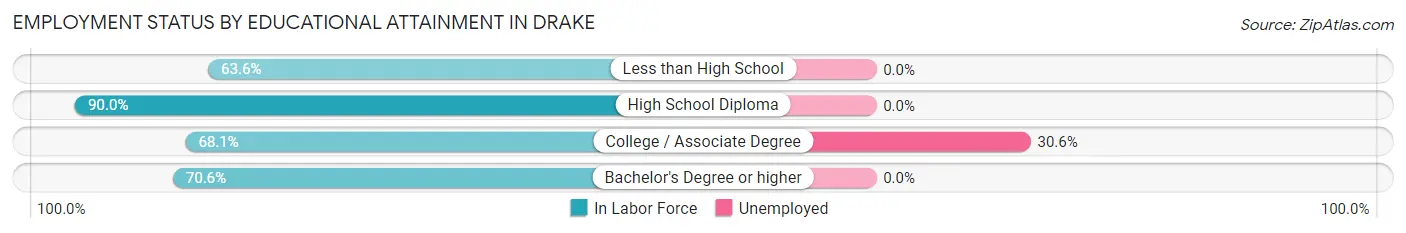
Employment Status by Educational Attainment in Drake
According to labor force statistics for Drake, 74.3% of individuals (104) out of the total population between 25 and 64 years of age (140) are in the labor force, with 14.4% or 15 of them being unemployed. The group with the highest labor force participation rate are those with the educational attainment of high school diploma, with 90.0% or 36 individuals in the labor force. Within the labor force, individuals with college / associate degree education have the highest percentage of unemployment, with 30.6% or 15 of them being unemployed.
| Educational Attainment | In Labor Force | Unemployed |
| Less than High School | 7 (63.6%) | 0 (0.0%) |
| High School Diploma | 36 (90.0%) | 0 (0.0%) |
| College / Associate Degree | 49 (68.1%) | 22 (30.6%) |
| Bachelor's Degree or higher | 12 (70.6%) | 0 (0.0%) |
| Total | 104 (74.3%) | 20 (14.4%) |
Employment Occupations by Sex in Drake
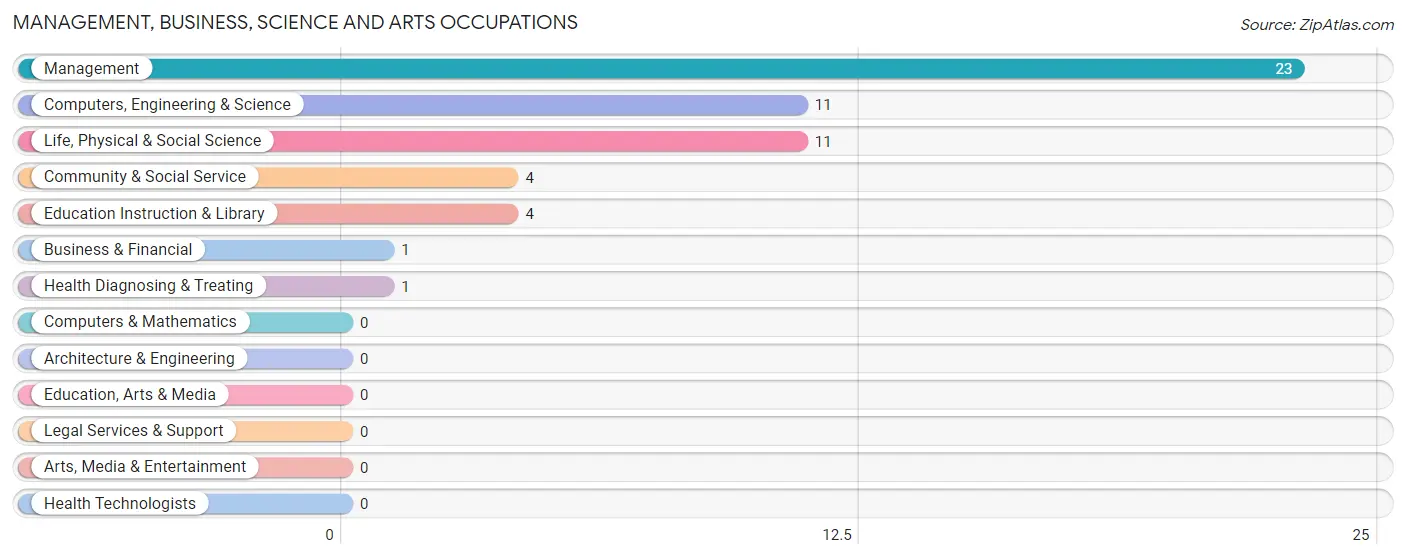
Management, Business, Science and Arts Occupations
The most common Management, Business, Science and Arts occupations in Drake are Management (23 | 21.3%), Computers, Engineering & Science (11 | 10.2%), Life, Physical & Social Science (11 | 10.2%), Community & Social Service (4 | 3.7%), and Education Instruction & Library (4 | 3.7%).
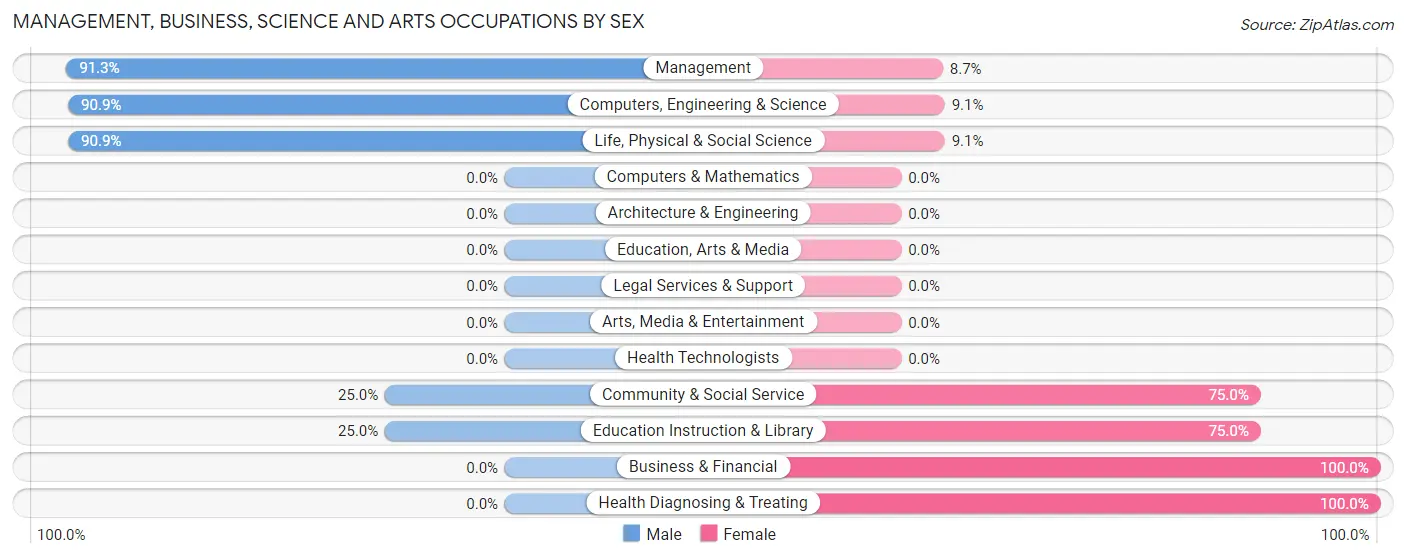
Management, Business, Science and Arts Occupations by Sex
Within the Management, Business, Science and Arts occupations in Drake, the most male-oriented occupations are Management (91.3%), Computers, Engineering & Science (90.9%), and Life, Physical & Social Science (90.9%), while the most female-oriented occupations are Business & Financial (100.0%), Health Diagnosing & Treating (100.0%), and Community & Social Service (75.0%).
| Occupation | Male | Female |
| Management | 21 (91.3%) | 2 (8.7%) |
| Business & Financial | 0 (0.0%) | 1 (100.0%) |
| Computers, Engineering & Science | 10 (90.9%) | 1 (9.1%) |
| Computers & Mathematics | 0 (0.0%) | 0 (0.0%) |
| Architecture & Engineering | 0 (0.0%) | 0 (0.0%) |
| Life, Physical & Social Science | 10 (90.9%) | 1 (9.1%) |
| Community & Social Service | 1 (25.0%) | 3 (75.0%) |
| Education, Arts & Media | 0 (0.0%) | 0 (0.0%) |
| Legal Services & Support | 0 (0.0%) | 0 (0.0%) |
| Education Instruction & Library | 1 (25.0%) | 3 (75.0%) |
| Arts, Media & Entertainment | 0 (0.0%) | 0 (0.0%) |
| Health Diagnosing & Treating | 0 (0.0%) | 1 (100.0%) |
| Health Technologists | 0 (0.0%) | 0 (0.0%) |
| Total (Category) | 32 (80.0%) | 8 (20.0%) |
| Total (Overall) | 68 (63.0%) | 40 (37.0%) |
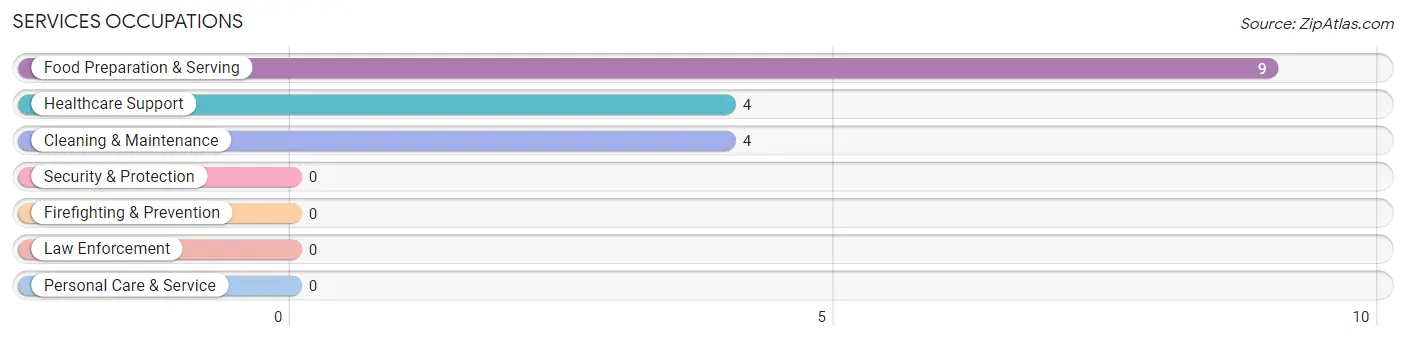
Services Occupations
The most common Services occupations in Drake are Food Preparation & Serving (9 | 8.3%), Healthcare Support (4 | 3.7%), and Cleaning & Maintenance (4 | 3.7%).
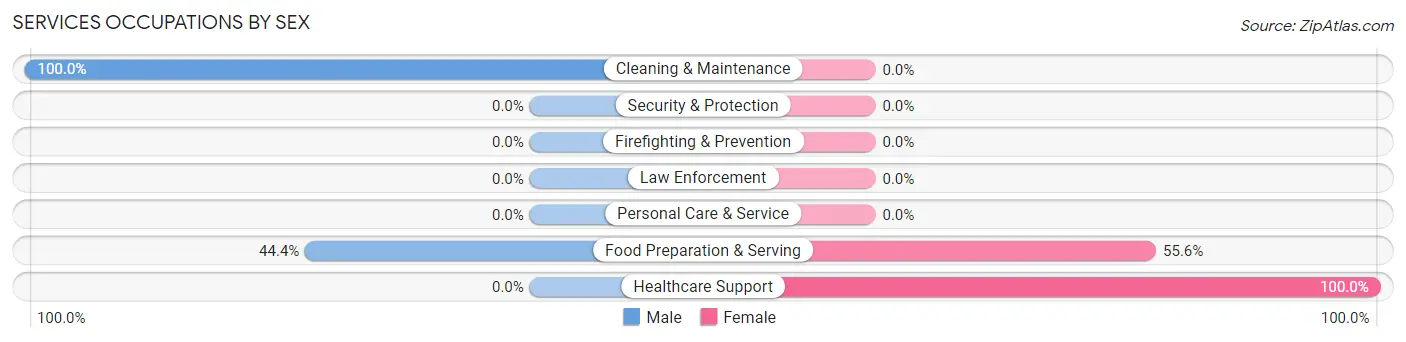
Services Occupations by Sex
Within the Services occupations in Drake, the most male-oriented occupations are Cleaning & Maintenance (100.0%), and Food Preparation & Serving (44.4%), while the most female-oriented occupations are Healthcare Support (100.0%), and Food Preparation & Serving (55.6%).
| Occupation | Male | Female |
| Healthcare Support | 0 (0.0%) | 4 (100.0%) |
| Security & Protection | 0 (0.0%) | 0 (0.0%) |
| Firefighting & Prevention | 0 (0.0%) | 0 (0.0%) |
| Law Enforcement | 0 (0.0%) | 0 (0.0%) |
| Food Preparation & Serving | 4 (44.4%) | 5 (55.6%) |
| Cleaning & Maintenance | 4 (100.0%) | 0 (0.0%) |
| Personal Care & Service | 0 (0.0%) | 0 (0.0%) |
| Total (Category) | 8 (47.1%) | 9 (52.9%) |
| Total (Overall) | 68 (63.0%) | 40 (37.0%) |
Sales and Office Occupations
The most common Sales and Office occupations in Drake are Office & Administration (10 | 9.3%), and Sales & Related (6 | 5.6%).
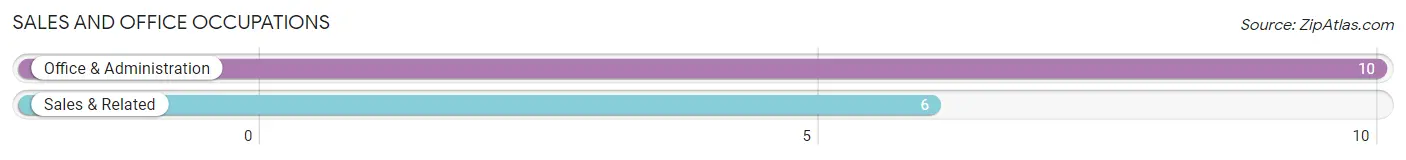
Sales and Office Occupations by Sex
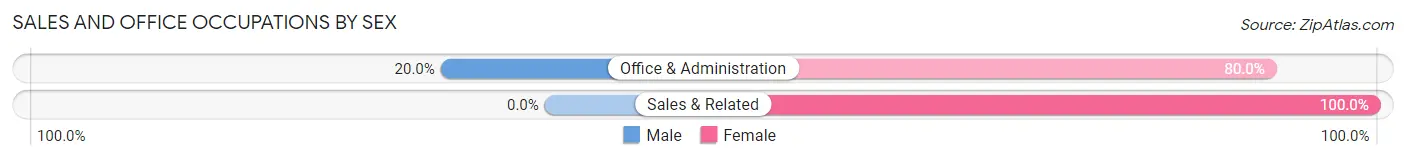
| Occupation | Male | Female |
| Sales & Related | 0 (0.0%) | 6 (100.0%) |
| Office & Administration | 2 (20.0%) | 8 (80.0%) |
| Total (Category) | 2 (12.5%) | 14 (87.5%) |
| Total (Overall) | 68 (63.0%) | 40 (37.0%) |
Natural Resources, Construction and Maintenance Occupations
The most common Natural Resources, Construction and Maintenance occupations in Drake are Construction & Extraction (10 | 9.3%), and Installation, Maintenance & Repair (2 | 1.8%).
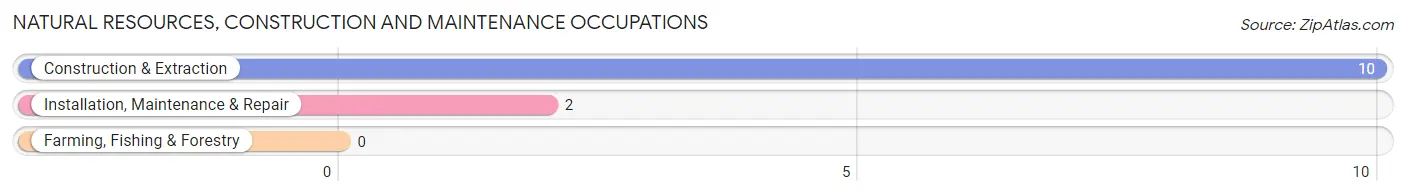
Natural Resources, Construction and Maintenance Occupations by Sex
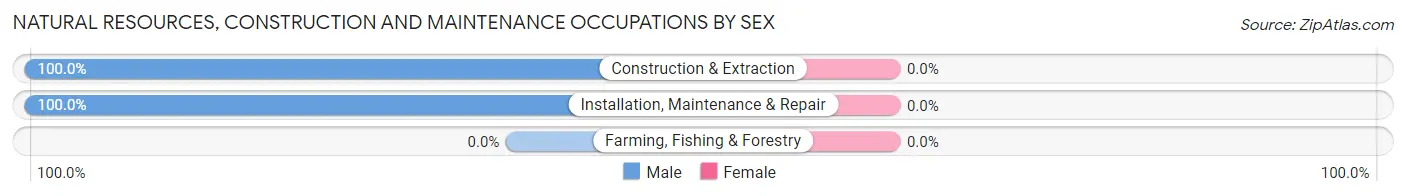
| Occupation | Male | Female |
| Farming, Fishing & Forestry | 0 (0.0%) | 0 (0.0%) |
| Construction & Extraction | 10 (100.0%) | 0 (0.0%) |
| Installation, Maintenance & Repair | 2 (100.0%) | 0 (0.0%) |
| Total (Category) | 12 (100.0%) | 0 (0.0%) |
| Total (Overall) | 68 (63.0%) | 40 (37.0%) |
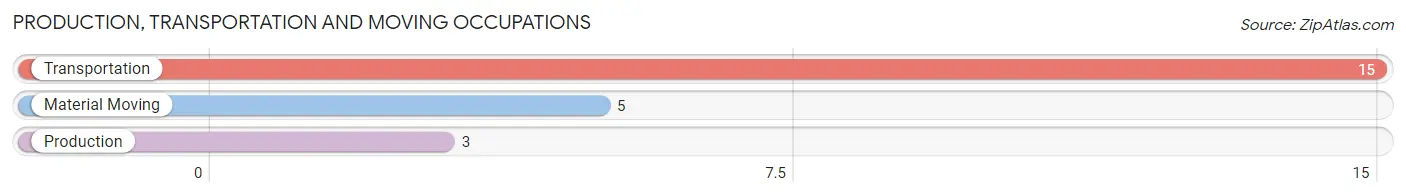
Production, Transportation and Moving Occupations
The most common Production, Transportation and Moving occupations in Drake are Transportation (15 | 13.9%), Material Moving (5 | 4.6%), and Production (3 | 2.8%).
Production, Transportation and Moving Occupations by Sex
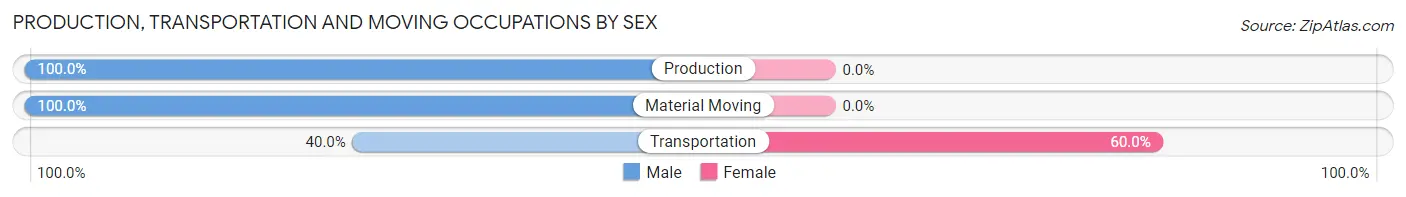
| Occupation | Male | Female |
| Production | 3 (100.0%) | 0 (0.0%) |
| Transportation | 6 (40.0%) | 9 (60.0%) |
| Material Moving | 5 (100.0%) | 0 (0.0%) |
| Total (Category) | 14 (60.9%) | 9 (39.1%) |
| Total (Overall) | 68 (63.0%) | 40 (37.0%) |
Employment Industries by Sex in Drake
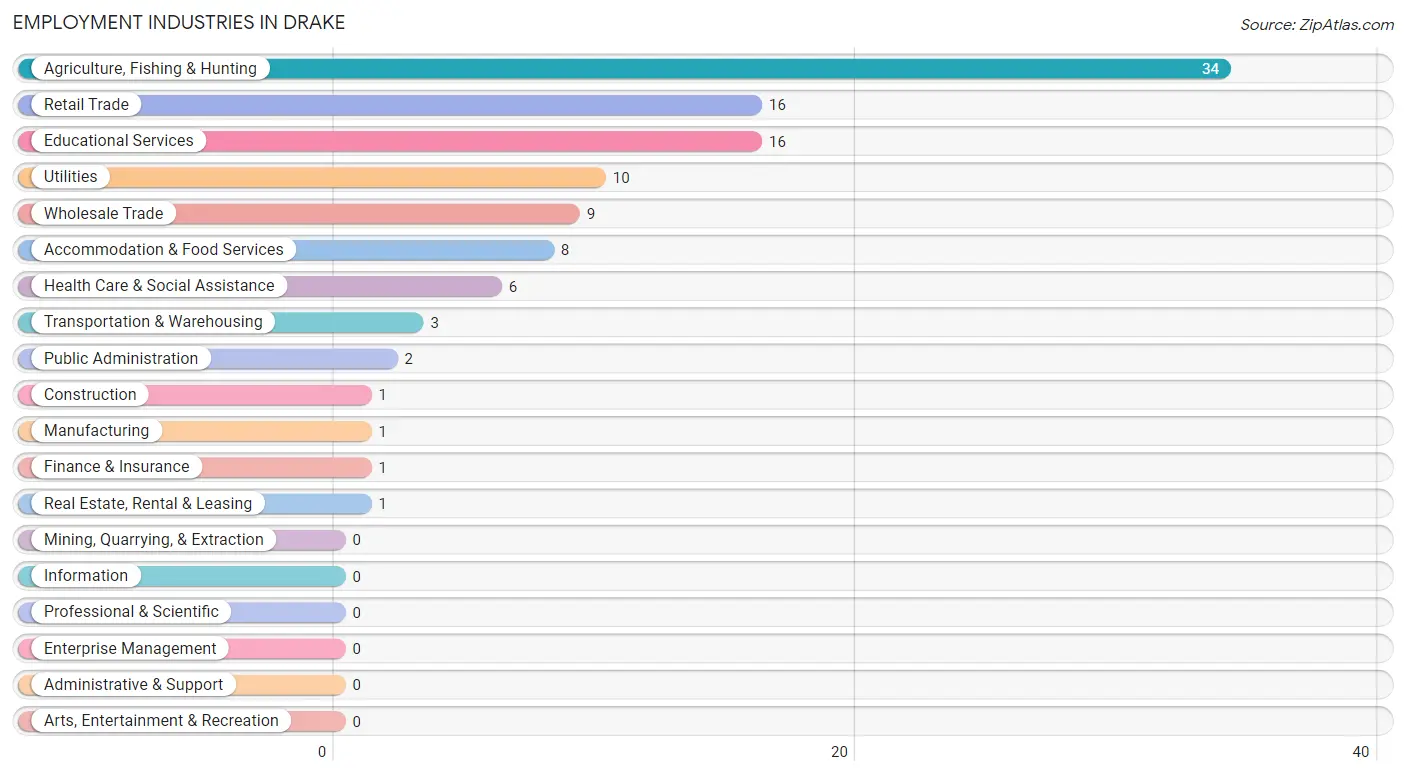
Employment Industries in Drake
The major employment industries in Drake include Agriculture, Fishing & Hunting (34 | 31.5%), Retail Trade (16 | 14.8%), Educational Services (16 | 14.8%), Utilities (10 | 9.3%), and Wholesale Trade (9 | 8.3%).
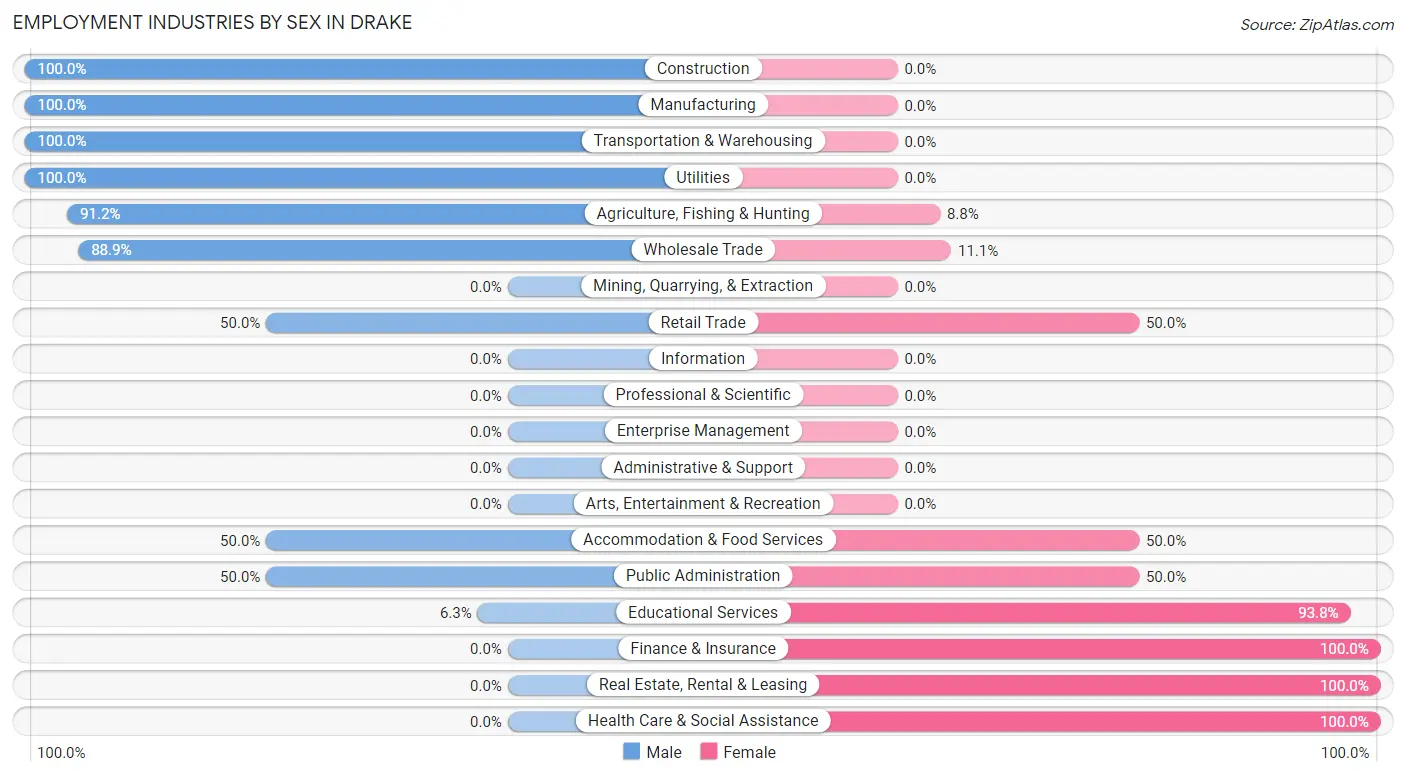
Employment Industries by Sex in Drake
The Drake industries that see more men than women are Construction (100.0%), Manufacturing (100.0%), and Transportation & Warehousing (100.0%), whereas the industries that tend to have a higher number of women are Finance & Insurance (100.0%), Real Estate, Rental & Leasing (100.0%), and Health Care & Social Assistance (100.0%).
| Industry | Male | Female |
| Agriculture, Fishing & Hunting | 31 (91.2%) | 3 (8.8%) |
| Mining, Quarrying, & Extraction | 0 (0.0%) | 0 (0.0%) |
| Construction | 1 (100.0%) | 0 (0.0%) |
| Manufacturing | 1 (100.0%) | 0 (0.0%) |
| Wholesale Trade | 8 (88.9%) | 1 (11.1%) |
| Retail Trade | 8 (50.0%) | 8 (50.0%) |
| Transportation & Warehousing | 3 (100.0%) | 0 (0.0%) |
| Utilities | 10 (100.0%) | 0 (0.0%) |
| Information | 0 (0.0%) | 0 (0.0%) |
| Finance & Insurance | 0 (0.0%) | 1 (100.0%) |
| Real Estate, Rental & Leasing | 0 (0.0%) | 1 (100.0%) |
| Professional & Scientific | 0 (0.0%) | 0 (0.0%) |
| Enterprise Management | 0 (0.0%) | 0 (0.0%) |
| Administrative & Support | 0 (0.0%) | 0 (0.0%) |
| Educational Services | 1 (6.2%) | 15 (93.8%) |
| Health Care & Social Assistance | 0 (0.0%) | 6 (100.0%) |
| Arts, Entertainment & Recreation | 0 (0.0%) | 0 (0.0%) |
| Accommodation & Food Services | 4 (50.0%) | 4 (50.0%) |
| Public Administration | 1 (50.0%) | 1 (50.0%) |
| Total | 68 (63.0%) | 40 (37.0%) |
Education in Drake
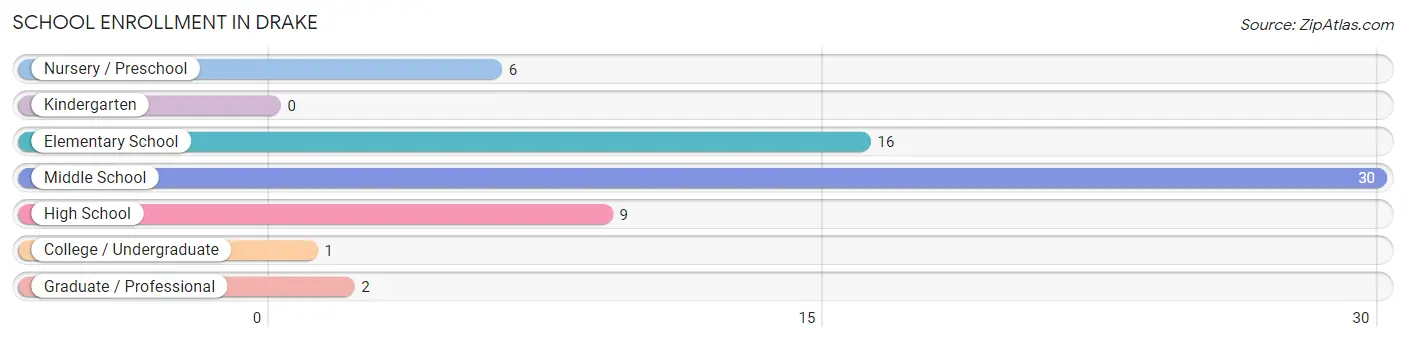
School Enrollment in Drake
The most common levels of schooling among the 64 students in Drake are middle school (30 | 46.9%), elementary school (16 | 25.0%), and high school (9 | 14.1%).
| School Level | # Students | % Students |
| Nursery / Preschool | 6 | 9.4% |
| Kindergarten | 0 | 0.0% |
| Elementary School | 16 | 25.0% |
| Middle School | 30 | 46.9% |
| High School | 9 | 14.1% |
| College / Undergraduate | 1 | 1.6% |
| Graduate / Professional | 2 | 3.1% |
| Total | 64 | 100.0% |
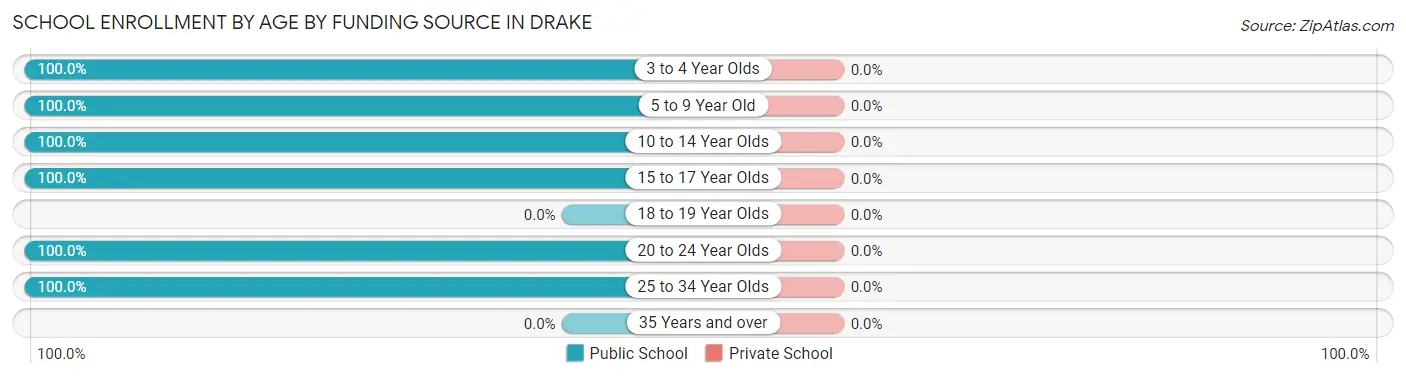
School Enrollment by Age by Funding Source in Drake
| Age Bracket | Public School | Private School |
| 3 to 4 Year Olds | 2 (100.0%) | 0 (0.0%) |
| 5 to 9 Year Old | 12 (100.0%) | 0 (0.0%) |
| 10 to 14 Year Olds | 38 (100.0%) | 0 (0.0%) |
| 15 to 17 Year Olds | 9 (100.0%) | 0 (0.0%) |
| 18 to 19 Year Olds | 0 (0.0%) | 0 (0.0%) |
| 20 to 24 Year Olds | 1 (100.0%) | 0 (0.0%) |
| 25 to 34 Year Olds | 2 (100.0%) | 0 (0.0%) |
| 35 Years and over | 0 (0.0%) | 0 (0.0%) |
| Total | 64 (100.0%) | 0 (0.0%) |
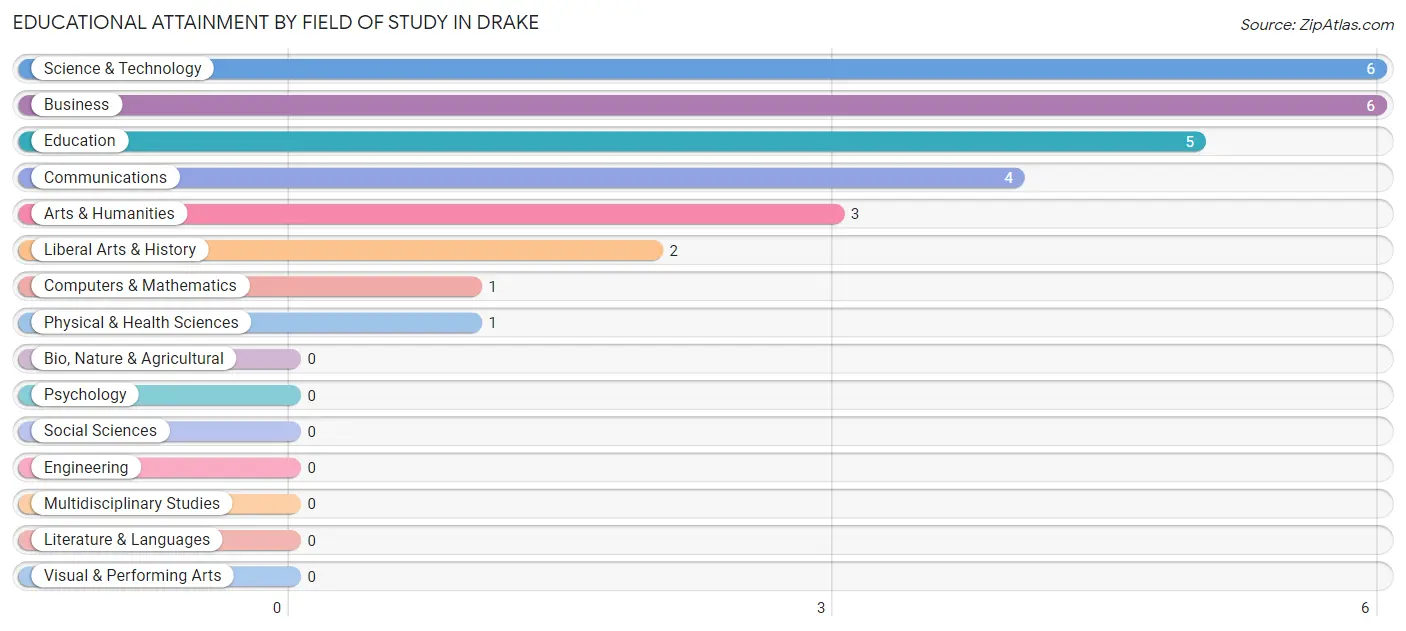
Educational Attainment by Field of Study in Drake
Science & technology (6 | 21.4%), business (6 | 21.4%), education (5 | 17.9%), communications (4 | 14.3%), and arts & humanities (3 | 10.7%) are the most common fields of study among 28 individuals in Drake who have obtained a bachelor's degree or higher.
| Field of Study | # Graduates | % Graduates |
| Computers & Mathematics | 1 | 3.6% |
| Bio, Nature & Agricultural | 0 | 0.0% |
| Physical & Health Sciences | 1 | 3.6% |
| Psychology | 0 | 0.0% |
| Social Sciences | 0 | 0.0% |
| Engineering | 0 | 0.0% |
| Multidisciplinary Studies | 0 | 0.0% |
| Science & Technology | 6 | 21.4% |
| Business | 6 | 21.4% |
| Education | 5 | 17.9% |
| Literature & Languages | 0 | 0.0% |
| Liberal Arts & History | 2 | 7.1% |
| Visual & Performing Arts | 0 | 0.0% |
| Communications | 4 | 14.3% |
| Arts & Humanities | 3 | 10.7% |
| Total | 28 | 100.0% |
Transportation & Commute in Drake
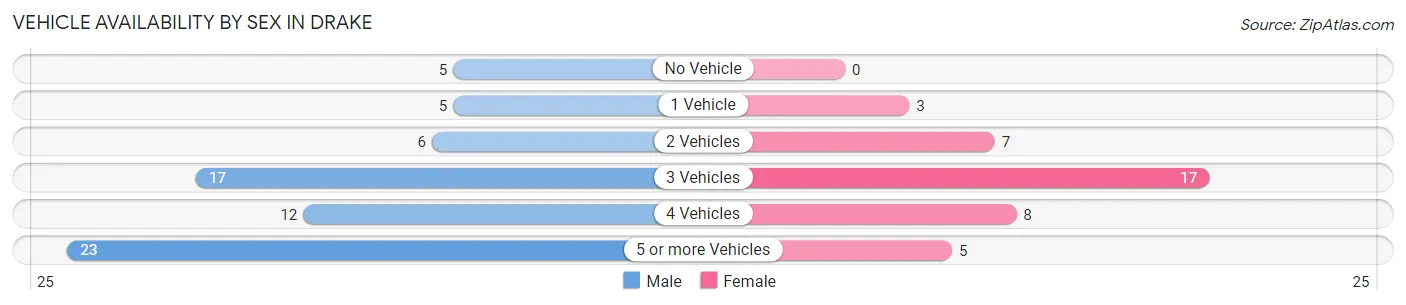
Vehicle Availability by Sex in Drake
The most prevalent vehicle ownership categories in Drake are males with 5 or more vehicles (23, accounting for 33.8%) and females with 5 or more vehicles (5, making up 57.5%).
| Vehicles Available | Male | Female |
| No Vehicle | 5 (7.3%) | 0 (0.0%) |
| 1 Vehicle | 5 (7.3%) | 3 (7.5%) |
| 2 Vehicles | 6 (8.8%) | 7 (17.5%) |
| 3 Vehicles | 17 (25.0%) | 17 (42.5%) |
| 4 Vehicles | 12 (17.6%) | 8 (20.0%) |
| 5 or more Vehicles | 23 (33.8%) | 5 (12.5%) |
| Total | 68 (100.0%) | 40 (100.0%) |
Commute Time in Drake
The most frequently occuring commute durations in Drake are 5 to 9 minutes (37 commuters, 37.4%), less than 5 minutes (28 commuters, 28.3%), and 10 to 14 minutes (10 commuters, 10.1%).
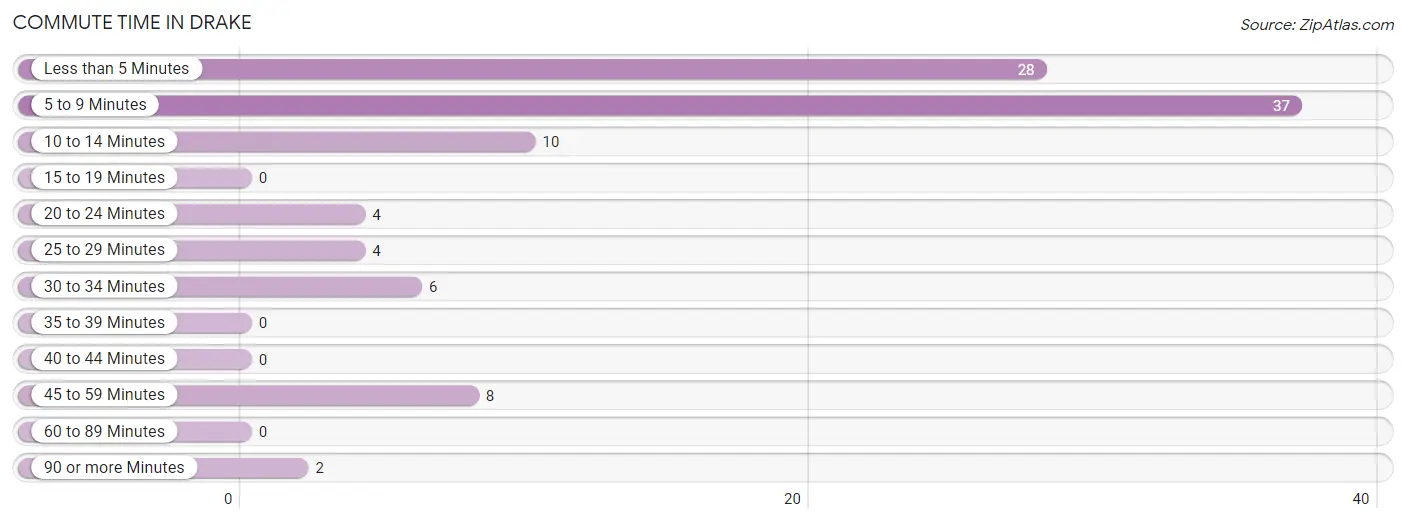
| Commute Time | # Commuters | % Commuters |
| Less than 5 Minutes | 28 | 28.3% |
| 5 to 9 Minutes | 37 | 37.4% |
| 10 to 14 Minutes | 10 | 10.1% |
| 15 to 19 Minutes | 0 | 0.0% |
| 20 to 24 Minutes | 4 | 4.0% |
| 25 to 29 Minutes | 4 | 4.0% |
| 30 to 34 Minutes | 6 | 6.1% |
| 35 to 39 Minutes | 0 | 0.0% |
| 40 to 44 Minutes | 0 | 0.0% |
| 45 to 59 Minutes | 8 | 8.1% |
| 60 to 89 Minutes | 0 | 0.0% |
| 90 or more Minutes | 2 | 2.0% |
Commute Time by Sex in Drake
The most common commute times in Drake are 5 to 9 minutes (30 commuters, 46.9%) for males and less than 5 minutes (14 commuters, 40.0%) for females.
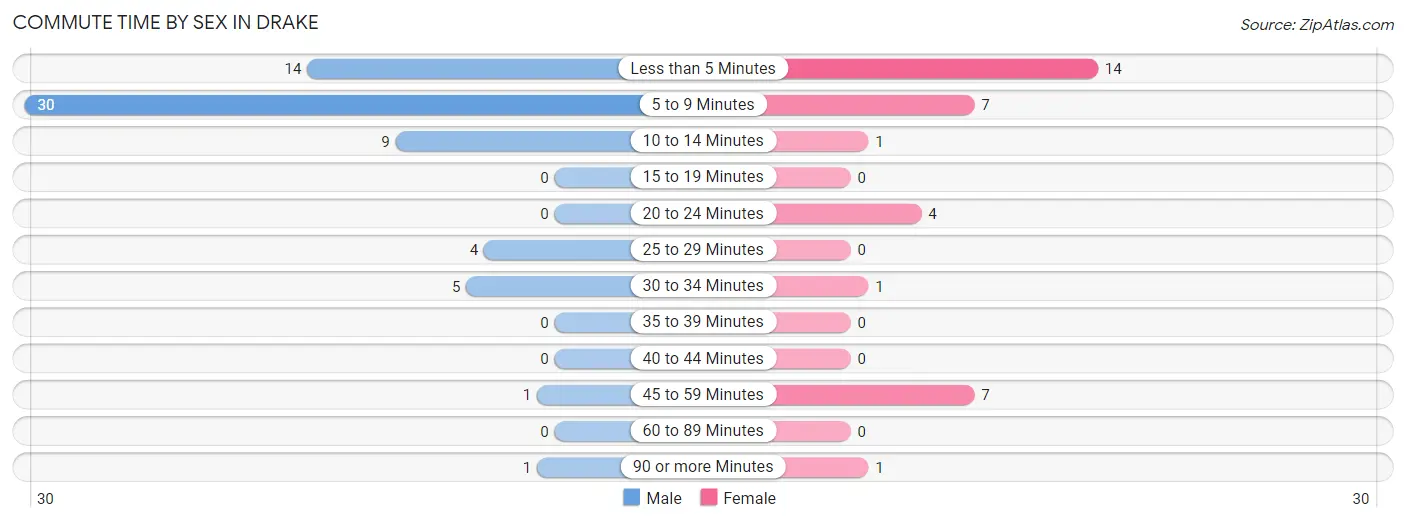
| Commute Time | Male | Female |
| Less than 5 Minutes | 14 (21.9%) | 14 (40.0%) |
| 5 to 9 Minutes | 30 (46.9%) | 7 (20.0%) |
| 10 to 14 Minutes | 9 (14.1%) | 1 (2.9%) |
| 15 to 19 Minutes | 0 (0.0%) | 0 (0.0%) |
| 20 to 24 Minutes | 0 (0.0%) | 4 (11.4%) |
| 25 to 29 Minutes | 4 (6.2%) | 0 (0.0%) |
| 30 to 34 Minutes | 5 (7.8%) | 1 (2.9%) |
| 35 to 39 Minutes | 0 (0.0%) | 0 (0.0%) |
| 40 to 44 Minutes | 0 (0.0%) | 0 (0.0%) |
| 45 to 59 Minutes | 1 (1.6%) | 7 (20.0%) |
| 60 to 89 Minutes | 0 (0.0%) | 0 (0.0%) |
| 90 or more Minutes | 1 (1.6%) | 1 (2.9%) |
Time of Departure to Work by Sex in Drake
The most frequent times of departure to work in Drake are 7:30 AM to 7:59 AM (19, 29.7%) for males and 7:00 AM to 7:29 AM (10, 28.6%) for females.
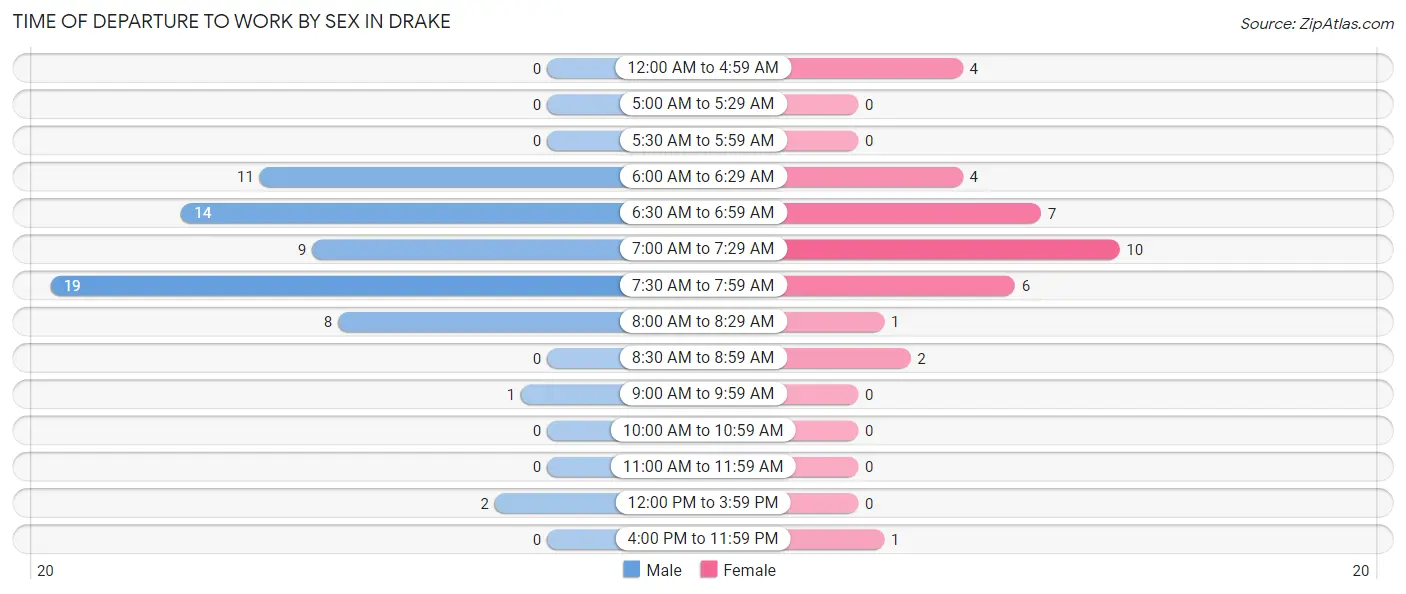
| Time of Departure | Male | Female |
| 12:00 AM to 4:59 AM | 0 (0.0%) | 4 (11.4%) |
| 5:00 AM to 5:29 AM | 0 (0.0%) | 0 (0.0%) |
| 5:30 AM to 5:59 AM | 0 (0.0%) | 0 (0.0%) |
| 6:00 AM to 6:29 AM | 11 (17.2%) | 4 (11.4%) |
| 6:30 AM to 6:59 AM | 14 (21.9%) | 7 (20.0%) |
| 7:00 AM to 7:29 AM | 9 (14.1%) | 10 (28.6%) |
| 7:30 AM to 7:59 AM | 19 (29.7%) | 6 (17.1%) |
| 8:00 AM to 8:29 AM | 8 (12.5%) | 1 (2.9%) |
| 8:30 AM to 8:59 AM | 0 (0.0%) | 2 (5.7%) |
| 9:00 AM to 9:59 AM | 1 (1.6%) | 0 (0.0%) |
| 10:00 AM to 10:59 AM | 0 (0.0%) | 0 (0.0%) |
| 11:00 AM to 11:59 AM | 0 (0.0%) | 0 (0.0%) |
| 12:00 PM to 3:59 PM | 2 (3.1%) | 0 (0.0%) |
| 4:00 PM to 11:59 PM | 0 (0.0%) | 1 (2.9%) |
| Total | 64 (100.0%) | 35 (100.0%) |
Housing Occupancy in Drake
Occupancy by Ownership in Drake
Of the total 141 dwellings in Drake, owner-occupied units account for 116 (82.3%), while renter-occupied units make up 25 (17.7%).
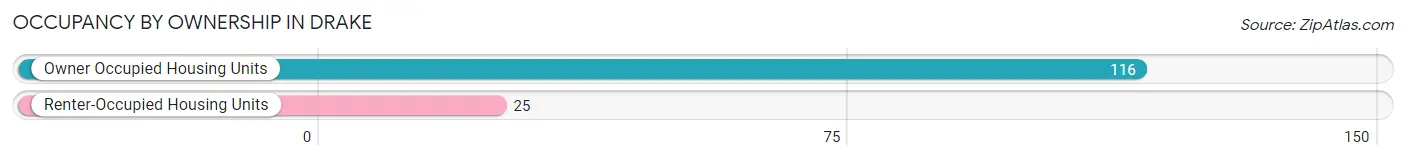
| Occupancy | # Housing Units | % Housing Units |
| Owner Occupied Housing Units | 116 | 82.3% |
| Renter-Occupied Housing Units | 25 | 17.7% |
| Total Occupied Housing Units | 141 | 100.0% |
Occupancy by Household Size in Drake
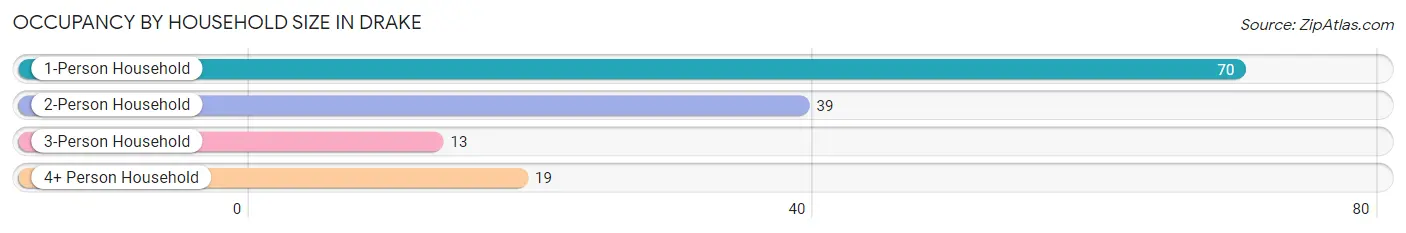
| Household Size | # Housing Units | % Housing Units |
| 1-Person Household | 70 | 49.6% |
| 2-Person Household | 39 | 27.7% |
| 3-Person Household | 13 | 9.2% |
| 4+ Person Household | 19 | 13.5% |
| Total Housing Units | 141 | 100.0% |
Occupancy by Ownership by Household Size in Drake
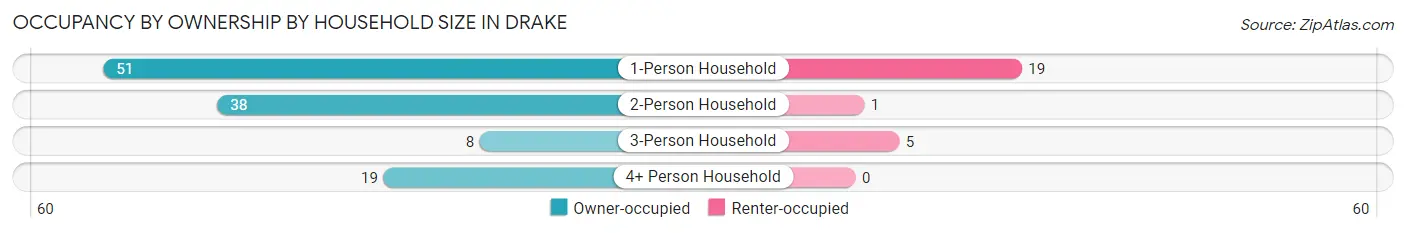
| Household Size | Owner-occupied | Renter-occupied |
| 1-Person Household | 51 (72.9%) | 19 (27.1%) |
| 2-Person Household | 38 (97.4%) | 1 (2.6%) |
| 3-Person Household | 8 (61.5%) | 5 (38.5%) |
| 4+ Person Household | 19 (100.0%) | 0 (0.0%) |
| Total Housing Units | 116 (82.3%) | 25 (17.7%) |
Occupancy by Educational Attainment in Drake
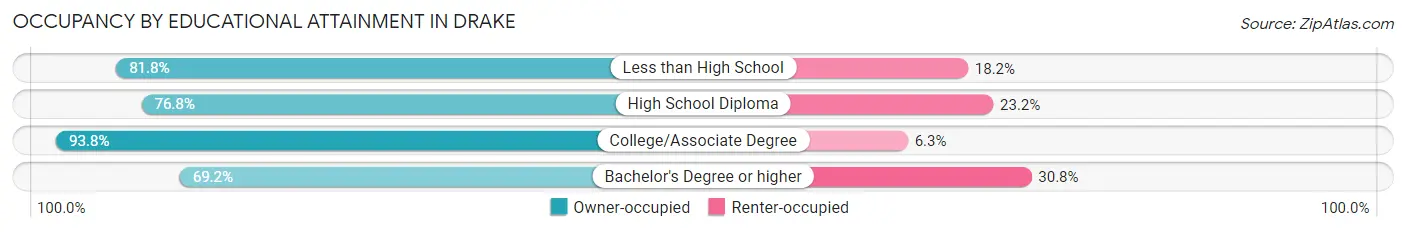
| Household Size | Owner-occupied | Renter-occupied |
| Less than High School | 9 (81.8%) | 2 (18.2%) |
| High School Diploma | 53 (76.8%) | 16 (23.2%) |
| College/Associate Degree | 45 (93.8%) | 3 (6.2%) |
| Bachelor's Degree or higher | 9 (69.2%) | 4 (30.8%) |
Occupancy by Age of Householder in Drake
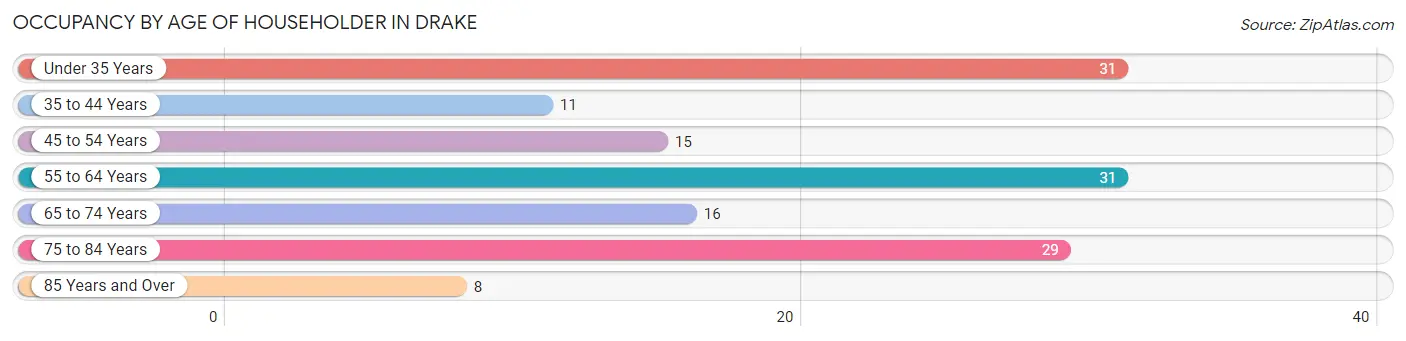
| Age Bracket | # Households | % Households |
| Under 35 Years | 31 | 22.0% |
| 35 to 44 Years | 11 | 7.8% |
| 45 to 54 Years | 15 | 10.6% |
| 55 to 64 Years | 31 | 22.0% |
| 65 to 74 Years | 16 | 11.4% |
| 75 to 84 Years | 29 | 20.6% |
| 85 Years and Over | 8 | 5.7% |
| Total | 141 | 100.0% |
Housing Finances in Drake
Median Income by Occupancy in Drake
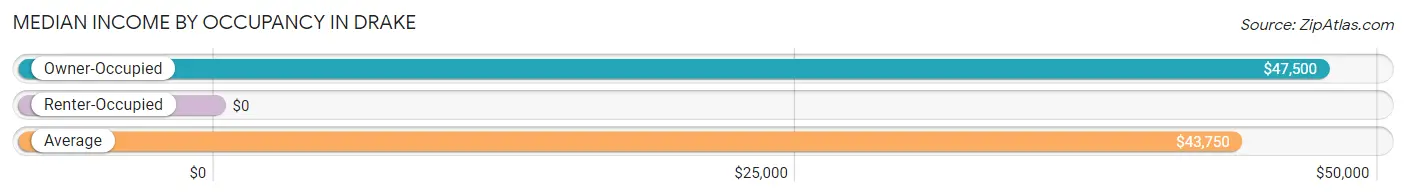
| Occupancy Type | # Households | Median Income |
| Owner-Occupied | 116 (82.3%) | $47,500 |
| Renter-Occupied | 25 (17.7%) | $0 |
| Average | 141 (100.0%) | $43,750 |
Occupancy by Householder Income Bracket in Drake
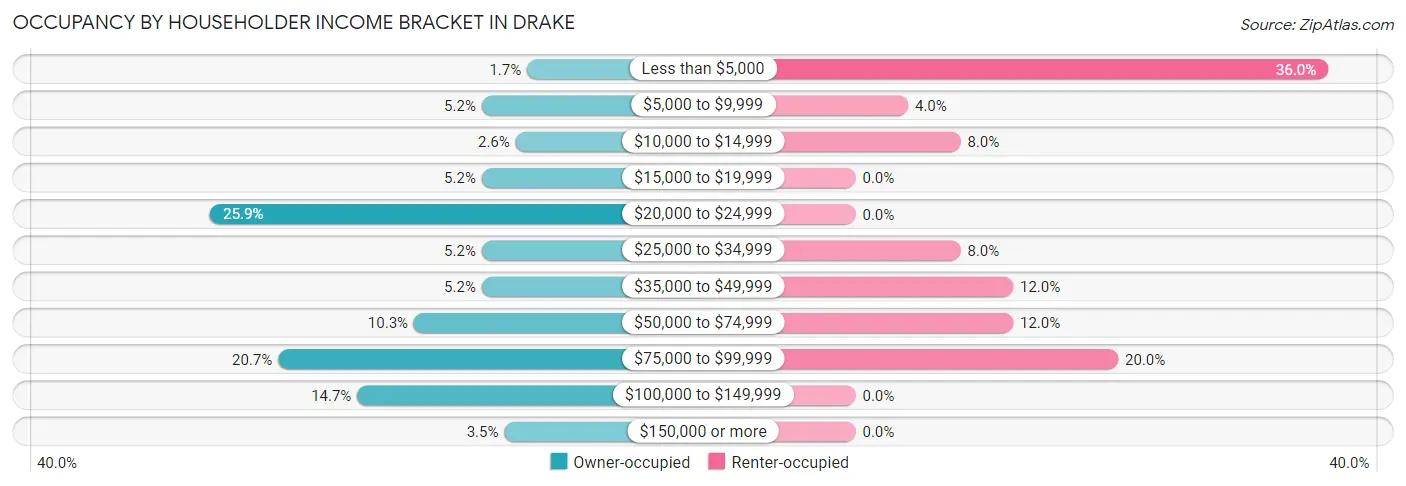
| Income Bracket | Owner-occupied | Renter-occupied |
| Less than $5,000 | 2 (1.7%) | 9 (36.0%) |
| $5,000 to $9,999 | 6 (5.2%) | 1 (4.0%) |
| $10,000 to $14,999 | 3 (2.6%) | 2 (8.0%) |
| $15,000 to $19,999 | 6 (5.2%) | 0 (0.0%) |
| $20,000 to $24,999 | 30 (25.9%) | 0 (0.0%) |
| $25,000 to $34,999 | 6 (5.2%) | 2 (8.0%) |
| $35,000 to $49,999 | 6 (5.2%) | 3 (12.0%) |
| $50,000 to $74,999 | 12 (10.3%) | 3 (12.0%) |
| $75,000 to $99,999 | 24 (20.7%) | 5 (20.0%) |
| $100,000 to $149,999 | 17 (14.7%) | 0 (0.0%) |
| $150,000 or more | 4 (3.5%) | 0 (0.0%) |
| Total | 116 (100.0%) | 25 (100.0%) |
Monthly Housing Cost Tiers in Drake
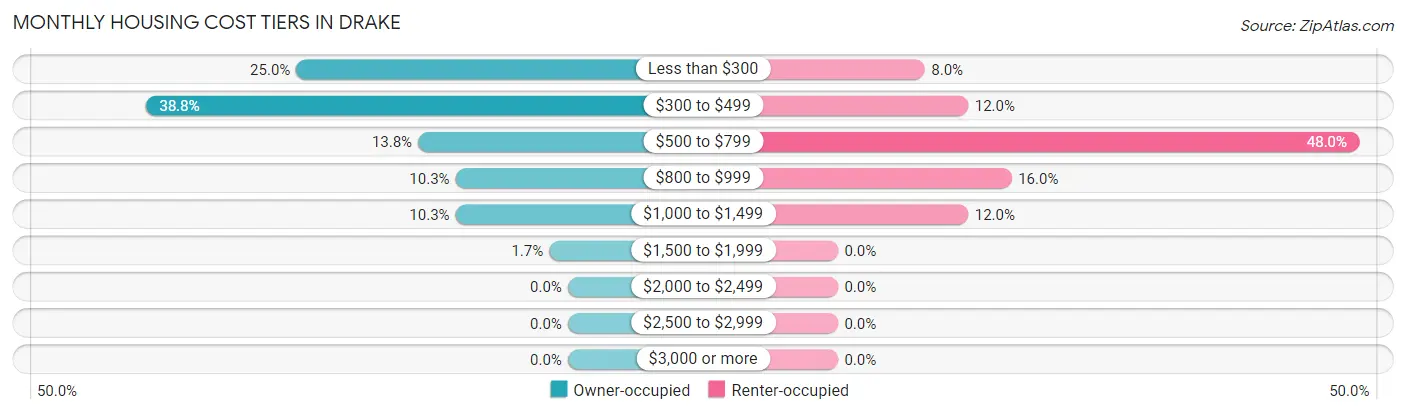
| Monthly Cost | Owner-occupied | Renter-occupied |
| Less than $300 | 29 (25.0%) | 2 (8.0%) |
| $300 to $499 | 45 (38.8%) | 3 (12.0%) |
| $500 to $799 | 16 (13.8%) | 12 (48.0%) |
| $800 to $999 | 12 (10.3%) | 4 (16.0%) |
| $1,000 to $1,499 | 12 (10.3%) | 3 (12.0%) |
| $1,500 to $1,999 | 2 (1.7%) | 0 (0.0%) |
| $2,000 to $2,499 | 0 (0.0%) | 0 (0.0%) |
| $2,500 to $2,999 | 0 (0.0%) | 0 (0.0%) |
| $3,000 or more | 0 (0.0%) | 0 (0.0%) |
| Total | 116 (100.0%) | 25 (100.0%) |
Physical Housing Characteristics in Drake
Housing Structures in Drake
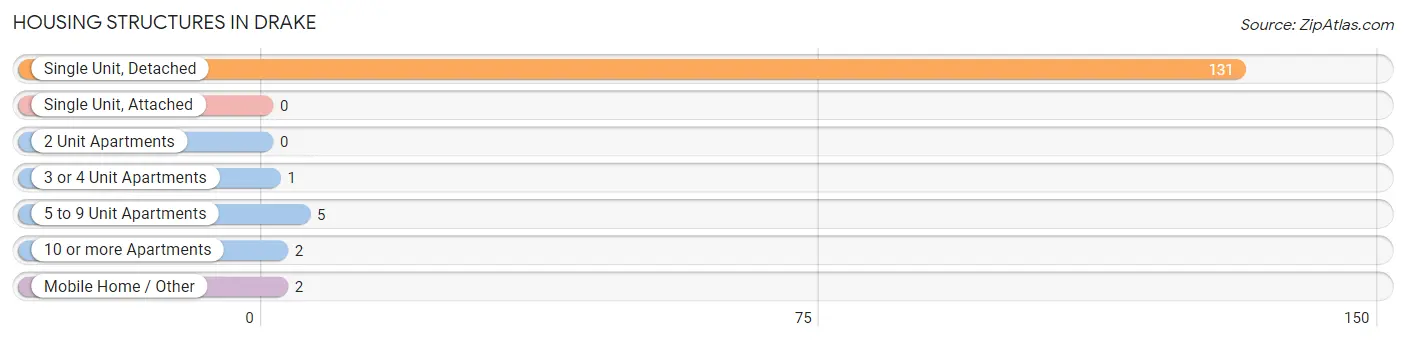
| Structure Type | # Housing Units | % Housing Units |
| Single Unit, Detached | 131 | 92.9% |
| Single Unit, Attached | 0 | 0.0% |
| 2 Unit Apartments | 0 | 0.0% |
| 3 or 4 Unit Apartments | 1 | 0.7% |
| 5 to 9 Unit Apartments | 5 | 3.5% |
| 10 or more Apartments | 2 | 1.4% |
| Mobile Home / Other | 2 | 1.4% |
| Total | 141 | 100.0% |
Housing Structures by Occupancy in Drake
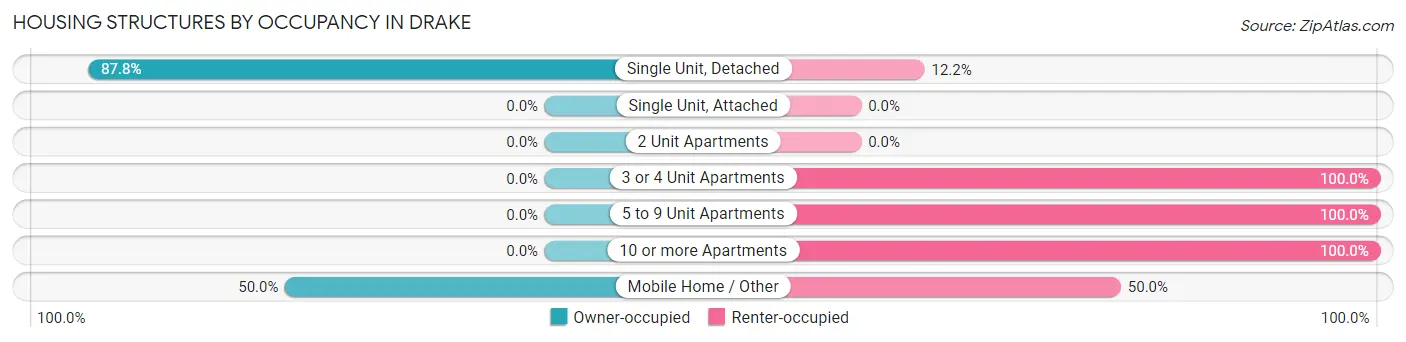
| Structure Type | Owner-occupied | Renter-occupied |
| Single Unit, Detached | 115 (87.8%) | 16 (12.2%) |
| Single Unit, Attached | 0 (0.0%) | 0 (0.0%) |
| 2 Unit Apartments | 0 (0.0%) | 0 (0.0%) |
| 3 or 4 Unit Apartments | 0 (0.0%) | 1 (100.0%) |
| 5 to 9 Unit Apartments | 0 (0.0%) | 5 (100.0%) |
| 10 or more Apartments | 0 (0.0%) | 2 (100.0%) |
| Mobile Home / Other | 1 (50.0%) | 1 (50.0%) |
| Total | 116 (82.3%) | 25 (17.7%) |
Housing Structures by Number of Rooms in Drake
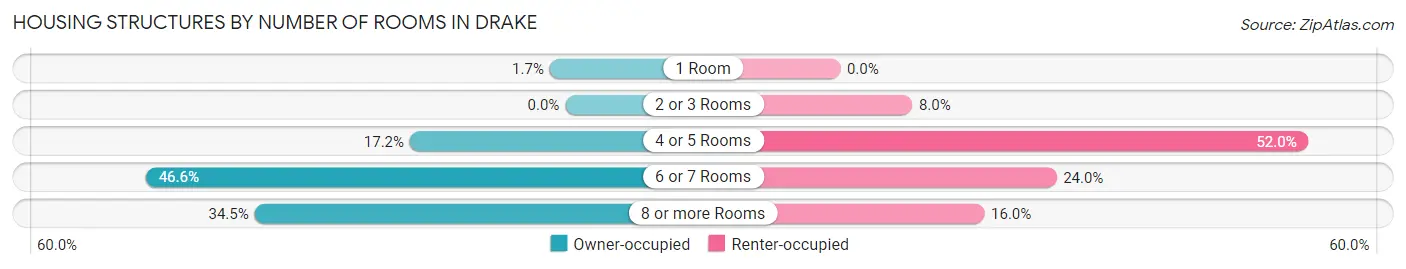
| Number of Rooms | Owner-occupied | Renter-occupied |
| 1 Room | 2 (1.7%) | 0 (0.0%) |
| 2 or 3 Rooms | 0 (0.0%) | 2 (8.0%) |
| 4 or 5 Rooms | 20 (17.2%) | 13 (52.0%) |
| 6 or 7 Rooms | 54 (46.6%) | 6 (24.0%) |
| 8 or more Rooms | 40 (34.5%) | 4 (16.0%) |
| Total | 116 (100.0%) | 25 (100.0%) |
Housing Structure by Heating Type in Drake
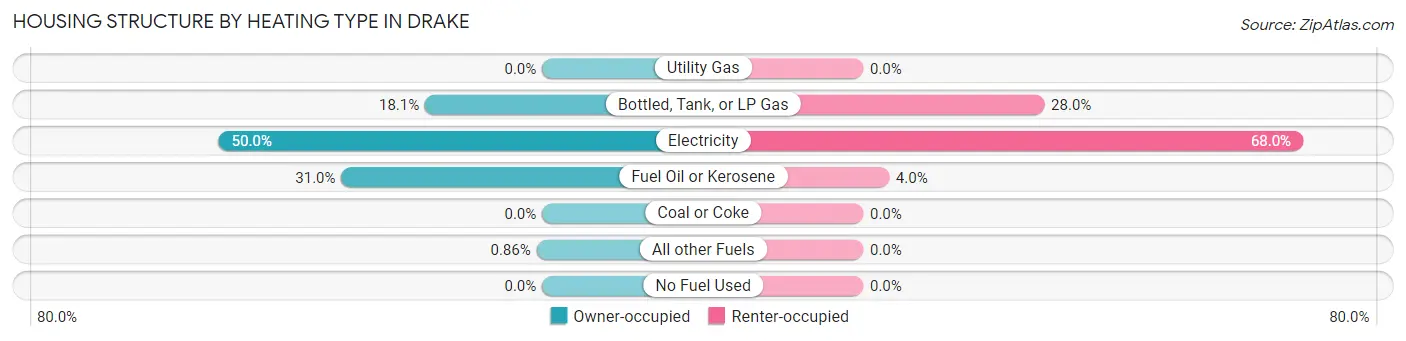
| Heating Type | Owner-occupied | Renter-occupied |
| Utility Gas | 0 (0.0%) | 0 (0.0%) |
| Bottled, Tank, or LP Gas | 21 (18.1%) | 7 (28.0%) |
| Electricity | 58 (50.0%) | 17 (68.0%) |
| Fuel Oil or Kerosene | 36 (31.0%) | 1 (4.0%) |
| Coal or Coke | 0 (0.0%) | 0 (0.0%) |
| All other Fuels | 1 (0.9%) | 0 (0.0%) |
| No Fuel Used | 0 (0.0%) | 0 (0.0%) |
| Total | 116 (100.0%) | 25 (100.0%) |
Household Vehicle Usage in Drake
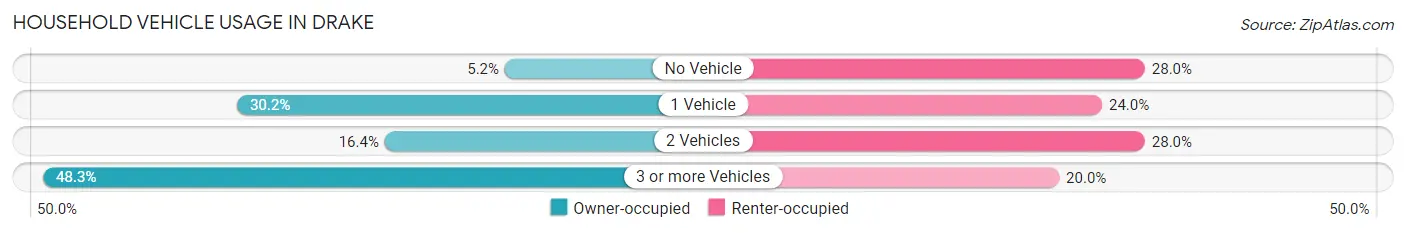
| Vehicles per Household | Owner-occupied | Renter-occupied |
| No Vehicle | 6 (5.2%) | 7 (28.0%) |
| 1 Vehicle | 35 (30.2%) | 6 (24.0%) |
| 2 Vehicles | 19 (16.4%) | 7 (28.0%) |
| 3 or more Vehicles | 56 (48.3%) | 5 (20.0%) |
| Total | 116 (100.0%) | 25 (100.0%) |
Real Estate & Mortgages in Drake
Real Estate and Mortgage Overview in Drake
| Characteristic | Without Mortgage | With Mortgage |
| Housing Units | 90 | 26 |
| Median Property Value | $66,500 | $85,000 |
| Median Household Income | - | - |
| Monthly Housing Costs | $342 | $0 |
| Real Estate Taxes | $395 | $0 |
Property Value by Mortgage Status in Drake
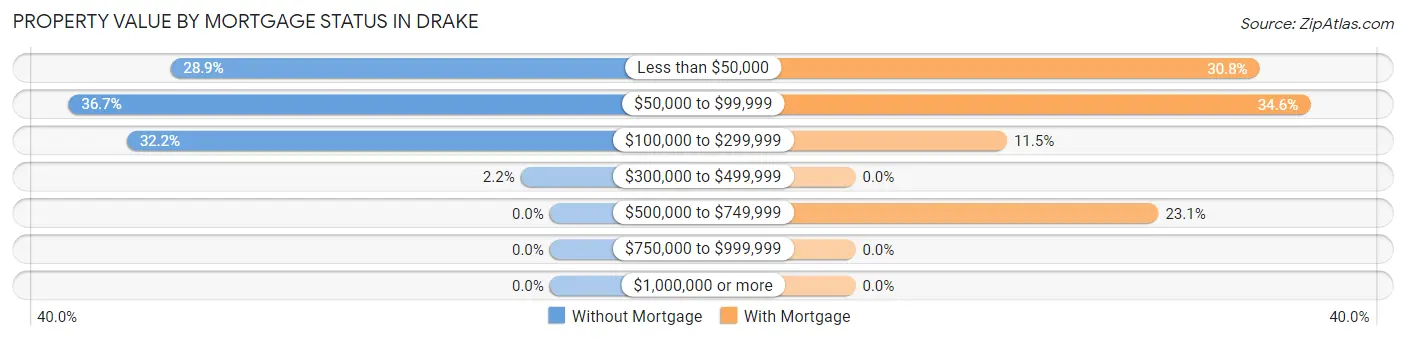
| Property Value | Without Mortgage | With Mortgage |
| Less than $50,000 | 26 (28.9%) | 8 (30.8%) |
| $50,000 to $99,999 | 33 (36.7%) | 9 (34.6%) |
| $100,000 to $299,999 | 29 (32.2%) | 3 (11.5%) |
| $300,000 to $499,999 | 2 (2.2%) | 0 (0.0%) |
| $500,000 to $749,999 | 0 (0.0%) | 6 (23.1%) |
| $750,000 to $999,999 | 0 (0.0%) | 0 (0.0%) |
| $1,000,000 or more | 0 (0.0%) | 0 (0.0%) |
| Total | 90 (100.0%) | 26 (100.0%) |
Household Income by Mortgage Status in Drake
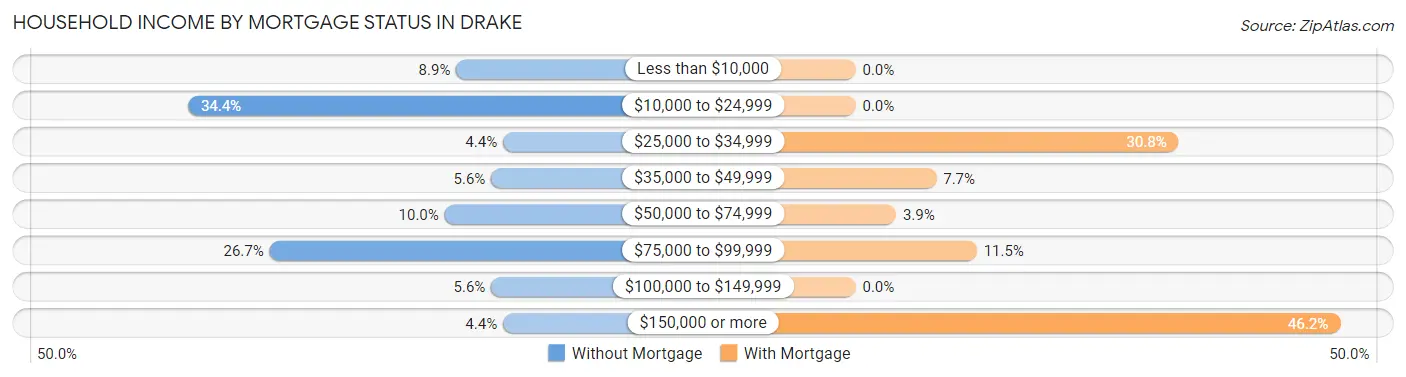
| Household Income | Without Mortgage | With Mortgage |
| Less than $10,000 | 8 (8.9%) | 0 (0.0%) |
| $10,000 to $24,999 | 31 (34.4%) | 0 (0.0%) |
| $25,000 to $34,999 | 4 (4.4%) | 8 (30.8%) |
| $35,000 to $49,999 | 5 (5.6%) | 2 (7.7%) |
| $50,000 to $74,999 | 9 (10.0%) | 1 (3.8%) |
| $75,000 to $99,999 | 24 (26.7%) | 3 (11.5%) |
| $100,000 to $149,999 | 5 (5.6%) | 0 (0.0%) |
| $150,000 or more | 4 (4.4%) | 12 (46.2%) |
| Total | 90 (100.0%) | 26 (100.0%) |
Property Value to Household Income Ratio in Drake
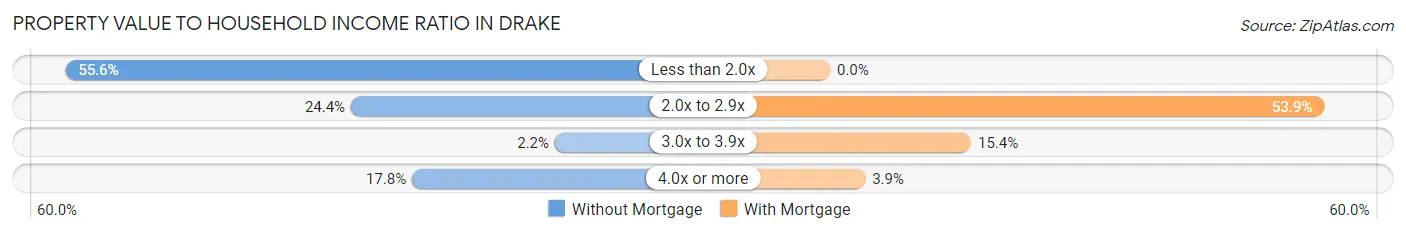
| Value-to-Income Ratio | Without Mortgage | With Mortgage |
| Less than 2.0x | 50 (55.6%) | 0 (0.0%) |
| 2.0x to 2.9x | 22 (24.4%) | 14 (53.8%) |
| 3.0x to 3.9x | 2 (2.2%) | 4 (15.4%) |
| 4.0x or more | 16 (17.8%) | 1 (3.8%) |
| Total | 90 (100.0%) | 26 (100.0%) |
Real Estate Taxes by Mortgage Status in Drake
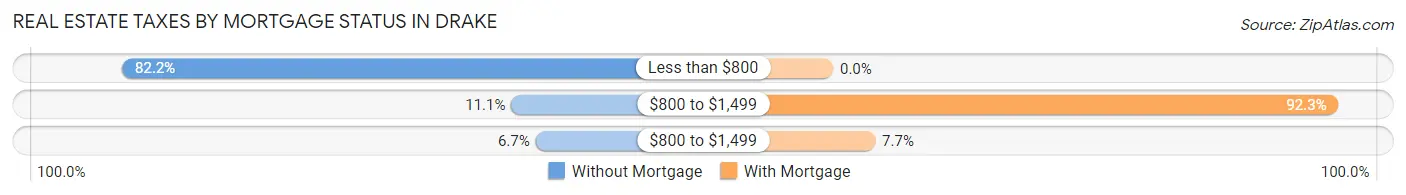
| Property Taxes | Without Mortgage | With Mortgage |
| Less than $800 | 74 (82.2%) | 0 (0.0%) |
| $800 to $1,499 | 10 (11.1%) | 24 (92.3%) |
| $800 to $1,499 | 6 (6.7%) | 2 (7.7%) |
| Total | 90 (100.0%) | 26 (100.0%) |
Health & Disability in Drake
Health Insurance Coverage by Age in Drake
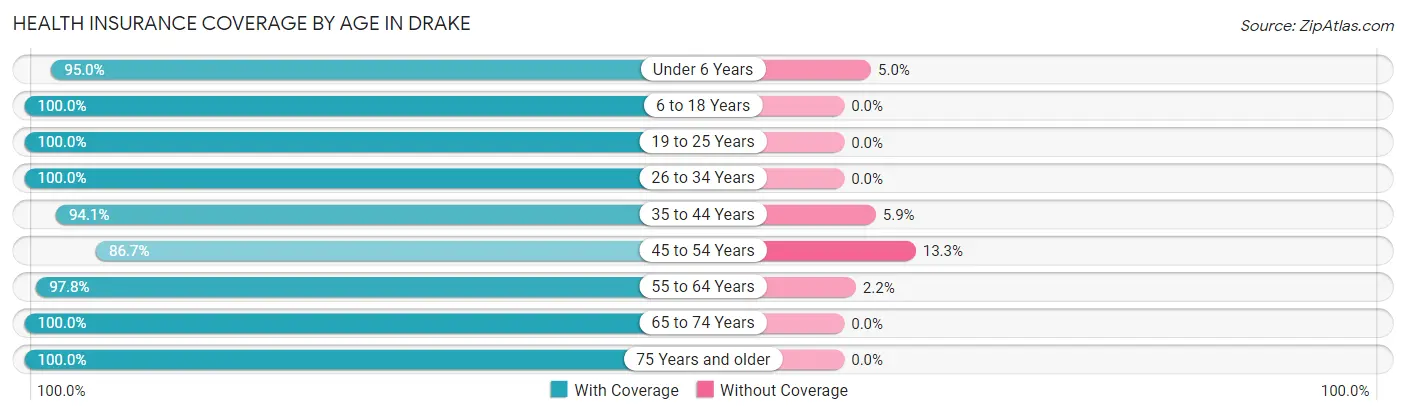
| Age Bracket | With Coverage | Without Coverage |
| Under 6 Years | 19 (95.0%) | 1 (5.0%) |
| 6 to 18 Years | 60 (100.0%) | 0 (0.0%) |
| 19 to 25 Years | 17 (100.0%) | 0 (0.0%) |
| 26 to 34 Years | 42 (100.0%) | 0 (0.0%) |
| 35 to 44 Years | 32 (94.1%) | 2 (5.9%) |
| 45 to 54 Years | 13 (86.7%) | 2 (13.3%) |
| 55 to 64 Years | 45 (97.8%) | 1 (2.2%) |
| 65 to 74 Years | 22 (100.0%) | 0 (0.0%) |
| 75 Years and older | 41 (100.0%) | 0 (0.0%) |
| Total | 291 (98.0%) | 6 (2.0%) |
Health Insurance Coverage by Citizenship Status in Drake
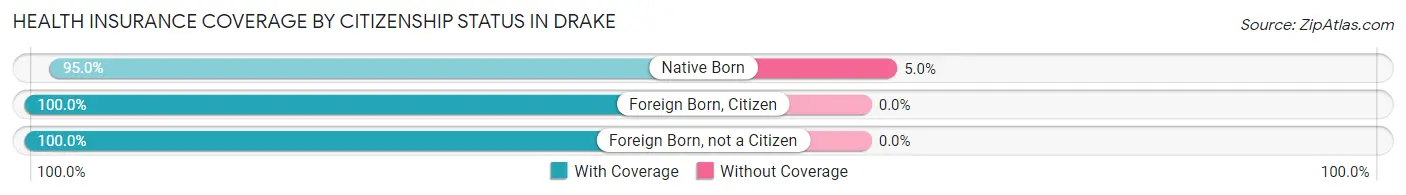
| Citizenship Status | With Coverage | Without Coverage |
| Native Born | 19 (95.0%) | 1 (5.0%) |
| Foreign Born, Citizen | 60 (100.0%) | 0 (0.0%) |
| Foreign Born, not a Citizen | 17 (100.0%) | 0 (0.0%) |
Health Insurance Coverage by Household Income in Drake
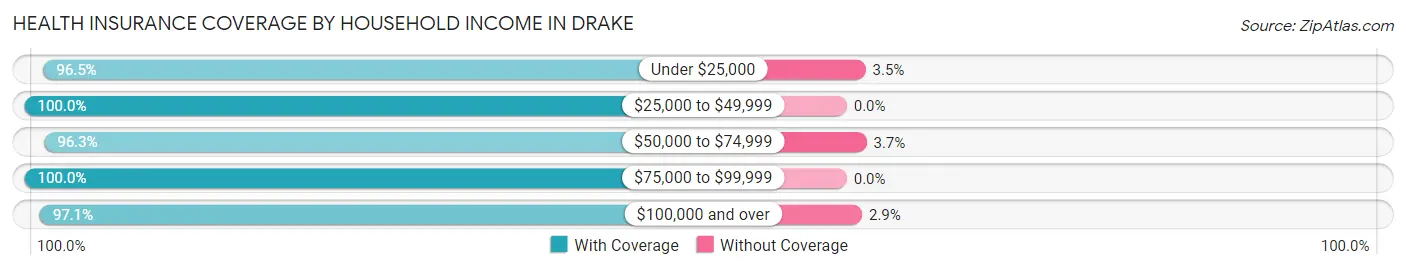
| Household Income | With Coverage | Without Coverage |
| Under $25,000 | 82 (96.5%) | 3 (3.5%) |
| $25,000 to $49,999 | 33 (100.0%) | 0 (0.0%) |
| $50,000 to $74,999 | 26 (96.3%) | 1 (3.7%) |
| $75,000 to $99,999 | 82 (100.0%) | 0 (0.0%) |
| $100,000 and over | 68 (97.1%) | 2 (2.9%) |
Public vs Private Health Insurance Coverage by Age in Drake
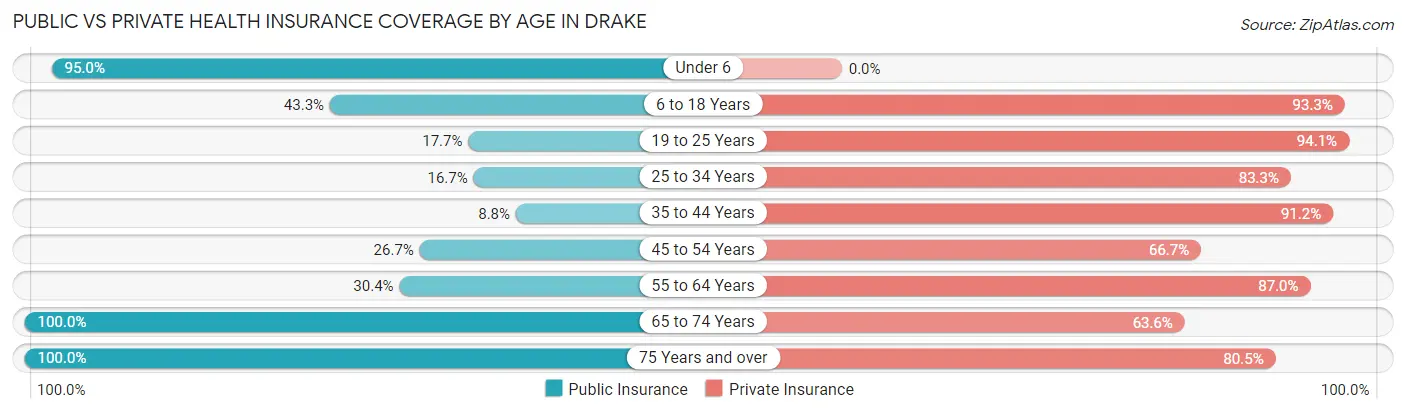
| Age Bracket | Public Insurance | Private Insurance |
| Under 6 | 19 (95.0%) | 0 (0.0%) |
| 6 to 18 Years | 26 (43.3%) | 56 (93.3%) |
| 19 to 25 Years | 3 (17.6%) | 16 (94.1%) |
| 25 to 34 Years | 7 (16.7%) | 35 (83.3%) |
| 35 to 44 Years | 3 (8.8%) | 31 (91.2%) |
| 45 to 54 Years | 4 (26.7%) | 10 (66.7%) |
| 55 to 64 Years | 14 (30.4%) | 40 (87.0%) |
| 65 to 74 Years | 22 (100.0%) | 14 (63.6%) |
| 75 Years and over | 41 (100.0%) | 33 (80.5%) |
| Total | 139 (46.8%) | 235 (79.1%) |
Disability Status by Sex by Age in Drake
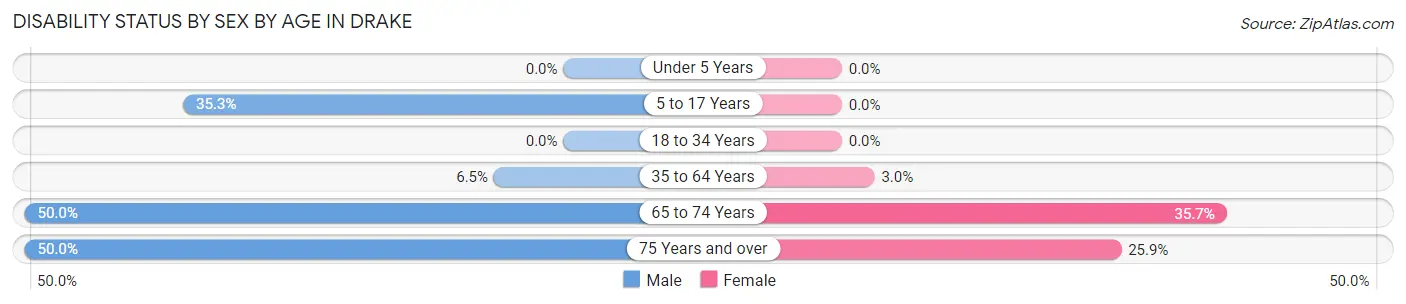
| Age Bracket | Male | Female |
| Under 5 Years | 0 (0.0%) | 0 (0.0%) |
| 5 to 17 Years | 12 (35.3%) | 0 (0.0%) |
| 18 to 34 Years | 0 (0.0%) | 0 (0.0%) |
| 35 to 64 Years | 4 (6.5%) | 1 (3.0%) |
| 65 to 74 Years | 4 (50.0%) | 5 (35.7%) |
| 75 Years and over | 7 (50.0%) | 7 (25.9%) |
Disability Class by Sex by Age in Drake
Disability Class: Hearing Difficulty
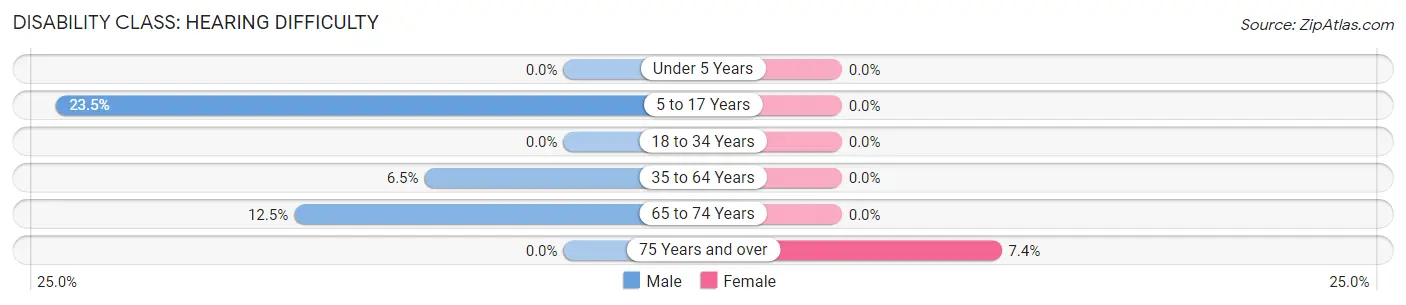
| Age Bracket | Male | Female |
| Under 5 Years | 0 (0.0%) | 0 (0.0%) |
| 5 to 17 Years | 8 (23.5%) | 0 (0.0%) |
| 18 to 34 Years | 0 (0.0%) | 0 (0.0%) |
| 35 to 64 Years | 4 (6.5%) | 0 (0.0%) |
| 65 to 74 Years | 1 (12.5%) | 0 (0.0%) |
| 75 Years and over | 0 (0.0%) | 2 (7.4%) |
Disability Class: Vision Difficulty
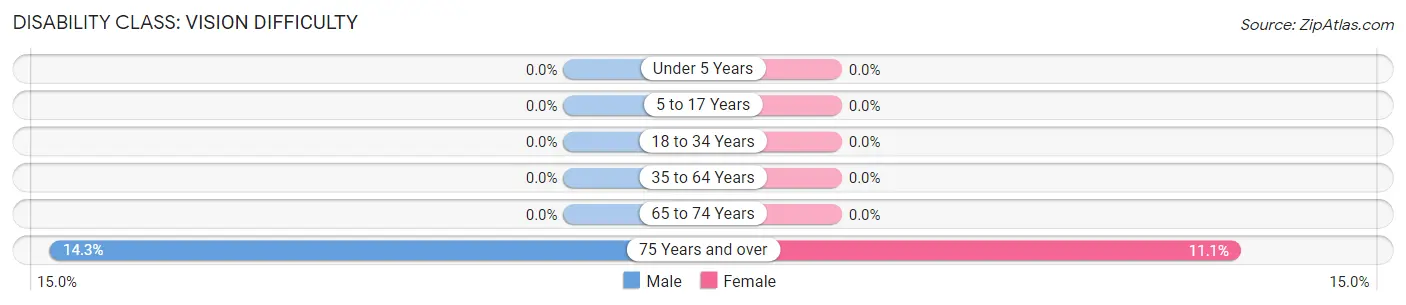
| Age Bracket | Male | Female |
| Under 5 Years | 0 (0.0%) | 0 (0.0%) |
| 5 to 17 Years | 0 (0.0%) | 0 (0.0%) |
| 18 to 34 Years | 0 (0.0%) | 0 (0.0%) |
| 35 to 64 Years | 0 (0.0%) | 0 (0.0%) |
| 65 to 74 Years | 0 (0.0%) | 0 (0.0%) |
| 75 Years and over | 2 (14.3%) | 3 (11.1%) |
Disability Class: Cognitive Difficulty
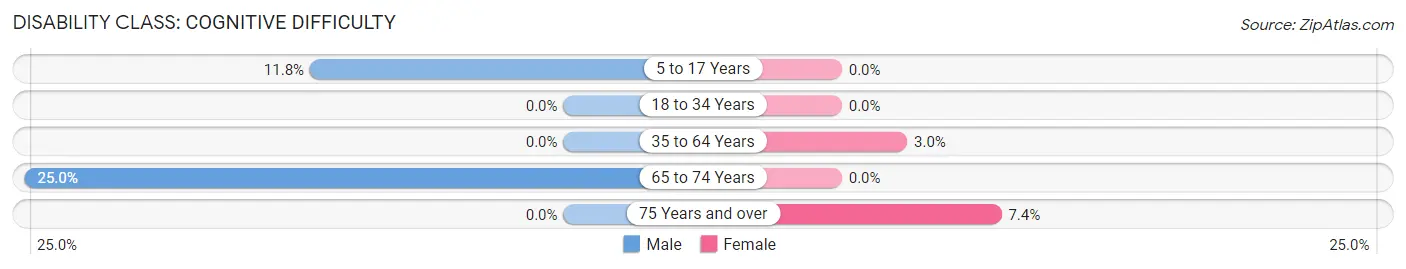
| Age Bracket | Male | Female |
| 5 to 17 Years | 4 (11.8%) | 0 (0.0%) |
| 18 to 34 Years | 0 (0.0%) | 0 (0.0%) |
| 35 to 64 Years | 0 (0.0%) | 1 (3.0%) |
| 65 to 74 Years | 2 (25.0%) | 0 (0.0%) |
| 75 Years and over | 0 (0.0%) | 2 (7.4%) |
Disability Class: Ambulatory Difficulty
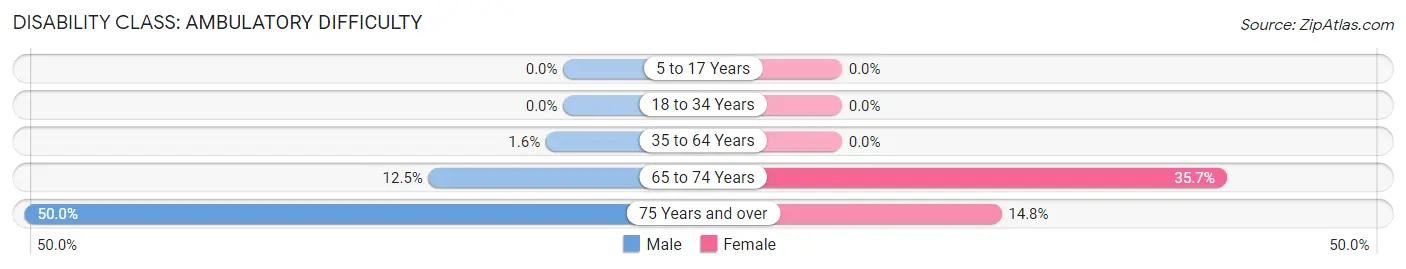
| Age Bracket | Male | Female |
| 5 to 17 Years | 0 (0.0%) | 0 (0.0%) |
| 18 to 34 Years | 0 (0.0%) | 0 (0.0%) |
| 35 to 64 Years | 1 (1.6%) | 0 (0.0%) |
| 65 to 74 Years | 1 (12.5%) | 5 (35.7%) |
| 75 Years and over | 7 (50.0%) | 4 (14.8%) |
Disability Class: Self-Care Difficulty
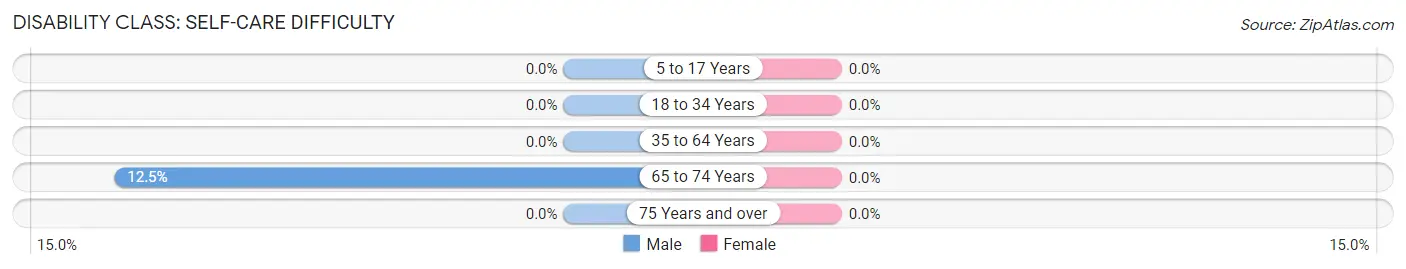
| Age Bracket | Male | Female |
| 5 to 17 Years | 0 (0.0%) | 0 (0.0%) |
| 18 to 34 Years | 0 (0.0%) | 0 (0.0%) |
| 35 to 64 Years | 0 (0.0%) | 0 (0.0%) |
| 65 to 74 Years | 1 (12.5%) | 0 (0.0%) |
| 75 Years and over | 0 (0.0%) | 0 (0.0%) |
Technology Access in Drake
Computing Device Access in Drake
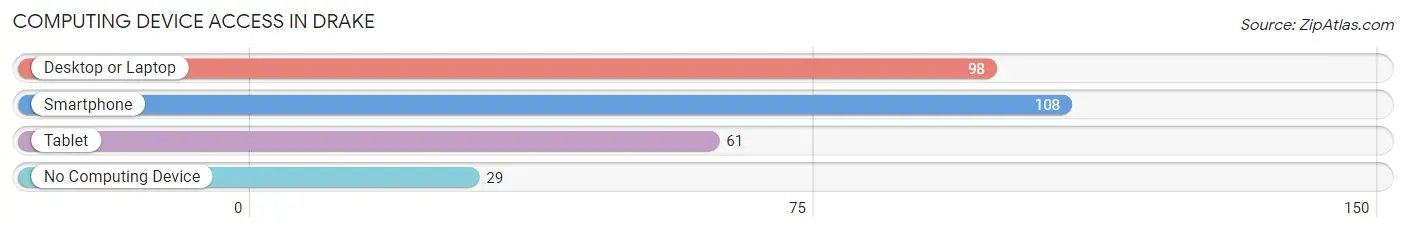
| Device Type | # Households | % Households |
| Desktop or Laptop | 98 | 69.5% |
| Smartphone | 108 | 76.6% |
| Tablet | 61 | 43.3% |
| No Computing Device | 29 | 20.6% |
| Total | 141 | 100.0% |
Internet Access in Drake
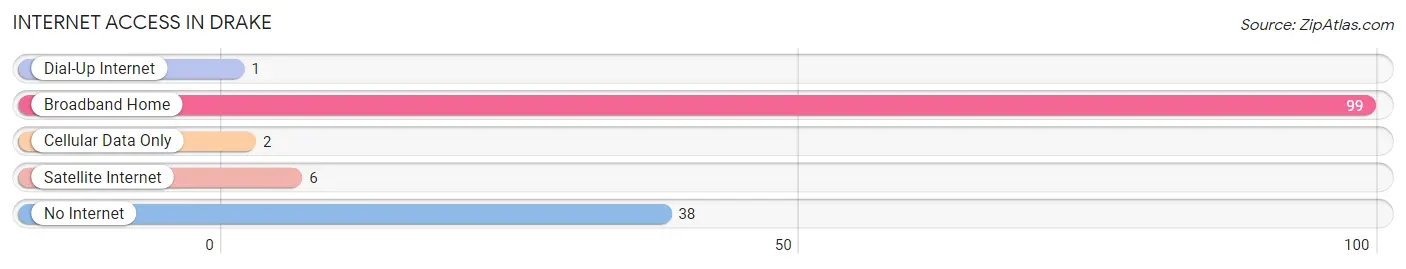
| Internet Type | # Households | % Households |
| Dial-Up Internet | 1 | 0.7% |
| Broadband Home | 99 | 70.2% |
| Cellular Data Only | 2 | 1.4% |
| Satellite Internet | 6 | 4.3% |
| No Internet | 38 | 27.0% |
| Total | 141 | 100.0% |
Drake Summary
Drake, North Dakota is a small town located in the southwestern corner of the state. It is situated in the heart of the Missouri Coteau, a region of rolling hills and prairie grasslands. The town is located in the county of Williams, and is home to a population of just over 500 people.
History
Drake was founded in 1882 by a group of settlers from Wisconsin. The town was named after the nearby Drake Creek, which was named after a local settler, William Drake. The town was originally a farming community, and the settlers quickly established a post office, a general store, and a school.
In the early 1900s, Drake began to experience a period of growth. The town was connected to the Great Northern Railway, and the population began to increase. The town also became a center for the local agricultural industry, with several grain elevators and a creamery being built.
Geography
Drake is located in the southwestern corner of North Dakota, in the county of Williams. The town is situated in the heart of the Missouri Coteau, a region of rolling hills and prairie grasslands. The town is located at an elevation of 1,845 feet, and is surrounded by the cities of Williston, Watford City, and Tioga.
The climate in Drake is semi-arid, with hot summers and cold winters. The average annual temperature is around 48 degrees Fahrenheit, and the average annual precipitation is around 16 inches.
Economy
The economy of Drake is largely based on agriculture. The town is home to several grain elevators, and the surrounding area is used for growing wheat, barley, and other grains. The town is also home to a number of small businesses, including a grocery store, a hardware store, and a restaurant.
Demographics
As of the 2010 census, the population of Drake was 517. The racial makeup of the town was 97.3% White, 0.4% African American, 0.4% Native American, 0.2% Asian, and 1.7% from other races. The median household income was $41,250, and the median family income was $48,750.
Conclusion
Drake, North Dakota is a small town located in the southwestern corner of the state. It is situated in the heart of the Missouri Coteau, a region of rolling hills and prairie grasslands. The town is home to a population of just over 500 people, and the economy is largely based on agriculture. The town is also home to a number of small businesses, and the median household income is around $41,250.
Common Questions
What is Per Capita Income in Drake?
Per Capita income in Drake is $31,387.
What is the Median Family Income in Drake?
Median Family Income in Drake is $79,583.
What is the Median Household income in Drake?
Median Household Income in Drake is $43,750.
What is Income or Wage Gap in Drake?
Income or Wage Gap in Drake is 44.9%.
Women in Drake earn 55.1 cents for every dollar earned by a man.
What is Inequality or Gini Index in Drake?
Inequality or Gini Index in Drake is 0.50.
What is the Total Population of Drake?
Total Population of Drake is 297.
What is the Total Male Population of Drake?
Total Male Population of Drake is 173.
What is the Total Female Population of Drake?
Total Female Population of Drake is 124.
What is the Ratio of Males per 100 Females in Drake?
There are 139.52 Males per 100 Females in Drake.
What is the Ratio of Females per 100 Males in Drake?
There are 71.68 Females per 100 Males in Drake.
What is the Median Population Age in Drake?
Median Population Age in Drake is 40.9 Years.
What is the Average Family Size in Drake
Average Family Size in Drake is 3.1 People.
What is the Average Household Size in Drake
Average Household Size in Drake is 2.1 People.
How Large is the Labor Force in Drake?
There are 128 People in the Labor Forcein in Drake.
What is the Percentage of People in the Labor Force in Drake?
55.4% of People are in the Labor Force in Drake.
What is the Unemployment Rate in Drake?
Unemployment Rate in Drake is 15.6%.