Coleharbor, ND Map & Demographics
Coleharbor Map
Coleharbor Overview
$35,721
PER CAPITA INCOME
$61,000
AVG FAMILY INCOME
$48,125
AVG HOUSEHOLD INCOME
0.47
INEQUALITY / GINI INDEX
89
TOTAL POPULATION
49
MALE POPULATION
40
FEMALE POPULATION
122.50
MALES / 100 FEMALES
81.63
FEMALES / 100 MALES
64.8
MEDIAN AGE
2.3
AVG FAMILY SIZE
1.9
AVG HOUSEHOLD SIZE
26
LABOR FORCE [ PEOPLE ]
30.6%
PERCENT IN LABOR FORCE
Coleharbor Zip Codes
Coleharbor Area Codes
Income in Coleharbor
Income Overview in Coleharbor
Per Capita Income in Coleharbor is $35,721, while median incomes of families and households are $61,000 and $48,125 respectively.
| Characteristic | Number | Measure |
| Per Capita Income | 89 | $35,721 |
| Median Family Income | 30 | $61,000 |
| Mean Family Income | 30 | $65,540 |
| Median Household Income | 47 | $48,125 |
| Mean Household Income | 47 | $62,185 |
| Income Deficit | 30 | $0 |
| Wage / Income Gap (%) | 89 | 0.00% |
| Wage / Income Gap ($) | 89 | 100.00¢ per $1 |
| Gini / Inequality Index | 89 | 0.47 |
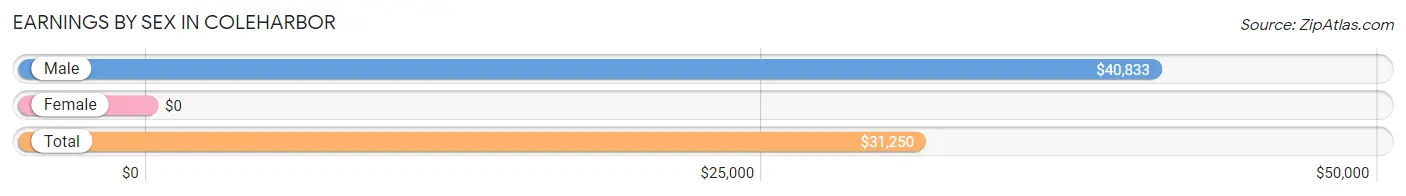
Earnings by Sex in Coleharbor
| Sex | Number | Average Earnings |
| Male | 24 (63.2%) | $40,833 |
| Female | 14 (36.8%) | $0 |
| Total | 38 (100.0%) | $31,250 |
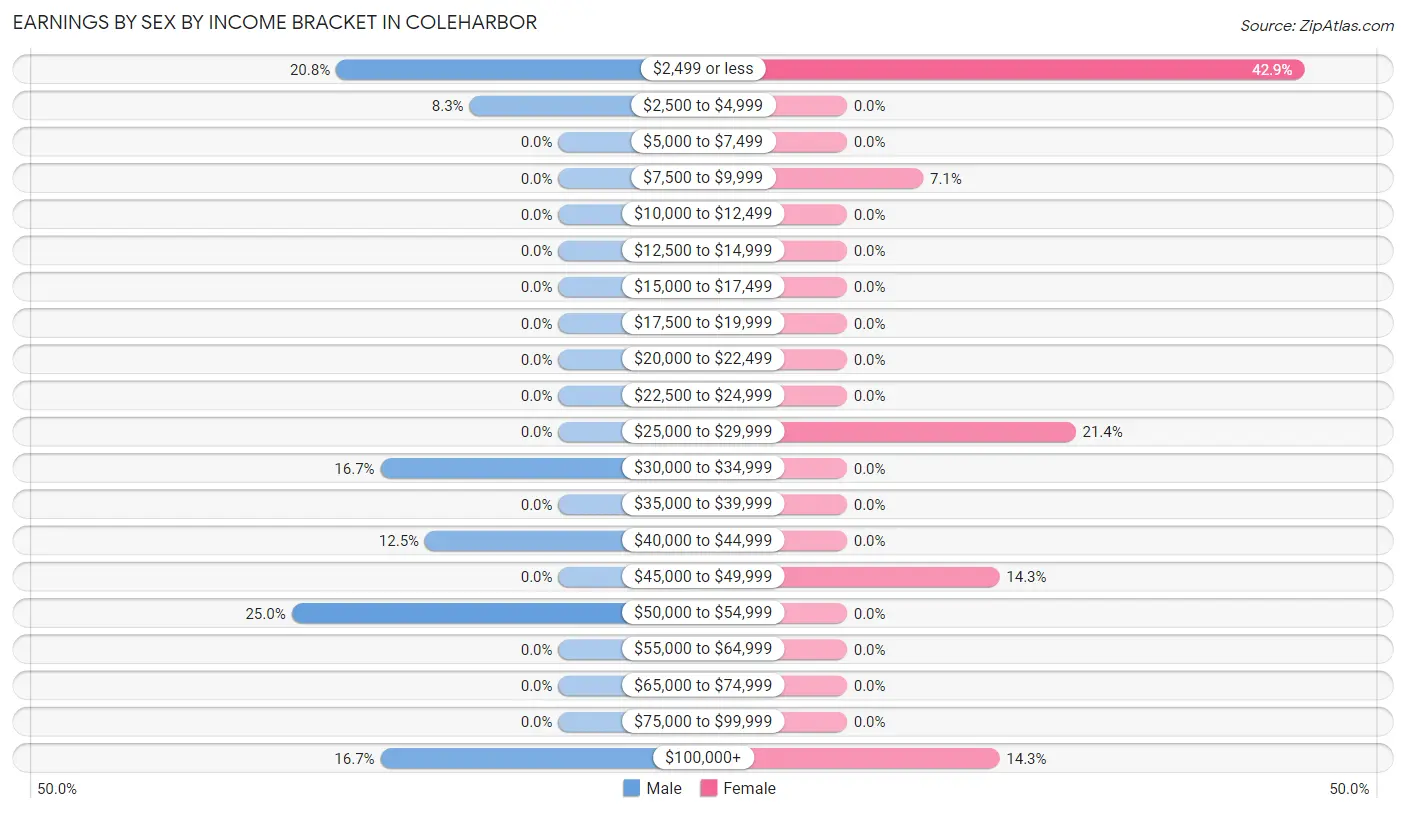
Earnings by Sex by Income Bracket in Coleharbor
The most common earnings brackets in Coleharbor are $50,000 to $54,999 for men (6 | 25.0%) and $2,499 or less for women (6 | 42.9%).
| Income | Male | Female |
| $2,499 or less | 5 (20.8%) | 6 (42.9%) |
| $2,500 to $4,999 | 2 (8.3%) | 0 (0.0%) |
| $5,000 to $7,499 | 0 (0.0%) | 0 (0.0%) |
| $7,500 to $9,999 | 0 (0.0%) | 1 (7.1%) |
| $10,000 to $12,499 | 0 (0.0%) | 0 (0.0%) |
| $12,500 to $14,999 | 0 (0.0%) | 0 (0.0%) |
| $15,000 to $17,499 | 0 (0.0%) | 0 (0.0%) |
| $17,500 to $19,999 | 0 (0.0%) | 0 (0.0%) |
| $20,000 to $22,499 | 0 (0.0%) | 0 (0.0%) |
| $22,500 to $24,999 | 0 (0.0%) | 0 (0.0%) |
| $25,000 to $29,999 | 0 (0.0%) | 3 (21.4%) |
| $30,000 to $34,999 | 4 (16.7%) | 0 (0.0%) |
| $35,000 to $39,999 | 0 (0.0%) | 0 (0.0%) |
| $40,000 to $44,999 | 3 (12.5%) | 0 (0.0%) |
| $45,000 to $49,999 | 0 (0.0%) | 2 (14.3%) |
| $50,000 to $54,999 | 6 (25.0%) | 0 (0.0%) |
| $55,000 to $64,999 | 0 (0.0%) | 0 (0.0%) |
| $65,000 to $74,999 | 0 (0.0%) | 0 (0.0%) |
| $75,000 to $99,999 | 0 (0.0%) | 0 (0.0%) |
| $100,000+ | 4 (16.7%) | 2 (14.3%) |
| Total | 24 (100.0%) | 14 (100.0%) |
Earnings by Sex by Educational Attainment in Coleharbor
| Educational Attainment | Male Income | Female Income |
| Less than High School | - | - |
| High School Diploma | - | - |
| College or Associate's Degree | - | - |
| Bachelor's Degree | - | - |
| Graduate Degree | - | - |
| Total | $52,917 | $0 |
Family Income in Coleharbor
Family Income Brackets in Coleharbor
According to the Coleharbor family income data, there are 6 families falling into the less than $10,000 income range, which is the most common income bracket and makes up 20.0% of all families.
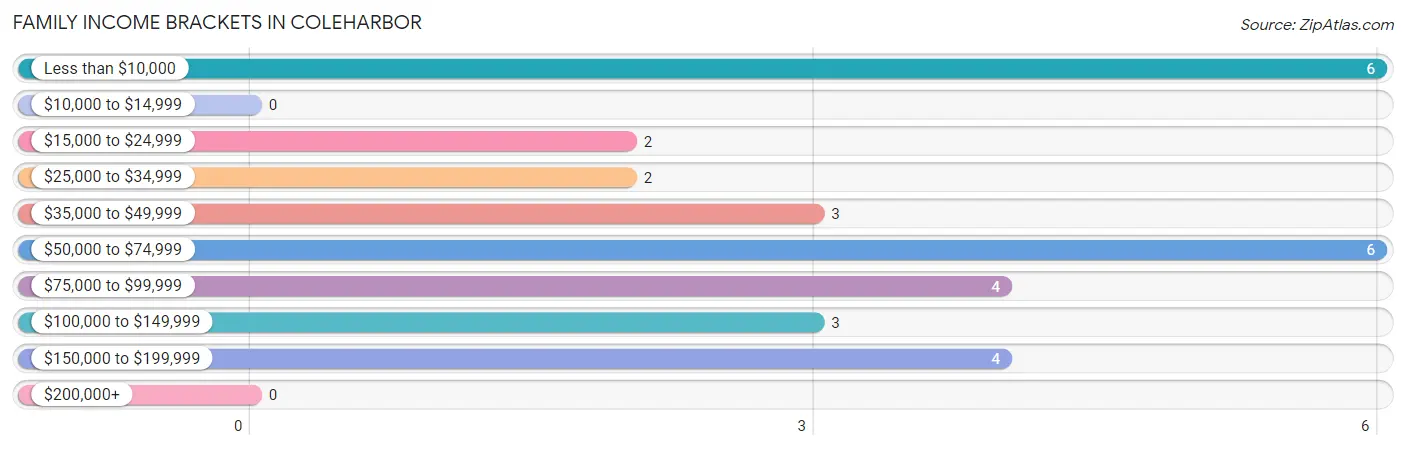
| Income Bracket | # Families | % Families |
| Less than $10,000 | 6 | 20.0% |
| $10,000 to $14,999 | 0 | 0.0% |
| $15,000 to $24,999 | 2 | 6.7% |
| $25,000 to $34,999 | 2 | 6.7% |
| $35,000 to $49,999 | 3 | 10.0% |
| $50,000 to $74,999 | 6 | 20.0% |
| $75,000 to $99,999 | 4 | 13.3% |
| $100,000 to $149,999 | 3 | 10.0% |
| $150,000 to $199,999 | 4 | 13.3% |
| $200,000+ | 0 | 0.0% |
Family Income by Famaliy Size in Coleharbor
3-person families (7 | 23.3%) account for the highest median family income in Coleharbor with $82,188 per family, while 3-person families (7 | 23.3%) have the highest median income of $27,396 per family member.
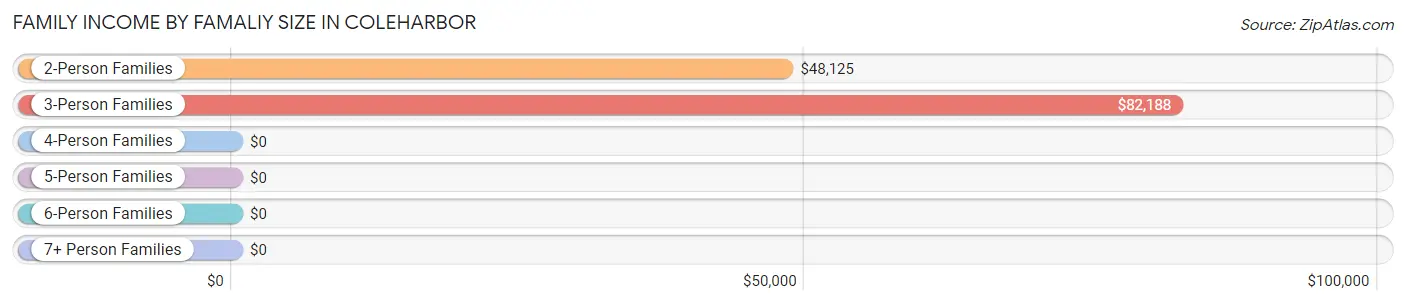
| Income Bracket | # Families | Median Income |
| 2-Person Families | 23 (76.7%) | $48,125 |
| 3-Person Families | 7 (23.3%) | $82,188 |
| 4-Person Families | 0 (0.0%) | $0 |
| 5-Person Families | 0 (0.0%) | $0 |
| 6-Person Families | 0 (0.0%) | $0 |
| 7+ Person Families | 0 (0.0%) | $0 |
| Total | 30 (100.0%) | $61,000 |
Family Income by Number of Earners in Coleharbor
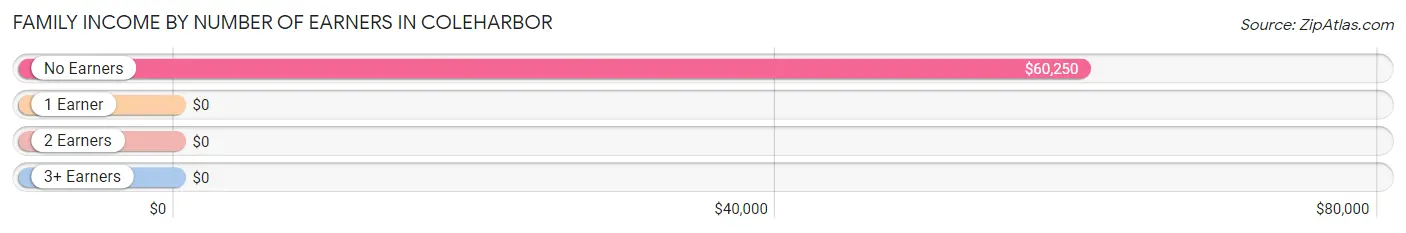
| Number of Earners | # Families | Median Income |
| No Earners | 15 (50.0%) | $60,250 |
| 1 Earner | 2 (6.7%) | $0 |
| 2 Earners | 11 (36.7%) | $0 |
| 3+ Earners | 2 (6.7%) | $0 |
| Total | 30 (100.0%) | $61,000 |
Household Income in Coleharbor
Household Income Brackets in Coleharbor
With 7 households falling in the category, the less than $10,000 income range is the most frequent in Coleharbor, accounting for 14.9% of all households.
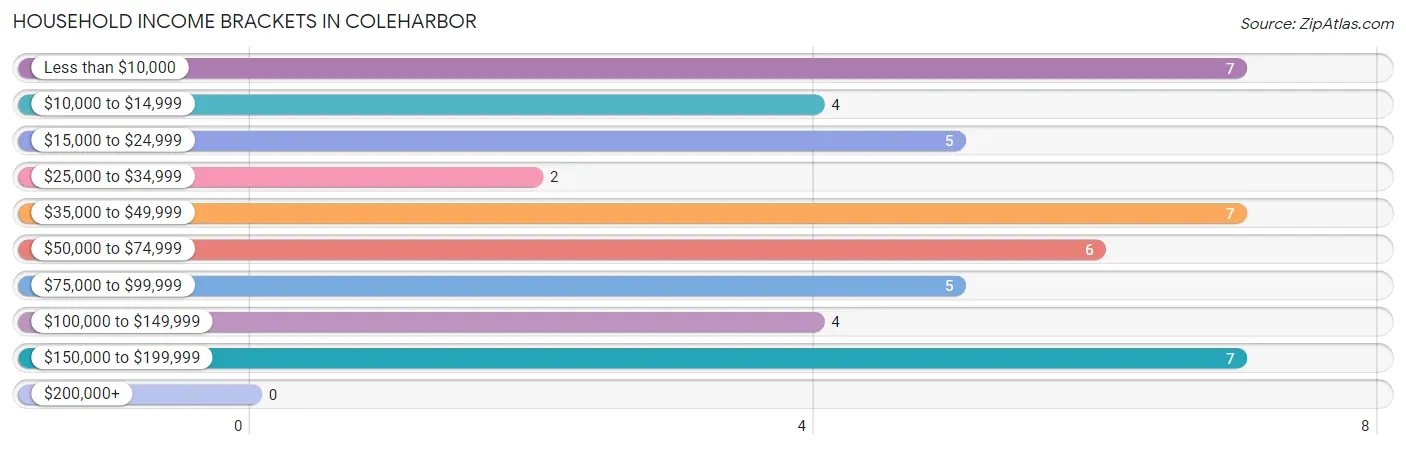
| Income Bracket | # Households | % Households |
| Less than $10,000 | 7 | 14.9% |
| $10,000 to $14,999 | 4 | 8.5% |
| $15,000 to $24,999 | 5 | 10.6% |
| $25,000 to $34,999 | 2 | 4.3% |
| $35,000 to $49,999 | 7 | 14.9% |
| $50,000 to $74,999 | 6 | 12.8% |
| $75,000 to $99,999 | 5 | 10.6% |
| $100,000 to $149,999 | 4 | 8.5% |
| $150,000 to $199,999 | 7 | 14.9% |
| $200,000+ | 0 | 0.0% |
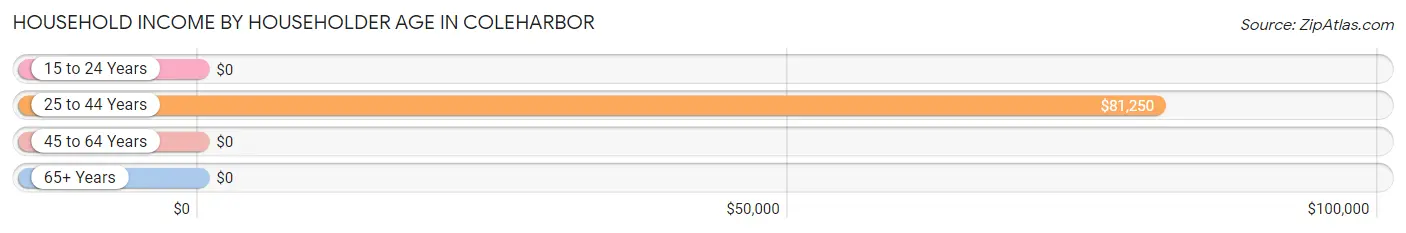
Household Income by Householder Age in Coleharbor
The median household income in Coleharbor is $48,125, with the highest median household income of $81,250 found in the 25 to 44 years age bracket for the primary householder. A total of 10 households (21.3%) fall into this category.
| Income Bracket | # Households | Median Income |
| 15 to 24 Years | 0 (0.0%) | $0 |
| 25 to 44 Years | 10 (21.3%) | $81,250 |
| 45 to 64 Years | 19 (40.4%) | $0 |
| 65+ Years | 18 (38.3%) | $0 |
| Total | 47 (100.0%) | $48,125 |
Poverty in Coleharbor
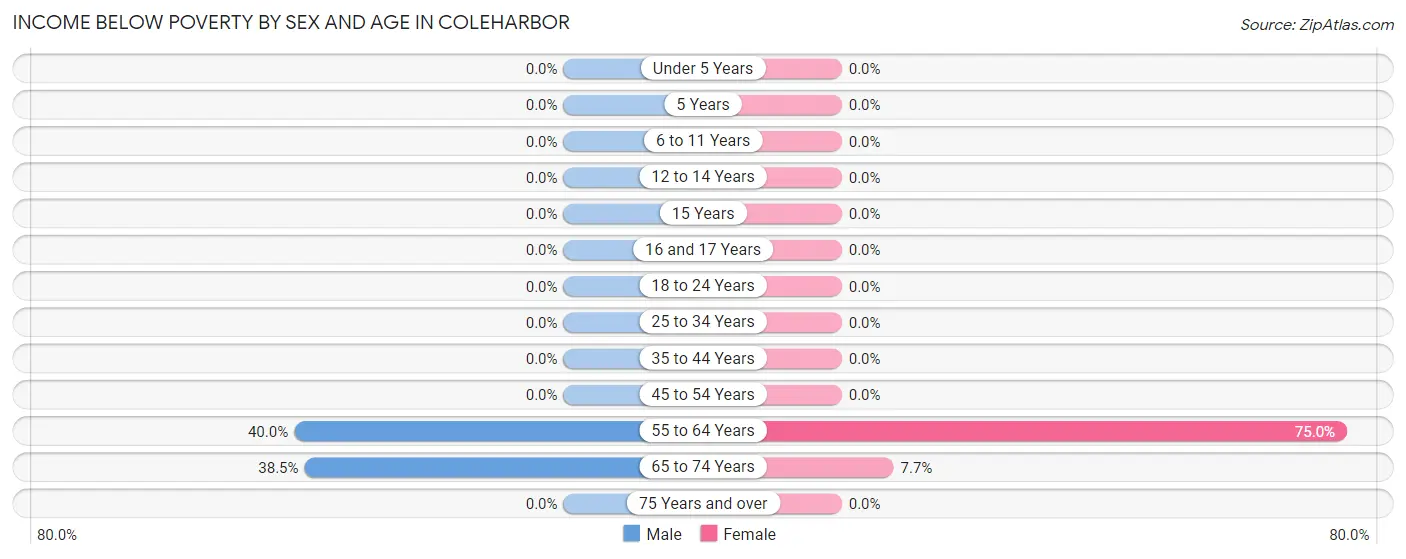
Income Below Poverty by Sex and Age in Coleharbor
With 18.4% poverty level for males and 17.5% for females among the residents of Coleharbor, 55 to 64 year old males and 55 to 64 year old females are the most vulnerable to poverty, with 4 males (40.0%) and 6 females (75.0%) in their respective age groups living below the poverty level.
| Age Bracket | Male | Female |
| Under 5 Years | 0 (0.0%) | 0 (0.0%) |
| 5 Years | 0 (0.0%) | 0 (0.0%) |
| 6 to 11 Years | 0 (0.0%) | 0 (0.0%) |
| 12 to 14 Years | 0 (0.0%) | 0 (0.0%) |
| 15 Years | 0 (0.0%) | 0 (0.0%) |
| 16 and 17 Years | 0 (0.0%) | 0 (0.0%) |
| 18 to 24 Years | 0 (0.0%) | 0 (0.0%) |
| 25 to 34 Years | 0 (0.0%) | 0 (0.0%) |
| 35 to 44 Years | 0 (0.0%) | 0 (0.0%) |
| 45 to 54 Years | 0 (0.0%) | 0 (0.0%) |
| 55 to 64 Years | 4 (40.0%) | 6 (75.0%) |
| 65 to 74 Years | 5 (38.5%) | 1 (7.7%) |
| 75 Years and over | 0 (0.0%) | 0 (0.0%) |
| Total | 9 (18.4%) | 7 (17.5%) |
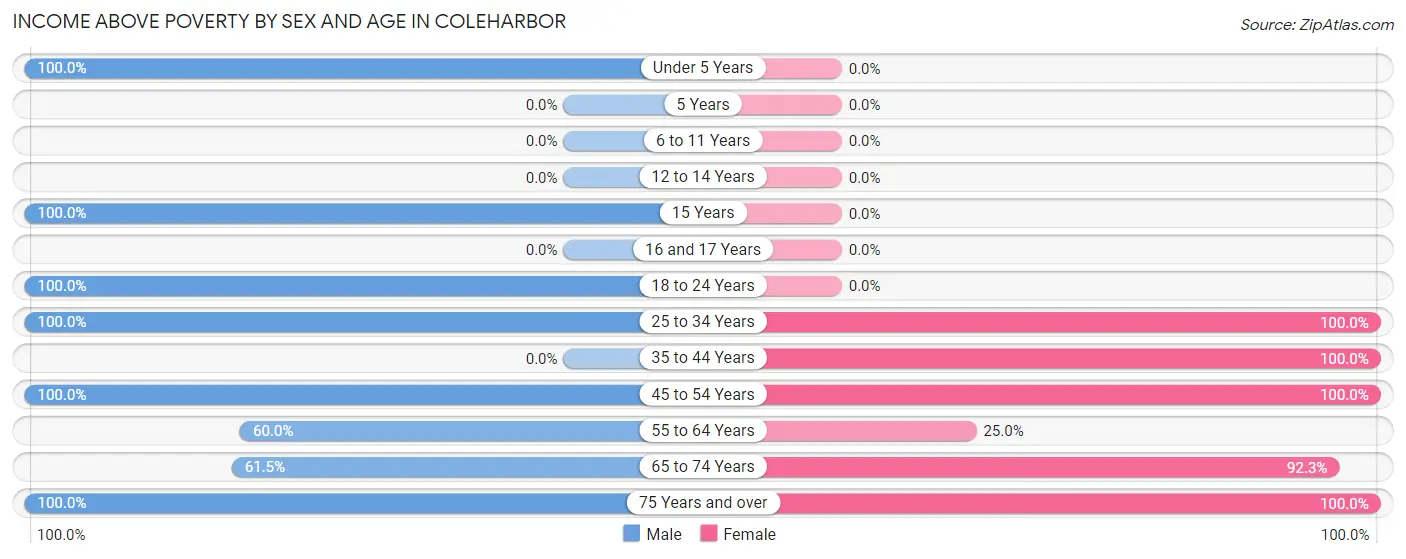
Income Above Poverty by Sex and Age in Coleharbor
According to the poverty statistics in Coleharbor, males aged under 5 years and females aged 25 to 34 years are the age groups that are most secure financially, with 100.0% of males and 100.0% of females in these age groups living above the poverty line.
| Age Bracket | Male | Female |
| Under 5 Years | 2 (100.0%) | 0 (0.0%) |
| 5 Years | 0 (0.0%) | 0 (0.0%) |
| 6 to 11 Years | 0 (0.0%) | 0 (0.0%) |
| 12 to 14 Years | 0 (0.0%) | 0 (0.0%) |
| 15 Years | 2 (100.0%) | 0 (0.0%) |
| 16 and 17 Years | 0 (0.0%) | 0 (0.0%) |
| 18 to 24 Years | 6 (100.0%) | 0 (0.0%) |
| 25 to 34 Years | 8 (100.0%) | 3 (100.0%) |
| 35 to 44 Years | 0 (0.0%) | 2 (100.0%) |
| 45 to 54 Years | 3 (100.0%) | 2 (100.0%) |
| 55 to 64 Years | 6 (60.0%) | 2 (25.0%) |
| 65 to 74 Years | 8 (61.5%) | 12 (92.3%) |
| 75 Years and over | 5 (100.0%) | 12 (100.0%) |
| Total | 40 (81.6%) | 33 (82.5%) |
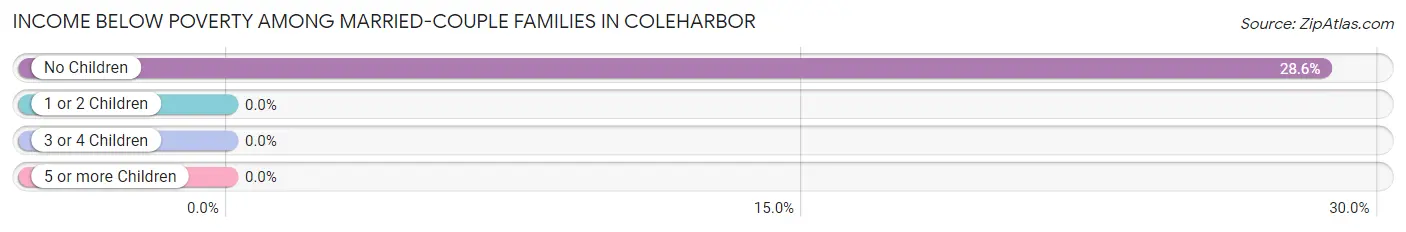
Income Below Poverty Among Married-Couple Families in Coleharbor
The poverty statistics for married-couple families in Coleharbor show that 24.0% or 6 of the total 25 families live below the poverty line. Families with no children have the highest poverty rate of 28.6%, comprising of 6 families. On the other hand, families with 1 or 2 children have the lowest poverty rate of 0.0%, which includes 0 families.
| Children | Above Poverty | Below Poverty |
| No Children | 15 (71.4%) | 6 (28.6%) |
| 1 or 2 Children | 4 (100.0%) | 0 (0.0%) |
| 3 or 4 Children | 0 (0.0%) | 0 (0.0%) |
| 5 or more Children | 0 (0.0%) | 0 (0.0%) |
| Total | 19 (76.0%) | 6 (24.0%) |
Income Below Poverty Among Single-Parent Households in Coleharbor
| Children | Single Father | Single Mother |
| No Children | 0 (0.0%) | 0 (0.0%) |
| 1 or 2 Children | 0 (0.0%) | 0 (0.0%) |
| 3 or 4 Children | 0 (0.0%) | 0 (0.0%) |
| 5 or more Children | 0 (0.0%) | 0 (0.0%) |
| Total | 0 (0.0%) | 0 (0.0%) |
Income Below Poverty Among Married-Couple vs Single-Parent Households in Coleharbor
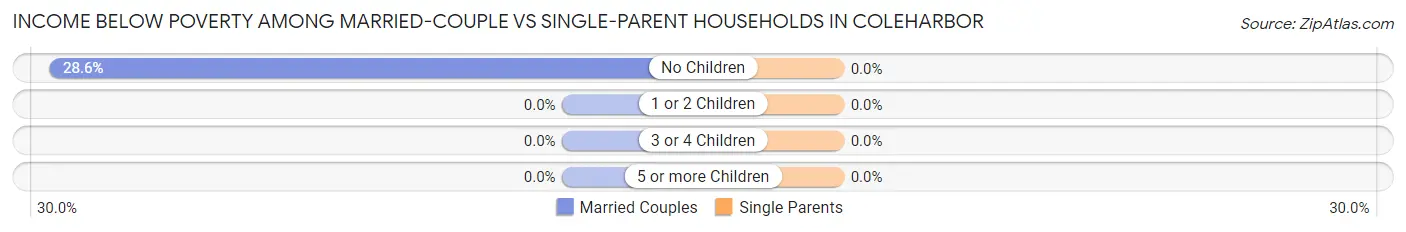
| Children | Married-Couple Families | Single-Parent Households |
| No Children | 6 (28.6%) | 0 (0.0%) |
| 1 or 2 Children | 0 (0.0%) | 0 (0.0%) |
| 3 or 4 Children | 0 (0.0%) | 0 (0.0%) |
| 5 or more Children | 0 (0.0%) | 0 (0.0%) |
| Total | 6 (24.0%) | 0 (0.0%) |
Race in Coleharbor
The most populous races in Coleharbor are White / Caucasian (86 | 96.6%), and Two or more Races (3 | 3.4%).
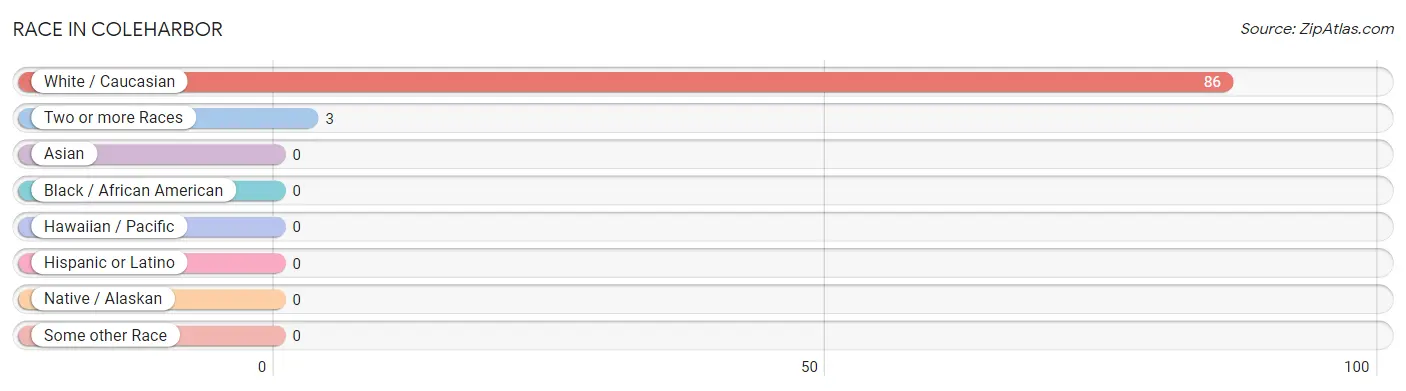
| Race | # Population | % Population |
| Asian | 0 | 0.0% |
| Black / African American | 0 | 0.0% |
| Hawaiian / Pacific | 0 | 0.0% |
| Hispanic or Latino | 0 | 0.0% |
| Native / Alaskan | 0 | 0.0% |
| White / Caucasian | 86 | 96.6% |
| Two or more Races | 3 | 3.4% |
| Some other Race | 0 | 0.0% |
| Total | 89 | 100.0% |
Ancestry in Coleharbor
The most populous ancestries reported in Coleharbor are German (41 | 46.1%), Norwegian (32 | 36.0%), English (7 | 7.9%), American (4 | 4.5%), and Swedish (4 | 4.5%), together accounting for 98.9% of all Coleharbor residents.
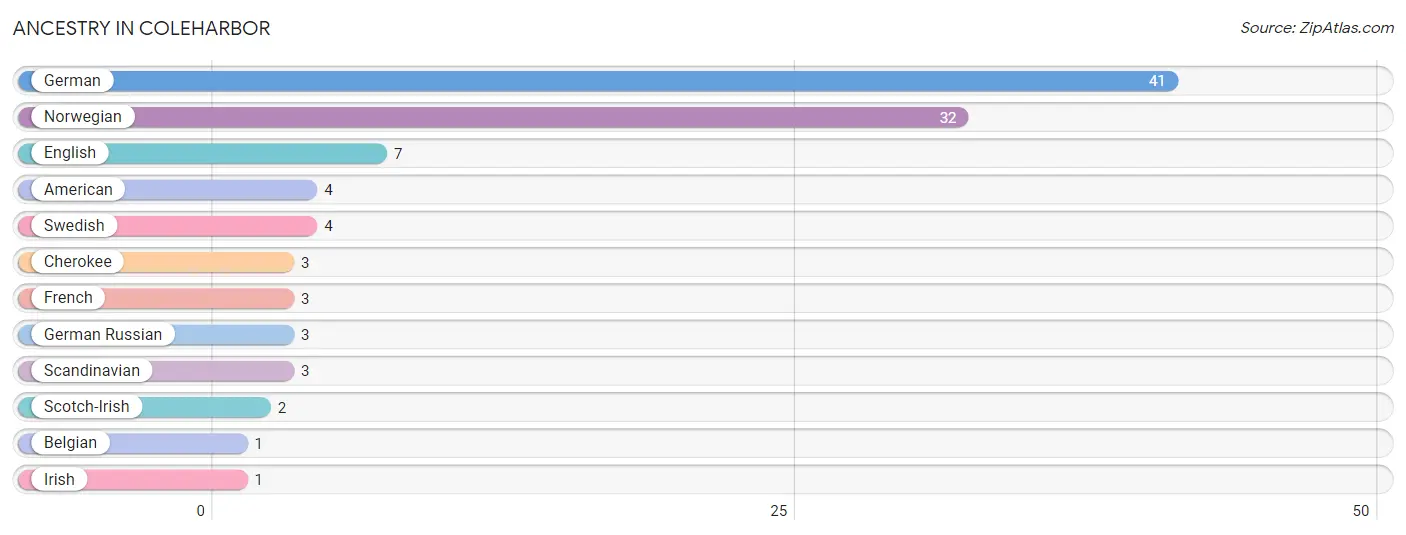
| Ancestry | # Population | % Population |
| American | 4 | 4.5% |
| Belgian | 1 | 1.1% |
| Cherokee | 3 | 3.4% |
| English | 7 | 7.9% |
| French | 3 | 3.4% |
| German | 41 | 46.1% |
| German Russian | 3 | 3.4% |
| Irish | 1 | 1.1% |
| Norwegian | 32 | 36.0% |
| Scandinavian | 3 | 3.4% |
| Scotch-Irish | 2 | 2.2% |
| Swedish | 4 | 4.5% | View All 12 Rows |
Immigrants in Coleharbor

| Immigration Origin | # Population | % Population | View All 0 Rows |
Sex and Age in Coleharbor
Sex and Age in Coleharbor
The most populous age groups in Coleharbor are 65 to 69 Years (7 | 14.3%) for men and 70 to 74 Years (10 | 25.0%) for women.
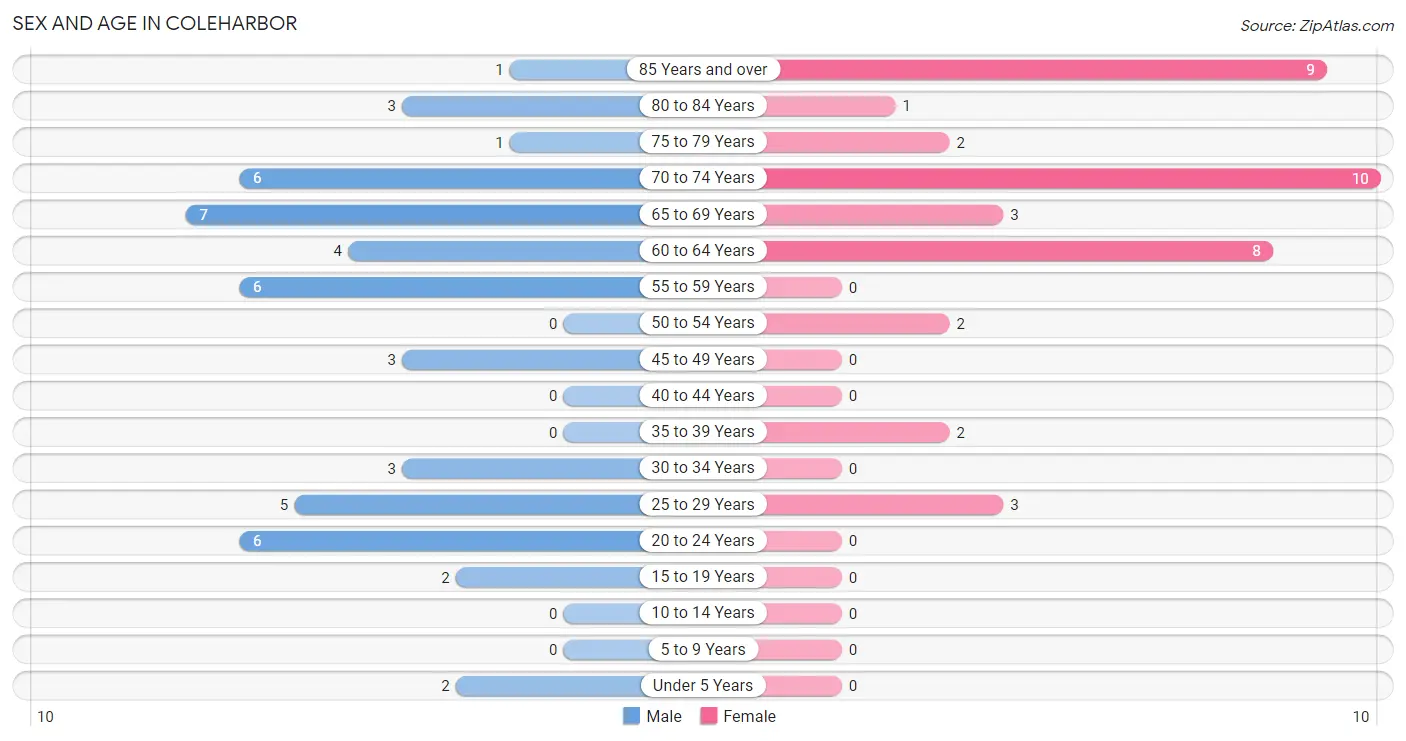
| Age Bracket | Male | Female |
| Under 5 Years | 2 (4.1%) | 0 (0.0%) |
| 5 to 9 Years | 0 (0.0%) | 0 (0.0%) |
| 10 to 14 Years | 0 (0.0%) | 0 (0.0%) |
| 15 to 19 Years | 2 (4.1%) | 0 (0.0%) |
| 20 to 24 Years | 6 (12.2%) | 0 (0.0%) |
| 25 to 29 Years | 5 (10.2%) | 3 (7.5%) |
| 30 to 34 Years | 3 (6.1%) | 0 (0.0%) |
| 35 to 39 Years | 0 (0.0%) | 2 (5.0%) |
| 40 to 44 Years | 0 (0.0%) | 0 (0.0%) |
| 45 to 49 Years | 3 (6.1%) | 0 (0.0%) |
| 50 to 54 Years | 0 (0.0%) | 2 (5.0%) |
| 55 to 59 Years | 6 (12.2%) | 0 (0.0%) |
| 60 to 64 Years | 4 (8.2%) | 8 (20.0%) |
| 65 to 69 Years | 7 (14.3%) | 3 (7.5%) |
| 70 to 74 Years | 6 (12.2%) | 10 (25.0%) |
| 75 to 79 Years | 1 (2.0%) | 2 (5.0%) |
| 80 to 84 Years | 3 (6.1%) | 1 (2.5%) |
| 85 Years and over | 1 (2.0%) | 9 (22.5%) |
| Total | 49 (100.0%) | 40 (100.0%) |
Families and Households in Coleharbor
Median Family Size in Coleharbor
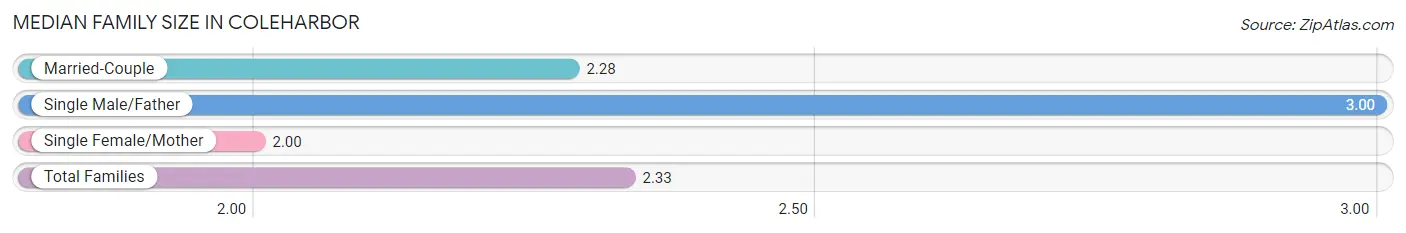
The median family size in Coleharbor is 2.33 persons per family, with single male/father families (3 | 10.0%) accounting for the largest median family size of 3 persons per family. On the other hand, single female/mother families (2 | 6.7%) represent the smallest median family size with 2.00 persons per family.
| Family Type | # Families | Family Size |
| Married-Couple | 25 (83.3%) | 2.28 |
| Single Male/Father | 3 (10.0%) | 3.00 |
| Single Female/Mother | 2 (6.7%) | 2.00 |
| Total Families | 30 (100.0%) | 2.33 |
Median Household Size in Coleharbor
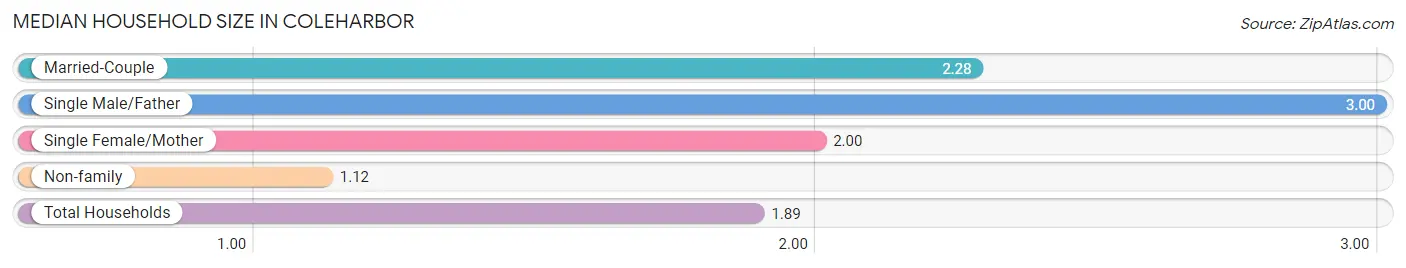
The median household size in Coleharbor is 1.89 persons per household, with single male/father households (3 | 6.4%) accounting for the largest median household size of 3 persons per household. non-family households (17 | 36.2%) represent the smallest median household size with 1.12 persons per household.
| Household Type | # Households | Household Size |
| Married-Couple | 25 (53.2%) | 2.28 |
| Single Male/Father | 3 (6.4%) | 3.00 |
| Single Female/Mother | 2 (4.3%) | 2.00 |
| Non-family | 17 (36.2%) | 1.12 |
| Total Households | 47 (100.0%) | 1.89 |
Household Size by Marriage Status in Coleharbor
Out of a total of 47 households in Coleharbor, 30 (63.8%) are family households, while 17 (36.2%) are nonfamily households. The most numerous type of family households are 2-person households, comprising 23, and the most common type of nonfamily households are 1-person households, comprising 16.
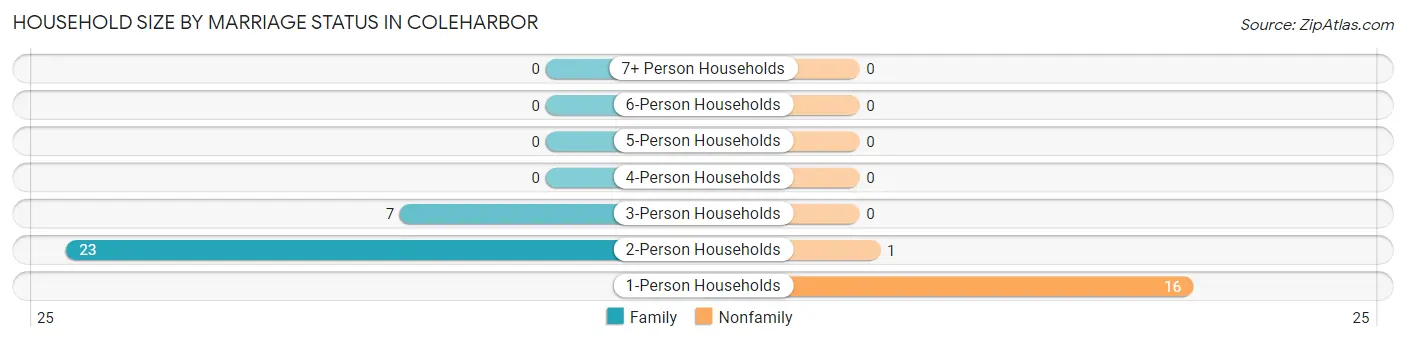
| Household Size | Family Households | Nonfamily Households |
| 1-Person Households | - | 16 (34.0%) |
| 2-Person Households | 23 (48.9%) | 1 (2.1%) |
| 3-Person Households | 7 (14.9%) | 0 (0.0%) |
| 4-Person Households | 0 (0.0%) | 0 (0.0%) |
| 5-Person Households | 0 (0.0%) | 0 (0.0%) |
| 6-Person Households | 0 (0.0%) | 0 (0.0%) |
| 7+ Person Households | 0 (0.0%) | 0 (0.0%) |
| Total | 30 (63.8%) | 17 (36.2%) |
Female Fertility in Coleharbor
Fertility by Age in Coleharbor
| Age Bracket | Women with Births | Births / 1,000 Women |
| 15 to 19 years | 0 (0.0%) | 0.0 |
| 20 to 34 years | 0 (0.0%) | 0.0 |
| 35 to 50 years | 0 (0.0%) | 0.0 |
| Total | 0 (0.0%) | 0.0 |
Fertility by Age by Marriage Status in Coleharbor
| Age Bracket | Married | Unmarried |
| 15 to 19 years | 0 (0.0%) | 0 (0.0%) |
| 20 to 34 years | 0 (0.0%) | 0 (0.0%) |
| 35 to 50 years | 0 (0.0%) | 0 (0.0%) |
| Total | 0 (0.0%) | 0 (0.0%) |
Fertility by Education in Coleharbor
| Educational Attainment | Women with Births | Births / 1,000 Women |
| Less than High School | 0 (0.0%) | 0.0 |
| High School Diploma | 0 (0.0%) | 0.0 |
| College or Associate's Degree | 0 (0.0%) | 0.0 |
| Bachelor's Degree | 0 (0.0%) | 0.0 |
| Graduate Degree | 0 (0.0%) | 0.0 |
| Total | 0 (0.0%) | 0.0 |
Fertility by Education by Marriage Status in Coleharbor
| Educational Attainment | Married | Unmarried |
| Less than High School | 0 (0.0%) | 0 (0.0%) |
| High School Diploma | 0 (0.0%) | 0 (0.0%) |
| College or Associate's Degree | 0 (0.0%) | 0 (0.0%) |
| Bachelor's Degree | 0 (0.0%) | 0 (0.0%) |
| Graduate Degree | 0 (0.0%) | 0 (0.0%) |
| Total | 0 (0.0%) | 0 (0.0%) |
Employment Characteristics in Coleharbor
Employment by Class of Employer in Coleharbor
Among the 26 employed individuals in Coleharbor, private company employees (21 | 80.8%), self-employed (not incorporated) (3 | 11.5%), and not-for-profit organizations (2 | 7.7%) make up the most common classes of employment.
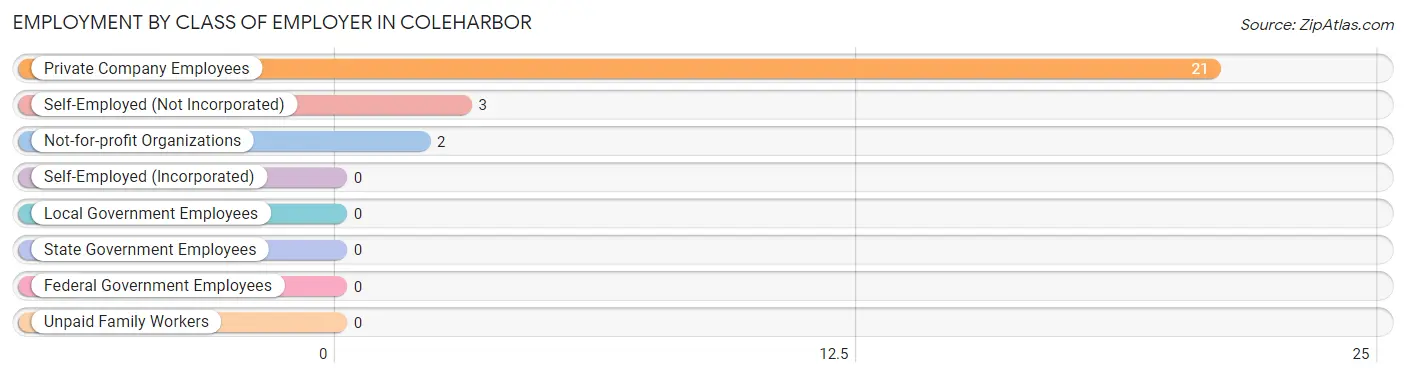
| Employer Class | # Employees | % Employees |
| Private Company Employees | 21 | 80.8% |
| Self-Employed (Incorporated) | 0 | 0.0% |
| Self-Employed (Not Incorporated) | 3 | 11.5% |
| Not-for-profit Organizations | 2 | 7.7% |
| Local Government Employees | 0 | 0.0% |
| State Government Employees | 0 | 0.0% |
| Federal Government Employees | 0 | 0.0% |
| Unpaid Family Workers | 0 | 0.0% |
| Total | 26 | 100.0% |
Employment Status by Age in Coleharbor
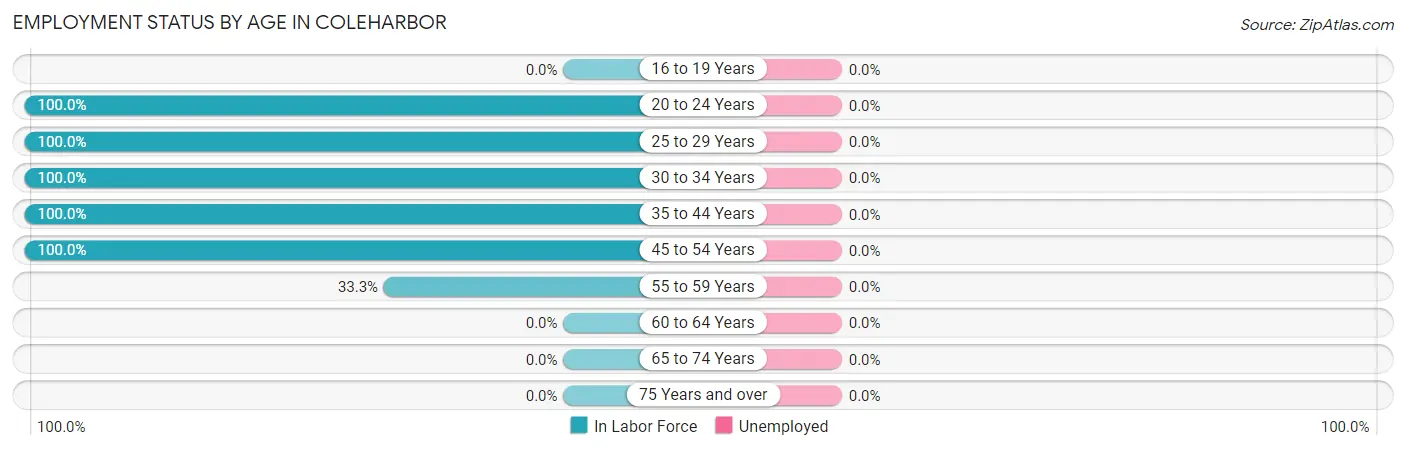
| Age Bracket | In Labor Force | Unemployed |
| 16 to 19 Years | 0 (0.0%) | 0 (0.0%) |
| 20 to 24 Years | 6 (100.0%) | 0 (0.0%) |
| 25 to 29 Years | 8 (100.0%) | 0 (0.0%) |
| 30 to 34 Years | 3 (100.0%) | 0 (0.0%) |
| 35 to 44 Years | 2 (100.0%) | 0 (0.0%) |
| 45 to 54 Years | 5 (100.0%) | 0 (0.0%) |
| 55 to 59 Years | 2 (33.3%) | 0 (0.0%) |
| 60 to 64 Years | 0 (0.0%) | 0 (0.0%) |
| 65 to 74 Years | 0 (0.0%) | 0 (0.0%) |
| 75 Years and over | 0 (0.0%) | 0 (0.0%) |
| Total | 26 (30.6%) | 0 (0.0%) |
Employment Status by Educational Attainment in Coleharbor
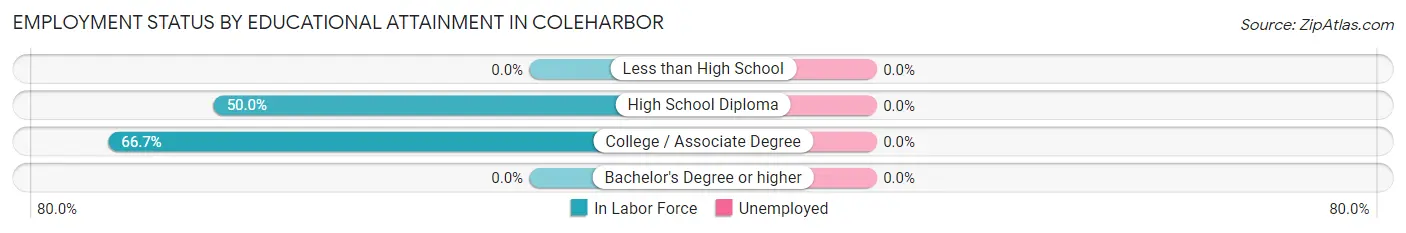
| Educational Attainment | In Labor Force | Unemployed |
| Less than High School | 0 (0.0%) | 0 (0.0%) |
| High School Diploma | 8 (50.0%) | 0 (0.0%) |
| College / Associate Degree | 12 (66.7%) | 0 (0.0%) |
| Bachelor's Degree or higher | 0 (0.0%) | 0 (0.0%) |
| Total | 20 (55.6%) | 0 (0.0%) |
Employment Occupations by Sex in Coleharbor
Management, Business, Science and Arts Occupations
The most common Management, Business, Science and Arts occupations in Coleharbor are Management (3 | 11.5%), Community & Social Service (3 | 11.5%), and Legal Services & Support (3 | 11.5%).
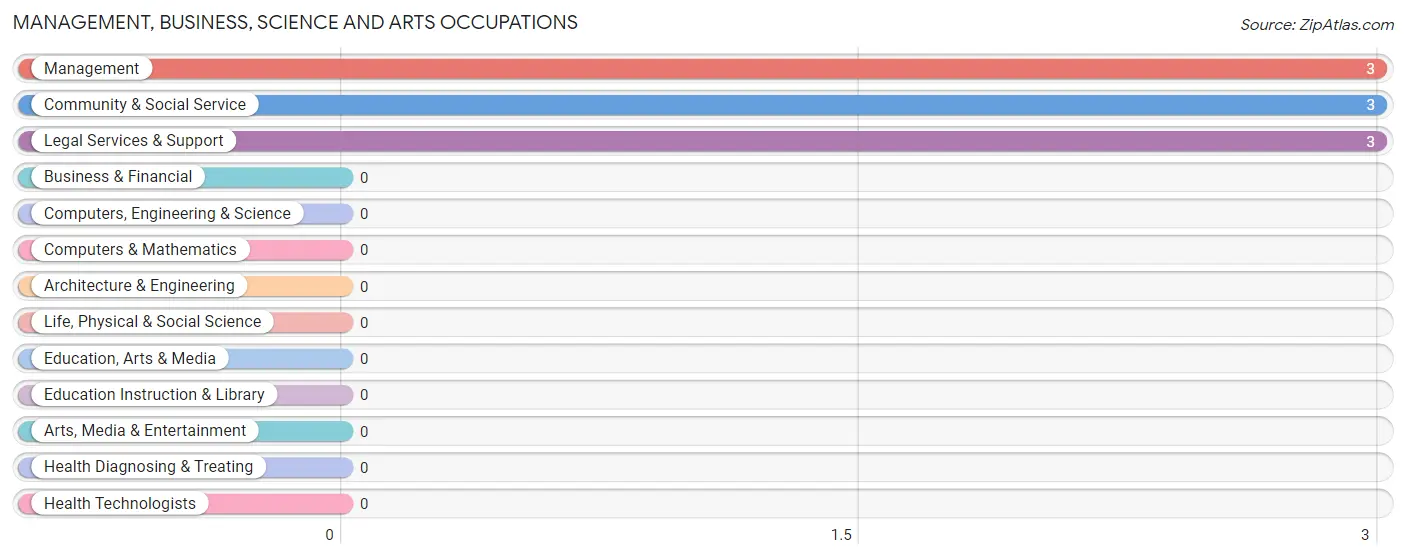
Management, Business, Science and Arts Occupations by Sex
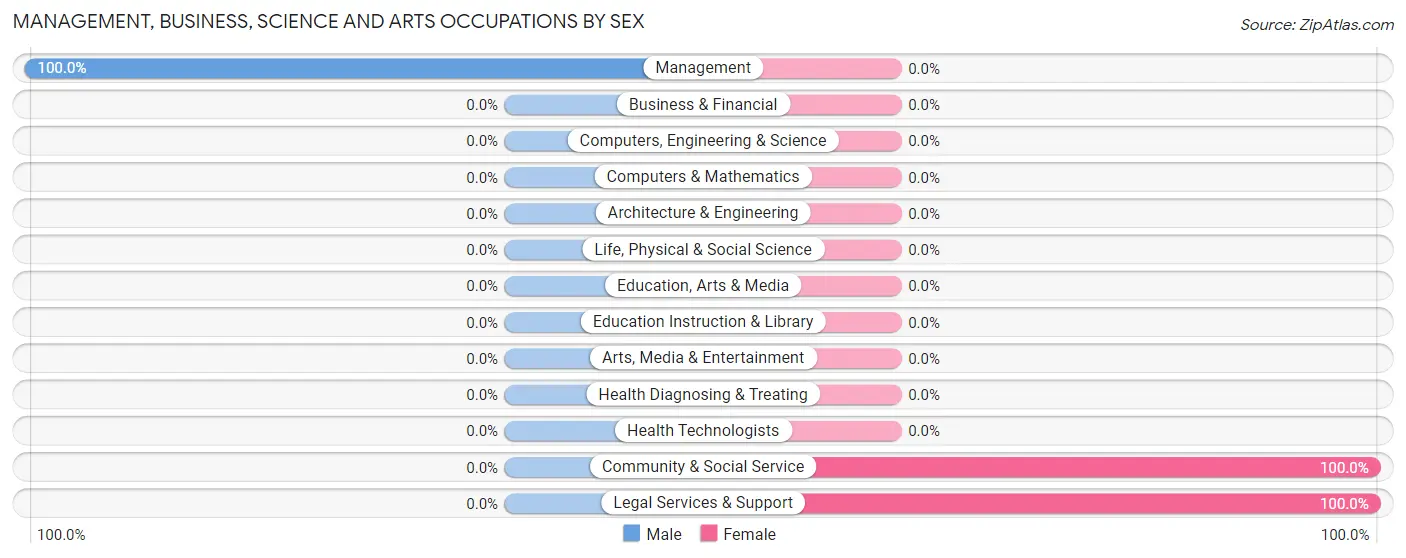
| Occupation | Male | Female |
| Management | 3 (100.0%) | 0 (0.0%) |
| Business & Financial | 0 (0.0%) | 0 (0.0%) |
| Computers, Engineering & Science | 0 (0.0%) | 0 (0.0%) |
| Computers & Mathematics | 0 (0.0%) | 0 (0.0%) |
| Architecture & Engineering | 0 (0.0%) | 0 (0.0%) |
| Life, Physical & Social Science | 0 (0.0%) | 0 (0.0%) |
| Community & Social Service | 0 (0.0%) | 3 (100.0%) |
| Education, Arts & Media | 0 (0.0%) | 0 (0.0%) |
| Legal Services & Support | 0 (0.0%) | 3 (100.0%) |
| Education Instruction & Library | 0 (0.0%) | 0 (0.0%) |
| Arts, Media & Entertainment | 0 (0.0%) | 0 (0.0%) |
| Health Diagnosing & Treating | 0 (0.0%) | 0 (0.0%) |
| Health Technologists | 0 (0.0%) | 0 (0.0%) |
| Total (Category) | 3 (50.0%) | 3 (50.0%) |
| Total (Overall) | 19 (73.1%) | 7 (26.9%) |
Services Occupations
Services Occupations by Sex
| Occupation | Male | Female |
| Healthcare Support | 0 (0.0%) | 0 (0.0%) |
| Security & Protection | 0 (0.0%) | 0 (0.0%) |
| Firefighting & Prevention | 0 (0.0%) | 0 (0.0%) |
| Law Enforcement | 0 (0.0%) | 0 (0.0%) |
| Food Preparation & Serving | 0 (0.0%) | 0 (0.0%) |
| Cleaning & Maintenance | 0 (0.0%) | 0 (0.0%) |
| Personal Care & Service | 0 (0.0%) | 0 (0.0%) |
| Total (Category) | 0 (0.0%) | 0 (0.0%) |
| Total (Overall) | 19 (73.1%) | 7 (26.9%) |
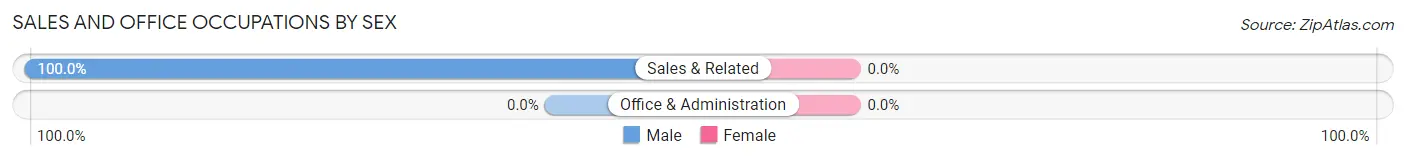
Sales and Office Occupations
The most common Sales and Office occupations in Coleharbor are , and Sales & Related (2 | 7.7%).
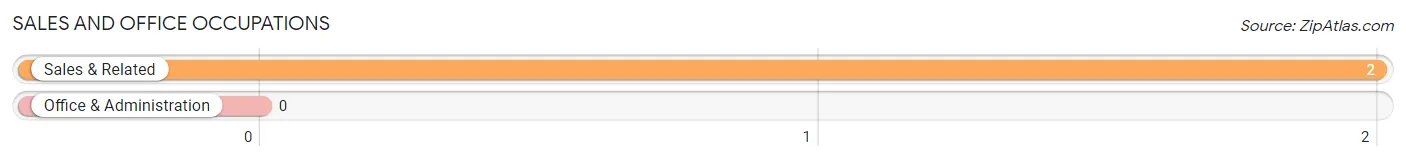
Sales and Office Occupations by Sex
| Occupation | Male | Female |
| Sales & Related | 2 (100.0%) | 0 (0.0%) |
| Office & Administration | 0 (0.0%) | 0 (0.0%) |
| Total (Category) | 2 (100.0%) | 0 (0.0%) |
| Total (Overall) | 19 (73.1%) | 7 (26.9%) |
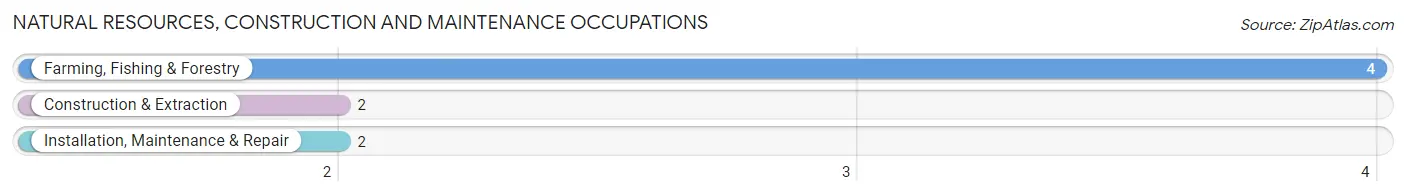
Natural Resources, Construction and Maintenance Occupations
The most common Natural Resources, Construction and Maintenance occupations in Coleharbor are Farming, Fishing & Forestry (4 | 15.4%), Construction & Extraction (2 | 7.7%), and Installation, Maintenance & Repair (2 | 7.7%).
Natural Resources, Construction and Maintenance Occupations by Sex
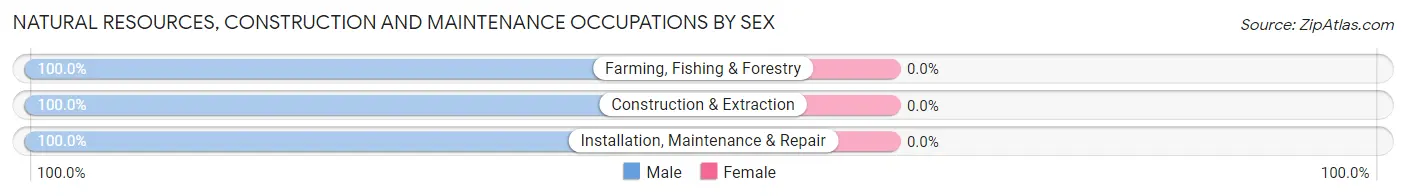
| Occupation | Male | Female |
| Farming, Fishing & Forestry | 4 (100.0%) | 0 (0.0%) |
| Construction & Extraction | 2 (100.0%) | 0 (0.0%) |
| Installation, Maintenance & Repair | 2 (100.0%) | 0 (0.0%) |
| Total (Category) | 8 (100.0%) | 0 (0.0%) |
| Total (Overall) | 19 (73.1%) | 7 (26.9%) |
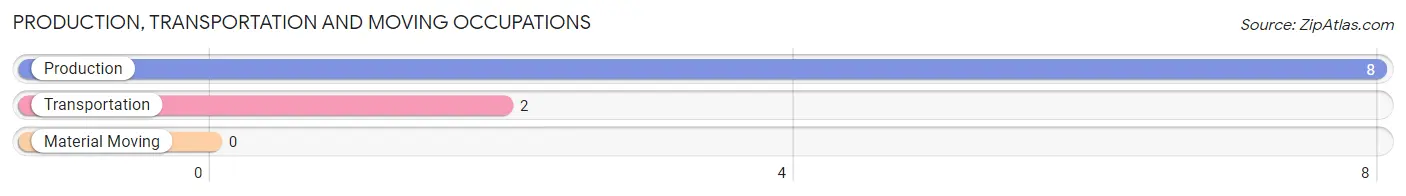
Production, Transportation and Moving Occupations
The most common Production, Transportation and Moving occupations in Coleharbor are Production (8 | 30.8%), and Transportation (2 | 7.7%).
Production, Transportation and Moving Occupations by Sex
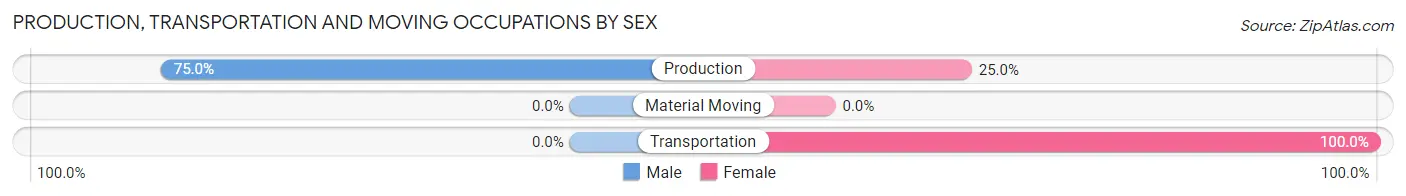
| Occupation | Male | Female |
| Production | 6 (75.0%) | 2 (25.0%) |
| Transportation | 0 (0.0%) | 2 (100.0%) |
| Material Moving | 0 (0.0%) | 0 (0.0%) |
| Total (Category) | 6 (60.0%) | 4 (40.0%) |
| Total (Overall) | 19 (73.1%) | 7 (26.9%) |
Employment Industries by Sex in Coleharbor
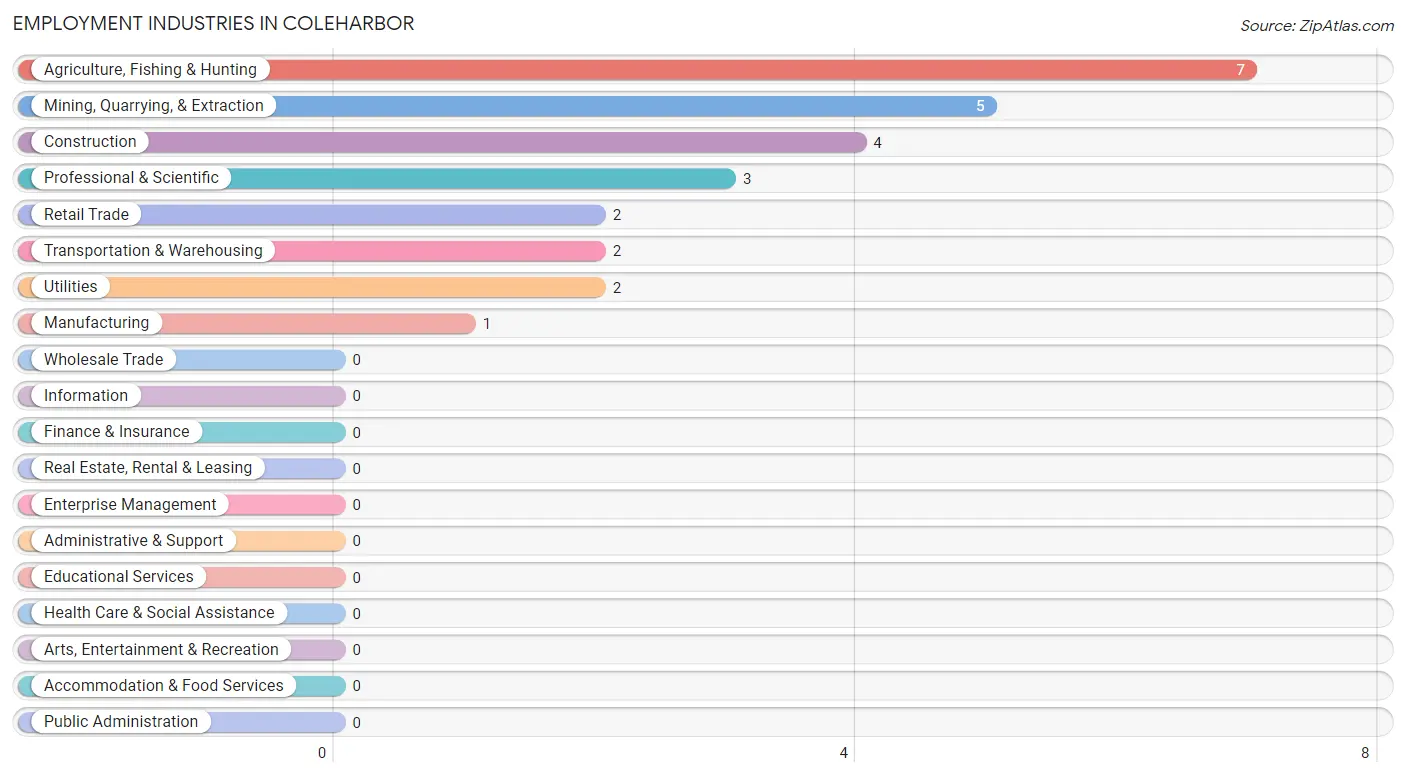
Employment Industries in Coleharbor
The major employment industries in Coleharbor include Agriculture, Fishing & Hunting (7 | 26.9%), Mining, Quarrying, & Extraction (5 | 19.2%), Construction (4 | 15.4%), Professional & Scientific (3 | 11.5%), and Retail Trade (2 | 7.7%).
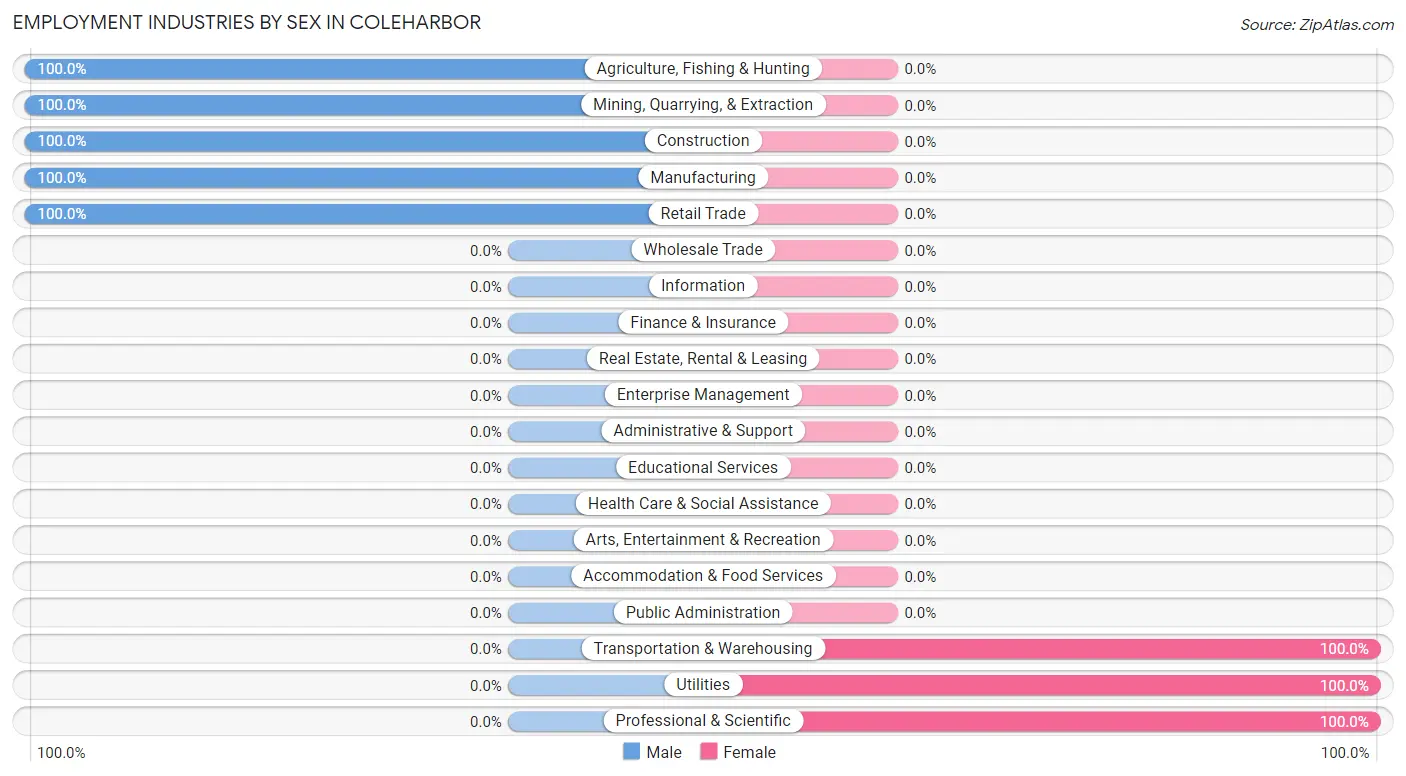
Employment Industries by Sex in Coleharbor
The Coleharbor industries that see more men than women are Agriculture, Fishing & Hunting (100.0%), Mining, Quarrying, & Extraction (100.0%), and Construction (100.0%), whereas the industries that tend to have a higher number of women are Transportation & Warehousing (100.0%), Utilities (100.0%), and Professional & Scientific (100.0%).
| Industry | Male | Female |
| Agriculture, Fishing & Hunting | 7 (100.0%) | 0 (0.0%) |
| Mining, Quarrying, & Extraction | 5 (100.0%) | 0 (0.0%) |
| Construction | 4 (100.0%) | 0 (0.0%) |
| Manufacturing | 1 (100.0%) | 0 (0.0%) |
| Wholesale Trade | 0 (0.0%) | 0 (0.0%) |
| Retail Trade | 2 (100.0%) | 0 (0.0%) |
| Transportation & Warehousing | 0 (0.0%) | 2 (100.0%) |
| Utilities | 0 (0.0%) | 2 (100.0%) |
| Information | 0 (0.0%) | 0 (0.0%) |
| Finance & Insurance | 0 (0.0%) | 0 (0.0%) |
| Real Estate, Rental & Leasing | 0 (0.0%) | 0 (0.0%) |
| Professional & Scientific | 0 (0.0%) | 3 (100.0%) |
| Enterprise Management | 0 (0.0%) | 0 (0.0%) |
| Administrative & Support | 0 (0.0%) | 0 (0.0%) |
| Educational Services | 0 (0.0%) | 0 (0.0%) |
| Health Care & Social Assistance | 0 (0.0%) | 0 (0.0%) |
| Arts, Entertainment & Recreation | 0 (0.0%) | 0 (0.0%) |
| Accommodation & Food Services | 0 (0.0%) | 0 (0.0%) |
| Public Administration | 0 (0.0%) | 0 (0.0%) |
| Total | 19 (73.1%) | 7 (26.9%) |
Education in Coleharbor
School Enrollment in Coleharbor
The most common levels of schooling among the 4 students in Coleharbor are high school (2 | 50.0%), and college / undergraduate (2 | 50.0%).
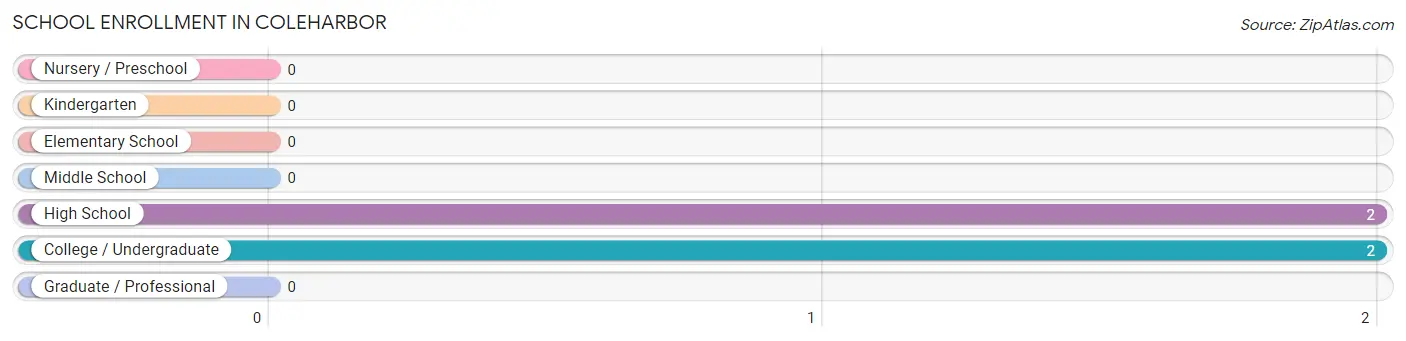
| School Level | # Students | % Students |
| Nursery / Preschool | 0 | 0.0% |
| Kindergarten | 0 | 0.0% |
| Elementary School | 0 | 0.0% |
| Middle School | 0 | 0.0% |
| High School | 2 | 50.0% |
| College / Undergraduate | 2 | 50.0% |
| Graduate / Professional | 0 | 0.0% |
| Total | 4 | 100.0% |
School Enrollment by Age by Funding Source in Coleharbor
Out of a total of 4 students who are enrolled in schools in Coleharbor, 2 (50.0%) attend a private institution, while the remaining 2 (50.0%) are enrolled in public schools. The age group of 35 years and over has the highest likelihood of being enrolled in private schools, with 2 (100.0% in the age bracket) enrolled. Conversely, the age group of 15 to 17 year olds has the lowest likelihood of being enrolled in a private school, with 2 (100.0% in the age bracket) attending a public institution.
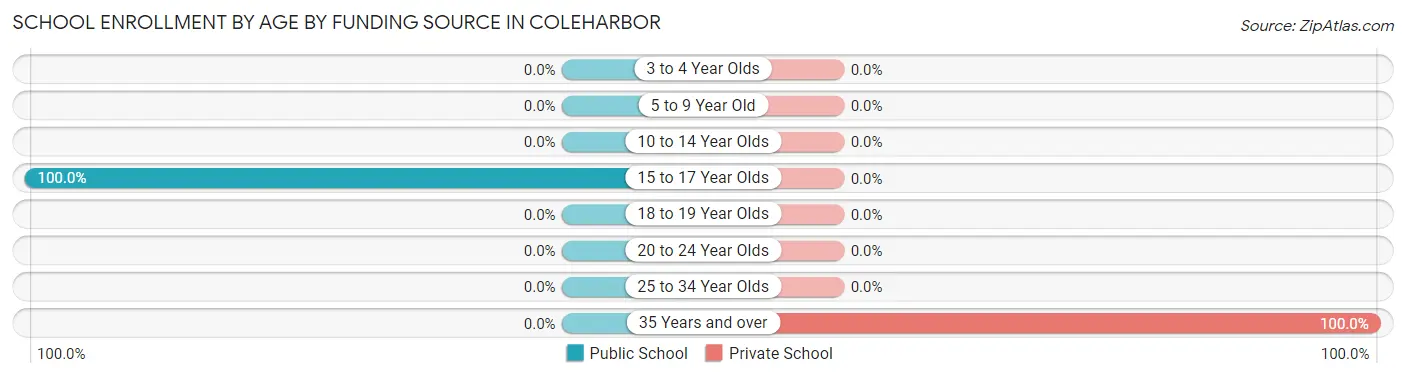
| Age Bracket | Public School | Private School |
| 3 to 4 Year Olds | 0 (0.0%) | 0 (0.0%) |
| 5 to 9 Year Old | 0 (0.0%) | 0 (0.0%) |
| 10 to 14 Year Olds | 0 (0.0%) | 0 (0.0%) |
| 15 to 17 Year Olds | 2 (100.0%) | 0 (0.0%) |
| 18 to 19 Year Olds | 0 (0.0%) | 0 (0.0%) |
| 20 to 24 Year Olds | 0 (0.0%) | 0 (0.0%) |
| 25 to 34 Year Olds | 0 (0.0%) | 0 (0.0%) |
| 35 Years and over | 0 (0.0%) | 2 (100.0%) |
| Total | 2 (50.0%) | 2 (50.0%) |
Educational Attainment by Field of Study in Coleharbor
, and bio, nature & agricultural (2 | 100.0%) are the most common fields of study among 2 individuals in Coleharbor who have obtained a bachelor's degree or higher.
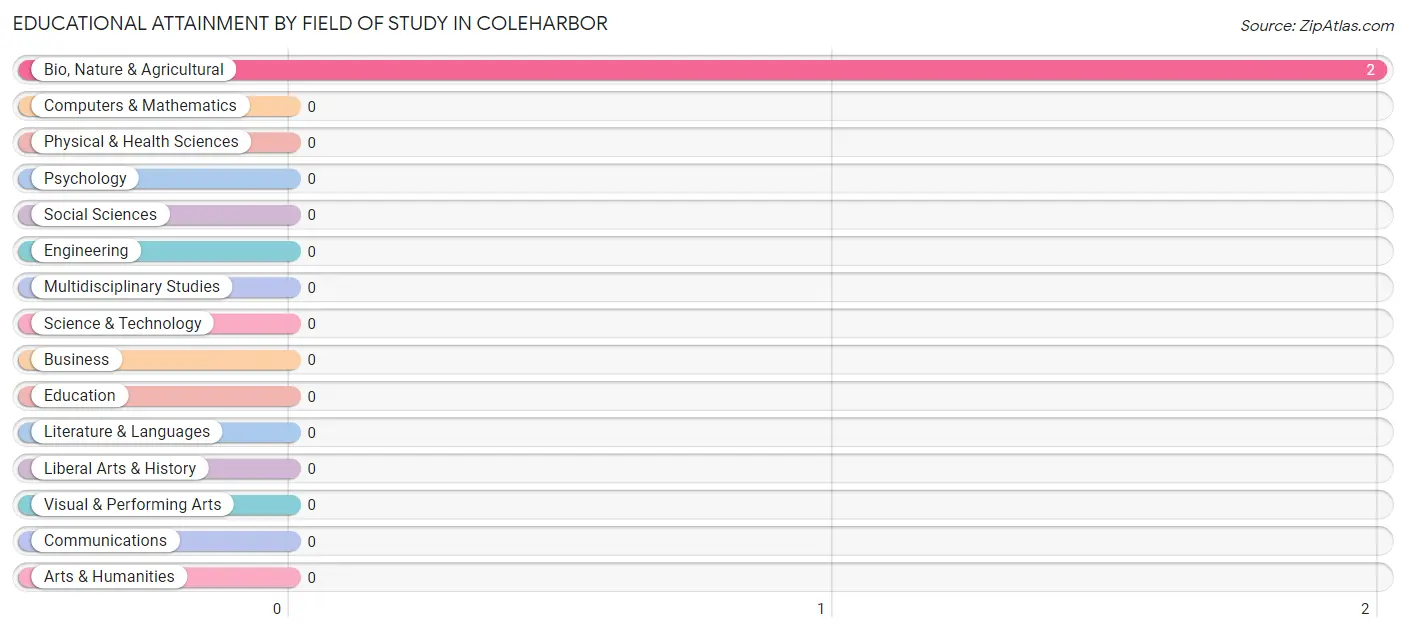
| Field of Study | # Graduates | % Graduates |
| Computers & Mathematics | 0 | 0.0% |
| Bio, Nature & Agricultural | 2 | 100.0% |
| Physical & Health Sciences | 0 | 0.0% |
| Psychology | 0 | 0.0% |
| Social Sciences | 0 | 0.0% |
| Engineering | 0 | 0.0% |
| Multidisciplinary Studies | 0 | 0.0% |
| Science & Technology | 0 | 0.0% |
| Business | 0 | 0.0% |
| Education | 0 | 0.0% |
| Literature & Languages | 0 | 0.0% |
| Liberal Arts & History | 0 | 0.0% |
| Visual & Performing Arts | 0 | 0.0% |
| Communications | 0 | 0.0% |
| Arts & Humanities | 0 | 0.0% |
| Total | 2 | 100.0% |
Transportation & Commute in Coleharbor
Vehicle Availability by Sex in Coleharbor
The most prevalent vehicle ownership categories in Coleharbor are males with 5 or more vehicles (9, accounting for 47.4%) and females with 5 or more vehicles (2, making up 128.6%).
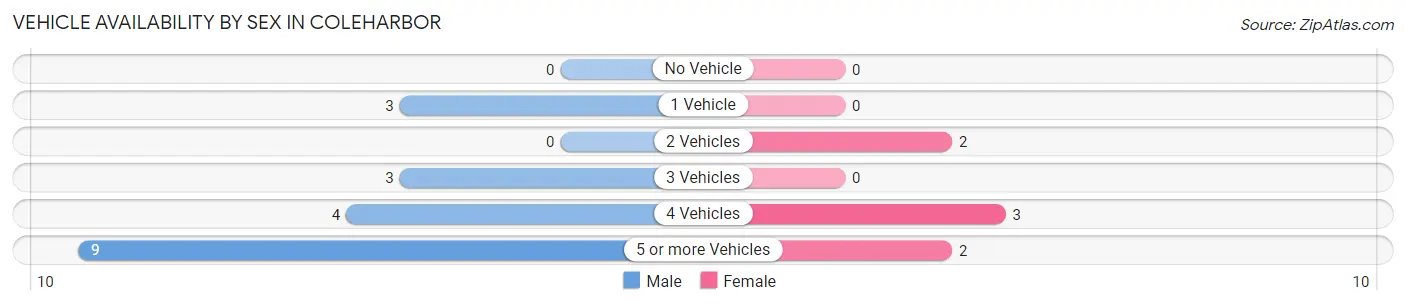
| Vehicles Available | Male | Female |
| No Vehicle | 0 (0.0%) | 0 (0.0%) |
| 1 Vehicle | 3 (15.8%) | 0 (0.0%) |
| 2 Vehicles | 0 (0.0%) | 2 (28.6%) |
| 3 Vehicles | 3 (15.8%) | 0 (0.0%) |
| 4 Vehicles | 4 (21.0%) | 3 (42.9%) |
| 5 or more Vehicles | 9 (47.4%) | 2 (28.6%) |
| Total | 19 (100.0%) | 7 (100.0%) |
Commute Time in Coleharbor
The most frequently occuring commute durations in Coleharbor are 5 to 9 minutes (5 commuters, 20.8%), 45 to 59 minutes (5 commuters, 20.8%), and 30 to 34 minutes (4 commuters, 16.7%).
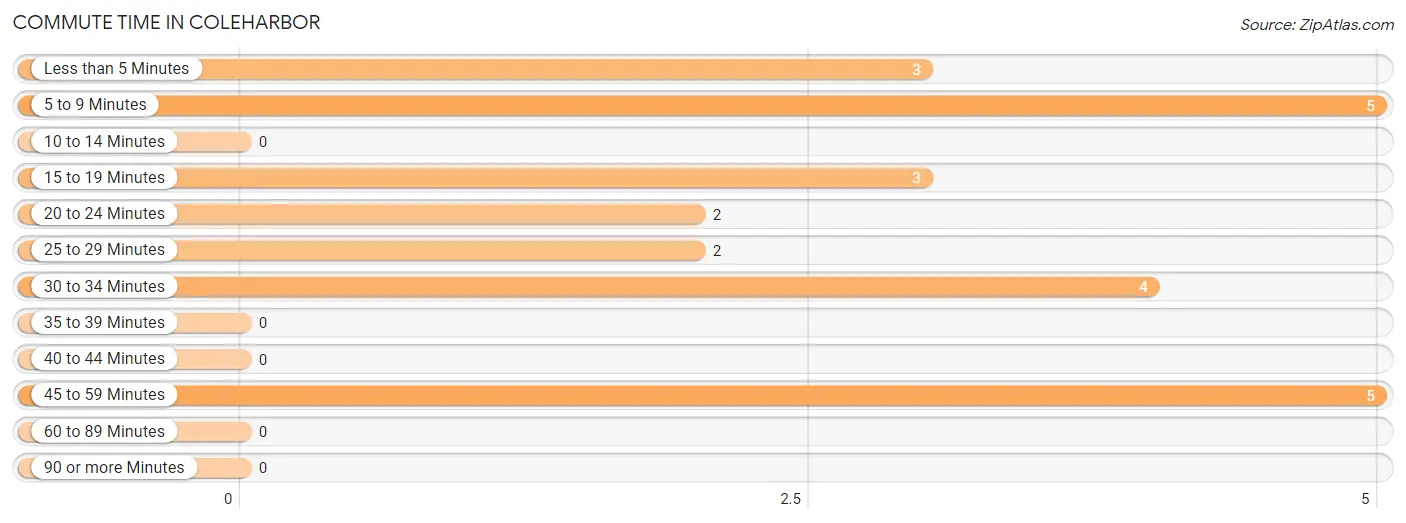
| Commute Time | # Commuters | % Commuters |
| Less than 5 Minutes | 3 | 12.5% |
| 5 to 9 Minutes | 5 | 20.8% |
| 10 to 14 Minutes | 0 | 0.0% |
| 15 to 19 Minutes | 3 | 12.5% |
| 20 to 24 Minutes | 2 | 8.3% |
| 25 to 29 Minutes | 2 | 8.3% |
| 30 to 34 Minutes | 4 | 16.7% |
| 35 to 39 Minutes | 0 | 0.0% |
| 40 to 44 Minutes | 0 | 0.0% |
| 45 to 59 Minutes | 5 | 20.8% |
| 60 to 89 Minutes | 0 | 0.0% |
| 90 or more Minutes | 0 | 0.0% |
Commute Time by Sex in Coleharbor
The most common commute times in Coleharbor are 45 to 59 minutes (5 commuters, 29.4%) for males and 5 to 9 minutes (5 commuters, 71.4%) for females.
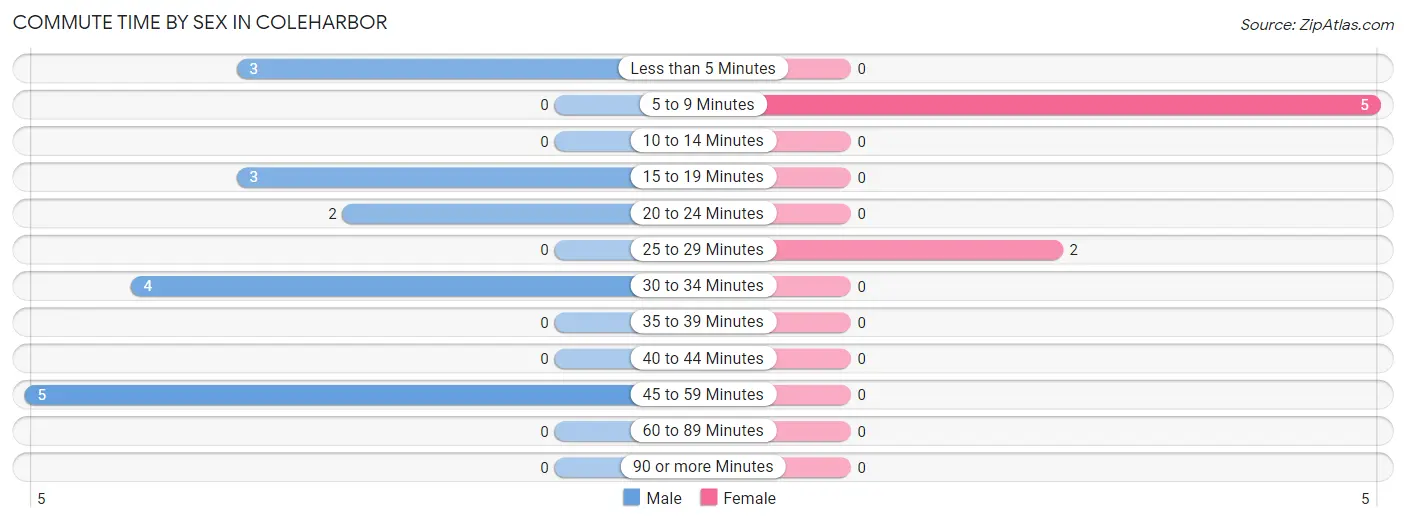
| Commute Time | Male | Female |
| Less than 5 Minutes | 3 (17.6%) | 0 (0.0%) |
| 5 to 9 Minutes | 0 (0.0%) | 5 (71.4%) |
| 10 to 14 Minutes | 0 (0.0%) | 0 (0.0%) |
| 15 to 19 Minutes | 3 (17.6%) | 0 (0.0%) |
| 20 to 24 Minutes | 2 (11.8%) | 0 (0.0%) |
| 25 to 29 Minutes | 0 (0.0%) | 2 (28.6%) |
| 30 to 34 Minutes | 4 (23.5%) | 0 (0.0%) |
| 35 to 39 Minutes | 0 (0.0%) | 0 (0.0%) |
| 40 to 44 Minutes | 0 (0.0%) | 0 (0.0%) |
| 45 to 59 Minutes | 5 (29.4%) | 0 (0.0%) |
| 60 to 89 Minutes | 0 (0.0%) | 0 (0.0%) |
| 90 or more Minutes | 0 (0.0%) | 0 (0.0%) |
Time of Departure to Work by Sex in Coleharbor
The most frequent times of departure to work in Coleharbor are 5:30 AM to 5:59 AM (4, 23.5%) for males and 7:00 AM to 7:29 AM (5, 71.4%) for females.
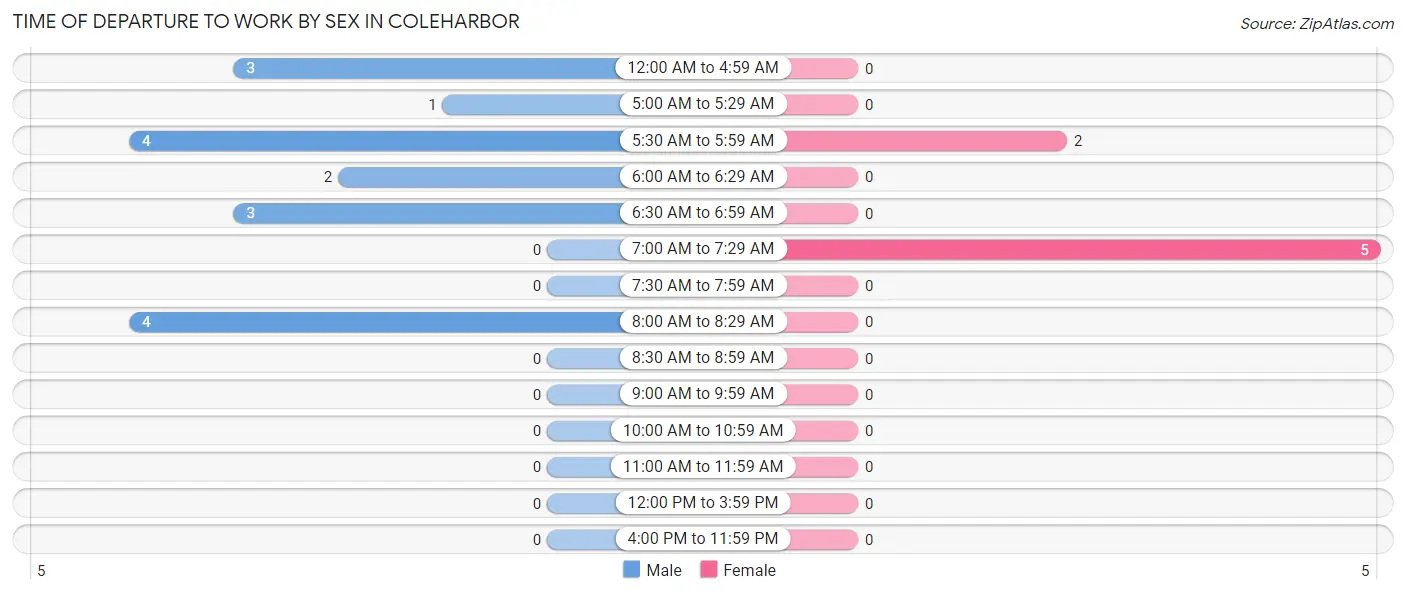
| Time of Departure | Male | Female |
| 12:00 AM to 4:59 AM | 3 (17.6%) | 0 (0.0%) |
| 5:00 AM to 5:29 AM | 1 (5.9%) | 0 (0.0%) |
| 5:30 AM to 5:59 AM | 4 (23.5%) | 2 (28.6%) |
| 6:00 AM to 6:29 AM | 2 (11.8%) | 0 (0.0%) |
| 6:30 AM to 6:59 AM | 3 (17.6%) | 0 (0.0%) |
| 7:00 AM to 7:29 AM | 0 (0.0%) | 5 (71.4%) |
| 7:30 AM to 7:59 AM | 0 (0.0%) | 0 (0.0%) |
| 8:00 AM to 8:29 AM | 4 (23.5%) | 0 (0.0%) |
| 8:30 AM to 8:59 AM | 0 (0.0%) | 0 (0.0%) |
| 9:00 AM to 9:59 AM | 0 (0.0%) | 0 (0.0%) |
| 10:00 AM to 10:59 AM | 0 (0.0%) | 0 (0.0%) |
| 11:00 AM to 11:59 AM | 0 (0.0%) | 0 (0.0%) |
| 12:00 PM to 3:59 PM | 0 (0.0%) | 0 (0.0%) |
| 4:00 PM to 11:59 PM | 0 (0.0%) | 0 (0.0%) |
| Total | 17 (100.0%) | 7 (100.0%) |
Housing Occupancy in Coleharbor
Occupancy by Ownership in Coleharbor
Of the total 47 dwellings in Coleharbor, owner-occupied units account for 47 (100.0%), while renter-occupied units make up 0 (0.0%).
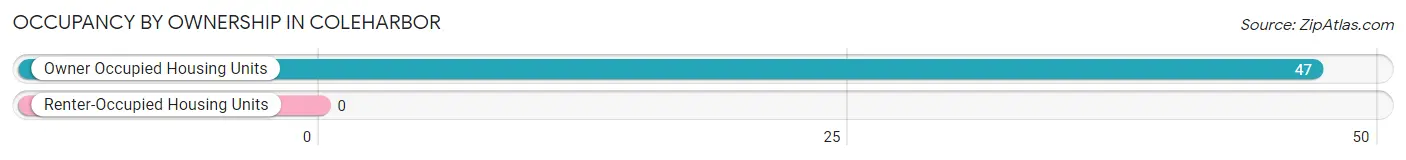
| Occupancy | # Housing Units | % Housing Units |
| Owner Occupied Housing Units | 47 | 100.0% |
| Renter-Occupied Housing Units | 0 | 0.0% |
| Total Occupied Housing Units | 47 | 100.0% |
Occupancy by Household Size in Coleharbor
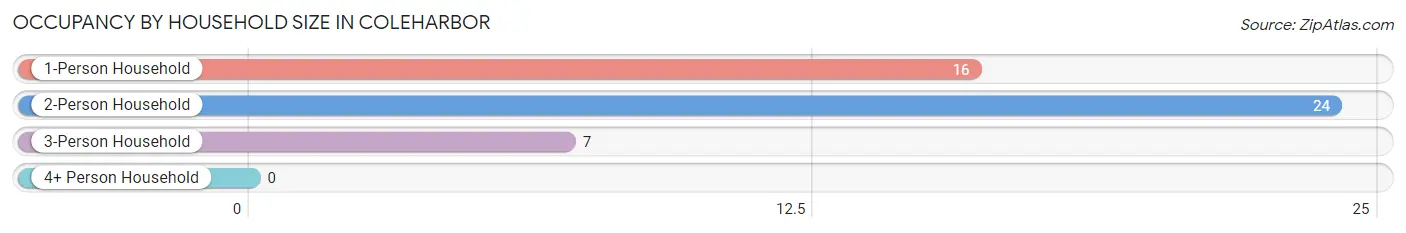
| Household Size | # Housing Units | % Housing Units |
| 1-Person Household | 16 | 34.0% |
| 2-Person Household | 24 | 51.1% |
| 3-Person Household | 7 | 14.9% |
| 4+ Person Household | 0 | 0.0% |
| Total Housing Units | 47 | 100.0% |
Occupancy by Ownership by Household Size in Coleharbor
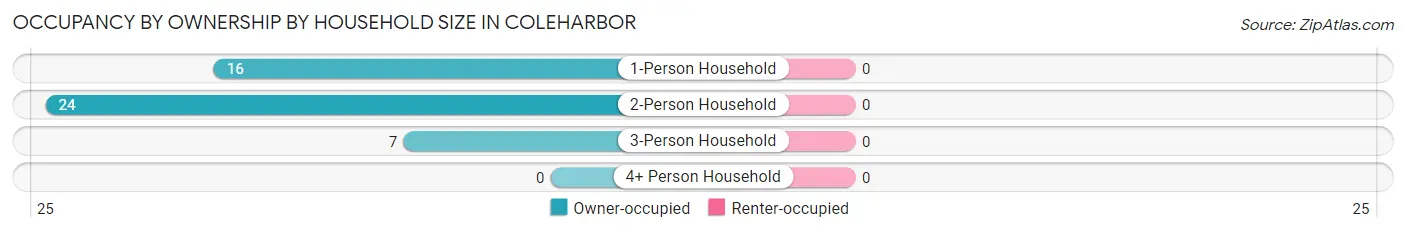
| Household Size | Owner-occupied | Renter-occupied |
| 1-Person Household | 16 (100.0%) | 0 (0.0%) |
| 2-Person Household | 24 (100.0%) | 0 (0.0%) |
| 3-Person Household | 7 (100.0%) | 0 (0.0%) |
| 4+ Person Household | 0 (0.0%) | 0 (0.0%) |
| Total Housing Units | 47 (100.0%) | 0 (0.0%) |
Occupancy by Educational Attainment in Coleharbor
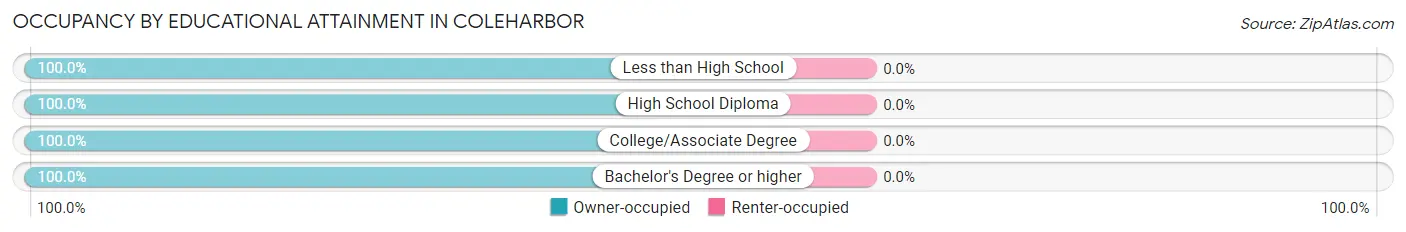
| Household Size | Owner-occupied | Renter-occupied |
| Less than High School | 2 (100.0%) | 0 (0.0%) |
| High School Diploma | 24 (100.0%) | 0 (0.0%) |
| College/Associate Degree | 19 (100.0%) | 0 (0.0%) |
| Bachelor's Degree or higher | 2 (100.0%) | 0 (0.0%) |
Occupancy by Age of Householder in Coleharbor
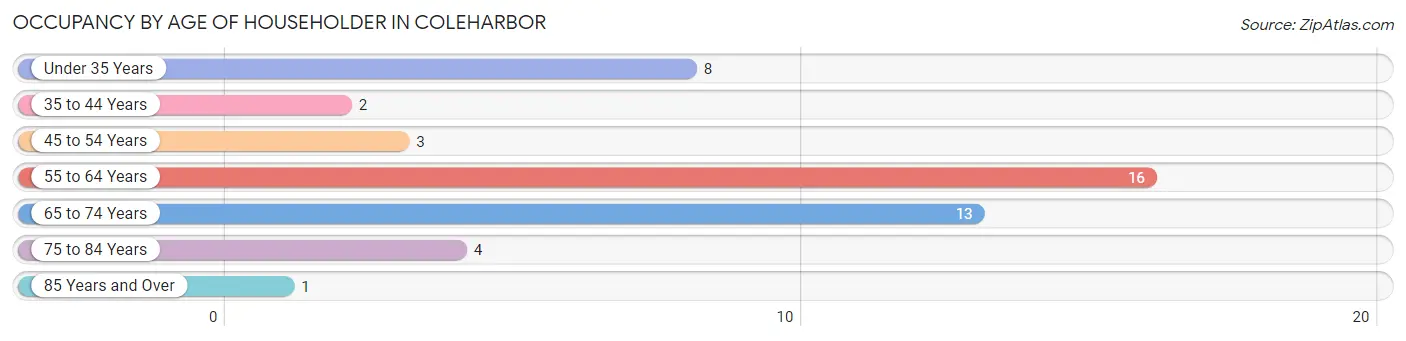
| Age Bracket | # Households | % Households |
| Under 35 Years | 8 | 17.0% |
| 35 to 44 Years | 2 | 4.3% |
| 45 to 54 Years | 3 | 6.4% |
| 55 to 64 Years | 16 | 34.0% |
| 65 to 74 Years | 13 | 27.7% |
| 75 to 84 Years | 4 | 8.5% |
| 85 Years and Over | 1 | 2.1% |
| Total | 47 | 100.0% |
Housing Finances in Coleharbor
Median Income by Occupancy in Coleharbor
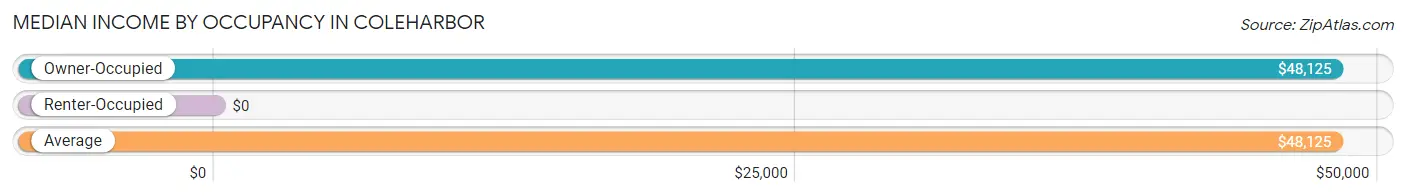
| Occupancy Type | # Households | Median Income |
| Owner-Occupied | 47 (100.0%) | $48,125 |
| Renter-Occupied | 0 (0.0%) | $0 |
| Average | 47 (100.0%) | $48,125 |
Occupancy by Householder Income Bracket in Coleharbor
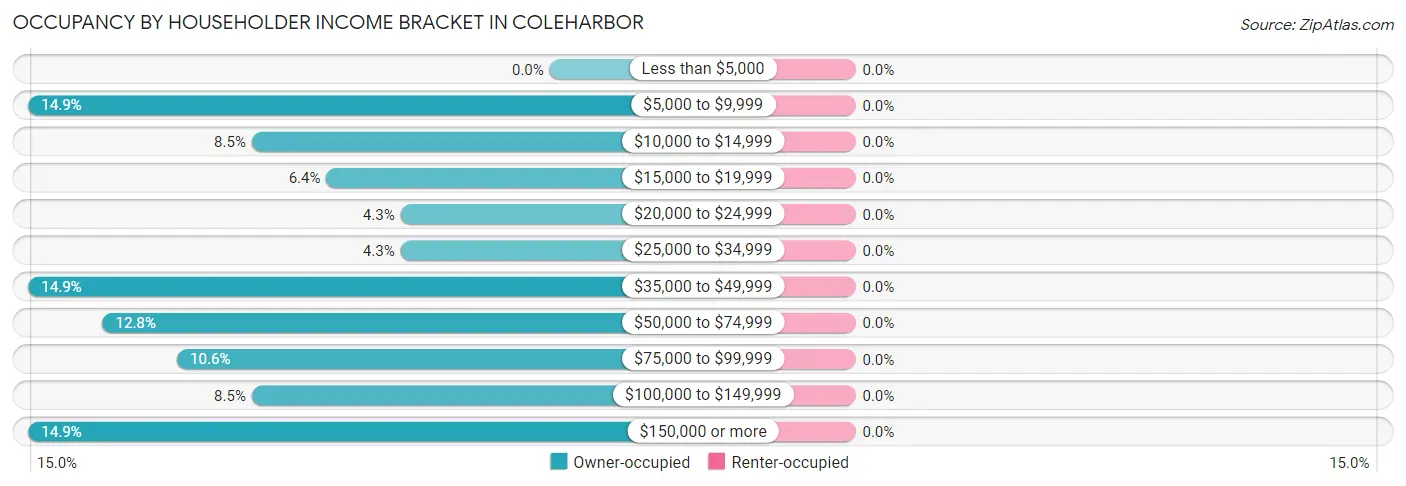
| Income Bracket | Owner-occupied | Renter-occupied |
| Less than $5,000 | 0 (0.0%) | 0 (0.0%) |
| $5,000 to $9,999 | 7 (14.9%) | 0 (0.0%) |
| $10,000 to $14,999 | 4 (8.5%) | 0 (0.0%) |
| $15,000 to $19,999 | 3 (6.4%) | 0 (0.0%) |
| $20,000 to $24,999 | 2 (4.3%) | 0 (0.0%) |
| $25,000 to $34,999 | 2 (4.3%) | 0 (0.0%) |
| $35,000 to $49,999 | 7 (14.9%) | 0 (0.0%) |
| $50,000 to $74,999 | 6 (12.8%) | 0 (0.0%) |
| $75,000 to $99,999 | 5 (10.6%) | 0 (0.0%) |
| $100,000 to $149,999 | 4 (8.5%) | 0 (0.0%) |
| $150,000 or more | 7 (14.9%) | 0 (0.0%) |
| Total | 47 (100.0%) | 0 (0.0%) |
Monthly Housing Cost Tiers in Coleharbor
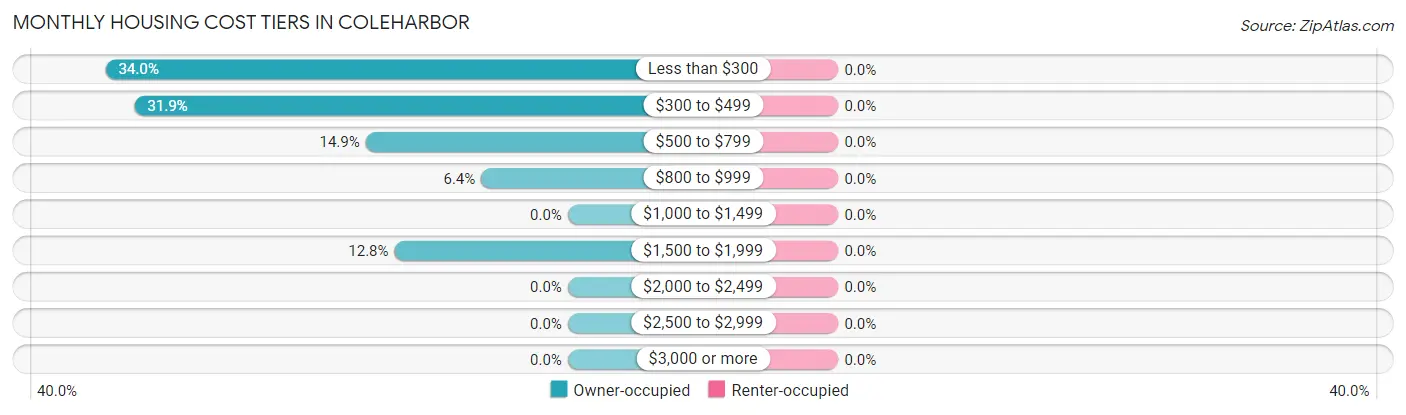
| Monthly Cost | Owner-occupied | Renter-occupied |
| Less than $300 | 16 (34.0%) | 0 (0.0%) |
| $300 to $499 | 15 (31.9%) | 0 (0.0%) |
| $500 to $799 | 7 (14.9%) | 0 (0.0%) |
| $800 to $999 | 3 (6.4%) | 0 (0.0%) |
| $1,000 to $1,499 | 0 (0.0%) | 0 (0.0%) |
| $1,500 to $1,999 | 6 (12.8%) | 0 (0.0%) |
| $2,000 to $2,499 | 0 (0.0%) | 0 (0.0%) |
| $2,500 to $2,999 | 0 (0.0%) | 0 (0.0%) |
| $3,000 or more | 0 (0.0%) | 0 (0.0%) |
| Total | 47 (100.0%) | 0 (0.0%) |
Physical Housing Characteristics in Coleharbor
Housing Structures in Coleharbor
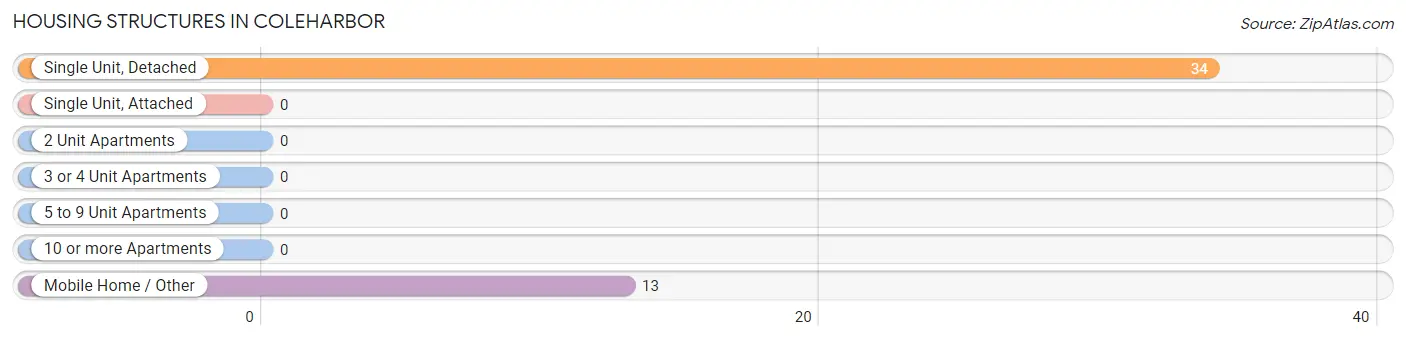
| Structure Type | # Housing Units | % Housing Units |
| Single Unit, Detached | 34 | 72.3% |
| Single Unit, Attached | 0 | 0.0% |
| 2 Unit Apartments | 0 | 0.0% |
| 3 or 4 Unit Apartments | 0 | 0.0% |
| 5 to 9 Unit Apartments | 0 | 0.0% |
| 10 or more Apartments | 0 | 0.0% |
| Mobile Home / Other | 13 | 27.7% |
| Total | 47 | 100.0% |
Housing Structures by Occupancy in Coleharbor
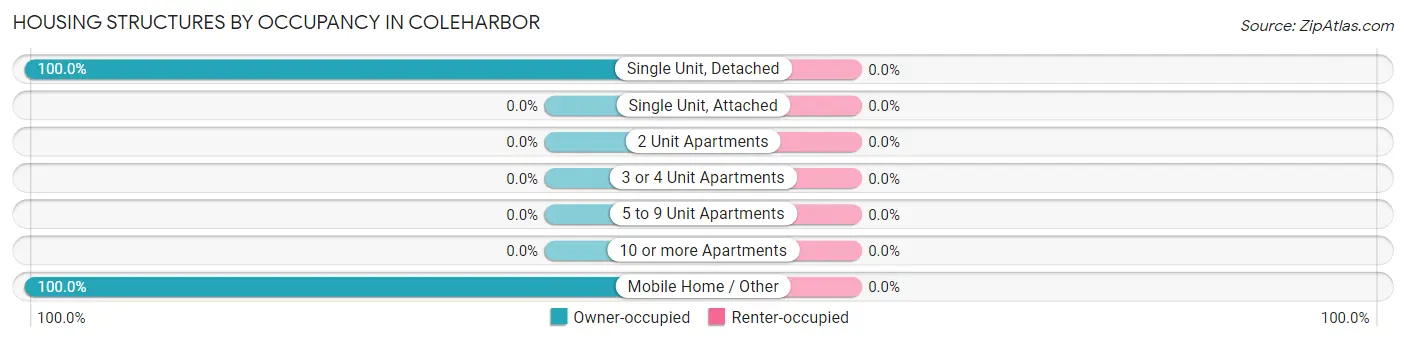
| Structure Type | Owner-occupied | Renter-occupied |
| Single Unit, Detached | 34 (100.0%) | 0 (0.0%) |
| Single Unit, Attached | 0 (0.0%) | 0 (0.0%) |
| 2 Unit Apartments | 0 (0.0%) | 0 (0.0%) |
| 3 or 4 Unit Apartments | 0 (0.0%) | 0 (0.0%) |
| 5 to 9 Unit Apartments | 0 (0.0%) | 0 (0.0%) |
| 10 or more Apartments | 0 (0.0%) | 0 (0.0%) |
| Mobile Home / Other | 13 (100.0%) | 0 (0.0%) |
| Total | 47 (100.0%) | 0 (0.0%) |
Housing Structures by Number of Rooms in Coleharbor
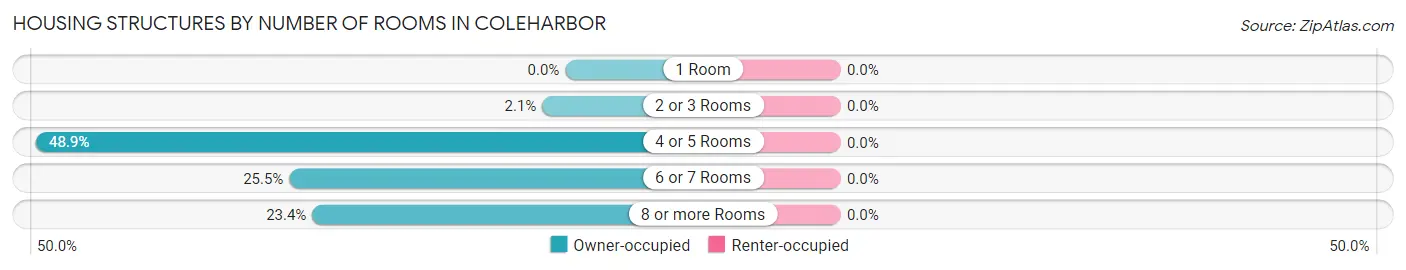
| Number of Rooms | Owner-occupied | Renter-occupied |
| 1 Room | 0 (0.0%) | 0 (0.0%) |
| 2 or 3 Rooms | 1 (2.1%) | 0 (0.0%) |
| 4 or 5 Rooms | 23 (48.9%) | 0 (0.0%) |
| 6 or 7 Rooms | 12 (25.5%) | 0 (0.0%) |
| 8 or more Rooms | 11 (23.4%) | 0 (0.0%) |
| Total | 47 (100.0%) | 0 (0.0%) |
Housing Structure by Heating Type in Coleharbor
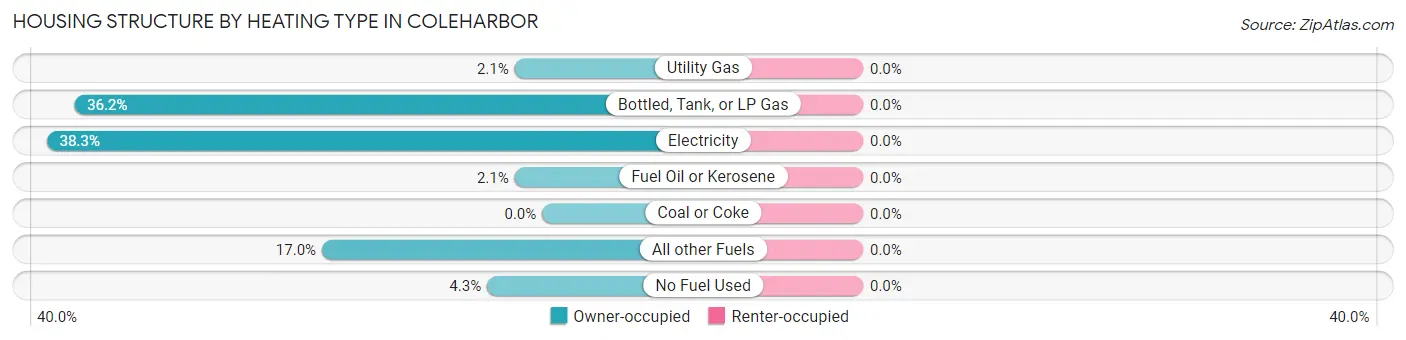
| Heating Type | Owner-occupied | Renter-occupied |
| Utility Gas | 1 (2.1%) | 0 (0.0%) |
| Bottled, Tank, or LP Gas | 17 (36.2%) | 0 (0.0%) |
| Electricity | 18 (38.3%) | 0 (0.0%) |
| Fuel Oil or Kerosene | 1 (2.1%) | 0 (0.0%) |
| Coal or Coke | 0 (0.0%) | 0 (0.0%) |
| All other Fuels | 8 (17.0%) | 0 (0.0%) |
| No Fuel Used | 2 (4.3%) | 0 (0.0%) |
| Total | 47 (100.0%) | 0 (0.0%) |
Household Vehicle Usage in Coleharbor
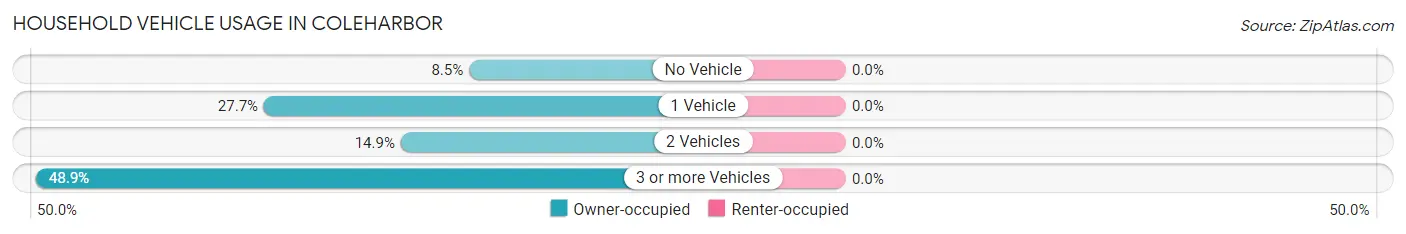
| Vehicles per Household | Owner-occupied | Renter-occupied |
| No Vehicle | 4 (8.5%) | 0 (0.0%) |
| 1 Vehicle | 13 (27.7%) | 0 (0.0%) |
| 2 Vehicles | 7 (14.9%) | 0 (0.0%) |
| 3 or more Vehicles | 23 (48.9%) | 0 (0.0%) |
| Total | 47 (100.0%) | 0 (0.0%) |
Real Estate & Mortgages in Coleharbor
Real Estate and Mortgage Overview in Coleharbor
| Characteristic | Without Mortgage | With Mortgage |
| Housing Units | 40 | 7 |
| Median Property Value | - | - |
| Median Household Income | $48,750 | $2 |
| Monthly Housing Costs | $314 | $0 |
| Real Estate Taxes | $371 | $0 |
Property Value by Mortgage Status in Coleharbor
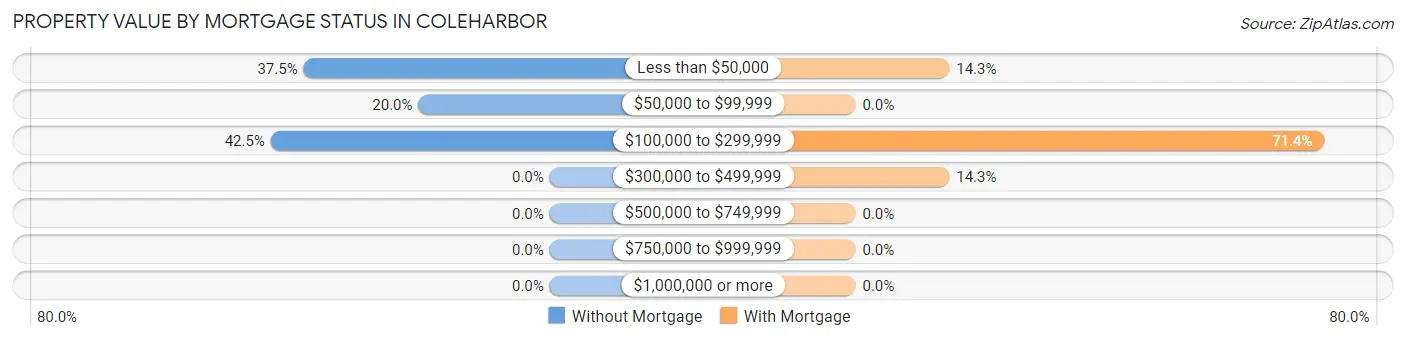
| Property Value | Without Mortgage | With Mortgage |
| Less than $50,000 | 15 (37.5%) | 1 (14.3%) |
| $50,000 to $99,999 | 8 (20.0%) | 0 (0.0%) |
| $100,000 to $299,999 | 17 (42.5%) | 5 (71.4%) |
| $300,000 to $499,999 | 0 (0.0%) | 1 (14.3%) |
| $500,000 to $749,999 | 0 (0.0%) | 0 (0.0%) |
| $750,000 to $999,999 | 0 (0.0%) | 0 (0.0%) |
| $1,000,000 or more | 0 (0.0%) | 0 (0.0%) |
| Total | 40 (100.0%) | 7 (100.0%) |
Household Income by Mortgage Status in Coleharbor
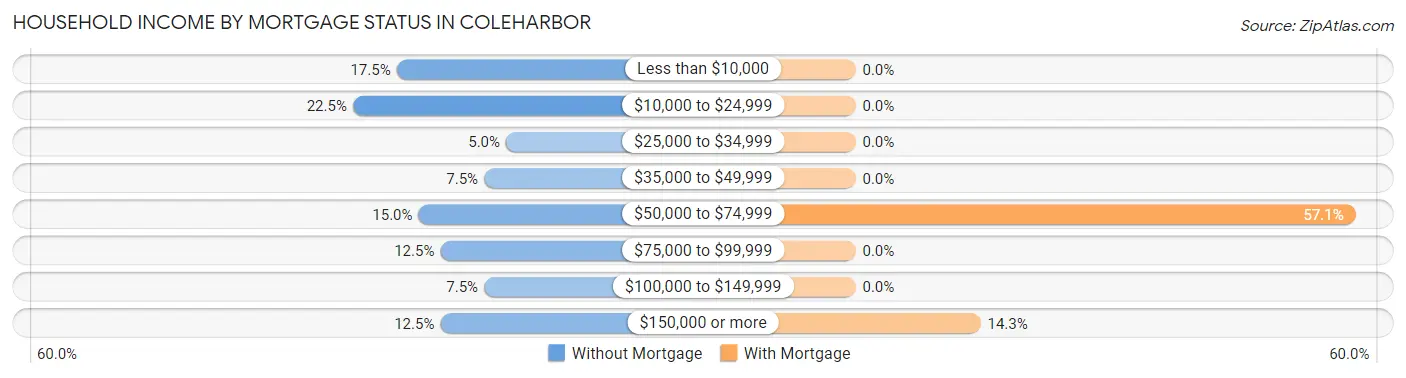
| Household Income | Without Mortgage | With Mortgage |
| Less than $10,000 | 7 (17.5%) | 0 (0.0%) |
| $10,000 to $24,999 | 9 (22.5%) | 0 (0.0%) |
| $25,000 to $34,999 | 2 (5.0%) | 0 (0.0%) |
| $35,000 to $49,999 | 3 (7.5%) | 0 (0.0%) |
| $50,000 to $74,999 | 6 (15.0%) | 4 (57.1%) |
| $75,000 to $99,999 | 5 (12.5%) | 0 (0.0%) |
| $100,000 to $149,999 | 3 (7.5%) | 0 (0.0%) |
| $150,000 or more | 5 (12.5%) | 1 (14.3%) |
| Total | 40 (100.0%) | 7 (100.0%) |
Property Value to Household Income Ratio in Coleharbor
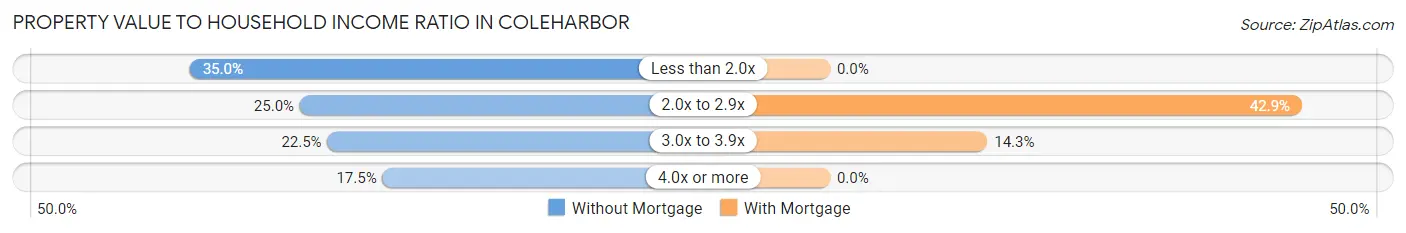
| Value-to-Income Ratio | Without Mortgage | With Mortgage |
| Less than 2.0x | 14 (35.0%) | 0 (0.0%) |
| 2.0x to 2.9x | 10 (25.0%) | 3 (42.9%) |
| 3.0x to 3.9x | 9 (22.5%) | 1 (14.3%) |
| 4.0x or more | 7 (17.5%) | 0 (0.0%) |
| Total | 40 (100.0%) | 7 (100.0%) |
Real Estate Taxes by Mortgage Status in Coleharbor
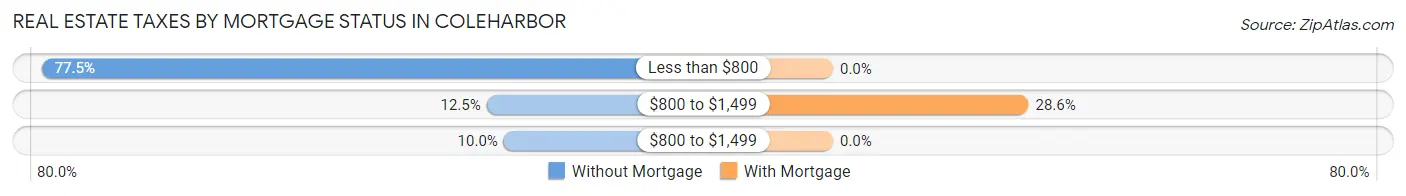
| Property Taxes | Without Mortgage | With Mortgage |
| Less than $800 | 31 (77.5%) | 0 (0.0%) |
| $800 to $1,499 | 5 (12.5%) | 2 (28.6%) |
| $800 to $1,499 | 4 (10.0%) | 0 (0.0%) |
| Total | 40 (100.0%) | 7 (100.0%) |
Health & Disability in Coleharbor
Health Insurance Coverage by Age in Coleharbor
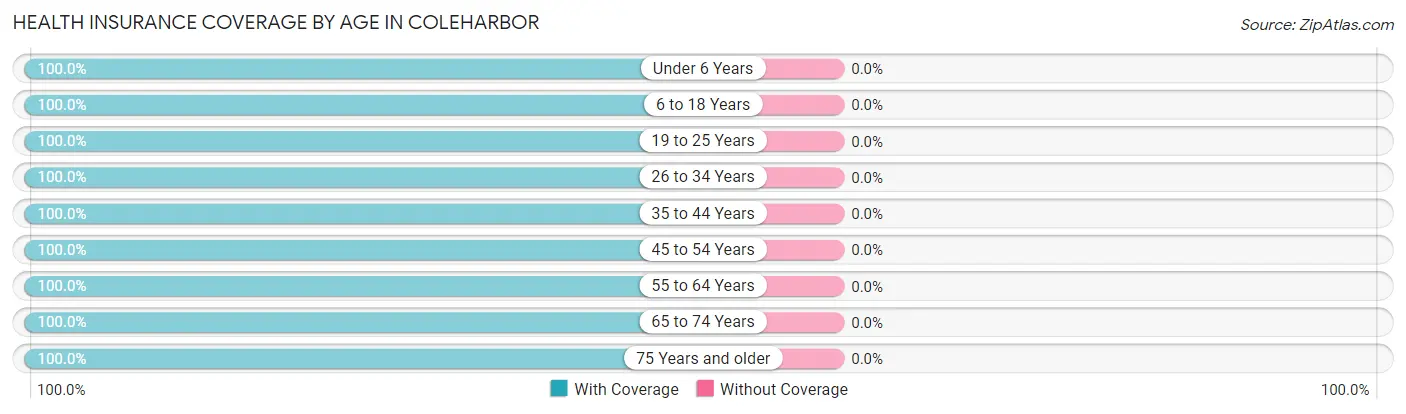
| Age Bracket | With Coverage | Without Coverage |
| Under 6 Years | 2 (100.0%) | 0 (0.0%) |
| 6 to 18 Years | 2 (100.0%) | 0 (0.0%) |
| 19 to 25 Years | 6 (100.0%) | 0 (0.0%) |
| 26 to 34 Years | 11 (100.0%) | 0 (0.0%) |
| 35 to 44 Years | 2 (100.0%) | 0 (0.0%) |
| 45 to 54 Years | 5 (100.0%) | 0 (0.0%) |
| 55 to 64 Years | 18 (100.0%) | 0 (0.0%) |
| 65 to 74 Years | 26 (100.0%) | 0 (0.0%) |
| 75 Years and older | 17 (100.0%) | 0 (0.0%) |
| Total | 89 (100.0%) | 0 (0.0%) |
Health Insurance Coverage by Citizenship Status in Coleharbor
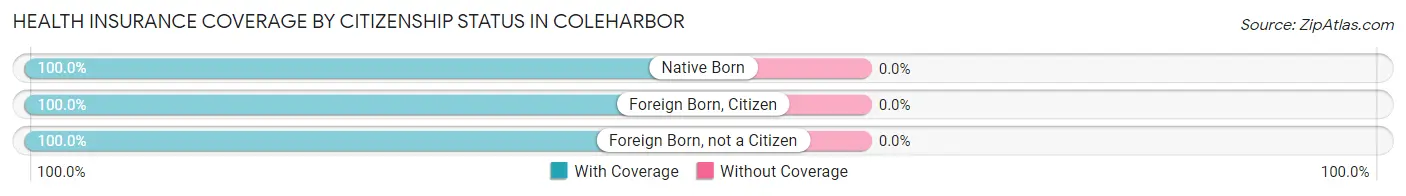
| Citizenship Status | With Coverage | Without Coverage |
| Native Born | 2 (100.0%) | 0 (0.0%) |
| Foreign Born, Citizen | 2 (100.0%) | 0 (0.0%) |
| Foreign Born, not a Citizen | 6 (100.0%) | 0 (0.0%) |
Health Insurance Coverage by Household Income in Coleharbor
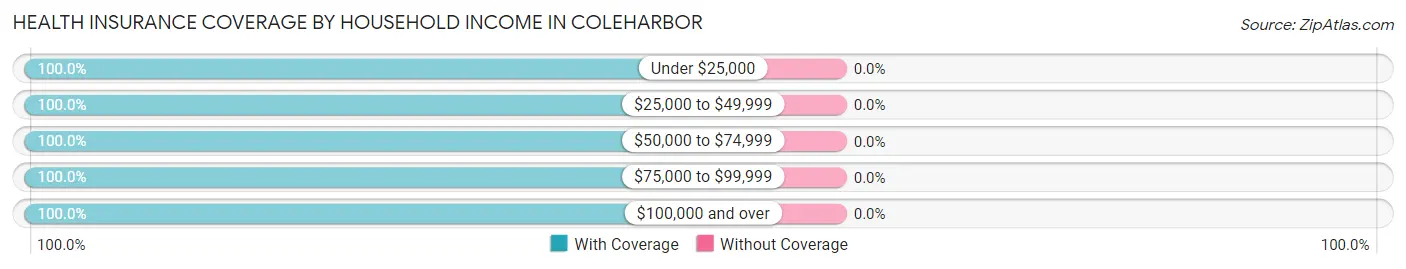
| Household Income | With Coverage | Without Coverage |
| Under $25,000 | 23 (100.0%) | 0 (0.0%) |
| $25,000 to $49,999 | 14 (100.0%) | 0 (0.0%) |
| $50,000 to $74,999 | 18 (100.0%) | 0 (0.0%) |
| $75,000 to $99,999 | 12 (100.0%) | 0 (0.0%) |
| $100,000 and over | 22 (100.0%) | 0 (0.0%) |
Public vs Private Health Insurance Coverage by Age in Coleharbor
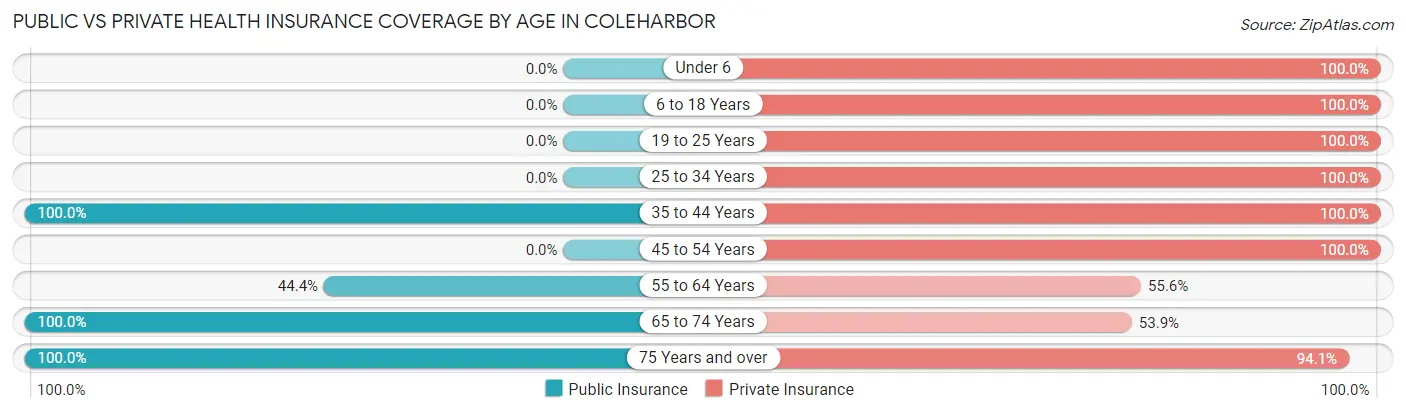
| Age Bracket | Public Insurance | Private Insurance |
| Under 6 | 0 (0.0%) | 2 (100.0%) |
| 6 to 18 Years | 0 (0.0%) | 2 (100.0%) |
| 19 to 25 Years | 0 (0.0%) | 6 (100.0%) |
| 25 to 34 Years | 0 (0.0%) | 11 (100.0%) |
| 35 to 44 Years | 2 (100.0%) | 2 (100.0%) |
| 45 to 54 Years | 0 (0.0%) | 5 (100.0%) |
| 55 to 64 Years | 8 (44.4%) | 10 (55.6%) |
| 65 to 74 Years | 26 (100.0%) | 14 (53.8%) |
| 75 Years and over | 17 (100.0%) | 16 (94.1%) |
| Total | 53 (59.6%) | 68 (76.4%) |
Disability Status by Sex by Age in Coleharbor
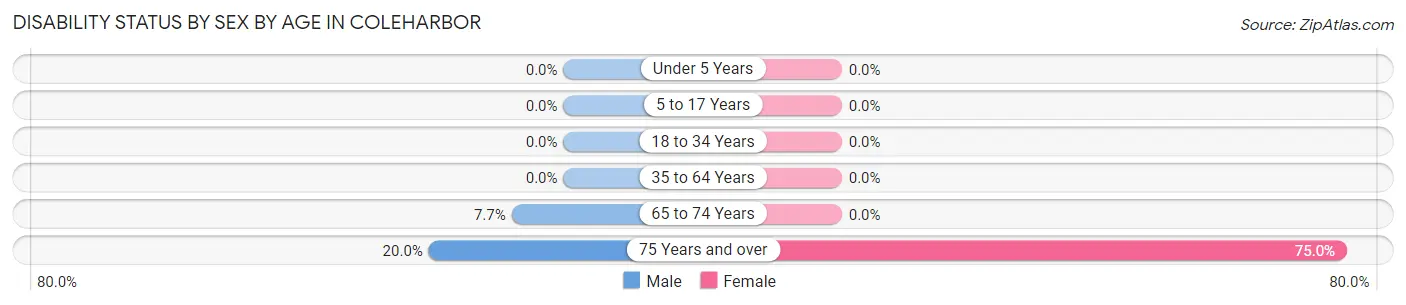
| Age Bracket | Male | Female |
| Under 5 Years | 0 (0.0%) | 0 (0.0%) |
| 5 to 17 Years | 0 (0.0%) | 0 (0.0%) |
| 18 to 34 Years | 0 (0.0%) | 0 (0.0%) |
| 35 to 64 Years | 0 (0.0%) | 0 (0.0%) |
| 65 to 74 Years | 1 (7.7%) | 0 (0.0%) |
| 75 Years and over | 1 (20.0%) | 9 (75.0%) |
Disability Class by Sex by Age in Coleharbor
Disability Class: Hearing Difficulty
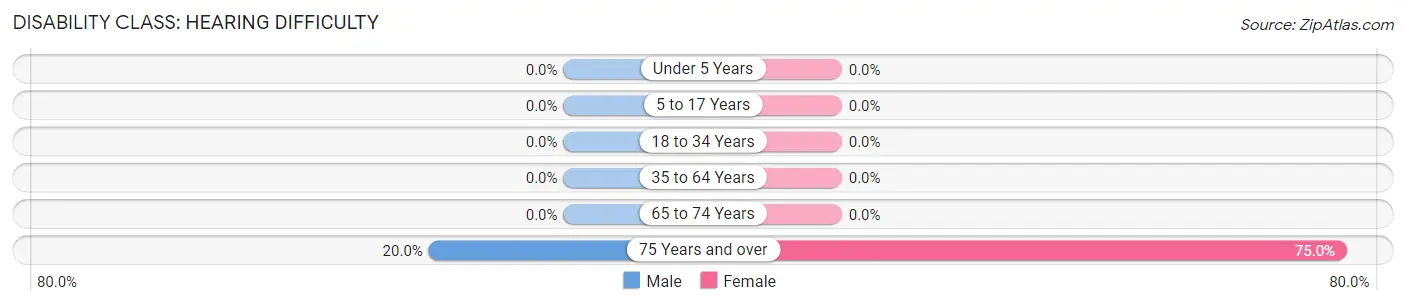
| Age Bracket | Male | Female |
| Under 5 Years | 0 (0.0%) | 0 (0.0%) |
| 5 to 17 Years | 0 (0.0%) | 0 (0.0%) |
| 18 to 34 Years | 0 (0.0%) | 0 (0.0%) |
| 35 to 64 Years | 0 (0.0%) | 0 (0.0%) |
| 65 to 74 Years | 0 (0.0%) | 0 (0.0%) |
| 75 Years and over | 1 (20.0%) | 9 (75.0%) |
Disability Class: Vision Difficulty
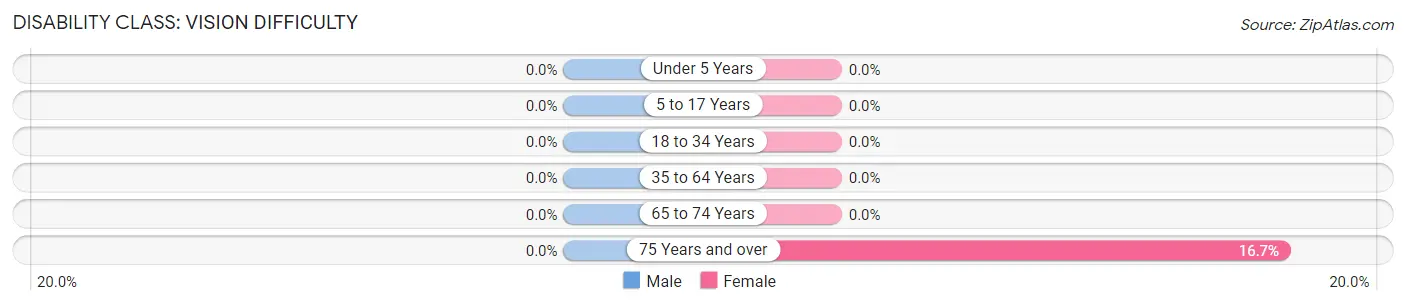
| Age Bracket | Male | Female |
| Under 5 Years | 0 (0.0%) | 0 (0.0%) |
| 5 to 17 Years | 0 (0.0%) | 0 (0.0%) |
| 18 to 34 Years | 0 (0.0%) | 0 (0.0%) |
| 35 to 64 Years | 0 (0.0%) | 0 (0.0%) |
| 65 to 74 Years | 0 (0.0%) | 0 (0.0%) |
| 75 Years and over | 0 (0.0%) | 2 (16.7%) |
Disability Class: Cognitive Difficulty
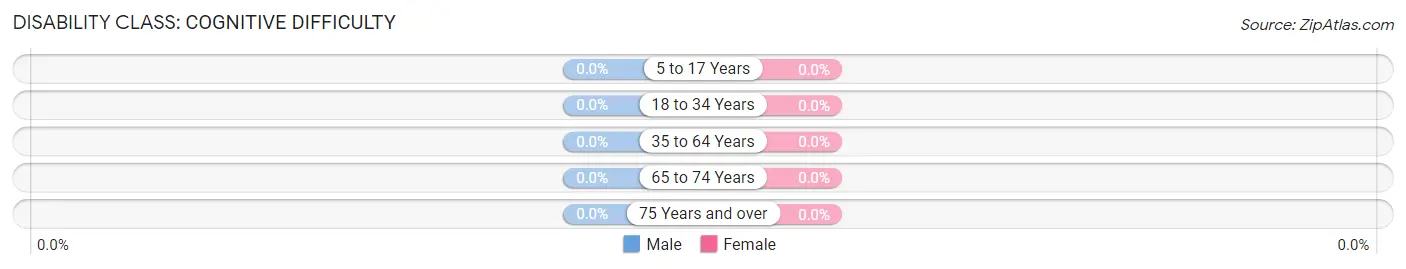
| Age Bracket | Male | Female |
| 5 to 17 Years | 0 (0.0%) | 0 (0.0%) |
| 18 to 34 Years | 0 (0.0%) | 0 (0.0%) |
| 35 to 64 Years | 0 (0.0%) | 0 (0.0%) |
| 65 to 74 Years | 0 (0.0%) | 0 (0.0%) |
| 75 Years and over | 0 (0.0%) | 0 (0.0%) |
Disability Class: Ambulatory Difficulty
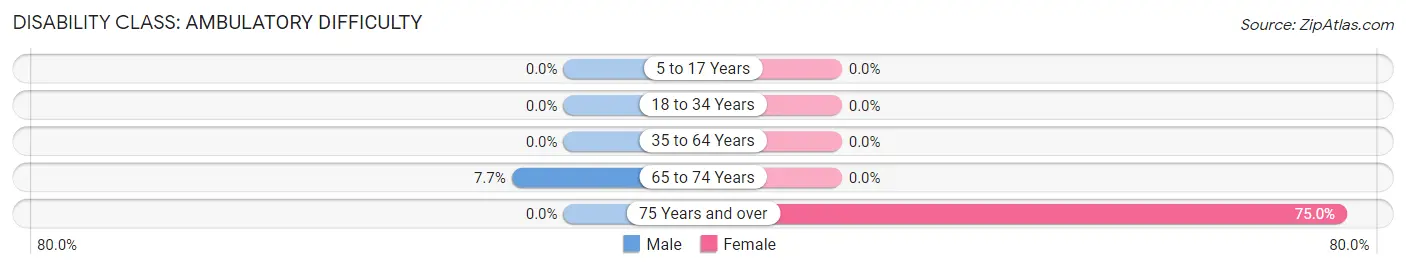
| Age Bracket | Male | Female |
| 5 to 17 Years | 0 (0.0%) | 0 (0.0%) |
| 18 to 34 Years | 0 (0.0%) | 0 (0.0%) |
| 35 to 64 Years | 0 (0.0%) | 0 (0.0%) |
| 65 to 74 Years | 1 (7.7%) | 0 (0.0%) |
| 75 Years and over | 0 (0.0%) | 9 (75.0%) |
Disability Class: Self-Care Difficulty
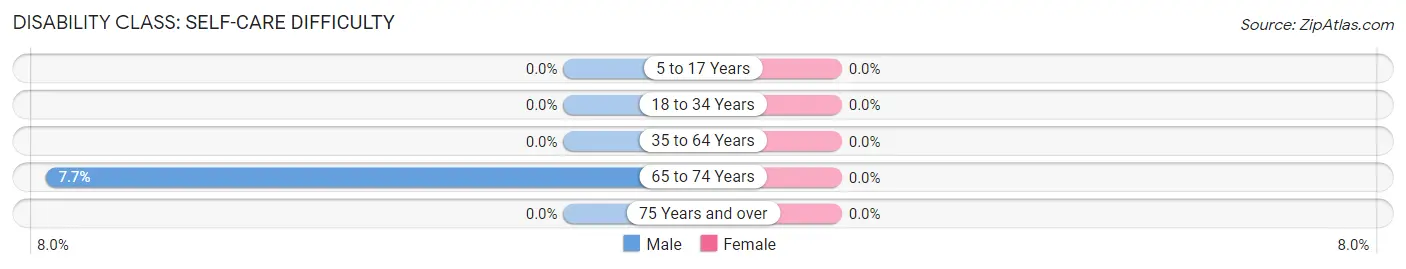
| Age Bracket | Male | Female |
| 5 to 17 Years | 0 (0.0%) | 0 (0.0%) |
| 18 to 34 Years | 0 (0.0%) | 0 (0.0%) |
| 35 to 64 Years | 0 (0.0%) | 0 (0.0%) |
| 65 to 74 Years | 1 (7.7%) | 0 (0.0%) |
| 75 Years and over | 0 (0.0%) | 0 (0.0%) |
Technology Access in Coleharbor
Computing Device Access in Coleharbor
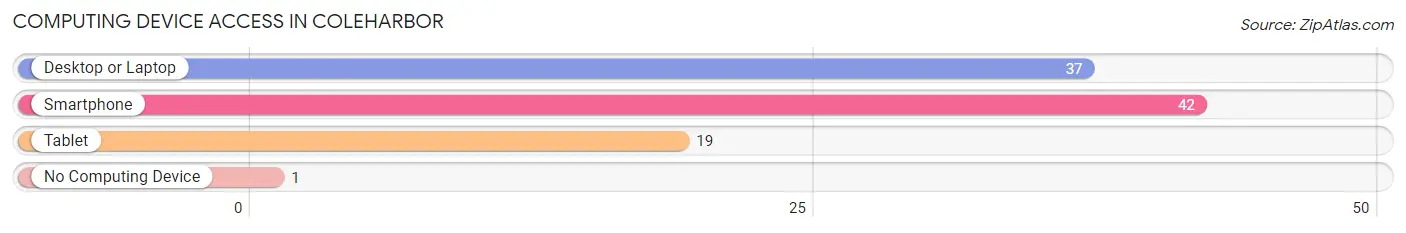
| Device Type | # Households | % Households |
| Desktop or Laptop | 37 | 78.7% |
| Smartphone | 42 | 89.4% |
| Tablet | 19 | 40.4% |
| No Computing Device | 1 | 2.1% |
| Total | 47 | 100.0% |
Internet Access in Coleharbor
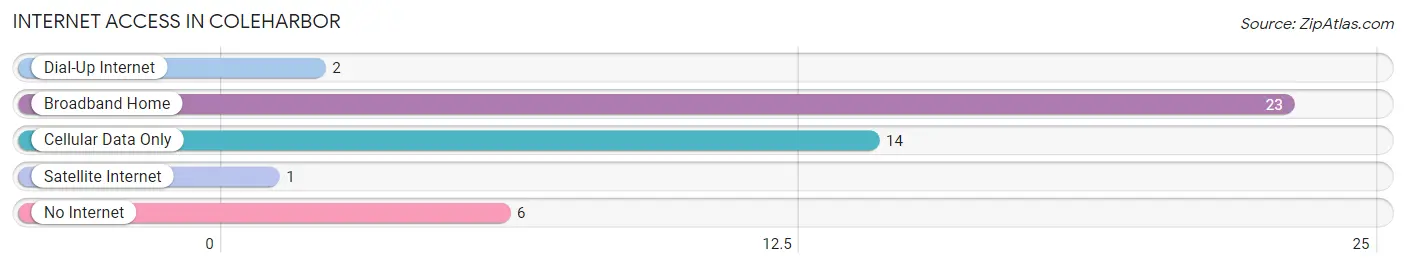
| Internet Type | # Households | % Households |
| Dial-Up Internet | 2 | 4.3% |
| Broadband Home | 23 | 48.9% |
| Cellular Data Only | 14 | 29.8% |
| Satellite Internet | 1 | 2.1% |
| No Internet | 6 | 12.8% |
| Total | 47 | 100.0% |
Coleharbor Summary
Harboring a rich history, geography, economy, and demographics, Coleharbor, North Dakota is a small town located in McLean County. With a population of just over 500 people, Coleharbor is a small, rural community that is home to a variety of businesses, organizations, and attractions.
History
Coleharbor was founded in 1883 by a group of settlers from Minnesota. The town was named after the nearby Coleharbor Creek, which was named after a local Native American chief. The town was originally a trading post for the local Native American tribes, and it quickly grew into a bustling community.
In the early 1900s, Coleharbor was a major hub for the railroad industry. The town was home to several grain elevators, a lumberyard, and a large stockyard. The railroad industry brought a great deal of prosperity to the town, and it was a major contributor to the local economy.
In the 1950s, the railroad industry began to decline, and the town began to suffer. The population began to decline, and many businesses closed their doors. However, the town was able to rebound in the 1970s, when the oil industry began to boom in the area.
Geography
Coleharbor is located in McLean County, North Dakota. The town is situated on the banks of the Missouri River, and it is surrounded by rolling hills and prairies. The town is located about 30 miles west of Bismarck, the state capital.
The town is located in a semi-arid climate, with hot summers and cold winters. The average temperature in the summer is around 80 degrees Fahrenheit, and the average temperature in the winter is around 20 degrees Fahrenheit.
Economy
The economy of Coleharbor is largely based on agriculture and oil production. The town is home to several grain elevators, a lumberyard, and a large stockyard. The town is also home to several oil production companies, which are responsible for much of the town’s economic activity.
In addition to agriculture and oil production, the town is also home to several small businesses, including restaurants, retail stores, and service providers. The town is also home to several churches, schools, and other organizations.
Demographics
As of the 2010 census, the population of Coleharbor was 514 people. The town is predominantly white, with a small minority population. The median household income in the town is $45,000, and the median age is 44 years old.
Conclusion
Coleharbor, North Dakota is a small, rural town with a rich history, geography, economy, and demographics. The town is home to a variety of businesses, organizations, and attractions, and it is a major contributor to the local economy. The town is predominantly white, with a small minority population, and the median household income is $45,000. Coleharbor is a great place to live, work, and play, and it is a great example of small-town America.
Common Questions
What is Per Capita Income in Coleharbor?
Per Capita income in Coleharbor is $35,721.
What is the Median Family Income in Coleharbor?
Median Family Income in Coleharbor is $61,000.
What is the Median Household income in Coleharbor?
Median Household Income in Coleharbor is $48,125.
What is Inequality or Gini Index in Coleharbor?
Inequality or Gini Index in Coleharbor is 0.47.
What is the Total Population of Coleharbor?
Total Population of Coleharbor is 89.
What is the Total Male Population of Coleharbor?
Total Male Population of Coleharbor is 49.
What is the Total Female Population of Coleharbor?
Total Female Population of Coleharbor is 40.
What is the Ratio of Males per 100 Females in Coleharbor?
There are 122.50 Males per 100 Females in Coleharbor.
What is the Ratio of Females per 100 Males in Coleharbor?
There are 81.63 Females per 100 Males in Coleharbor.
What is the Median Population Age in Coleharbor?
Median Population Age in Coleharbor is 64.8 Years.
What is the Average Family Size in Coleharbor
Average Family Size in Coleharbor is 2.3 People.
What is the Average Household Size in Coleharbor
Average Household Size in Coleharbor is 1.9 People.
How Large is the Labor Force in Coleharbor?
There are 26 People in the Labor Forcein in Coleharbor.
What is the Percentage of People in the Labor Force in Coleharbor?
30.6% of People are in the Labor Force in Coleharbor.