Rolette, ND Map & Demographics
Rolette Map
Rolette Overview
$24,563
PER CAPITA INCOME
$65,833
AVG FAMILY INCOME
$56,250
AVG HOUSEHOLD INCOME
36.4%
WAGE / INCOME GAP [ % ]
63.6¢/ $1
WAGE / INCOME GAP [ $ ]
0.45
INEQUALITY / GINI INDEX
456
TOTAL POPULATION
210
MALE POPULATION
246
FEMALE POPULATION
85.37
MALES / 100 FEMALES
117.14
FEMALES / 100 MALES
37.1
MEDIAN AGE
3.3
AVG FAMILY SIZE
2.8
AVG HOUSEHOLD SIZE
177
LABOR FORCE [ PEOPLE ]
53.5%
PERCENT IN LABOR FORCE
Rolette Zip Codes
Rolette Area Codes
Income in Rolette
Income Overview in Rolette
Per Capita Income in Rolette is $24,563, while median incomes of families and households are $65,833 and $56,250 respectively.
| Characteristic | Number | Measure |
| Per Capita Income | 456 | $24,563 |
| Median Family Income | 98 | $65,833 |
| Mean Family Income | 98 | $71,365 |
| Median Household Income | 156 | $56,250 |
| Mean Household Income | 156 | $66,734 |
| Income Deficit | 98 | $0 |
| Wage / Income Gap (%) | 456 | 36.45% |
| Wage / Income Gap ($) | 456 | 63.55¢ per $1 |
| Gini / Inequality Index | 456 | 0.45 |
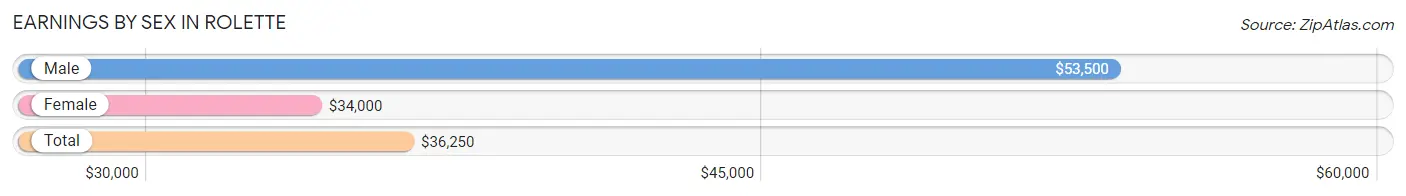
Earnings by Sex in Rolette
Average Earnings in Rolette are $36,250, $53,500 for men and $34,000 for women, a difference of 36.4%.
| Sex | Number | Average Earnings |
| Male | 100 (49.0%) | $53,500 |
| Female | 104 (51.0%) | $34,000 |
| Total | 204 (100.0%) | $36,250 |
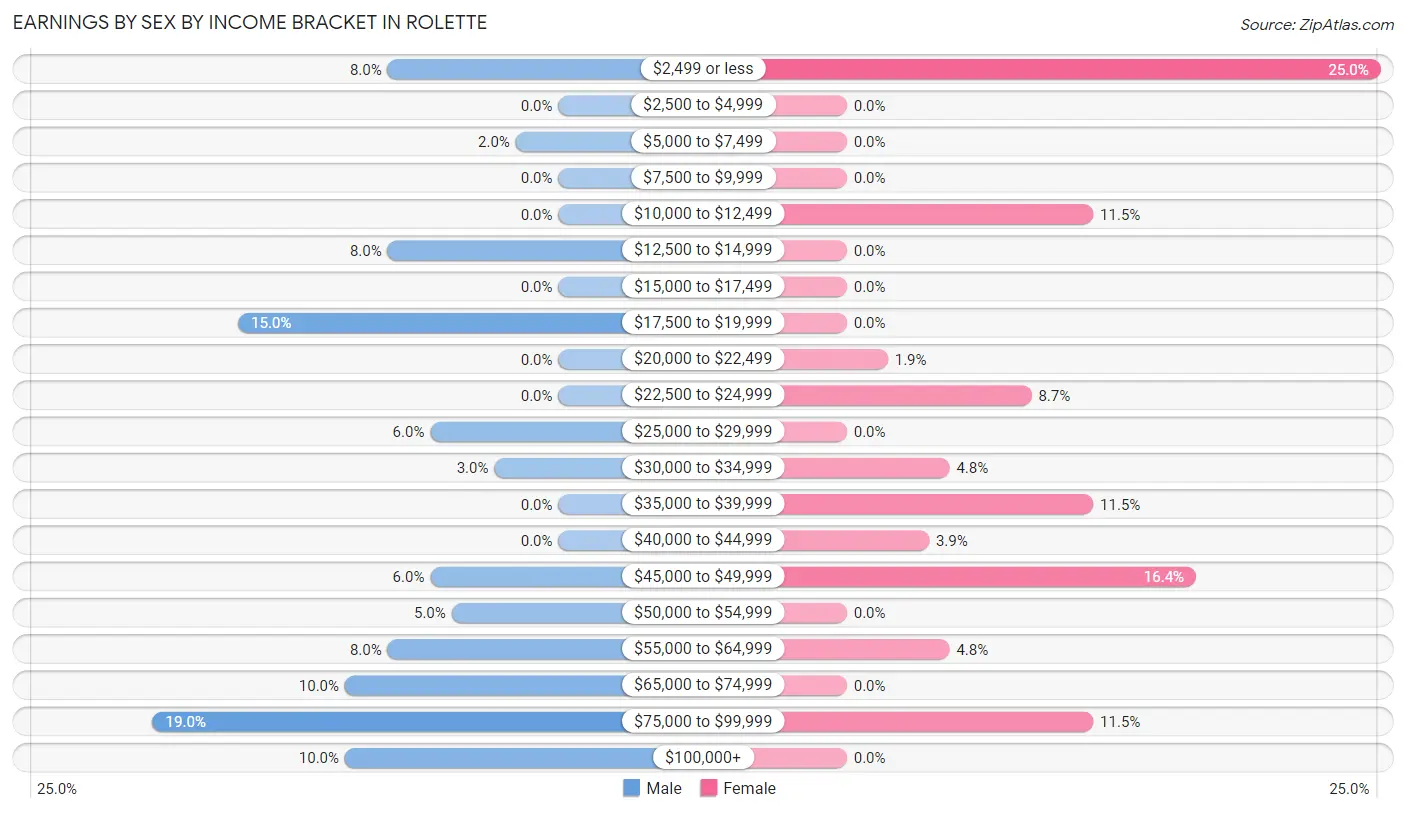
Earnings by Sex by Income Bracket in Rolette
The most common earnings brackets in Rolette are $75,000 to $99,999 for men (19 | 19.0%) and $2,499 or less for women (26 | 25.0%).
| Income | Male | Female |
| $2,499 or less | 8 (8.0%) | 26 (25.0%) |
| $2,500 to $4,999 | 0 (0.0%) | 0 (0.0%) |
| $5,000 to $7,499 | 2 (2.0%) | 0 (0.0%) |
| $7,500 to $9,999 | 0 (0.0%) | 0 (0.0%) |
| $10,000 to $12,499 | 0 (0.0%) | 12 (11.5%) |
| $12,500 to $14,999 | 8 (8.0%) | 0 (0.0%) |
| $15,000 to $17,499 | 0 (0.0%) | 0 (0.0%) |
| $17,500 to $19,999 | 15 (15.0%) | 0 (0.0%) |
| $20,000 to $22,499 | 0 (0.0%) | 2 (1.9%) |
| $22,500 to $24,999 | 0 (0.0%) | 9 (8.6%) |
| $25,000 to $29,999 | 6 (6.0%) | 0 (0.0%) |
| $30,000 to $34,999 | 3 (3.0%) | 5 (4.8%) |
| $35,000 to $39,999 | 0 (0.0%) | 12 (11.5%) |
| $40,000 to $44,999 | 0 (0.0%) | 4 (3.8%) |
| $45,000 to $49,999 | 6 (6.0%) | 17 (16.4%) |
| $50,000 to $54,999 | 5 (5.0%) | 0 (0.0%) |
| $55,000 to $64,999 | 8 (8.0%) | 5 (4.8%) |
| $65,000 to $74,999 | 10 (10.0%) | 0 (0.0%) |
| $75,000 to $99,999 | 19 (19.0%) | 12 (11.5%) |
| $100,000+ | 10 (10.0%) | 0 (0.0%) |
| Total | 100 (100.0%) | 104 (100.0%) |
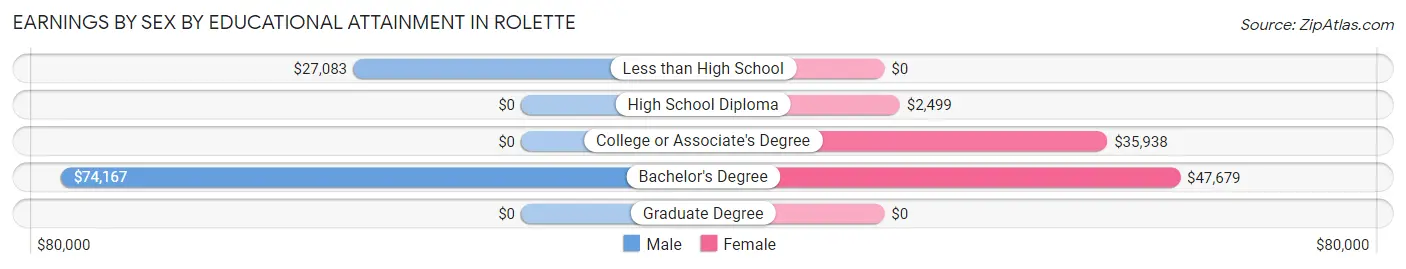
Earnings by Sex by Educational Attainment in Rolette
Average earnings in Rolette are $58,750 for men and $37,083 for women, a difference of 36.9%. Men with an educational attainment of bachelor's degree enjoy the highest average annual earnings of $74,167, while those with less than high school education earn the least with $27,083. Women with an educational attainment of bachelor's degree earn the most with the average annual earnings of $47,679, while those with high school diploma education have the smallest earnings of $2,499.
| Educational Attainment | Male Income | Female Income |
| Less than High School | $27,083 | $0 |
| High School Diploma | - | - |
| College or Associate's Degree | - | - |
| Bachelor's Degree | $74,167 | $47,679 |
| Graduate Degree | - | - |
| Total | $58,750 | $37,083 |
Family Income in Rolette
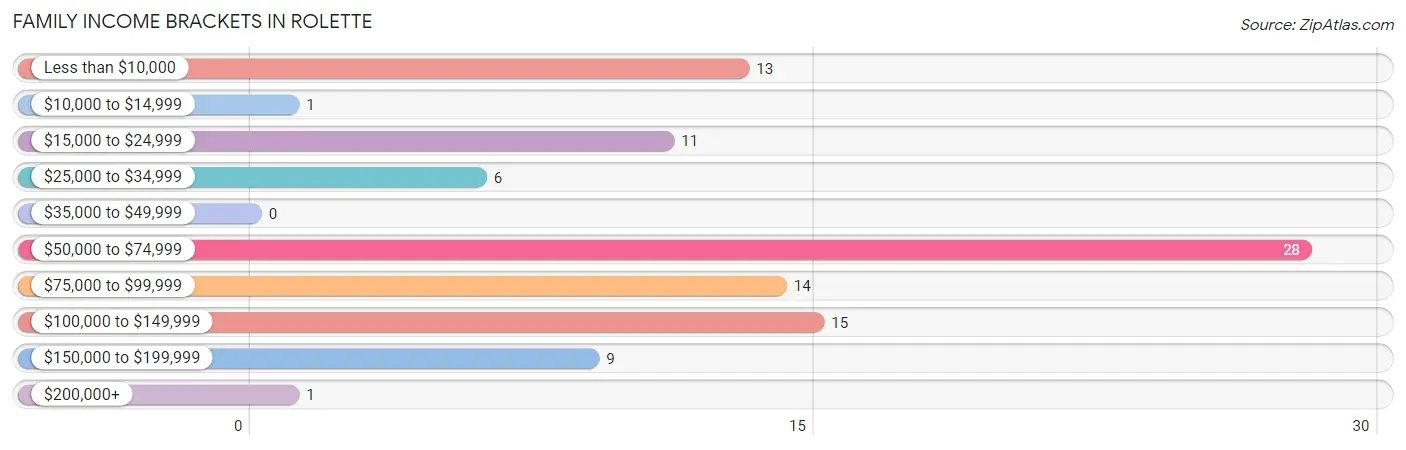
Family Income Brackets in Rolette
According to the Rolette family income data, there are 28 families falling into the $50,000 to $74,999 income range, which is the most common income bracket and makes up 28.6% of all families.
| Income Bracket | # Families | % Families |
| Less than $10,000 | 13 | 13.3% |
| $10,000 to $14,999 | 1 | 1.0% |
| $15,000 to $24,999 | 11 | 11.2% |
| $25,000 to $34,999 | 6 | 6.1% |
| $35,000 to $49,999 | 0 | 0.0% |
| $50,000 to $74,999 | 28 | 28.6% |
| $75,000 to $99,999 | 14 | 14.3% |
| $100,000 to $149,999 | 15 | 15.3% |
| $150,000 to $199,999 | 9 | 9.2% |
| $200,000+ | 1 | 1.0% |
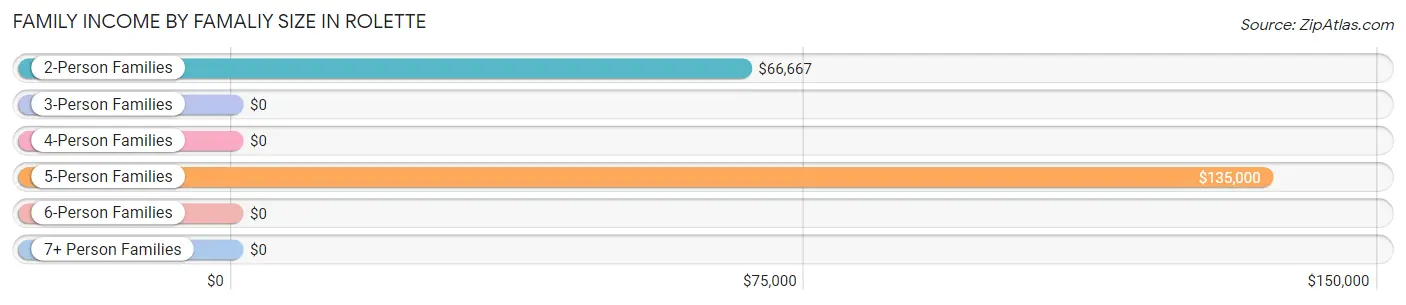
Family Income by Famaliy Size in Rolette
5-person families (12 | 12.2%) account for the highest median family income in Rolette with $135,000 per family, while 2-person families (48 | 49.0%) have the highest median income of $33,334 per family member.
| Income Bracket | # Families | Median Income |
| 2-Person Families | 48 (49.0%) | $66,667 |
| 3-Person Families | 26 (26.5%) | $0 |
| 4-Person Families | 7 (7.1%) | $0 |
| 5-Person Families | 12 (12.2%) | $135,000 |
| 6-Person Families | 0 (0.0%) | $0 |
| 7+ Person Families | 5 (5.1%) | $0 |
| Total | 98 (100.0%) | $65,833 |
Family Income by Number of Earners in Rolette
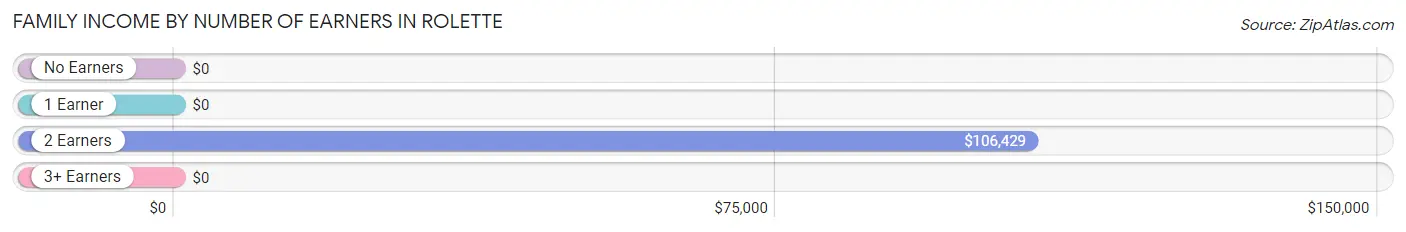
| Number of Earners | # Families | Median Income |
| No Earners | 23 (23.5%) | $0 |
| 1 Earner | 42 (42.9%) | $0 |
| 2 Earners | 26 (26.5%) | $106,429 |
| 3+ Earners | 7 (7.1%) | $0 |
| Total | 98 (100.0%) | $65,833 |
Household Income in Rolette
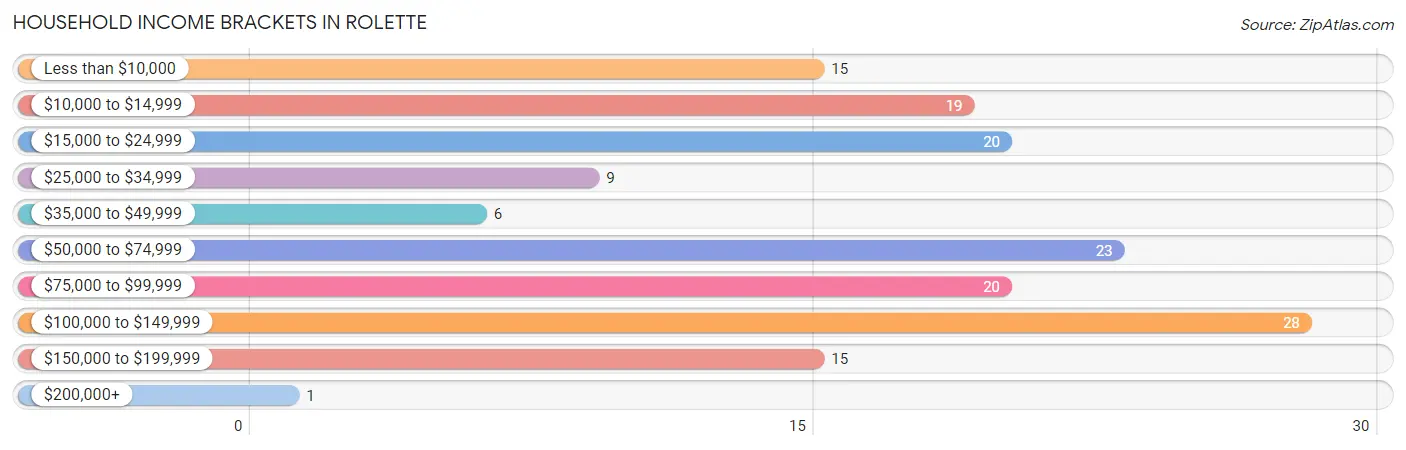
Household Income Brackets in Rolette
With 28 households falling in the category, the $100,000 to $149,999 income range is the most frequent in Rolette, accounting for 17.9% of all households. In contrast, only 1 households (0.6%) fall into the $200,000+ income bracket, making it the least populous group.
| Income Bracket | # Households | % Households |
| Less than $10,000 | 15 | 9.6% |
| $10,000 to $14,999 | 19 | 12.2% |
| $15,000 to $24,999 | 20 | 12.8% |
| $25,000 to $34,999 | 9 | 5.8% |
| $35,000 to $49,999 | 6 | 3.8% |
| $50,000 to $74,999 | 23 | 14.7% |
| $75,000 to $99,999 | 20 | 12.8% |
| $100,000 to $149,999 | 28 | 17.9% |
| $150,000 to $199,999 | 15 | 9.6% |
| $200,000+ | 1 | 0.6% |
Household Income by Householder Age in Rolette
The median household income in Rolette is $56,250, with the highest median household income of $97,813 found in the 45 to 64 years age bracket for the primary householder. A total of 71 households (45.5%) fall into this category. Meanwhile, the 15 to 24 years age bracket for the primary householder has the lowest median household income of $0, with 17 households (10.9%) in this group.
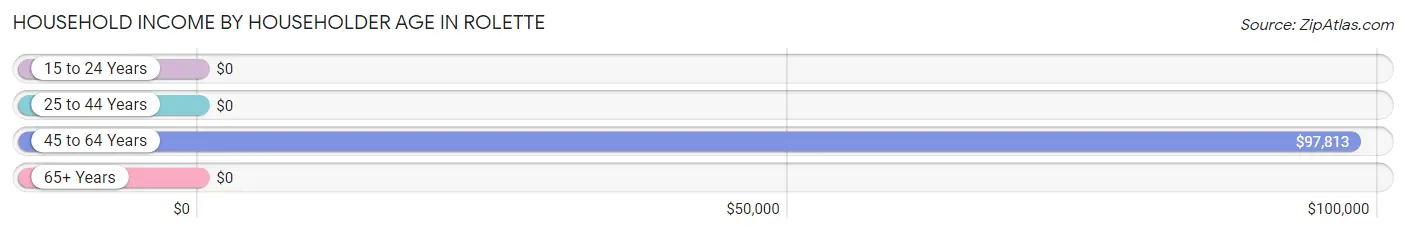
| Income Bracket | # Households | Median Income |
| 15 to 24 Years | 17 (10.9%) | $0 |
| 25 to 44 Years | 41 (26.3%) | $0 |
| 45 to 64 Years | 71 (45.5%) | $97,813 |
| 65+ Years | 27 (17.3%) | $0 |
| Total | 156 (100.0%) | $56,250 |
Poverty in Rolette
Income Below Poverty by Sex and Age in Rolette
With 22.1% poverty level for males and 15.0% for females among the residents of Rolette, 12 to 14 year old males and 35 to 44 year old females are the most vulnerable to poverty, with 2 males (100.0%) and 11 females (64.7%) in their respective age groups living below the poverty level.
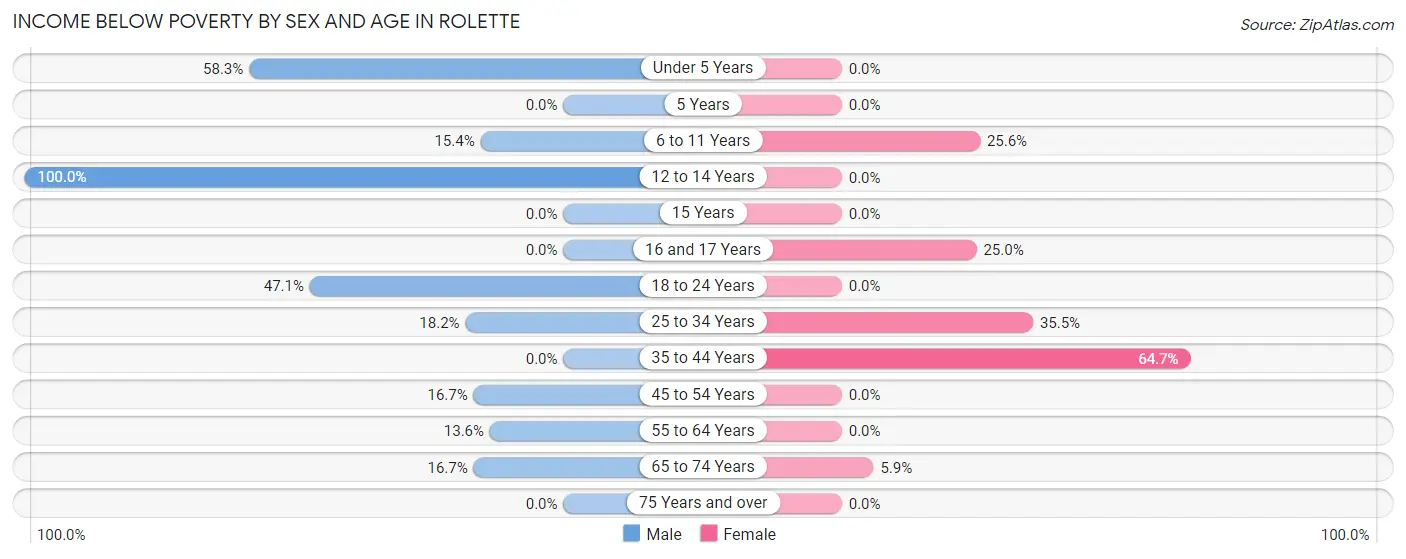
| Age Bracket | Male | Female |
| Under 5 Years | 14 (58.3%) | 0 (0.0%) |
| 5 Years | 0 (0.0%) | 0 (0.0%) |
| 6 to 11 Years | 2 (15.4%) | 10 (25.6%) |
| 12 to 14 Years | 2 (100.0%) | 0 (0.0%) |
| 15 Years | 0 (0.0%) | 0 (0.0%) |
| 16 and 17 Years | 0 (0.0%) | 1 (25.0%) |
| 18 to 24 Years | 8 (47.1%) | 0 (0.0%) |
| 25 to 34 Years | 2 (18.2%) | 11 (35.5%) |
| 35 to 44 Years | 0 (0.0%) | 11 (64.7%) |
| 45 to 54 Years | 7 (16.7%) | 0 (0.0%) |
| 55 to 64 Years | 6 (13.6%) | 0 (0.0%) |
| 65 to 74 Years | 2 (16.7%) | 1 (5.9%) |
| 75 Years and over | 0 (0.0%) | 0 (0.0%) |
| Total | 43 (22.1%) | 34 (15.0%) |
Income Above Poverty by Sex and Age in Rolette
According to the poverty statistics in Rolette, males aged 16 and 17 years and females aged under 5 years are the age groups that are most secure financially, with 100.0% of males and 100.0% of females in these age groups living above the poverty line.
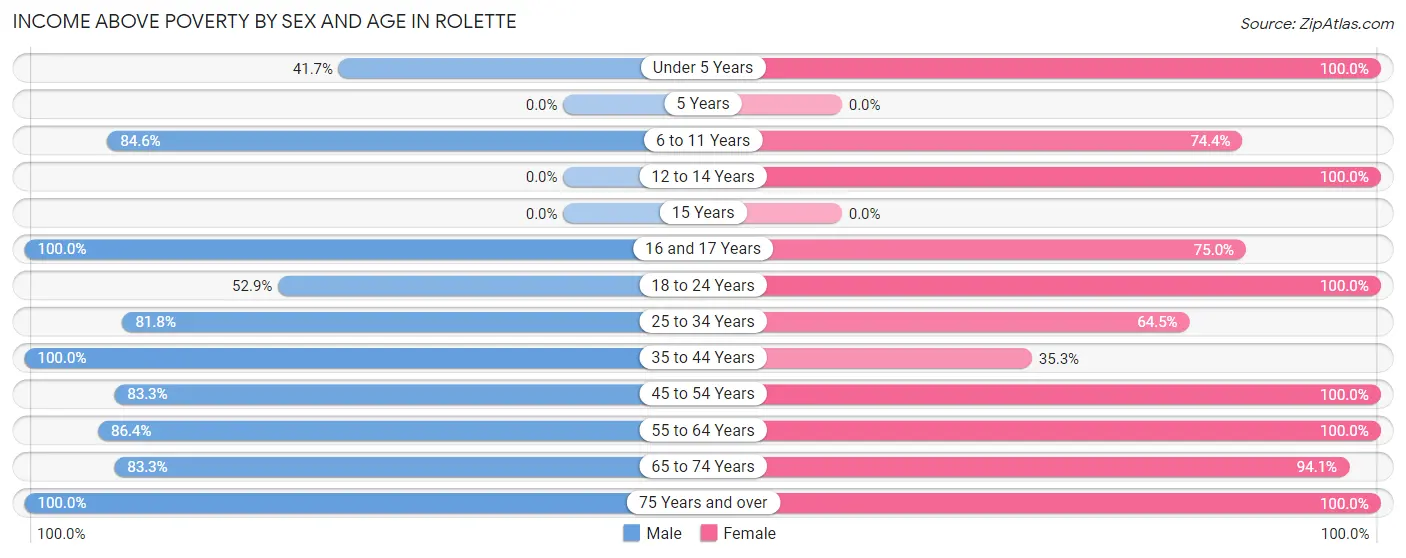
| Age Bracket | Male | Female |
| Under 5 Years | 10 (41.7%) | 24 (100.0%) |
| 5 Years | 0 (0.0%) | 0 (0.0%) |
| 6 to 11 Years | 11 (84.6%) | 29 (74.4%) |
| 12 to 14 Years | 0 (0.0%) | 11 (100.0%) |
| 15 Years | 0 (0.0%) | 0 (0.0%) |
| 16 and 17 Years | 12 (100.0%) | 3 (75.0%) |
| 18 to 24 Years | 9 (52.9%) | 21 (100.0%) |
| 25 to 34 Years | 9 (81.8%) | 20 (64.5%) |
| 35 to 44 Years | 11 (100.0%) | 6 (35.3%) |
| 45 to 54 Years | 35 (83.3%) | 27 (100.0%) |
| 55 to 64 Years | 38 (86.4%) | 25 (100.0%) |
| 65 to 74 Years | 10 (83.3%) | 16 (94.1%) |
| 75 Years and over | 7 (100.0%) | 11 (100.0%) |
| Total | 152 (77.9%) | 193 (85.0%) |
Income Below Poverty Among Married-Couple Families in Rolette
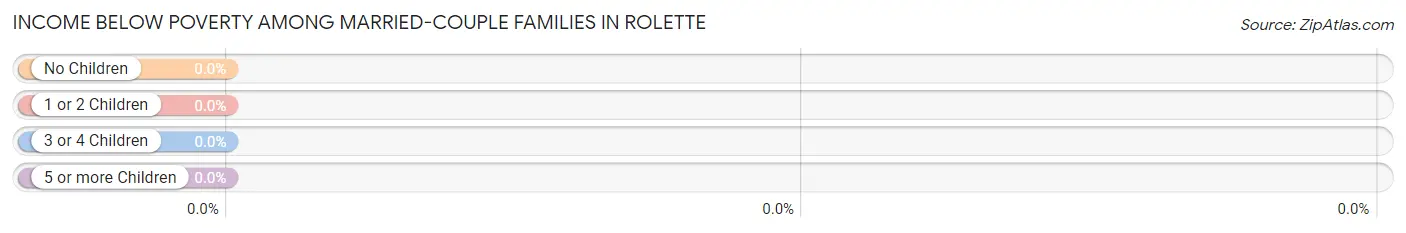
| Children | Above Poverty | Below Poverty |
| No Children | 43 (100.0%) | 0 (0.0%) |
| 1 or 2 Children | 15 (100.0%) | 0 (0.0%) |
| 3 or 4 Children | 5 (100.0%) | 0 (0.0%) |
| 5 or more Children | 5 (100.0%) | 0 (0.0%) |
| Total | 68 (100.0%) | 0 (0.0%) |
Income Below Poverty Among Single-Parent Households in Rolette
According to the poverty data in Rolette, 12.5% or 1 single-father households and 59.1% or 13 single-mother households are living below the poverty line. Among single-father households, those with no children have the highest poverty rate, with 1 households (100.0%) experiencing poverty. Likewise, among single-mother households, those with 3 or 4 children have the highest poverty rate, with 2 households (100.0%) falling below the poverty line.
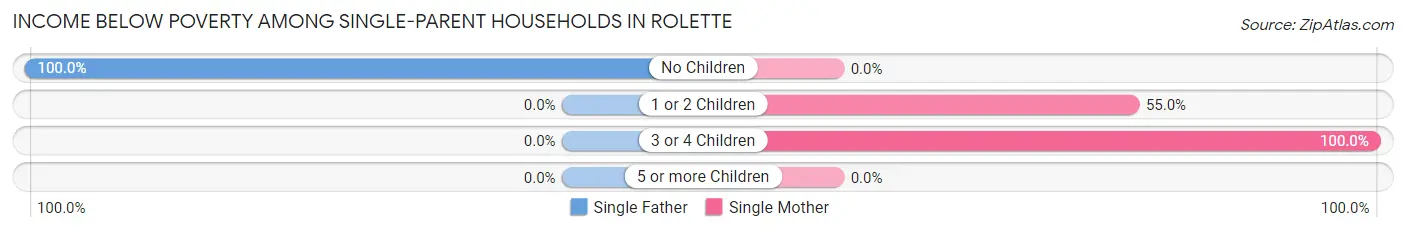
| Children | Single Father | Single Mother |
| No Children | 1 (100.0%) | 0 (0.0%) |
| 1 or 2 Children | 0 (0.0%) | 11 (55.0%) |
| 3 or 4 Children | 0 (0.0%) | 2 (100.0%) |
| 5 or more Children | 0 (0.0%) | 0 (0.0%) |
| Total | 1 (12.5%) | 13 (59.1%) |
Income Below Poverty Among Married-Couple vs Single-Parent Households in Rolette
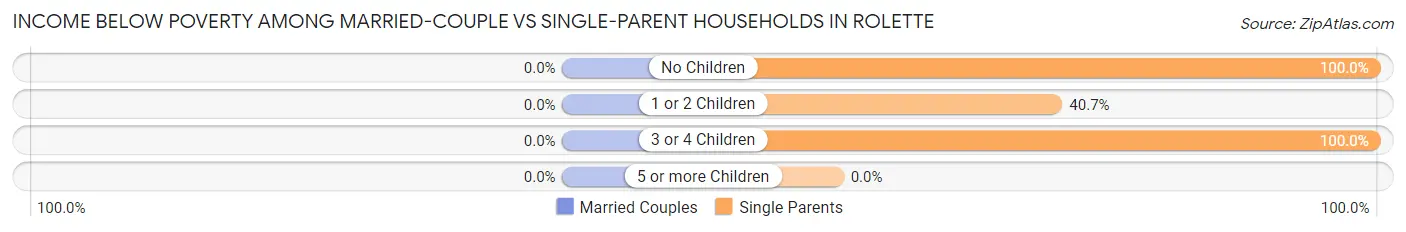
| Children | Married-Couple Families | Single-Parent Households |
| No Children | 0 (0.0%) | 1 (100.0%) |
| 1 or 2 Children | 0 (0.0%) | 11 (40.7%) |
| 3 or 4 Children | 0 (0.0%) | 2 (100.0%) |
| 5 or more Children | 0 (0.0%) | 0 (0.0%) |
| Total | 0 (0.0%) | 14 (46.7%) |
Race in Rolette
The most populous races in Rolette are White / Caucasian (248 | 54.4%), Native / Alaskan (194 | 42.5%), and Hispanic or Latino (13 | 2.9%).
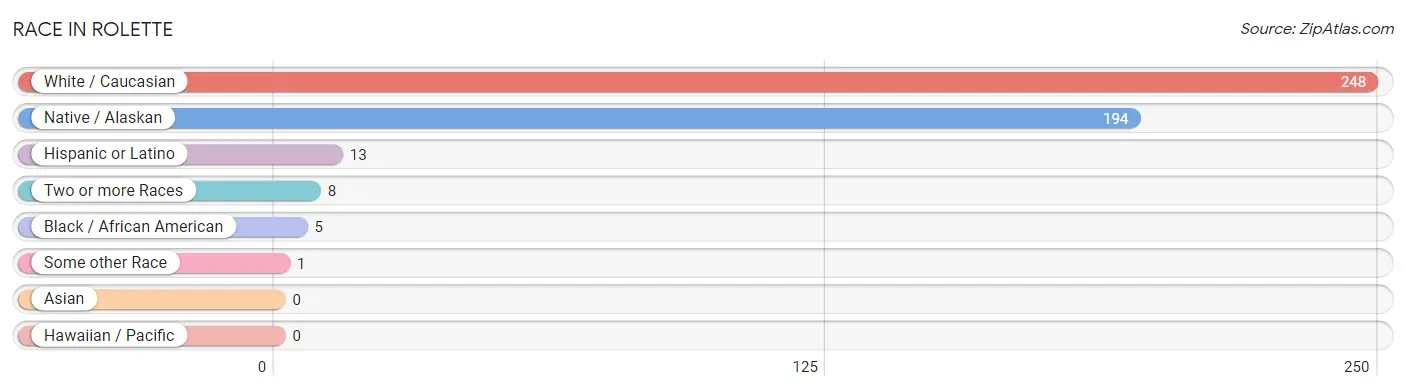
| Race | # Population | % Population |
| Asian | 0 | 0.0% |
| Black / African American | 5 | 1.1% |
| Hawaiian / Pacific | 0 | 0.0% |
| Hispanic or Latino | 13 | 2.9% |
| Native / Alaskan | 194 | 42.5% |
| White / Caucasian | 248 | 54.4% |
| Two or more Races | 8 | 1.8% |
| Some other Race | 1 | 0.2% |
| Total | 456 | 100.0% |
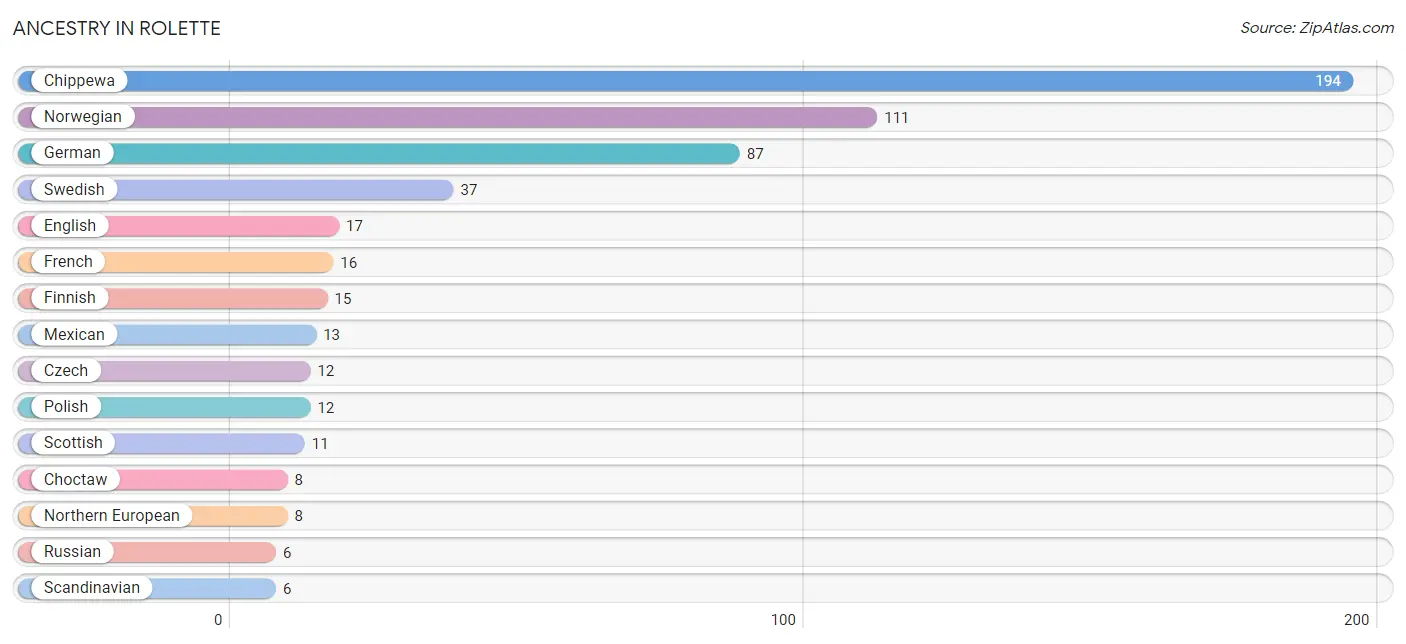
Ancestry in Rolette
The most populous ancestries reported in Rolette are Chippewa (194 | 42.5%), Norwegian (111 | 24.3%), German (87 | 19.1%), Swedish (37 | 8.1%), and English (17 | 3.7%), together accounting for 97.8% of all Rolette residents.
| Ancestry | # Population | % Population |
| American | 3 | 0.7% |
| Belgian | 1 | 0.2% |
| Chippewa | 194 | 42.5% |
| Choctaw | 8 | 1.8% |
| Czech | 12 | 2.6% |
| Dutch | 3 | 0.7% |
| English | 17 | 3.7% |
| Finnish | 15 | 3.3% |
| French | 16 | 3.5% |
| German | 87 | 19.1% |
| Hungarian | 1 | 0.2% |
| Irish | 1 | 0.2% |
| Mexican | 13 | 2.9% |
| Northern European | 8 | 1.8% |
| Norwegian | 111 | 24.3% |
| Polish | 12 | 2.6% |
| Russian | 6 | 1.3% |
| Scandinavian | 6 | 1.3% |
| Scottish | 11 | 2.4% |
| Swedish | 37 | 8.1% |
| Ukrainian | 5 | 1.1% | View All 21 Rows |
Immigrants in Rolette
The most numerous immigrant groups reported in Rolette came from , and Canada (1 | 0.2%), together accounting for 0.2% of all Rolette residents.

| Immigration Origin | # Population | % Population |
| Canada | 1 | 0.2% | View All 1 Rows |
Sex and Age in Rolette
Sex and Age in Rolette
The most populous age groups in Rolette are 45 to 49 Years (31 | 14.8%) for men and 5 to 9 Years (33 | 13.4%) for women.
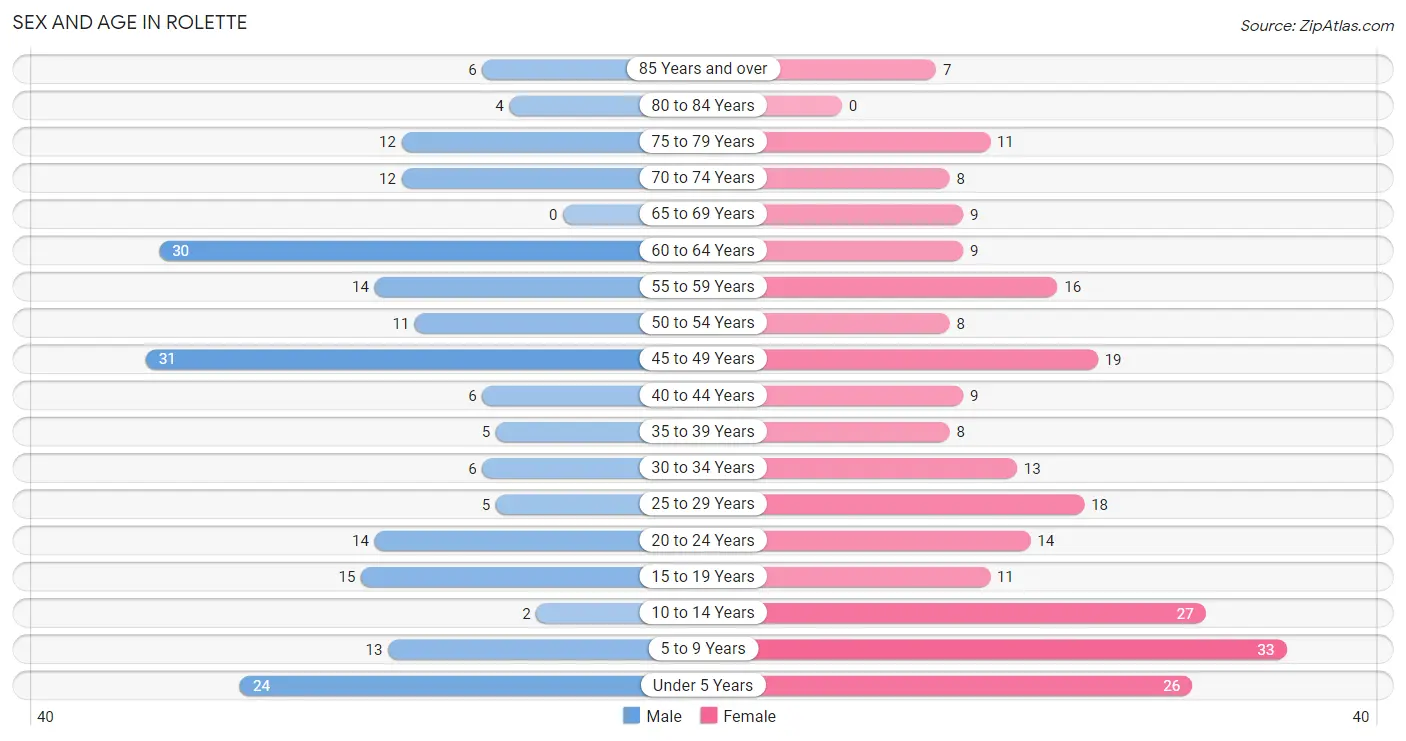
| Age Bracket | Male | Female |
| Under 5 Years | 24 (11.4%) | 26 (10.6%) |
| 5 to 9 Years | 13 (6.2%) | 33 (13.4%) |
| 10 to 14 Years | 2 (0.9%) | 27 (11.0%) |
| 15 to 19 Years | 15 (7.1%) | 11 (4.5%) |
| 20 to 24 Years | 14 (6.7%) | 14 (5.7%) |
| 25 to 29 Years | 5 (2.4%) | 18 (7.3%) |
| 30 to 34 Years | 6 (2.9%) | 13 (5.3%) |
| 35 to 39 Years | 5 (2.4%) | 8 (3.3%) |
| 40 to 44 Years | 6 (2.9%) | 9 (3.7%) |
| 45 to 49 Years | 31 (14.8%) | 19 (7.7%) |
| 50 to 54 Years | 11 (5.2%) | 8 (3.3%) |
| 55 to 59 Years | 14 (6.7%) | 16 (6.5%) |
| 60 to 64 Years | 30 (14.3%) | 9 (3.7%) |
| 65 to 69 Years | 0 (0.0%) | 9 (3.7%) |
| 70 to 74 Years | 12 (5.7%) | 8 (3.3%) |
| 75 to 79 Years | 12 (5.7%) | 11 (4.5%) |
| 80 to 84 Years | 4 (1.9%) | 0 (0.0%) |
| 85 Years and over | 6 (2.9%) | 7 (2.9%) |
| Total | 210 (100.0%) | 246 (100.0%) |
Families and Households in Rolette
Median Family Size in Rolette
The median family size in Rolette is 3.29 persons per family, with single male/father families (8 | 8.2%) accounting for the largest median family size of 3.88 persons per family. On the other hand, single female/mother families (22 | 22.5%) represent the smallest median family size with 2.77 persons per family.
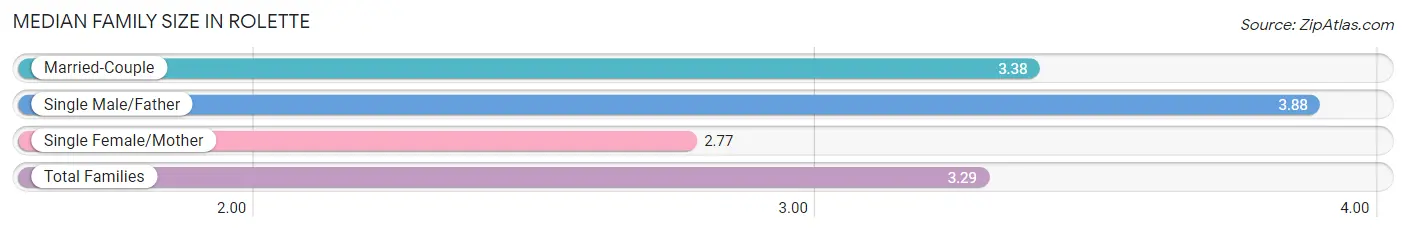
| Family Type | # Families | Family Size |
| Married-Couple | 68 (69.4%) | 3.38 |
| Single Male/Father | 8 (8.2%) | 3.88 |
| Single Female/Mother | 22 (22.5%) | 2.77 |
| Total Families | 98 (100.0%) | 3.29 |
Median Household Size in Rolette
The median household size in Rolette is 2.78 persons per household, with single male/father households (8 | 5.1%) accounting for the largest median household size of 4.75 persons per household. non-family households (58 | 37.2%) represent the smallest median household size with 1.64 persons per household.
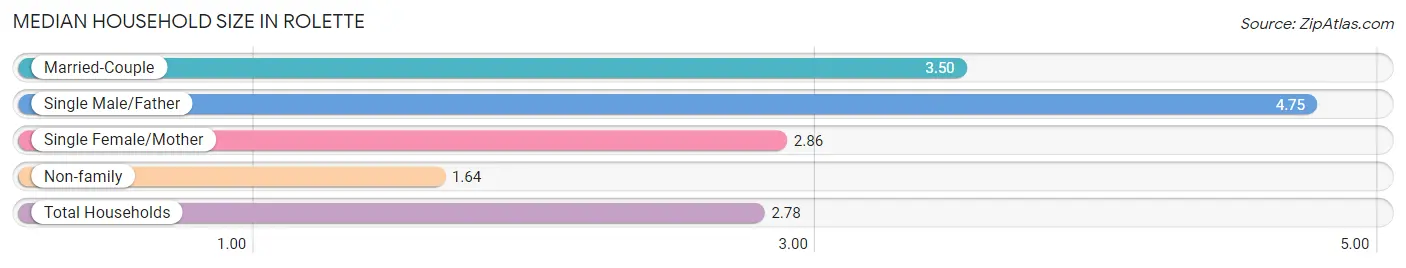
| Household Type | # Households | Household Size |
| Married-Couple | 68 (43.6%) | 3.50 |
| Single Male/Father | 8 (5.1%) | 4.75 |
| Single Female/Mother | 22 (14.1%) | 2.86 |
| Non-family | 58 (37.2%) | 1.64 |
| Total Households | 156 (100.0%) | 2.78 |
Household Size by Marriage Status in Rolette
Out of a total of 156 households in Rolette, 98 (62.8%) are family households, while 58 (37.2%) are nonfamily households. The most numerous type of family households are 2-person households, comprising 48, and the most common type of nonfamily households are 1-person households, comprising 34.
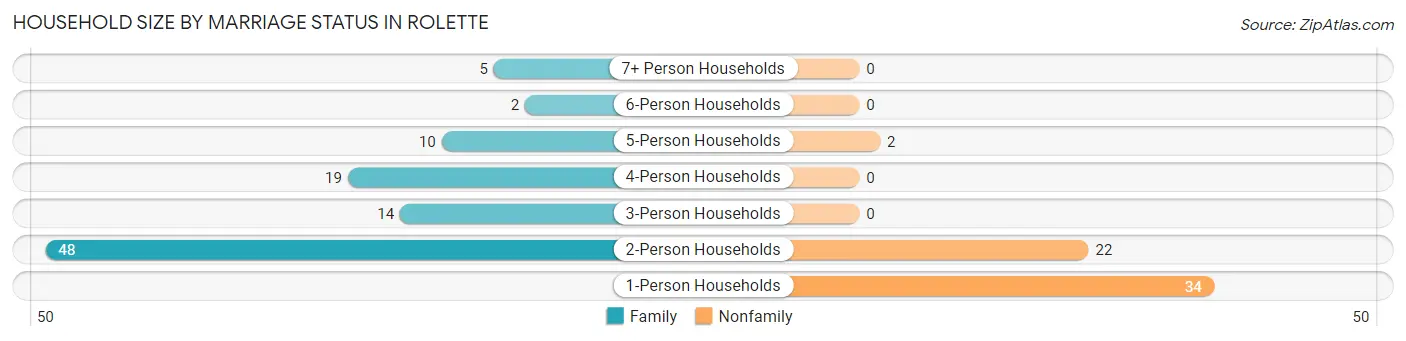
| Household Size | Family Households | Nonfamily Households |
| 1-Person Households | - | 34 (21.8%) |
| 2-Person Households | 48 (30.8%) | 22 (14.1%) |
| 3-Person Households | 14 (9.0%) | 0 (0.0%) |
| 4-Person Households | 19 (12.2%) | 0 (0.0%) |
| 5-Person Households | 10 (6.4%) | 2 (1.3%) |
| 6-Person Households | 2 (1.3%) | 0 (0.0%) |
| 7+ Person Households | 5 (3.2%) | 0 (0.0%) |
| Total | 98 (62.8%) | 58 (37.2%) |
Female Fertility in Rolette
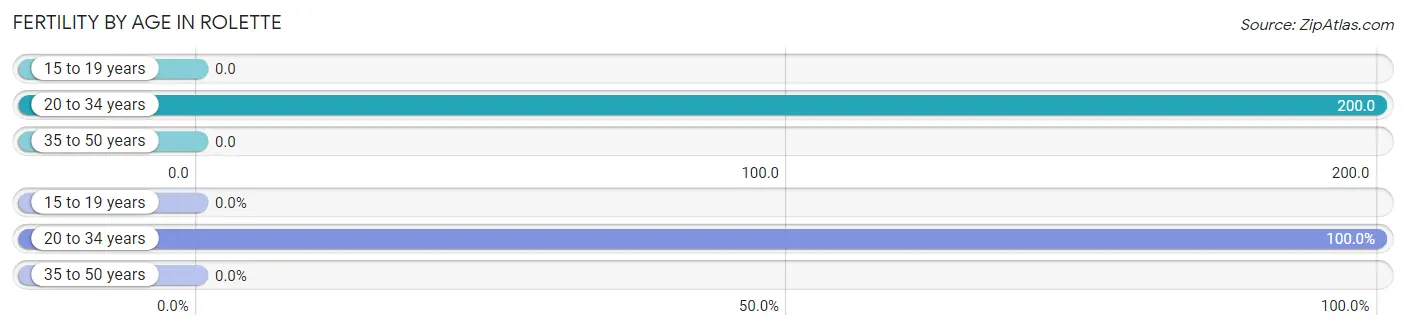
Fertility by Age in Rolette
Average fertility rate in Rolette is 98.0 births per 1,000 women. Women in the age bracket of 20 to 34 years have the highest fertility rate with 200.0 births per 1,000 women. Women in the age bracket of 20 to 34 years acount for 100.0% of all women with births.
| Age Bracket | Women with Births | Births / 1,000 Women |
| 15 to 19 years | 0 (0.0%) | 0.0 |
| 20 to 34 years | 9 (100.0%) | 200.0 |
| 35 to 50 years | 0 (0.0%) | 0.0 |
| Total | 9 (100.0%) | 98.0 |
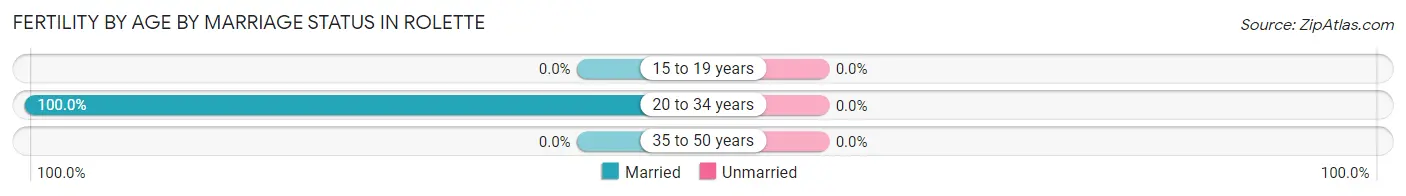
Fertility by Age by Marriage Status in Rolette
| Age Bracket | Married | Unmarried |
| 15 to 19 years | 0 (0.0%) | 0 (0.0%) |
| 20 to 34 years | 9 (100.0%) | 0 (0.0%) |
| 35 to 50 years | 0 (0.0%) | 0 (0.0%) |
| Total | 9 (100.0%) | 0 (0.0%) |
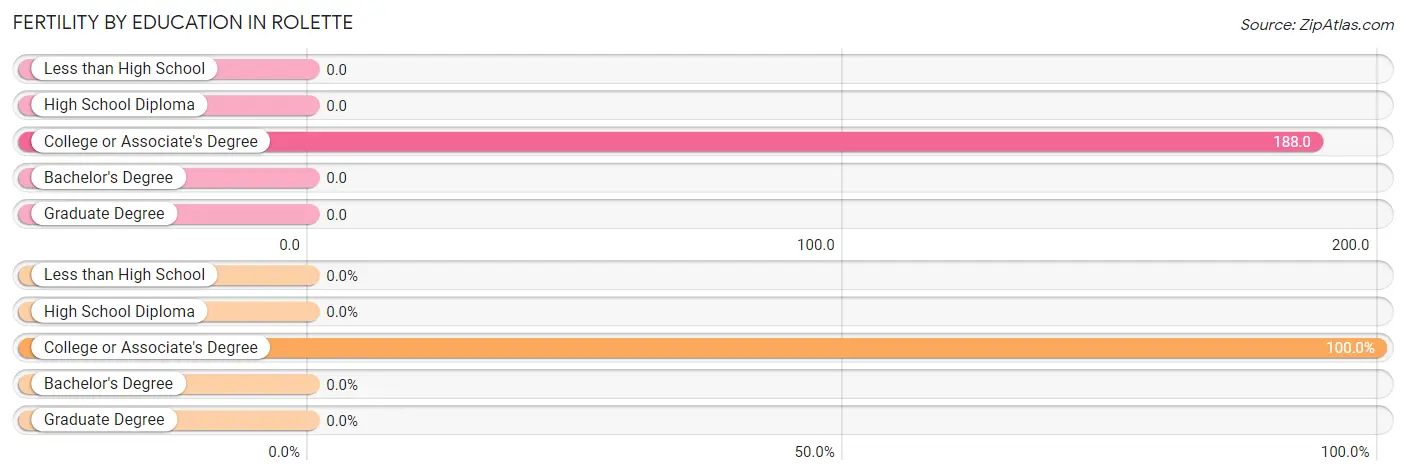
Fertility by Education in Rolette
| Educational Attainment | Women with Births | Births / 1,000 Women |
| Less than High School | 0 (0.0%) | 0.0 |
| High School Diploma | 0 (0.0%) | 0.0 |
| College or Associate's Degree | 9 (100.0%) | 188.0 |
| Bachelor's Degree | 0 (0.0%) | 0.0 |
| Graduate Degree | 0 (0.0%) | 0.0 |
| Total | 9 (100.0%) | 98.0 |
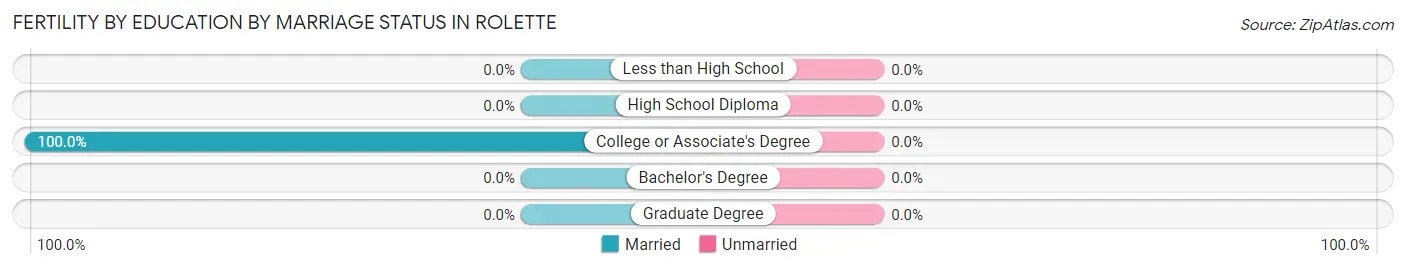
Fertility by Education by Marriage Status in Rolette
| Educational Attainment | Married | Unmarried |
| Less than High School | 0 (0.0%) | 0 (0.0%) |
| High School Diploma | 0 (0.0%) | 0 (0.0%) |
| College or Associate's Degree | 9 (100.0%) | 0 (0.0%) |
| Bachelor's Degree | 0 (0.0%) | 0 (0.0%) |
| Graduate Degree | 0 (0.0%) | 0 (0.0%) |
| Total | 9 (100.0%) | 0 (0.0%) |
Employment Characteristics in Rolette
Employment by Class of Employer in Rolette
Among the 177 employed individuals in Rolette, private company employees (96 | 54.2%), not-for-profit organizations (35 | 19.8%), and local government employees (15 | 8.5%) make up the most common classes of employment.
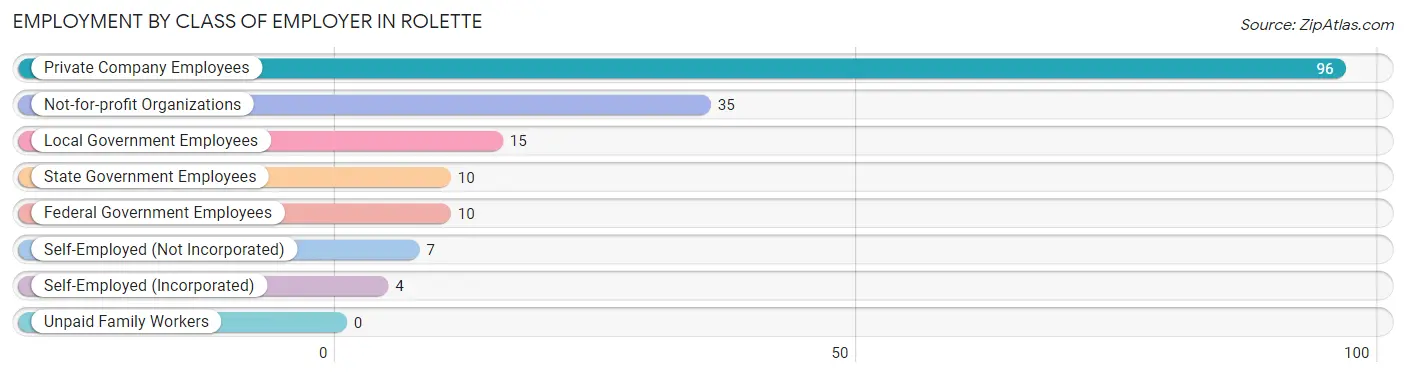
| Employer Class | # Employees | % Employees |
| Private Company Employees | 96 | 54.2% |
| Self-Employed (Incorporated) | 4 | 2.3% |
| Self-Employed (Not Incorporated) | 7 | 4.0% |
| Not-for-profit Organizations | 35 | 19.8% |
| Local Government Employees | 15 | 8.5% |
| State Government Employees | 10 | 5.7% |
| Federal Government Employees | 10 | 5.7% |
| Unpaid Family Workers | 0 | 0.0% |
| Total | 177 | 100.0% |
Employment Status by Age in Rolette
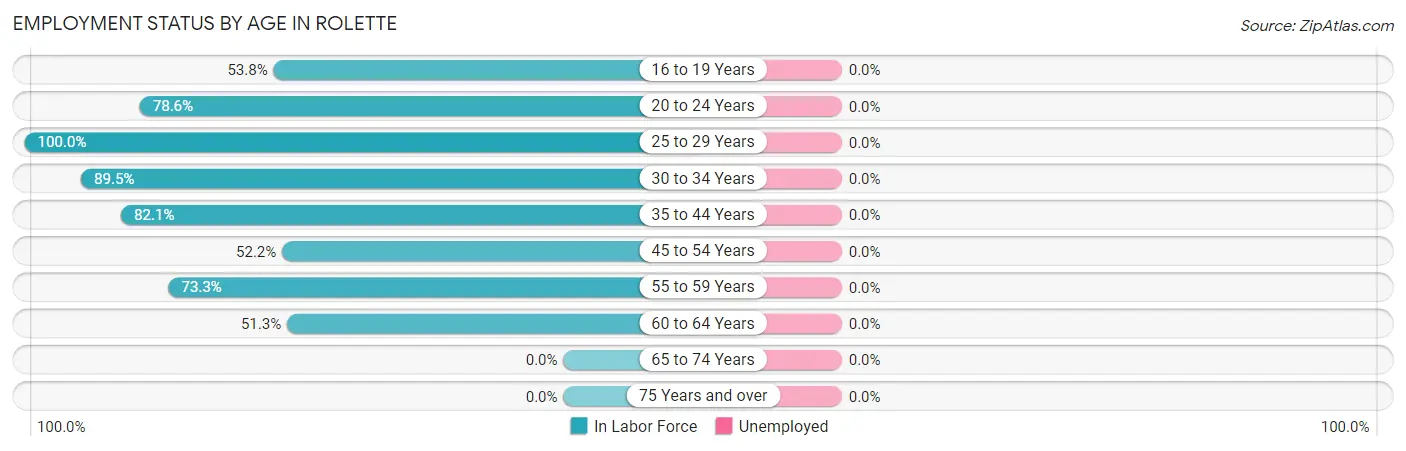
| Age Bracket | In Labor Force | Unemployed |
| 16 to 19 Years | 14 (53.8%) | 0 (0.0%) |
| 20 to 24 Years | 22 (78.6%) | 0 (0.0%) |
| 25 to 29 Years | 23 (100.0%) | 0 (0.0%) |
| 30 to 34 Years | 17 (89.5%) | 0 (0.0%) |
| 35 to 44 Years | 23 (82.1%) | 0 (0.0%) |
| 45 to 54 Years | 36 (52.2%) | 0 (0.0%) |
| 55 to 59 Years | 22 (73.3%) | 0 (0.0%) |
| 60 to 64 Years | 20 (51.3%) | 0 (0.0%) |
| 65 to 74 Years | 0 (0.0%) | 0 (0.0%) |
| 75 Years and over | 0 (0.0%) | 0 (0.0%) |
| Total | 177 (53.5%) | 0 (0.0%) |
Employment Status by Educational Attainment in Rolette
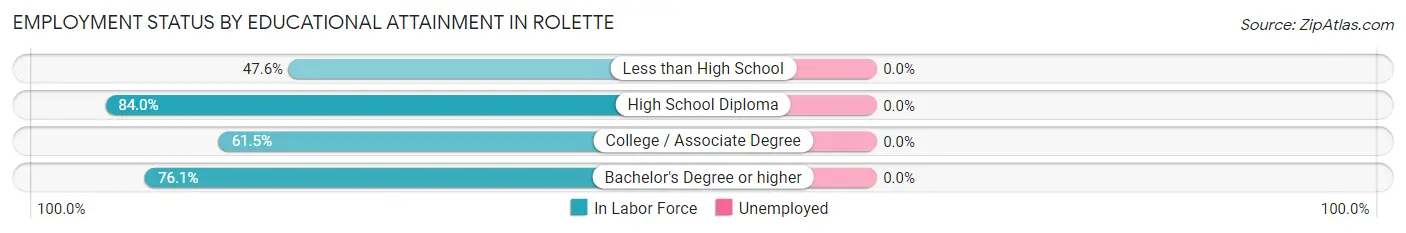
| Educational Attainment | In Labor Force | Unemployed |
| Less than High School | 10 (47.6%) | 0 (0.0%) |
| High School Diploma | 21 (84.0%) | 0 (0.0%) |
| College / Associate Degree | 56 (61.5%) | 0 (0.0%) |
| Bachelor's Degree or higher | 54 (76.1%) | 0 (0.0%) |
| Total | 141 (67.8%) | 0 (0.0%) |
Employment Occupations by Sex in Rolette
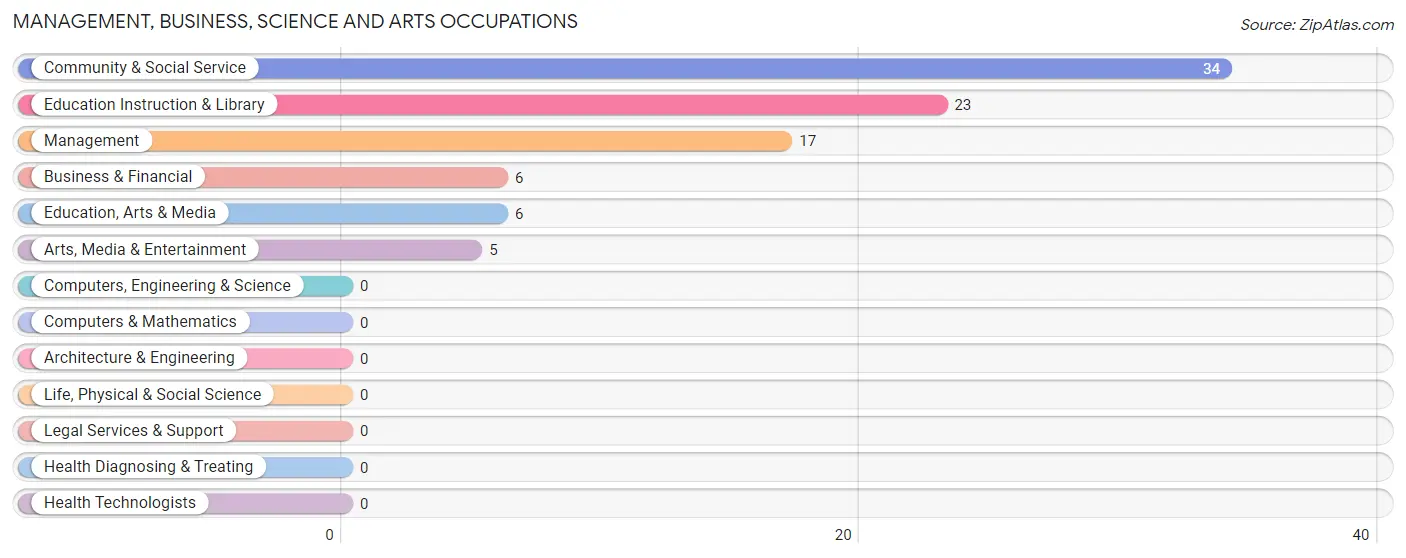
Management, Business, Science and Arts Occupations
The most common Management, Business, Science and Arts occupations in Rolette are Community & Social Service (34 | 19.2%), Education Instruction & Library (23 | 13.0%), Management (17 | 9.6%), Business & Financial (6 | 3.4%), and Education, Arts & Media (6 | 3.4%).
Management, Business, Science and Arts Occupations by Sex
Within the Management, Business, Science and Arts occupations in Rolette, the most male-oriented occupations are Management (100.0%), Business & Financial (100.0%), and Education, Arts & Media (100.0%), while the most female-oriented occupations are Arts, Media & Entertainment (100.0%), Education Instruction & Library (73.9%), and Community & Social Service (64.7%).
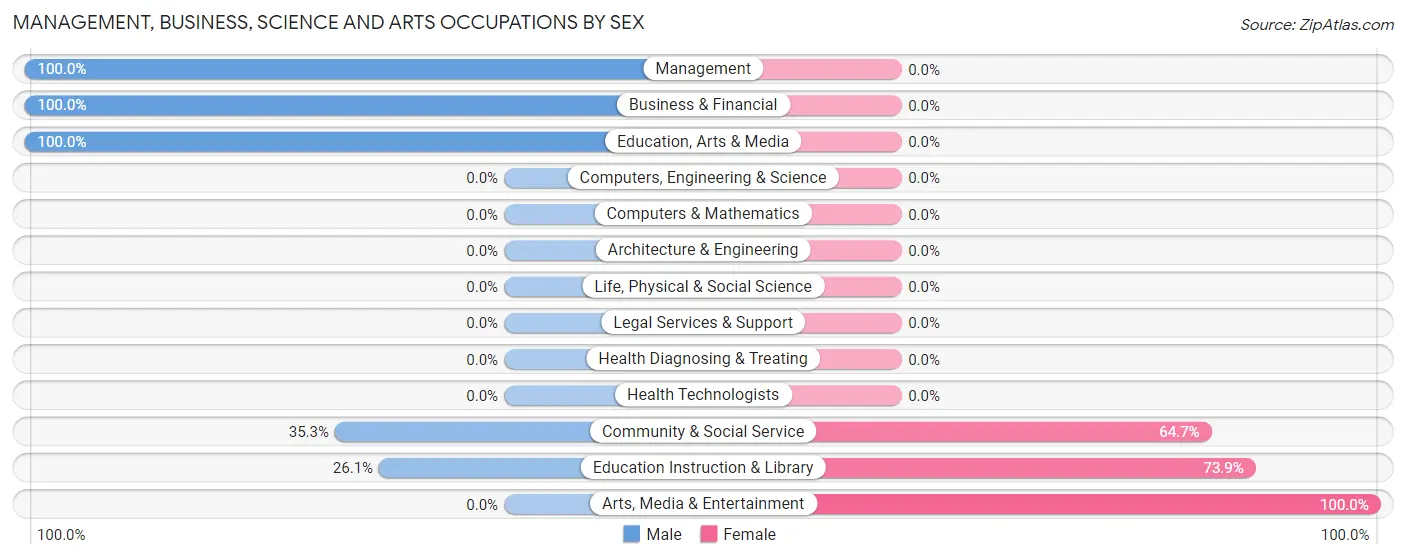
| Occupation | Male | Female |
| Management | 17 (100.0%) | 0 (0.0%) |
| Business & Financial | 6 (100.0%) | 0 (0.0%) |
| Computers, Engineering & Science | 0 (0.0%) | 0 (0.0%) |
| Computers & Mathematics | 0 (0.0%) | 0 (0.0%) |
| Architecture & Engineering | 0 (0.0%) | 0 (0.0%) |
| Life, Physical & Social Science | 0 (0.0%) | 0 (0.0%) |
| Community & Social Service | 12 (35.3%) | 22 (64.7%) |
| Education, Arts & Media | 6 (100.0%) | 0 (0.0%) |
| Legal Services & Support | 0 (0.0%) | 0 (0.0%) |
| Education Instruction & Library | 6 (26.1%) | 17 (73.9%) |
| Arts, Media & Entertainment | 0 (0.0%) | 5 (100.0%) |
| Health Diagnosing & Treating | 0 (0.0%) | 0 (0.0%) |
| Health Technologists | 0 (0.0%) | 0 (0.0%) |
| Total (Category) | 35 (61.4%) | 22 (38.6%) |
| Total (Overall) | 85 (48.0%) | 92 (52.0%) |
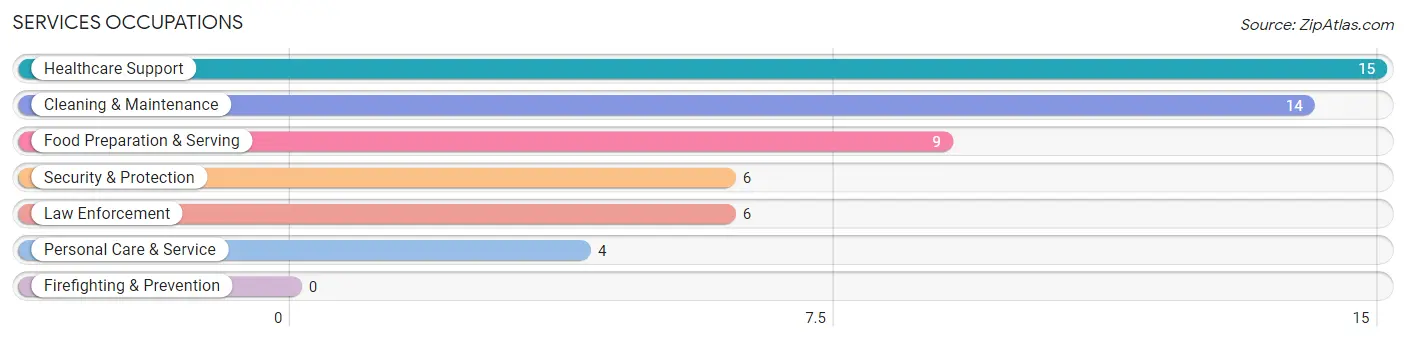
Services Occupations
The most common Services occupations in Rolette are Healthcare Support (15 | 8.5%), Cleaning & Maintenance (14 | 7.9%), Food Preparation & Serving (9 | 5.1%), Security & Protection (6 | 3.4%), and Law Enforcement (6 | 3.4%).
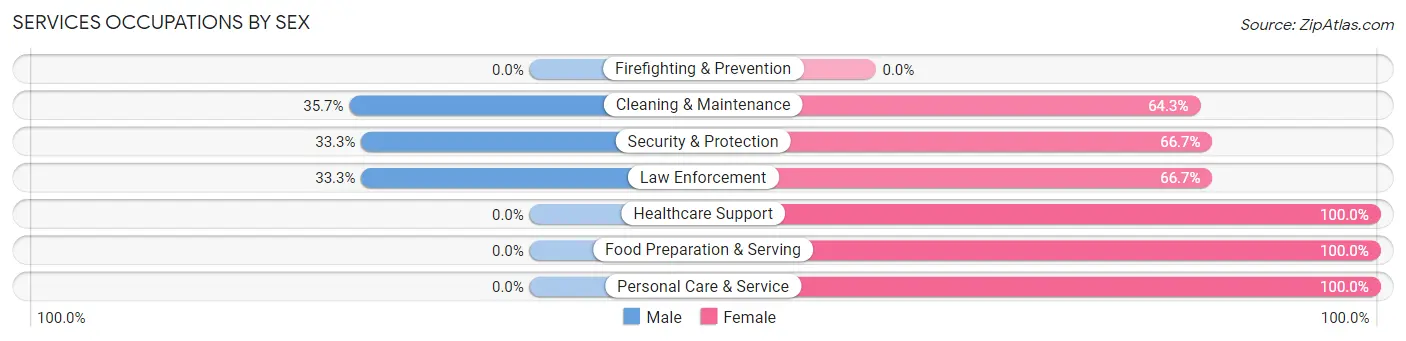
Services Occupations by Sex
Within the Services occupations in Rolette, the most male-oriented occupations are Cleaning & Maintenance (35.7%), Security & Protection (33.3%), and Law Enforcement (33.3%), while the most female-oriented occupations are Healthcare Support (100.0%), Food Preparation & Serving (100.0%), and Personal Care & Service (100.0%).
| Occupation | Male | Female |
| Healthcare Support | 0 (0.0%) | 15 (100.0%) |
| Security & Protection | 2 (33.3%) | 4 (66.7%) |
| Firefighting & Prevention | 0 (0.0%) | 0 (0.0%) |
| Law Enforcement | 2 (33.3%) | 4 (66.7%) |
| Food Preparation & Serving | 0 (0.0%) | 9 (100.0%) |
| Cleaning & Maintenance | 5 (35.7%) | 9 (64.3%) |
| Personal Care & Service | 0 (0.0%) | 4 (100.0%) |
| Total (Category) | 7 (14.6%) | 41 (85.4%) |
| Total (Overall) | 85 (48.0%) | 92 (52.0%) |
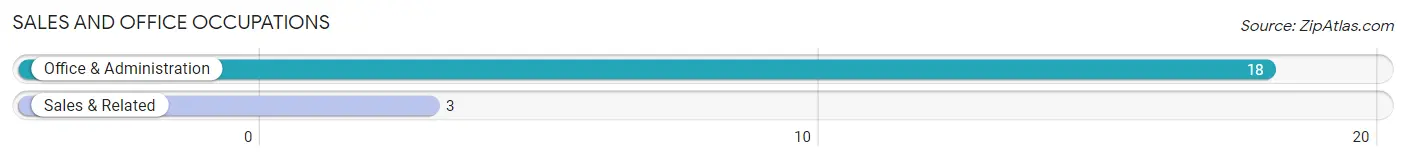
Sales and Office Occupations
The most common Sales and Office occupations in Rolette are Office & Administration (18 | 10.2%), and Sales & Related (3 | 1.7%).
Sales and Office Occupations by Sex
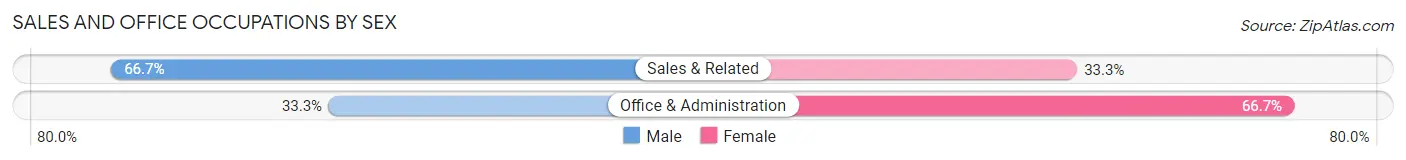
| Occupation | Male | Female |
| Sales & Related | 2 (66.7%) | 1 (33.3%) |
| Office & Administration | 6 (33.3%) | 12 (66.7%) |
| Total (Category) | 8 (38.1%) | 13 (61.9%) |
| Total (Overall) | 85 (48.0%) | 92 (52.0%) |
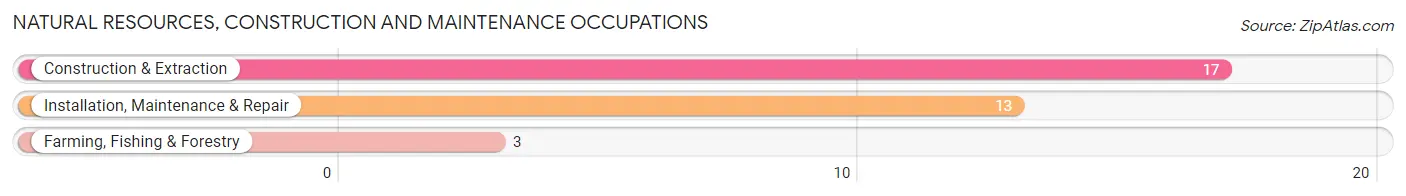
Natural Resources, Construction and Maintenance Occupations
The most common Natural Resources, Construction and Maintenance occupations in Rolette are Construction & Extraction (17 | 9.6%), Installation, Maintenance & Repair (13 | 7.3%), and Farming, Fishing & Forestry (3 | 1.7%).
Natural Resources, Construction and Maintenance Occupations by Sex
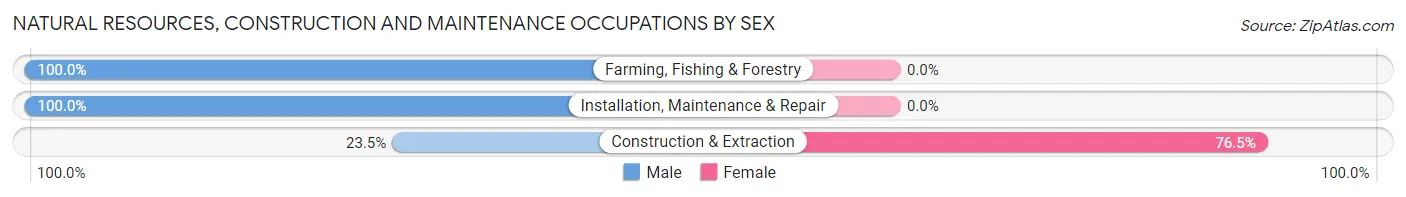
| Occupation | Male | Female |
| Farming, Fishing & Forestry | 3 (100.0%) | 0 (0.0%) |
| Construction & Extraction | 4 (23.5%) | 13 (76.5%) |
| Installation, Maintenance & Repair | 13 (100.0%) | 0 (0.0%) |
| Total (Category) | 20 (60.6%) | 13 (39.4%) |
| Total (Overall) | 85 (48.0%) | 92 (52.0%) |
Production, Transportation and Moving Occupations
The most common Production, Transportation and Moving occupations in Rolette are Transportation (10 | 5.7%), and Material Moving (8 | 4.5%).
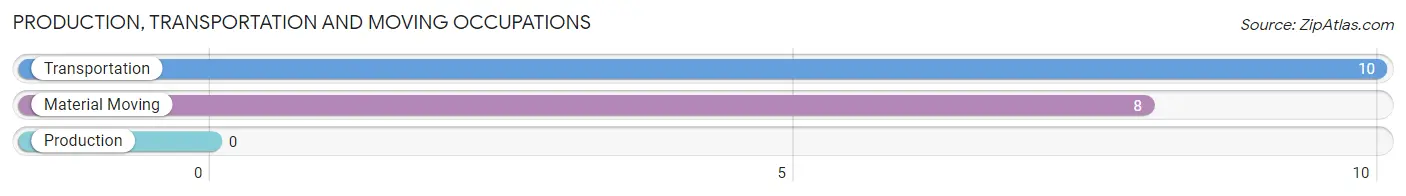
Production, Transportation and Moving Occupations by Sex
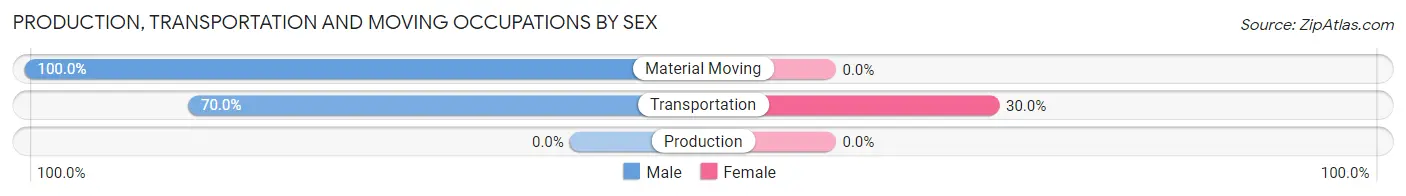
| Occupation | Male | Female |
| Production | 0 (0.0%) | 0 (0.0%) |
| Transportation | 7 (70.0%) | 3 (30.0%) |
| Material Moving | 8 (100.0%) | 0 (0.0%) |
| Total (Category) | 15 (83.3%) | 3 (16.7%) |
| Total (Overall) | 85 (48.0%) | 92 (52.0%) |
Employment Industries by Sex in Rolette
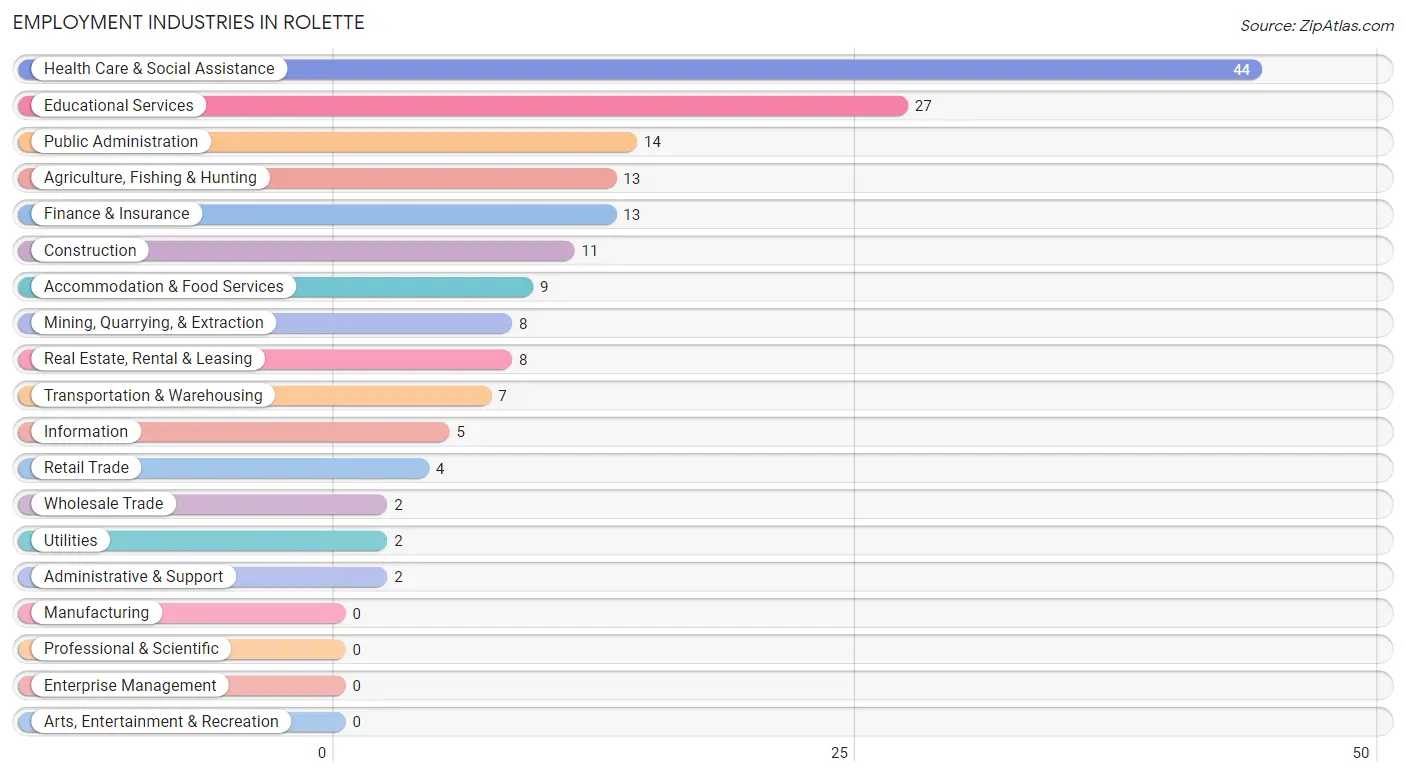
Employment Industries in Rolette
The major employment industries in Rolette include Health Care & Social Assistance (44 | 24.9%), Educational Services (27 | 15.2%), Public Administration (14 | 7.9%), Agriculture, Fishing & Hunting (13 | 7.3%), and Finance & Insurance (13 | 7.3%).
Employment Industries by Sex in Rolette
The Rolette industries that see more men than women are Agriculture, Fishing & Hunting (100.0%), Construction (100.0%), and Wholesale Trade (100.0%), whereas the industries that tend to have a higher number of women are Mining, Quarrying, & Extraction (100.0%), Retail Trade (100.0%), and Information (100.0%).
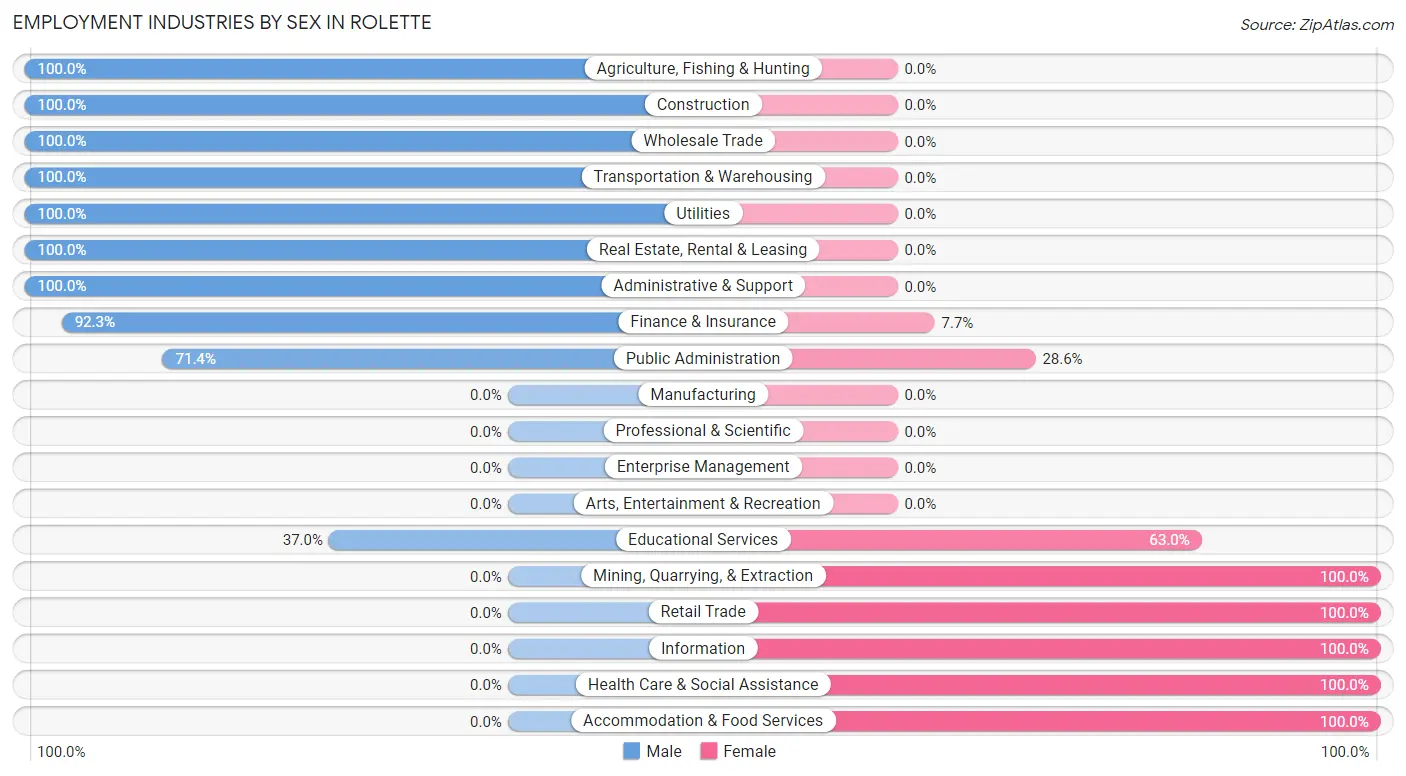
| Industry | Male | Female |
| Agriculture, Fishing & Hunting | 13 (100.0%) | 0 (0.0%) |
| Mining, Quarrying, & Extraction | 0 (0.0%) | 8 (100.0%) |
| Construction | 11 (100.0%) | 0 (0.0%) |
| Manufacturing | 0 (0.0%) | 0 (0.0%) |
| Wholesale Trade | 2 (100.0%) | 0 (0.0%) |
| Retail Trade | 0 (0.0%) | 4 (100.0%) |
| Transportation & Warehousing | 7 (100.0%) | 0 (0.0%) |
| Utilities | 2 (100.0%) | 0 (0.0%) |
| Information | 0 (0.0%) | 5 (100.0%) |
| Finance & Insurance | 12 (92.3%) | 1 (7.7%) |
| Real Estate, Rental & Leasing | 8 (100.0%) | 0 (0.0%) |
| Professional & Scientific | 0 (0.0%) | 0 (0.0%) |
| Enterprise Management | 0 (0.0%) | 0 (0.0%) |
| Administrative & Support | 2 (100.0%) | 0 (0.0%) |
| Educational Services | 10 (37.0%) | 17 (63.0%) |
| Health Care & Social Assistance | 0 (0.0%) | 44 (100.0%) |
| Arts, Entertainment & Recreation | 0 (0.0%) | 0 (0.0%) |
| Accommodation & Food Services | 0 (0.0%) | 9 (100.0%) |
| Public Administration | 10 (71.4%) | 4 (28.6%) |
| Total | 85 (48.0%) | 92 (52.0%) |
Education in Rolette
School Enrollment in Rolette
The most common levels of schooling among the 109 students in Rolette are elementary school (37 | 33.9%), middle school (26 | 23.8%), and high school (16 | 14.7%).
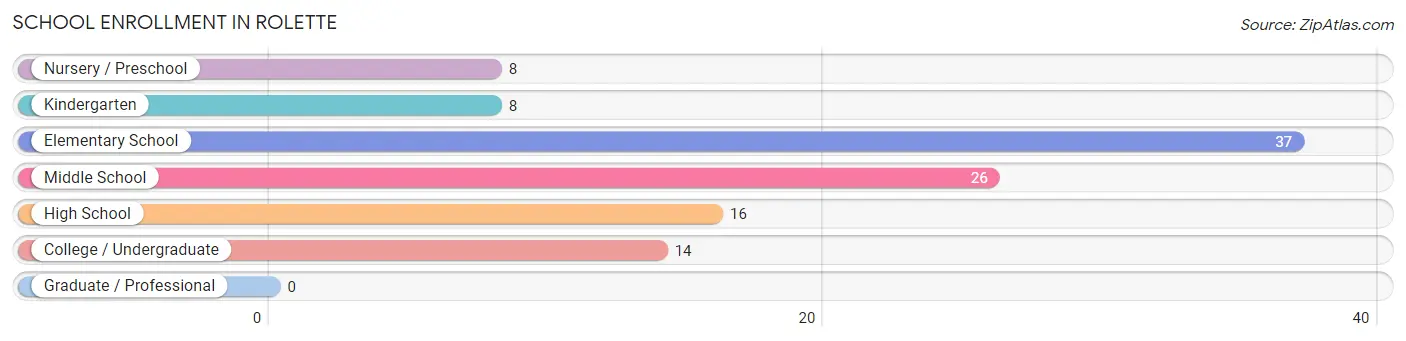
| School Level | # Students | % Students |
| Nursery / Preschool | 8 | 7.3% |
| Kindergarten | 8 | 7.3% |
| Elementary School | 37 | 33.9% |
| Middle School | 26 | 23.8% |
| High School | 16 | 14.7% |
| College / Undergraduate | 14 | 12.8% |
| Graduate / Professional | 0 | 0.0% |
| Total | 109 | 100.0% |
School Enrollment by Age by Funding Source in Rolette
Out of a total of 109 students who are enrolled in schools in Rolette, 13 (11.9%) attend a private institution, while the remaining 96 (88.1%) are enrolled in public schools. The age group of 5 to 9 year old has the highest likelihood of being enrolled in private schools, with 8 (18.6% in the age bracket) enrolled. Conversely, the age group of 3 to 4 year olds has the lowest likelihood of being enrolled in a private school, with 8 (100.0% in the age bracket) attending a public institution.
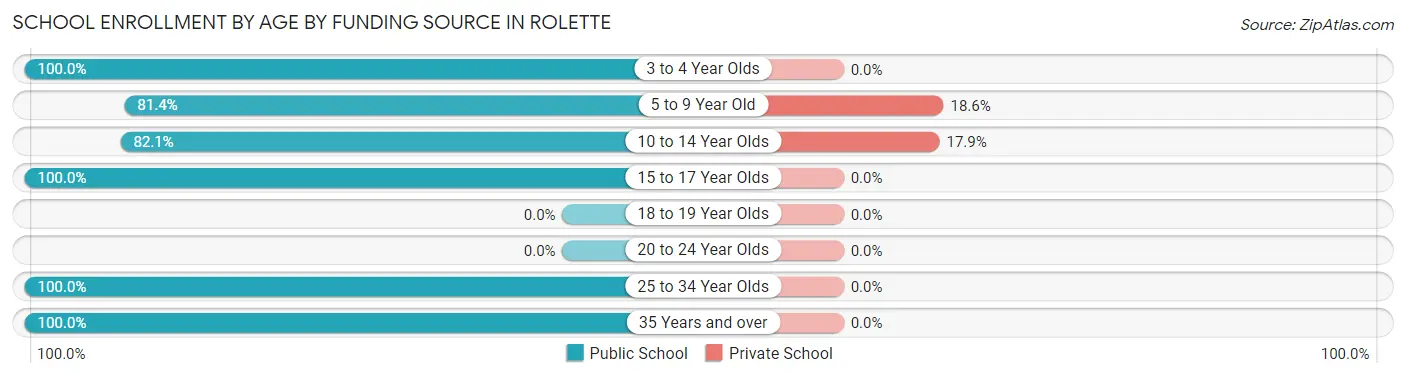
| Age Bracket | Public School | Private School |
| 3 to 4 Year Olds | 8 (100.0%) | 0 (0.0%) |
| 5 to 9 Year Old | 35 (81.4%) | 8 (18.6%) |
| 10 to 14 Year Olds | 23 (82.1%) | 5 (17.9%) |
| 15 to 17 Year Olds | 16 (100.0%) | 0 (0.0%) |
| 18 to 19 Year Olds | 0 (0.0%) | 0 (0.0%) |
| 20 to 24 Year Olds | 0 (0.0%) | 0 (0.0%) |
| 25 to 34 Year Olds | 11 (100.0%) | 0 (0.0%) |
| 35 Years and over | 3 (100.0%) | 0 (0.0%) |
| Total | 96 (88.1%) | 13 (11.9%) |
Educational Attainment by Field of Study in Rolette
Education (33 | 34.7%), liberal arts & history (18 | 19.0%), business (16 | 16.8%), bio, nature & agricultural (7 | 7.4%), and social sciences (5 | 5.3%) are the most common fields of study among 95 individuals in Rolette who have obtained a bachelor's degree or higher.
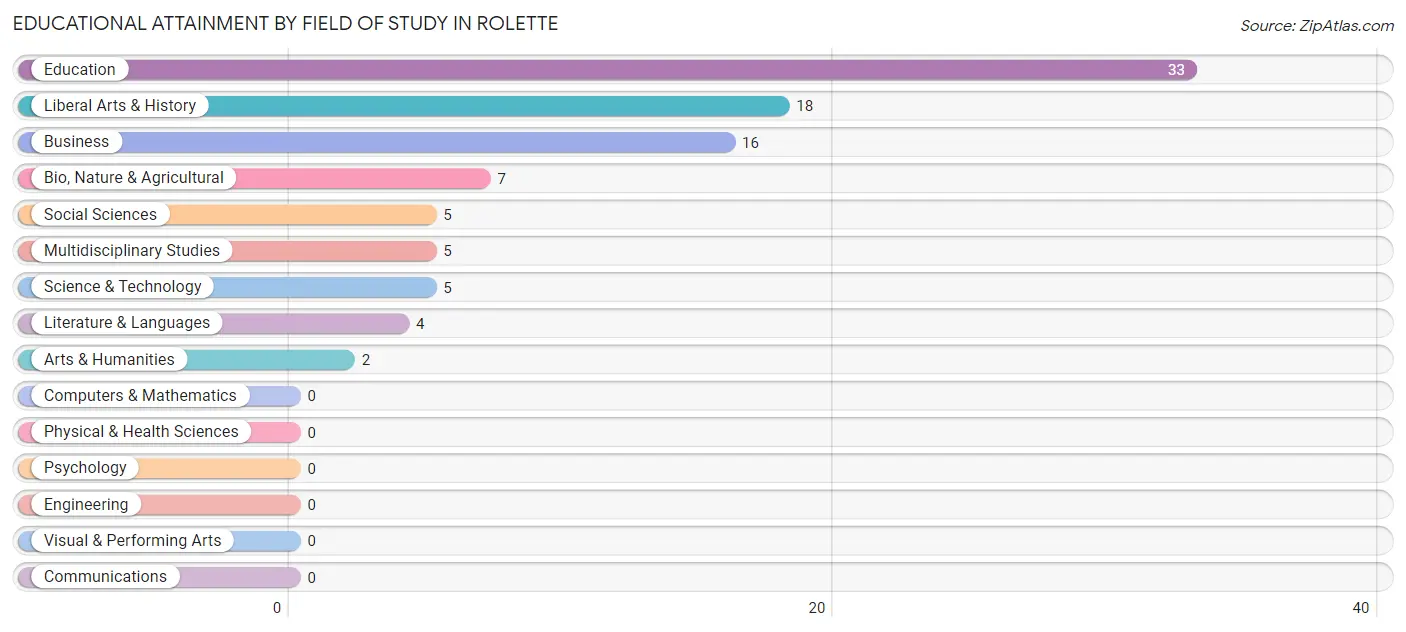
| Field of Study | # Graduates | % Graduates |
| Computers & Mathematics | 0 | 0.0% |
| Bio, Nature & Agricultural | 7 | 7.4% |
| Physical & Health Sciences | 0 | 0.0% |
| Psychology | 0 | 0.0% |
| Social Sciences | 5 | 5.3% |
| Engineering | 0 | 0.0% |
| Multidisciplinary Studies | 5 | 5.3% |
| Science & Technology | 5 | 5.3% |
| Business | 16 | 16.8% |
| Education | 33 | 34.7% |
| Literature & Languages | 4 | 4.2% |
| Liberal Arts & History | 18 | 19.0% |
| Visual & Performing Arts | 0 | 0.0% |
| Communications | 0 | 0.0% |
| Arts & Humanities | 2 | 2.1% |
| Total | 95 | 100.0% |
Transportation & Commute in Rolette
Vehicle Availability by Sex in Rolette
The most prevalent vehicle ownership categories in Rolette are males with 3 vehicles (29, accounting for 34.1%) and females with 3 vehicles (30, making up 31.5%).
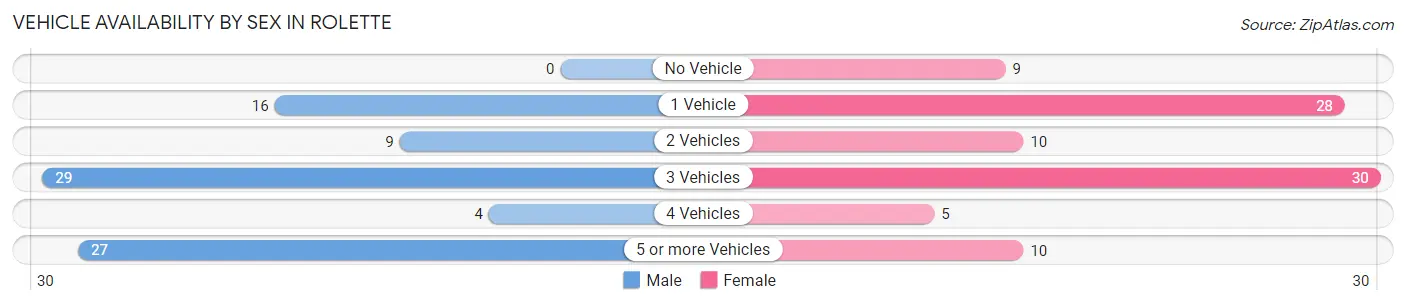
| Vehicles Available | Male | Female |
| No Vehicle | 0 (0.0%) | 9 (9.8%) |
| 1 Vehicle | 16 (18.8%) | 28 (30.4%) |
| 2 Vehicles | 9 (10.6%) | 10 (10.9%) |
| 3 Vehicles | 29 (34.1%) | 30 (32.6%) |
| 4 Vehicles | 4 (4.7%) | 5 (5.4%) |
| 5 or more Vehicles | 27 (31.8%) | 10 (10.9%) |
| Total | 85 (100.0%) | 92 (100.0%) |
Commute Time in Rolette
The most frequently occuring commute durations in Rolette are less than 5 minutes (25 commuters, 15.3%), 10 to 14 minutes (21 commuters, 12.9%), and 30 to 34 minutes (20 commuters, 12.3%).
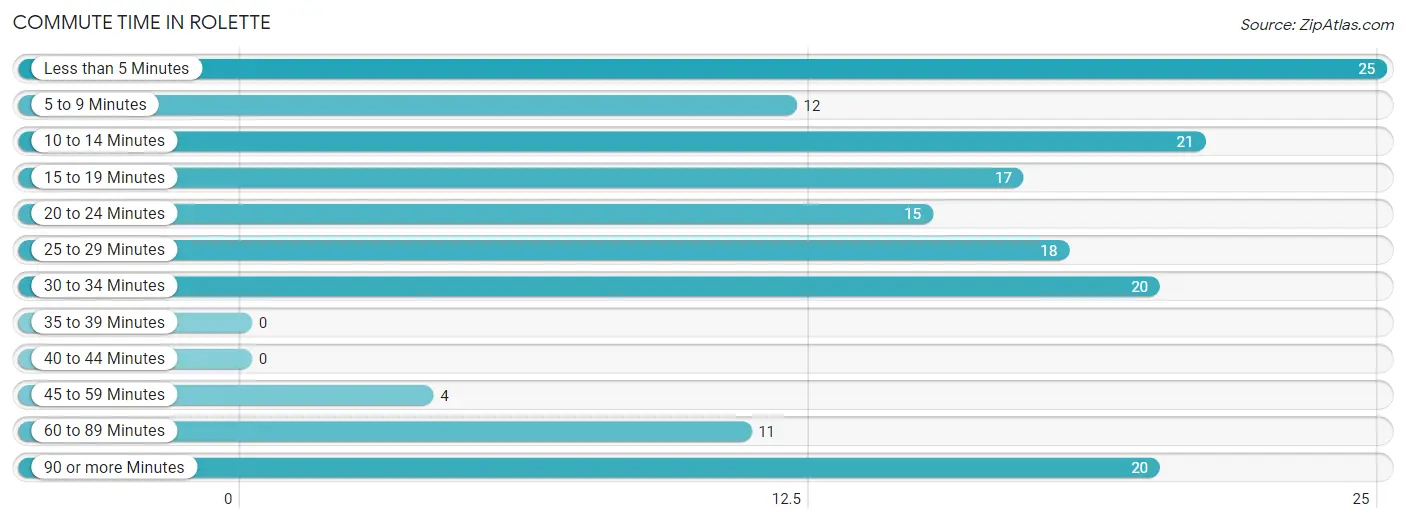
| Commute Time | # Commuters | % Commuters |
| Less than 5 Minutes | 25 | 15.3% |
| 5 to 9 Minutes | 12 | 7.4% |
| 10 to 14 Minutes | 21 | 12.9% |
| 15 to 19 Minutes | 17 | 10.4% |
| 20 to 24 Minutes | 15 | 9.2% |
| 25 to 29 Minutes | 18 | 11.0% |
| 30 to 34 Minutes | 20 | 12.3% |
| 35 to 39 Minutes | 0 | 0.0% |
| 40 to 44 Minutes | 0 | 0.0% |
| 45 to 59 Minutes | 4 | 2.5% |
| 60 to 89 Minutes | 11 | 6.8% |
| 90 or more Minutes | 20 | 12.3% |
Commute Time by Sex in Rolette
The most common commute times in Rolette are 30 to 34 minutes (15 commuters, 19.0%) for males and 10 to 14 minutes (20 commuters, 23.8%) for females.
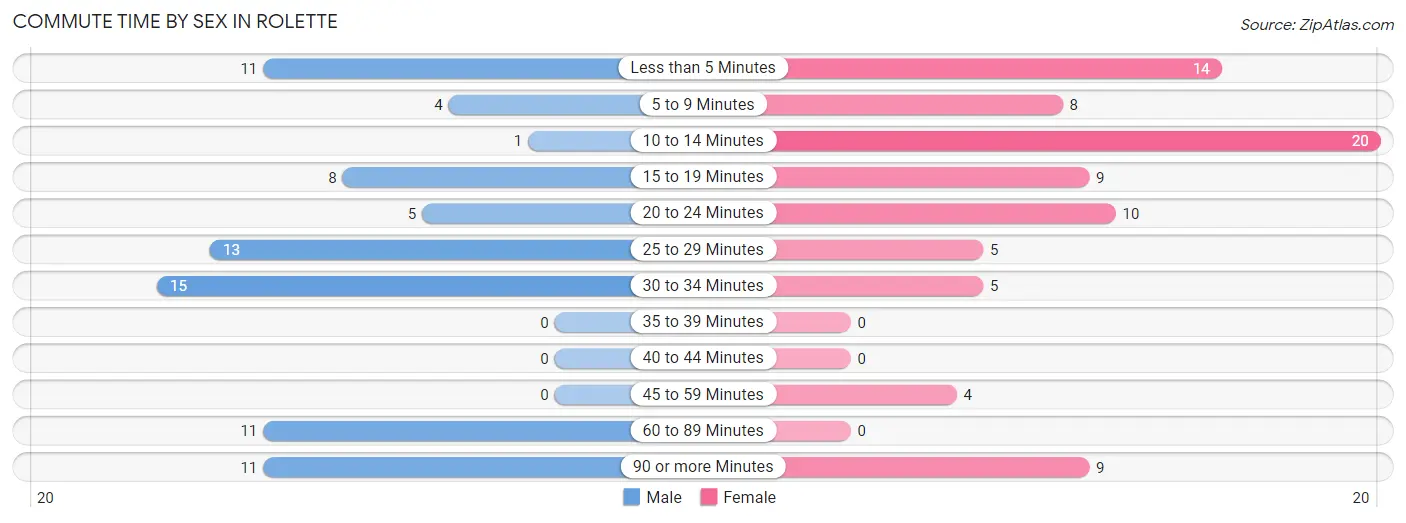
| Commute Time | Male | Female |
| Less than 5 Minutes | 11 (13.9%) | 14 (16.7%) |
| 5 to 9 Minutes | 4 (5.1%) | 8 (9.5%) |
| 10 to 14 Minutes | 1 (1.3%) | 20 (23.8%) |
| 15 to 19 Minutes | 8 (10.1%) | 9 (10.7%) |
| 20 to 24 Minutes | 5 (6.3%) | 10 (11.9%) |
| 25 to 29 Minutes | 13 (16.5%) | 5 (5.9%) |
| 30 to 34 Minutes | 15 (19.0%) | 5 (5.9%) |
| 35 to 39 Minutes | 0 (0.0%) | 0 (0.0%) |
| 40 to 44 Minutes | 0 (0.0%) | 0 (0.0%) |
| 45 to 59 Minutes | 0 (0.0%) | 4 (4.8%) |
| 60 to 89 Minutes | 11 (13.9%) | 0 (0.0%) |
| 90 or more Minutes | 11 (13.9%) | 9 (10.7%) |
Time of Departure to Work by Sex in Rolette
The most frequent times of departure to work in Rolette are 12:00 AM to 4:59 AM (14, 17.7%) for males and 7:30 AM to 7:59 AM (17, 20.2%) for females.
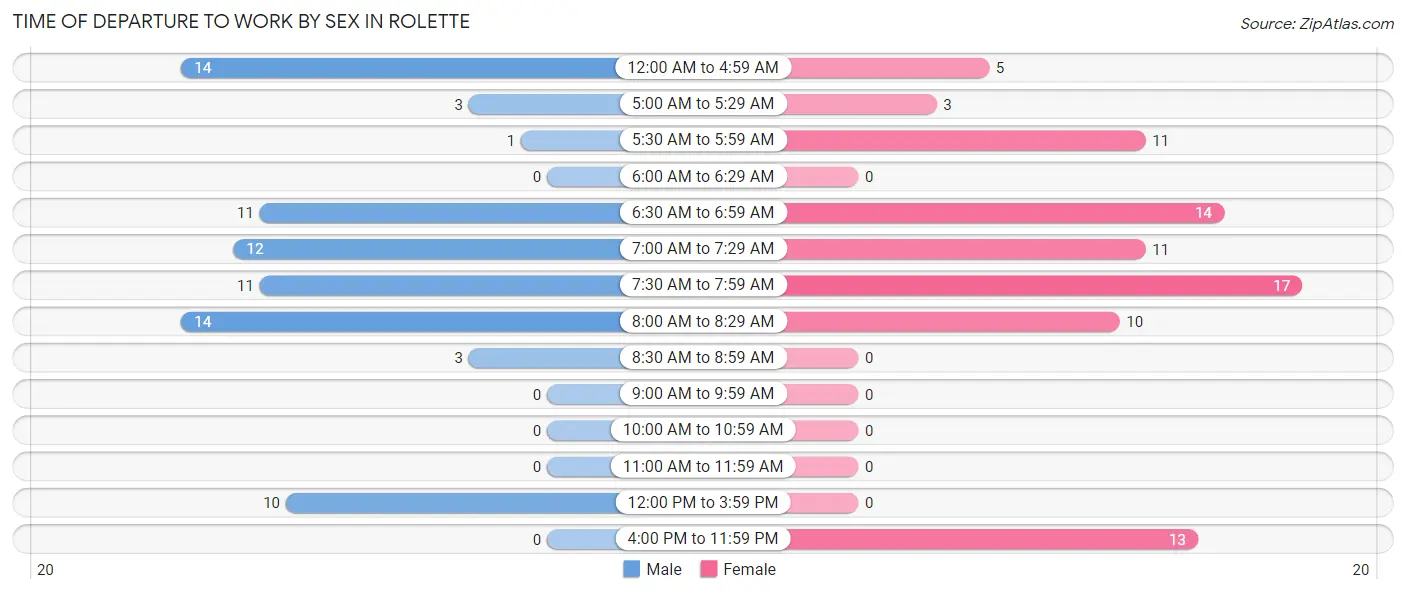
| Time of Departure | Male | Female |
| 12:00 AM to 4:59 AM | 14 (17.7%) | 5 (5.9%) |
| 5:00 AM to 5:29 AM | 3 (3.8%) | 3 (3.6%) |
| 5:30 AM to 5:59 AM | 1 (1.3%) | 11 (13.1%) |
| 6:00 AM to 6:29 AM | 0 (0.0%) | 0 (0.0%) |
| 6:30 AM to 6:59 AM | 11 (13.9%) | 14 (16.7%) |
| 7:00 AM to 7:29 AM | 12 (15.2%) | 11 (13.1%) |
| 7:30 AM to 7:59 AM | 11 (13.9%) | 17 (20.2%) |
| 8:00 AM to 8:29 AM | 14 (17.7%) | 10 (11.9%) |
| 8:30 AM to 8:59 AM | 3 (3.8%) | 0 (0.0%) |
| 9:00 AM to 9:59 AM | 0 (0.0%) | 0 (0.0%) |
| 10:00 AM to 10:59 AM | 0 (0.0%) | 0 (0.0%) |
| 11:00 AM to 11:59 AM | 0 (0.0%) | 0 (0.0%) |
| 12:00 PM to 3:59 PM | 10 (12.7%) | 0 (0.0%) |
| 4:00 PM to 11:59 PM | 0 (0.0%) | 13 (15.5%) |
| Total | 79 (100.0%) | 84 (100.0%) |
Housing Occupancy in Rolette
Occupancy by Ownership in Rolette
Of the total 156 dwellings in Rolette, owner-occupied units account for 89 (57.1%), while renter-occupied units make up 67 (42.9%).
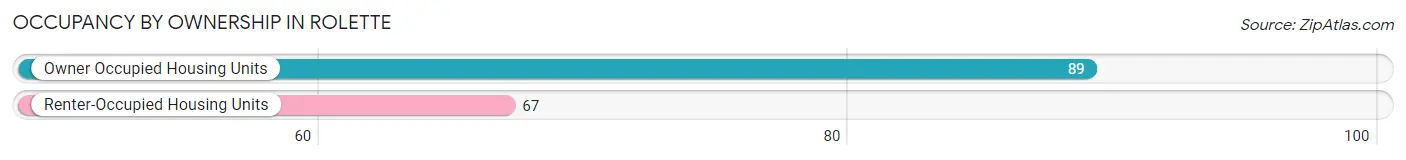
| Occupancy | # Housing Units | % Housing Units |
| Owner Occupied Housing Units | 89 | 57.1% |
| Renter-Occupied Housing Units | 67 | 42.9% |
| Total Occupied Housing Units | 156 | 100.0% |
Occupancy by Household Size in Rolette
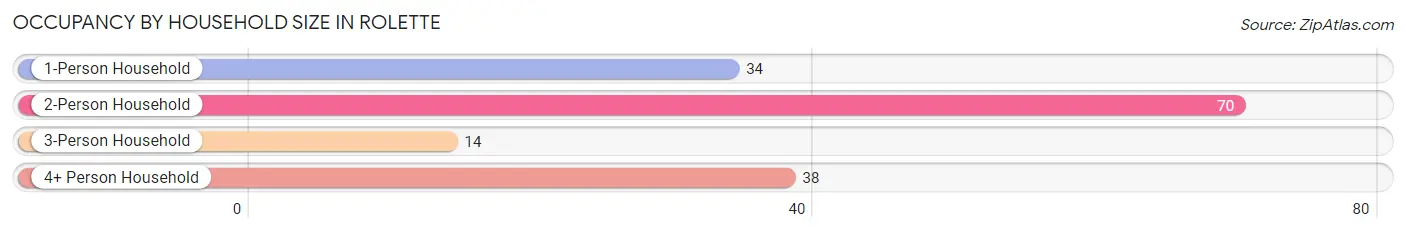
| Household Size | # Housing Units | % Housing Units |
| 1-Person Household | 34 | 21.8% |
| 2-Person Household | 70 | 44.9% |
| 3-Person Household | 14 | 9.0% |
| 4+ Person Household | 38 | 24.4% |
| Total Housing Units | 156 | 100.0% |
Occupancy by Ownership by Household Size in Rolette
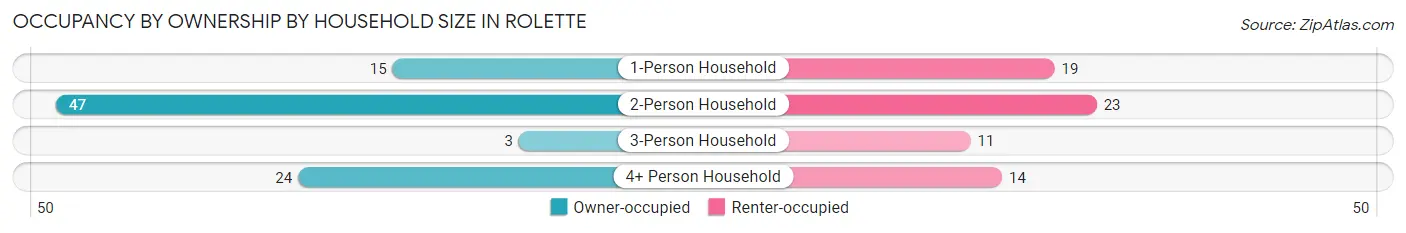
| Household Size | Owner-occupied | Renter-occupied |
| 1-Person Household | 15 (44.1%) | 19 (55.9%) |
| 2-Person Household | 47 (67.1%) | 23 (32.9%) |
| 3-Person Household | 3 (21.4%) | 11 (78.6%) |
| 4+ Person Household | 24 (63.2%) | 14 (36.8%) |
| Total Housing Units | 89 (57.1%) | 67 (42.9%) |
Occupancy by Educational Attainment in Rolette
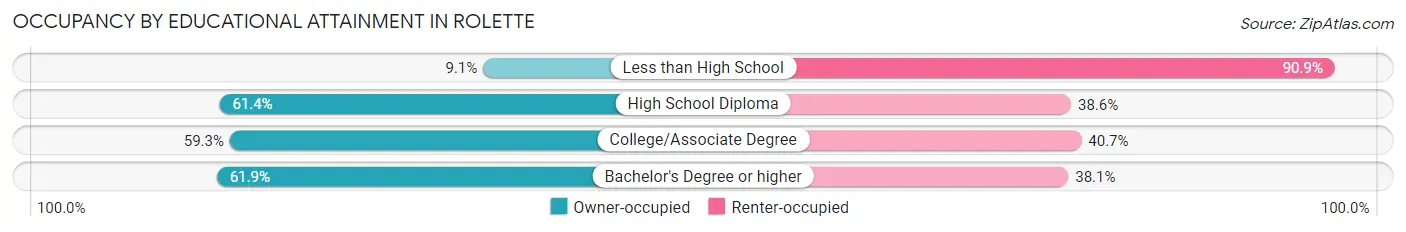
| Household Size | Owner-occupied | Renter-occupied |
| Less than High School | 1 (9.1%) | 10 (90.9%) |
| High School Diploma | 27 (61.4%) | 17 (38.6%) |
| College/Associate Degree | 35 (59.3%) | 24 (40.7%) |
| Bachelor's Degree or higher | 26 (61.9%) | 16 (38.1%) |
Occupancy by Age of Householder in Rolette
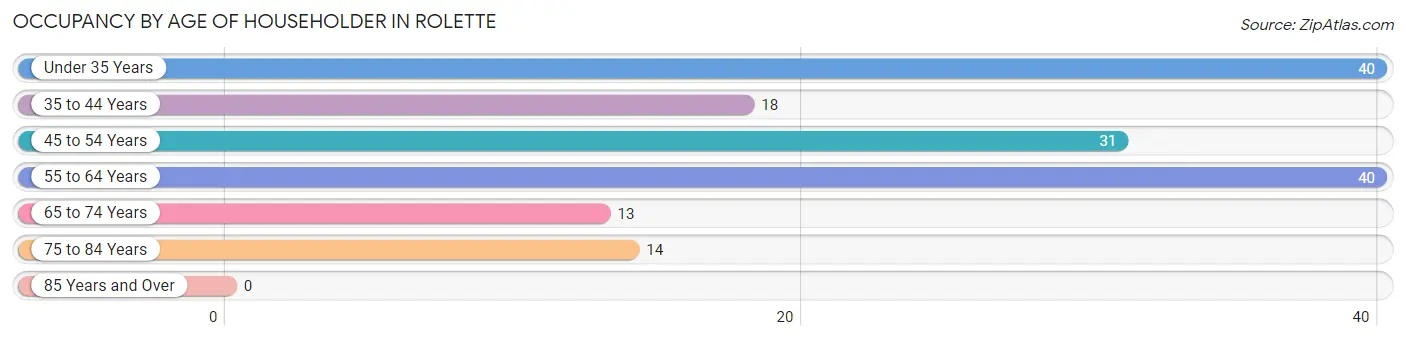
| Age Bracket | # Households | % Households |
| Under 35 Years | 40 | 25.6% |
| 35 to 44 Years | 18 | 11.5% |
| 45 to 54 Years | 31 | 19.9% |
| 55 to 64 Years | 40 | 25.6% |
| 65 to 74 Years | 13 | 8.3% |
| 75 to 84 Years | 14 | 9.0% |
| 85 Years and Over | 0 | 0.0% |
| Total | 156 | 100.0% |
Housing Finances in Rolette
Median Income by Occupancy in Rolette
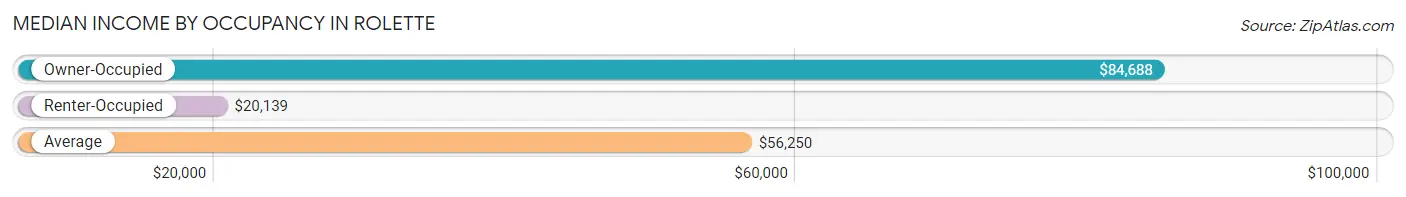
| Occupancy Type | # Households | Median Income |
| Owner-Occupied | 89 (57.1%) | $84,688 |
| Renter-Occupied | 67 (42.9%) | $20,139 |
| Average | 156 (100.0%) | $56,250 |
Occupancy by Householder Income Bracket in Rolette
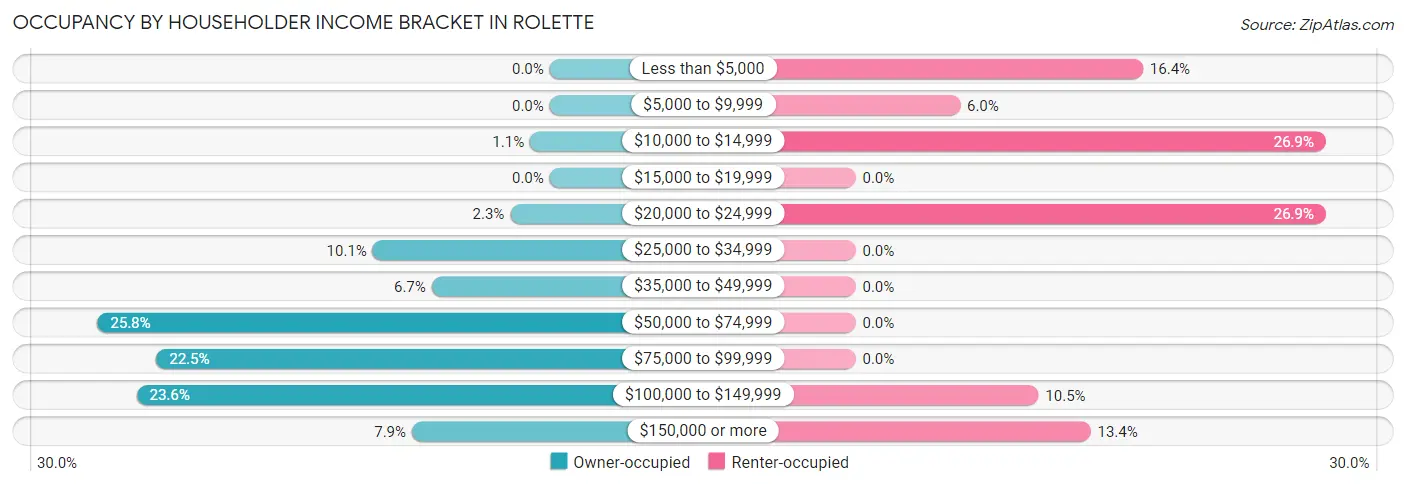
| Income Bracket | Owner-occupied | Renter-occupied |
| Less than $5,000 | 0 (0.0%) | 11 (16.4%) |
| $5,000 to $9,999 | 0 (0.0%) | 4 (6.0%) |
| $10,000 to $14,999 | 1 (1.1%) | 18 (26.9%) |
| $15,000 to $19,999 | 0 (0.0%) | 0 (0.0%) |
| $20,000 to $24,999 | 2 (2.2%) | 18 (26.9%) |
| $25,000 to $34,999 | 9 (10.1%) | 0 (0.0%) |
| $35,000 to $49,999 | 6 (6.7%) | 0 (0.0%) |
| $50,000 to $74,999 | 23 (25.8%) | 0 (0.0%) |
| $75,000 to $99,999 | 20 (22.5%) | 0 (0.0%) |
| $100,000 to $149,999 | 21 (23.6%) | 7 (10.4%) |
| $150,000 or more | 7 (7.9%) | 9 (13.4%) |
| Total | 89 (100.0%) | 67 (100.0%) |
Monthly Housing Cost Tiers in Rolette
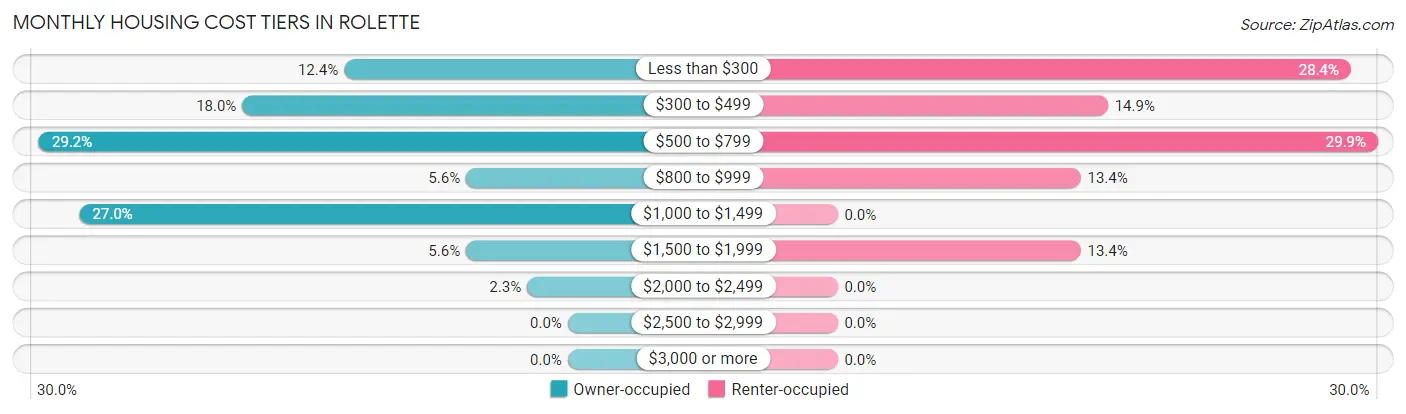
| Monthly Cost | Owner-occupied | Renter-occupied |
| Less than $300 | 11 (12.4%) | 19 (28.4%) |
| $300 to $499 | 16 (18.0%) | 10 (14.9%) |
| $500 to $799 | 26 (29.2%) | 20 (29.8%) |
| $800 to $999 | 5 (5.6%) | 9 (13.4%) |
| $1,000 to $1,499 | 24 (27.0%) | 0 (0.0%) |
| $1,500 to $1,999 | 5 (5.6%) | 9 (13.4%) |
| $2,000 to $2,499 | 2 (2.2%) | 0 (0.0%) |
| $2,500 to $2,999 | 0 (0.0%) | 0 (0.0%) |
| $3,000 or more | 0 (0.0%) | 0 (0.0%) |
| Total | 89 (100.0%) | 67 (100.0%) |
Physical Housing Characteristics in Rolette
Housing Structures in Rolette
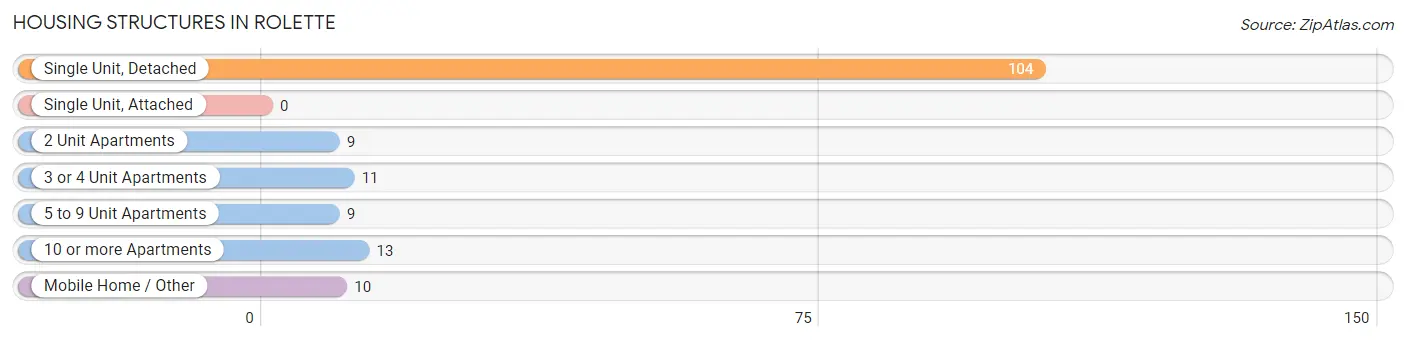
| Structure Type | # Housing Units | % Housing Units |
| Single Unit, Detached | 104 | 66.7% |
| Single Unit, Attached | 0 | 0.0% |
| 2 Unit Apartments | 9 | 5.8% |
| 3 or 4 Unit Apartments | 11 | 7.0% |
| 5 to 9 Unit Apartments | 9 | 5.8% |
| 10 or more Apartments | 13 | 8.3% |
| Mobile Home / Other | 10 | 6.4% |
| Total | 156 | 100.0% |
Housing Structures by Occupancy in Rolette
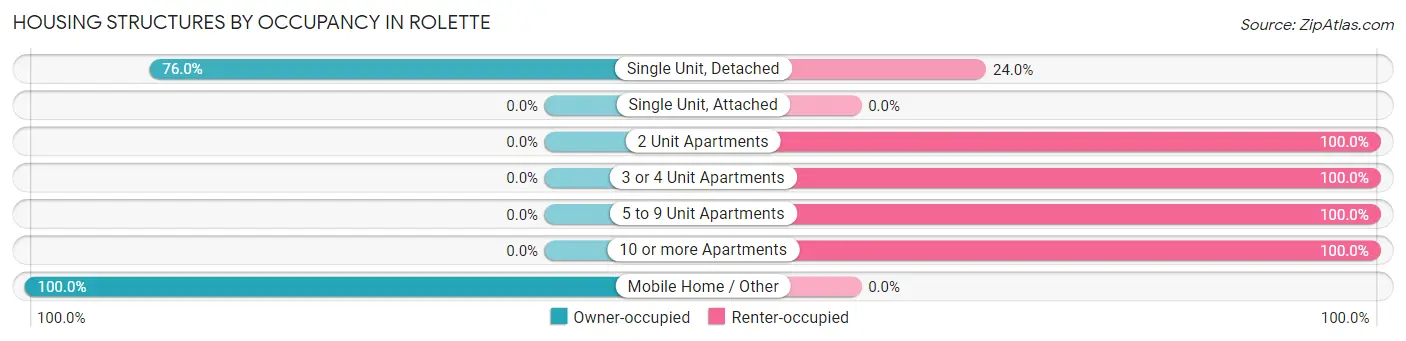
| Structure Type | Owner-occupied | Renter-occupied |
| Single Unit, Detached | 79 (76.0%) | 25 (24.0%) |
| Single Unit, Attached | 0 (0.0%) | 0 (0.0%) |
| 2 Unit Apartments | 0 (0.0%) | 9 (100.0%) |
| 3 or 4 Unit Apartments | 0 (0.0%) | 11 (100.0%) |
| 5 to 9 Unit Apartments | 0 (0.0%) | 9 (100.0%) |
| 10 or more Apartments | 0 (0.0%) | 13 (100.0%) |
| Mobile Home / Other | 10 (100.0%) | 0 (0.0%) |
| Total | 89 (57.1%) | 67 (42.9%) |
Housing Structures by Number of Rooms in Rolette
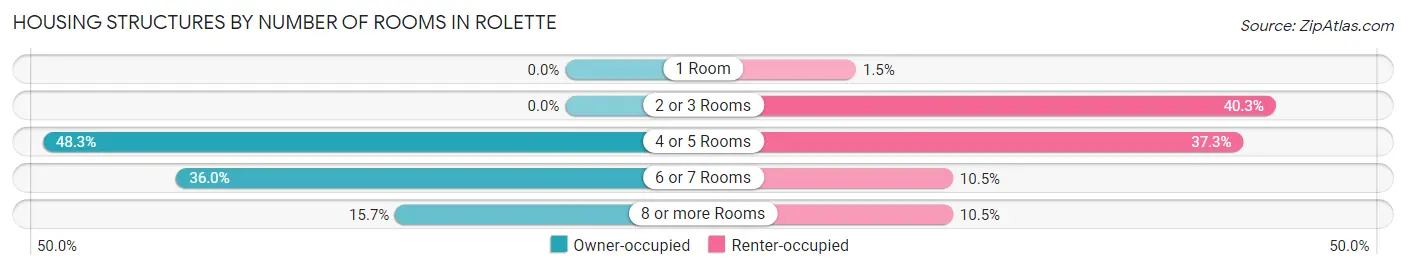
| Number of Rooms | Owner-occupied | Renter-occupied |
| 1 Room | 0 (0.0%) | 1 (1.5%) |
| 2 or 3 Rooms | 0 (0.0%) | 27 (40.3%) |
| 4 or 5 Rooms | 43 (48.3%) | 25 (37.3%) |
| 6 or 7 Rooms | 32 (36.0%) | 7 (10.4%) |
| 8 or more Rooms | 14 (15.7%) | 7 (10.4%) |
| Total | 89 (100.0%) | 67 (100.0%) |
Housing Structure by Heating Type in Rolette
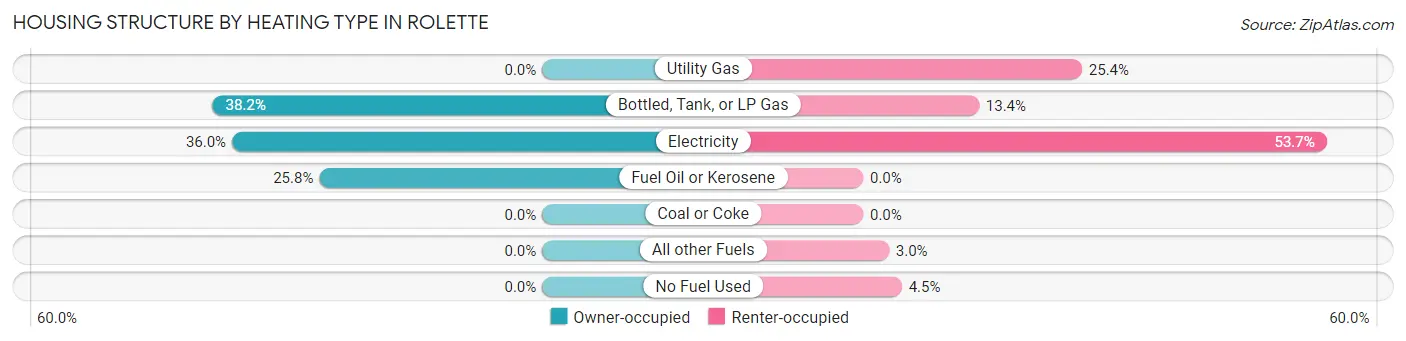
| Heating Type | Owner-occupied | Renter-occupied |
| Utility Gas | 0 (0.0%) | 17 (25.4%) |
| Bottled, Tank, or LP Gas | 34 (38.2%) | 9 (13.4%) |
| Electricity | 32 (36.0%) | 36 (53.7%) |
| Fuel Oil or Kerosene | 23 (25.8%) | 0 (0.0%) |
| Coal or Coke | 0 (0.0%) | 0 (0.0%) |
| All other Fuels | 0 (0.0%) | 2 (3.0%) |
| No Fuel Used | 0 (0.0%) | 3 (4.5%) |
| Total | 89 (100.0%) | 67 (100.0%) |
Household Vehicle Usage in Rolette
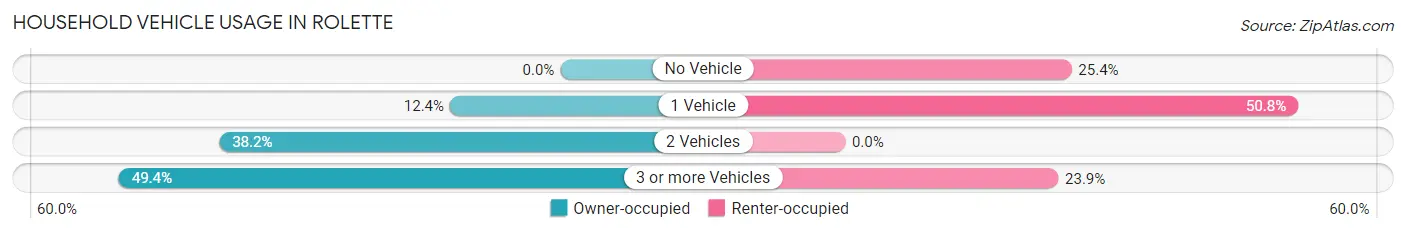
| Vehicles per Household | Owner-occupied | Renter-occupied |
| No Vehicle | 0 (0.0%) | 17 (25.4%) |
| 1 Vehicle | 11 (12.4%) | 34 (50.7%) |
| 2 Vehicles | 34 (38.2%) | 0 (0.0%) |
| 3 or more Vehicles | 44 (49.4%) | 16 (23.9%) |
| Total | 89 (100.0%) | 67 (100.0%) |
Real Estate & Mortgages in Rolette
Real Estate and Mortgage Overview in Rolette
| Characteristic | Without Mortgage | With Mortgage |
| Housing Units | 42 | 47 |
| Median Property Value | $82,000 | $114,600 |
| Median Household Income | $55,000 | $6 |
| Monthly Housing Costs | $450 | $0 |
| Real Estate Taxes | $1,115 | $0 |
Property Value by Mortgage Status in Rolette
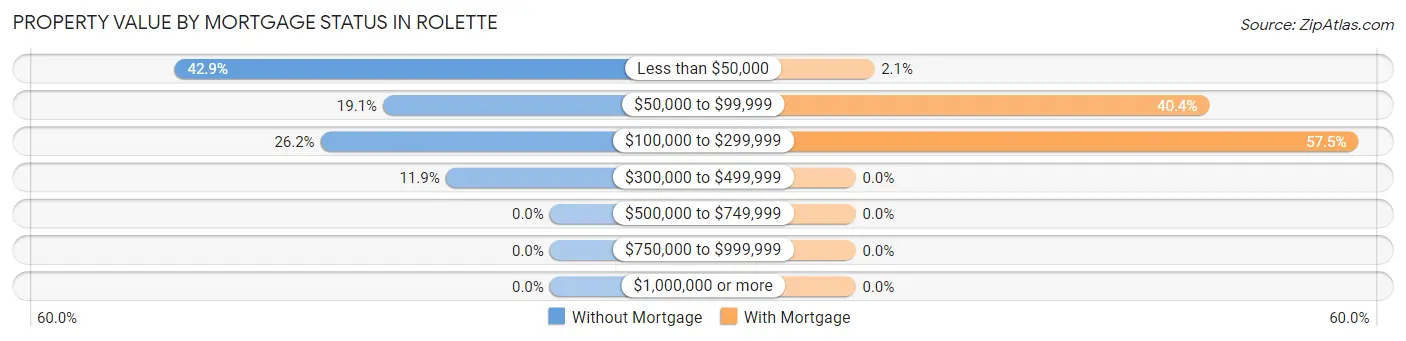
| Property Value | Without Mortgage | With Mortgage |
| Less than $50,000 | 18 (42.9%) | 1 (2.1%) |
| $50,000 to $99,999 | 8 (19.1%) | 19 (40.4%) |
| $100,000 to $299,999 | 11 (26.2%) | 27 (57.5%) |
| $300,000 to $499,999 | 5 (11.9%) | 0 (0.0%) |
| $500,000 to $749,999 | 0 (0.0%) | 0 (0.0%) |
| $750,000 to $999,999 | 0 (0.0%) | 0 (0.0%) |
| $1,000,000 or more | 0 (0.0%) | 0 (0.0%) |
| Total | 42 (100.0%) | 47 (100.0%) |
Household Income by Mortgage Status in Rolette
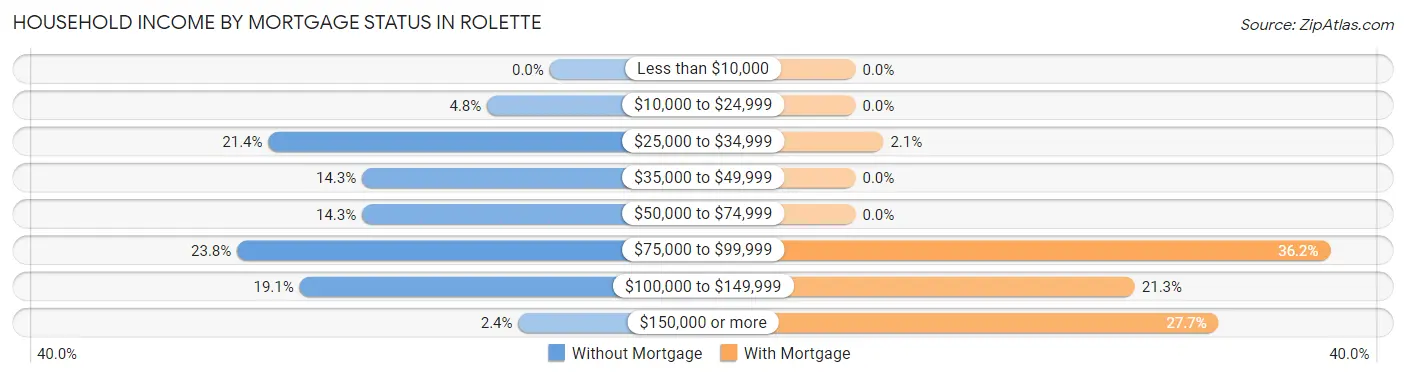
| Household Income | Without Mortgage | With Mortgage |
| Less than $10,000 | 0 (0.0%) | 0 (0.0%) |
| $10,000 to $24,999 | 2 (4.8%) | 0 (0.0%) |
| $25,000 to $34,999 | 9 (21.4%) | 1 (2.1%) |
| $35,000 to $49,999 | 6 (14.3%) | 0 (0.0%) |
| $50,000 to $74,999 | 6 (14.3%) | 0 (0.0%) |
| $75,000 to $99,999 | 10 (23.8%) | 17 (36.2%) |
| $100,000 to $149,999 | 8 (19.1%) | 10 (21.3%) |
| $150,000 or more | 1 (2.4%) | 13 (27.7%) |
| Total | 42 (100.0%) | 47 (100.0%) |
Property Value to Household Income Ratio in Rolette
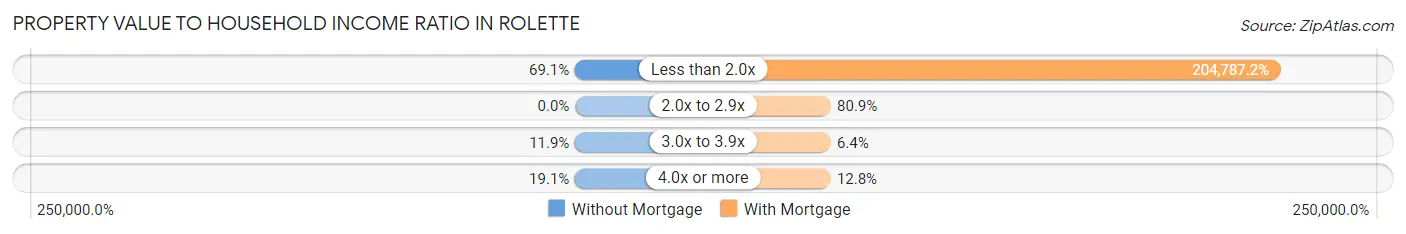
| Value-to-Income Ratio | Without Mortgage | With Mortgage |
| Less than 2.0x | 29 (69.1%) | 96,250 (204,787.2%) |
| 2.0x to 2.9x | 0 (0.0%) | 38 (80.8%) |
| 3.0x to 3.9x | 5 (11.9%) | 3 (6.4%) |
| 4.0x or more | 8 (19.1%) | 6 (12.8%) |
| Total | 42 (100.0%) | 47 (100.0%) |
Real Estate Taxes by Mortgage Status in Rolette
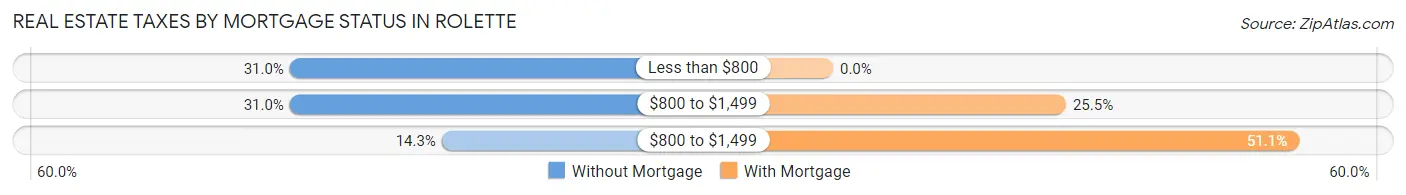
| Property Taxes | Without Mortgage | With Mortgage |
| Less than $800 | 13 (30.9%) | 0 (0.0%) |
| $800 to $1,499 | 13 (30.9%) | 12 (25.5%) |
| $800 to $1,499 | 6 (14.3%) | 24 (51.1%) |
| Total | 42 (100.0%) | 47 (100.0%) |
Health & Disability in Rolette
Health Insurance Coverage by Age in Rolette
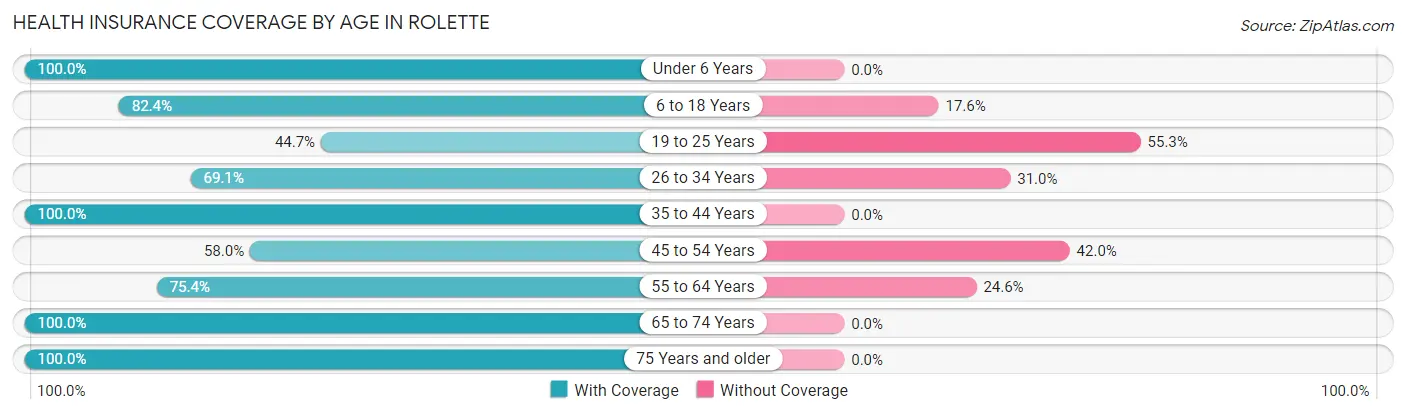
| Age Bracket | With Coverage | Without Coverage |
| Under 6 Years | 50 (100.0%) | 0 (0.0%) |
| 6 to 18 Years | 75 (82.4%) | 16 (17.6%) |
| 19 to 25 Years | 17 (44.7%) | 21 (55.3%) |
| 26 to 34 Years | 29 (69.1%) | 13 (30.9%) |
| 35 to 44 Years | 28 (100.0%) | 0 (0.0%) |
| 45 to 54 Years | 40 (58.0%) | 29 (42.0%) |
| 55 to 64 Years | 52 (75.4%) | 17 (24.6%) |
| 65 to 74 Years | 29 (100.0%) | 0 (0.0%) |
| 75 Years and older | 18 (100.0%) | 0 (0.0%) |
| Total | 338 (77.9%) | 96 (22.1%) |
Health Insurance Coverage by Citizenship Status in Rolette
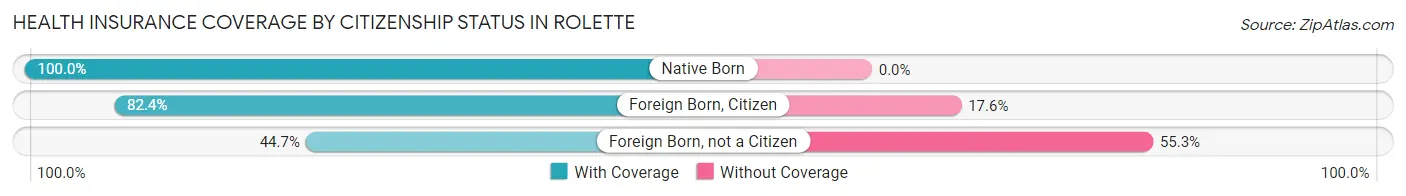
| Citizenship Status | With Coverage | Without Coverage |
| Native Born | 50 (100.0%) | 0 (0.0%) |
| Foreign Born, Citizen | 75 (82.4%) | 16 (17.6%) |
| Foreign Born, not a Citizen | 17 (44.7%) | 21 (55.3%) |
Health Insurance Coverage by Household Income in Rolette
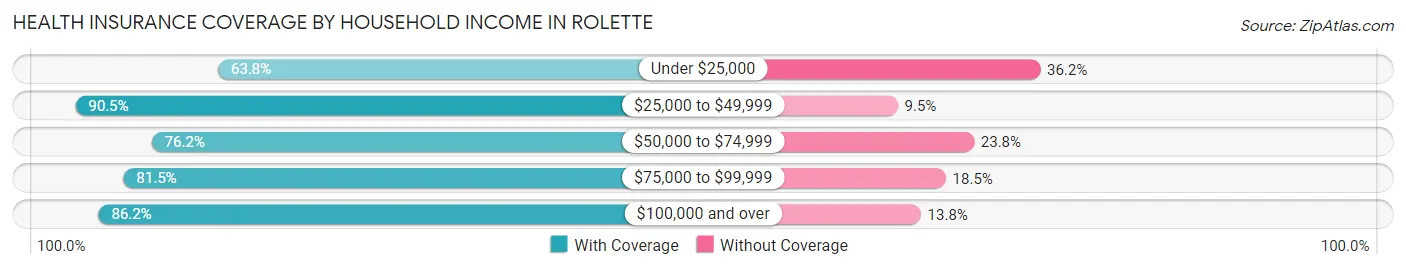
| Household Income | With Coverage | Without Coverage |
| Under $25,000 | 74 (63.8%) | 42 (36.2%) |
| $25,000 to $49,999 | 19 (90.5%) | 2 (9.5%) |
| $50,000 to $74,999 | 64 (76.2%) | 20 (23.8%) |
| $75,000 to $99,999 | 44 (81.5%) | 10 (18.5%) |
| $100,000 and over | 137 (86.2%) | 22 (13.8%) |
Public vs Private Health Insurance Coverage by Age in Rolette
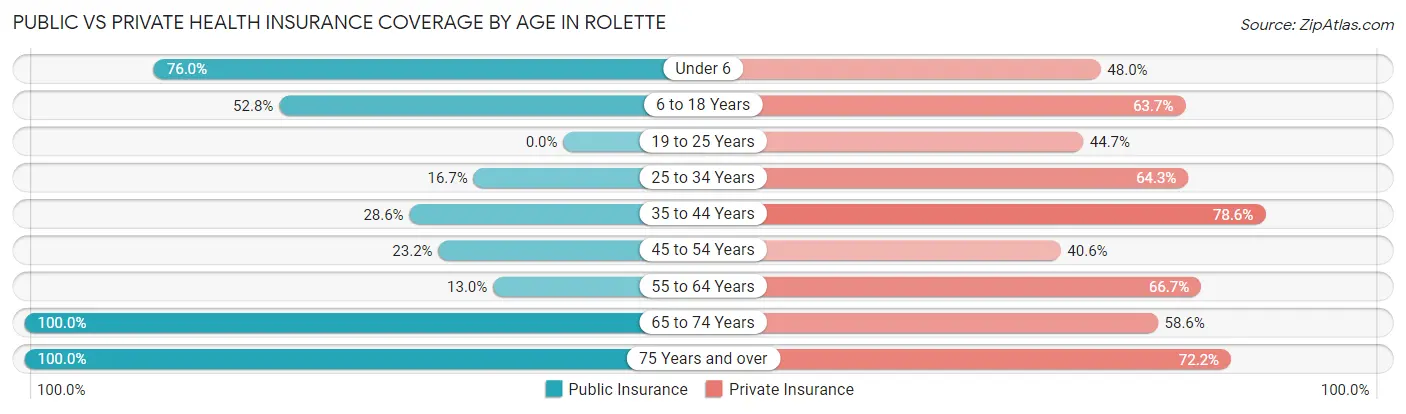
| Age Bracket | Public Insurance | Private Insurance |
| Under 6 | 38 (76.0%) | 24 (48.0%) |
| 6 to 18 Years | 48 (52.7%) | 58 (63.7%) |
| 19 to 25 Years | 0 (0.0%) | 17 (44.7%) |
| 25 to 34 Years | 7 (16.7%) | 27 (64.3%) |
| 35 to 44 Years | 8 (28.6%) | 22 (78.6%) |
| 45 to 54 Years | 16 (23.2%) | 28 (40.6%) |
| 55 to 64 Years | 9 (13.0%) | 46 (66.7%) |
| 65 to 74 Years | 29 (100.0%) | 17 (58.6%) |
| 75 Years and over | 18 (100.0%) | 13 (72.2%) |
| Total | 173 (39.9%) | 252 (58.1%) |
Disability Status by Sex by Age in Rolette
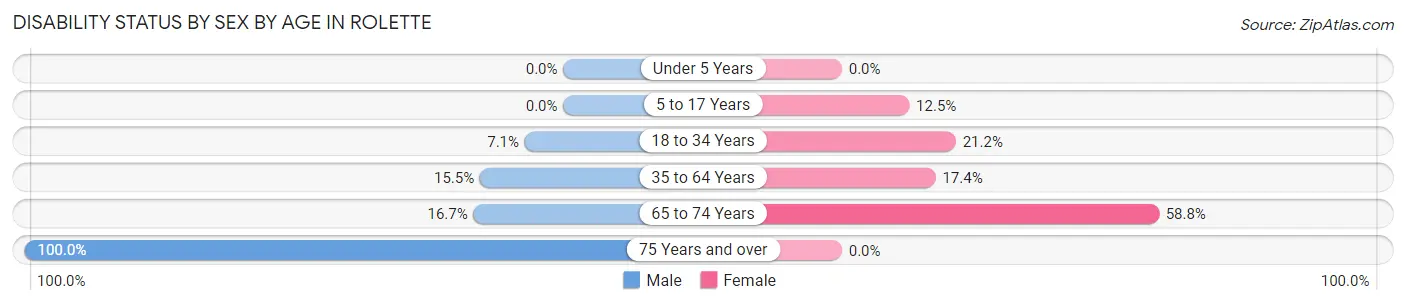
| Age Bracket | Male | Female |
| Under 5 Years | 0 (0.0%) | 0 (0.0%) |
| 5 to 17 Years | 0 (0.0%) | 8 (12.5%) |
| 18 to 34 Years | 2 (7.1%) | 11 (21.1%) |
| 35 to 64 Years | 15 (15.5%) | 12 (17.4%) |
| 65 to 74 Years | 2 (16.7%) | 10 (58.8%) |
| 75 Years and over | 7 (100.0%) | 0 (0.0%) |
Disability Class by Sex by Age in Rolette
Disability Class: Hearing Difficulty
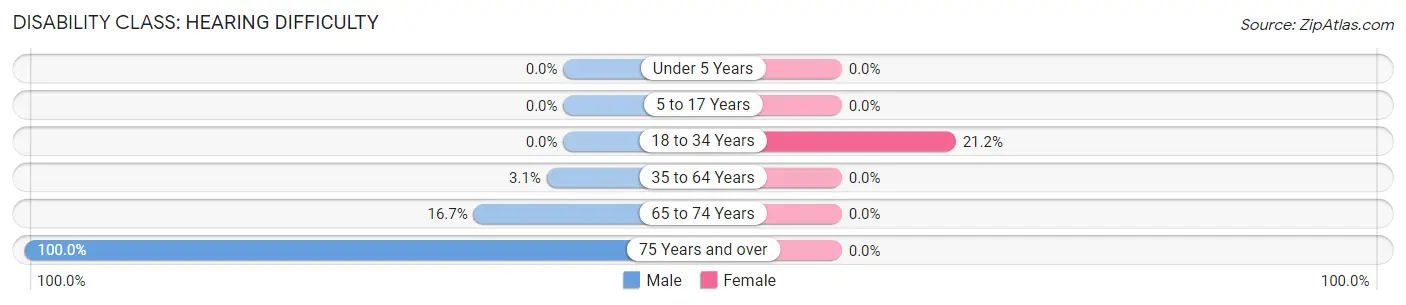
| Age Bracket | Male | Female |
| Under 5 Years | 0 (0.0%) | 0 (0.0%) |
| 5 to 17 Years | 0 (0.0%) | 0 (0.0%) |
| 18 to 34 Years | 0 (0.0%) | 11 (21.1%) |
| 35 to 64 Years | 3 (3.1%) | 0 (0.0%) |
| 65 to 74 Years | 2 (16.7%) | 0 (0.0%) |
| 75 Years and over | 7 (100.0%) | 0 (0.0%) |
Disability Class: Vision Difficulty
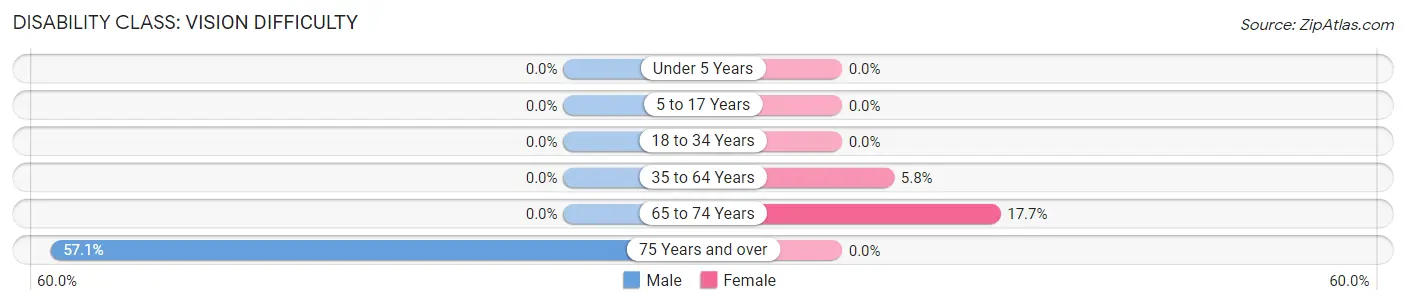
| Age Bracket | Male | Female |
| Under 5 Years | 0 (0.0%) | 0 (0.0%) |
| 5 to 17 Years | 0 (0.0%) | 0 (0.0%) |
| 18 to 34 Years | 0 (0.0%) | 0 (0.0%) |
| 35 to 64 Years | 0 (0.0%) | 4 (5.8%) |
| 65 to 74 Years | 0 (0.0%) | 3 (17.6%) |
| 75 Years and over | 4 (57.1%) | 0 (0.0%) |
Disability Class: Cognitive Difficulty
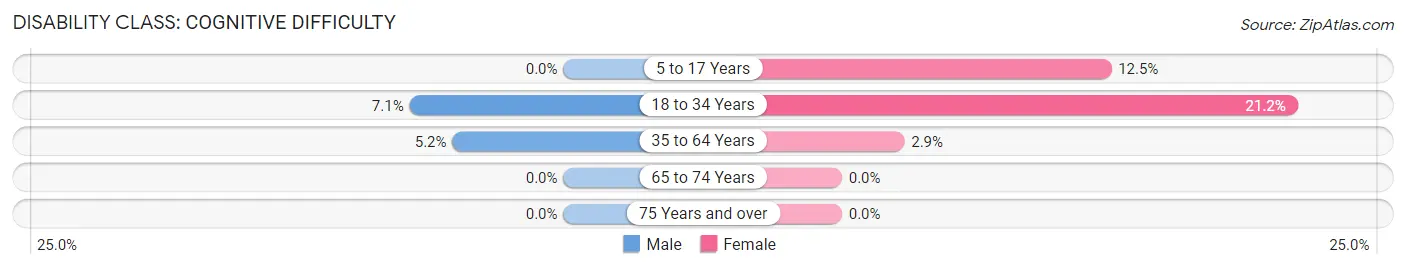
| Age Bracket | Male | Female |
| 5 to 17 Years | 0 (0.0%) | 8 (12.5%) |
| 18 to 34 Years | 2 (7.1%) | 11 (21.1%) |
| 35 to 64 Years | 5 (5.1%) | 2 (2.9%) |
| 65 to 74 Years | 0 (0.0%) | 0 (0.0%) |
| 75 Years and over | 0 (0.0%) | 0 (0.0%) |
Disability Class: Ambulatory Difficulty
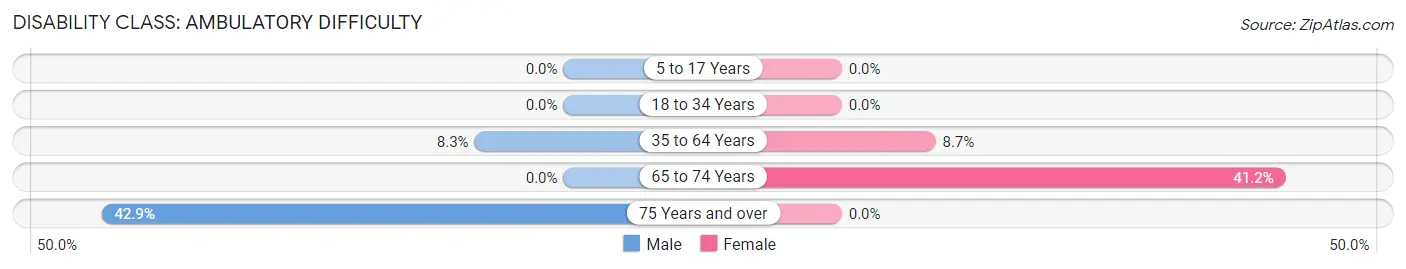
| Age Bracket | Male | Female |
| 5 to 17 Years | 0 (0.0%) | 0 (0.0%) |
| 18 to 34 Years | 0 (0.0%) | 0 (0.0%) |
| 35 to 64 Years | 8 (8.3%) | 6 (8.7%) |
| 65 to 74 Years | 0 (0.0%) | 7 (41.2%) |
| 75 Years and over | 3 (42.9%) | 0 (0.0%) |
Disability Class: Self-Care Difficulty
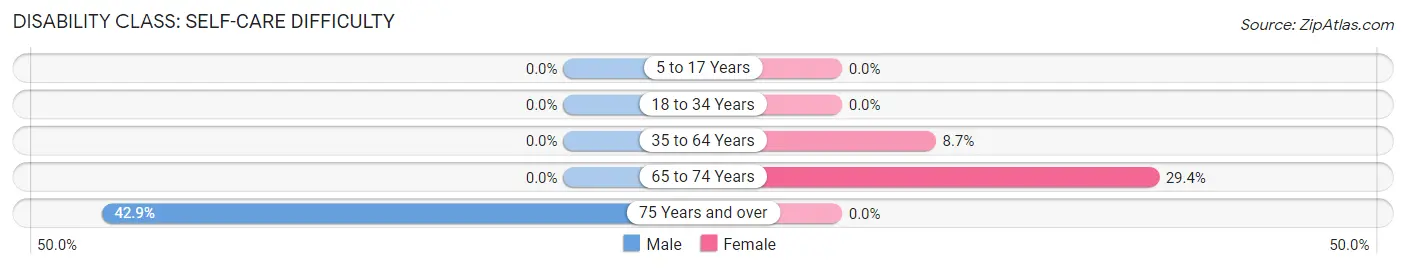
| Age Bracket | Male | Female |
| 5 to 17 Years | 0 (0.0%) | 0 (0.0%) |
| 18 to 34 Years | 0 (0.0%) | 0 (0.0%) |
| 35 to 64 Years | 0 (0.0%) | 6 (8.7%) |
| 65 to 74 Years | 0 (0.0%) | 5 (29.4%) |
| 75 Years and over | 3 (42.9%) | 0 (0.0%) |
Technology Access in Rolette
Computing Device Access in Rolette
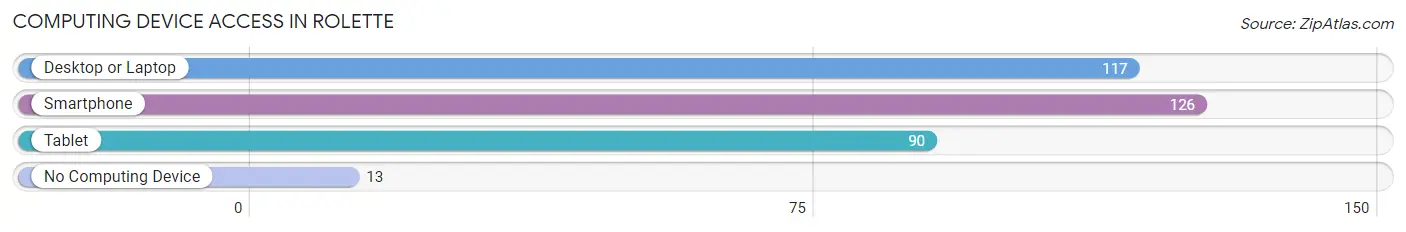
| Device Type | # Households | % Households |
| Desktop or Laptop | 117 | 75.0% |
| Smartphone | 126 | 80.8% |
| Tablet | 90 | 57.7% |
| No Computing Device | 13 | 8.3% |
| Total | 156 | 100.0% |
Internet Access in Rolette
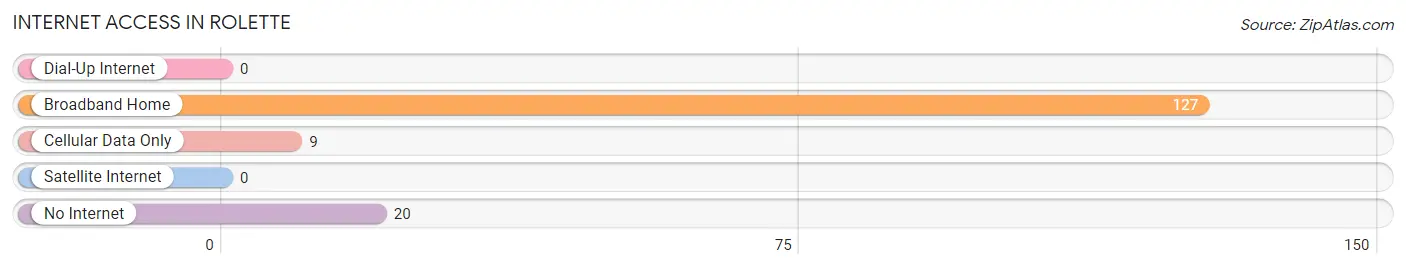
| Internet Type | # Households | % Households |
| Dial-Up Internet | 0 | 0.0% |
| Broadband Home | 127 | 81.4% |
| Cellular Data Only | 9 | 5.8% |
| Satellite Internet | 0 | 0.0% |
| No Internet | 20 | 12.8% |
| Total | 156 | 100.0% |
Rolette Summary
Rolette is a small city located in the northeastern corner of North Dakota, United States. It is the county seat of Rolette County and is situated on the Turtle Mountain Indian Reservation. The city was founded in 1884 and has a population of 1,541 as of the 2010 census.
History
The area that is now Rolette was originally inhabited by the Turtle Mountain Band of Chippewa Indians. The first white settlers arrived in the area in the late 1870s and the city was officially founded in 1884. The city was named after Joseph Rolette, a fur trader and politician who was instrumental in the development of the area.
In the early 1900s, the city experienced a period of growth and development. The Great Northern Railway was built through the city in 1906, connecting it to the rest of the state. This allowed for the development of the city’s economy and the growth of its population.
Geography
Rolette is located in the northeastern corner of North Dakota, in the Turtle Mountain Indian Reservation. It is situated at the intersection of U.S. Route 2 and North Dakota Highway 5. The city is located approximately 40 miles west of the Canadian border and is approximately 100 miles north of the state capital, Bismarck.
The city is situated in a flat, open area of the prairie. The surrounding area is mostly agricultural, with some small patches of forest. The city is located in the Turtle Mountains, a small range of hills that run through the area.
Economy
The economy of Rolette is largely based on agriculture and tourism. The city is home to several small businesses, including a grocery store, a hardware store, and a few restaurants. The city is also home to a number of small manufacturing companies, including a furniture factory and a plastics factory.
The city is also home to a number of tourist attractions, including the Turtle Mountain State Park, the Turtle Mountain Indian Reservation, and the Rolette County Museum. The city is also home to a number of annual events, including the Turtle Mountain Powwow and the Rolette County Fair.
Demographics
As of the 2010 census, the population of Rolette was 1,541. The racial makeup of the city was 94.3% White, 0.7% African American, 2.2% Native American, 0.2% Asian, 0.1% Pacific Islander, 0.7% from other races, and 1.9% from two or more races. Hispanic or Latino of any race were 1.7% of the population.
The median income for a household in the city was $31,250, and the median income for a family was $37,500. The per capita income for the city was $15,945. About 16.2% of families and 19.2% of the population were below the poverty line, including 25.2% of those under age 18 and 11.2% of those age 65 or over.
Rolette is a small city with a rich history and a diverse economy. The city is home to a number of small businesses and tourist attractions, and is a great place to live and work. The city is also home to a diverse population, with a variety of racial and ethnic backgrounds.
Common Questions
What is Per Capita Income in Rolette?
Per Capita income in Rolette is $24,563.
What is the Median Family Income in Rolette?
Median Family Income in Rolette is $65,833.
What is the Median Household income in Rolette?
Median Household Income in Rolette is $56,250.
What is Income or Wage Gap in Rolette?
Income or Wage Gap in Rolette is 36.4%.
Women in Rolette earn 63.6 cents for every dollar earned by a man.
What is Inequality or Gini Index in Rolette?
Inequality or Gini Index in Rolette is 0.45.
What is the Total Population of Rolette?
Total Population of Rolette is 456.
What is the Total Male Population of Rolette?
Total Male Population of Rolette is 210.
What is the Total Female Population of Rolette?
Total Female Population of Rolette is 246.
What is the Ratio of Males per 100 Females in Rolette?
There are 85.37 Males per 100 Females in Rolette.
What is the Ratio of Females per 100 Males in Rolette?
There are 117.14 Females per 100 Males in Rolette.
What is the Median Population Age in Rolette?
Median Population Age in Rolette is 37.1 Years.
What is the Average Family Size in Rolette
Average Family Size in Rolette is 3.3 People.
What is the Average Household Size in Rolette
Average Household Size in Rolette is 2.8 People.
How Large is the Labor Force in Rolette?
There are 177 People in the Labor Forcein in Rolette.
What is the Percentage of People in the Labor Force in Rolette?
53.5% of People are in the Labor Force in Rolette.